1
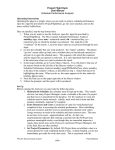
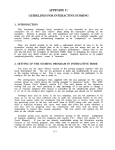
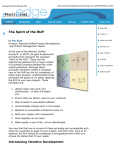
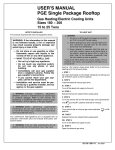
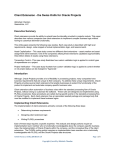
Project Flight Deck
User Manual
Task Performance Analyzer
Operating Instructions
Operating the plug in is simple: when you are ready to analyze schedule and task
performance, open the .mpp file provided by ProjectFlightDeck, go into your schedule,
and run the macro called, TskPerfAna.
Here are detailed, step-by-step instructions:
1. When you are ready to run the Analyzer, open the .mpp file provided by
ProjectFlightDeck. The file is named, Task Performance Analyzer
mmddyy.mpp, where mm = numerical month, dd = numerical day, yy =
numerical year on which the module was released. The .mpp file is the
“container” for the macro. Leave the macro open as you proceed through the next
steps.
2. Go into the schedule that you want analyzed—the “target” schedule. The phrase
“go into” means either go back into a schedule that you had already opened (reactivate it) or open the schedule anew. The sequence with which the container
and the target files are opened is irrelevant. It is only important that both are open
at the same time when you want to produce the report.
3. In the target schedule, go to Tools, Macro, Macros. You will observe that one of
the macros listed on the left side of the Macros window is called,
Task Performance Analyzer mmddyy.mpp!TskPerfAna, where mmddyy is the
date of the module’s release, as described in step 1. Select that macro by
highlighting the name. When you do so, the name appears in the box under the
heading, Macro name.
4. Press the Run key on the upper right side of the Macro window.
5. Follow the prompts, and the report will be produced.
Set Up
Before running the Analyzer you must take the following steps:
1. Maintain the Task: the schedule must be kept up-to-date. This sounds
obvious, but many Project Managers create a schedule at the start of a project
and then leave it untouched for the duration. For the Analyzer to work, the
schedule must be taken seriously. Ideally, track work that is done and that
remains; minimally, maintain % Complete.
2. Enter Resources and Costs: Calculation of value for work planned and
completed is key to assessing the schedule performance. Most scheduling
tools use resources and their costs to automatically calculate such values.
Assign resources to tasks in the schedule and enter resource rates. The rates
do not have to be exact—approximations will do. (In fact, our
experimentation indicates that entering a nominal rate like $50 per hour
produces meaningful results.) Again, these points may seem obvious to
experienced Project Managers, but in the field, they are often omitted.
3. Set Project Parameters: By default, MS Project does not attribute value in a
current period for work completed ahead of time. In plain English, you do not
immediately get credit for work done early. This is consistent with the
“classic” definition of Earned Value because the earned value accrues to the
PFD User Manual Task Analyzer
1
©2008
ProjectFlightDeck
Project Flight Deck
User Manual
Task Performance Analyzer
time period in which the work was planned to be done. You can, however, set
a parameter so that you earn the value early. It is important to note that doing
so conflicts with Task Adherence calculations. So, we do not recommend a
change in the default setting. If you still choose to earn the value early, you
must follow these steps: open the target schedule, select Tools, Options,
Calculation. Check mark the box that says, “Move end of completed parts
after status date back to the status date”. If you complete tasks early, MS
Project will reflect that in the schedule, and you will be credited with the
value of that work in the period of completion. Any remaining work will be
left in the future period in which it was scheduled. If it gets done early, it will
also be moved back into the period when it is completed. The parameter must
be set before you baseline the schedule. If you decide to change the parameter
part-way through the project, MS Project does not go back and recalculate
everything based on the new settings, even if you re-baseline the project. So,
you end up with calculations that represent a mix of settings, leading to
inconsistent results.
4. Set a Baseline: the system needs a basis for measurement, and the baseline
provides it. Again, many Project Managers are reluctant to set a baseline,
perhaps because it represents a visible commitment to dates. To get over the
psychological hurdle, set a preliminary baseline early in the project and then
re-set it later for publication. Modifying the baseline will affect the
Analyzer’s calculations, but you can minimize the impact by baselining
selected tasks, rather than the whole schedule. For instance, it is good practice
to baseline newly added tasks and to re-baseline those where a change in
planned end date is justifiable.
For more information on the theory behind Schedule Performance Analysis, see the
article, “Time Is Up”, available for download at no cost from
www.projectflightdeck.com.
Before running the macro, ensure that the macro security settings in MS Project are
correct. Go to Tools, Macro, Security. If the setting is either Very High or High, you
will be unable to run the macro. So, check mark a lower level of security (Medium or
Low). Medium will prompt you each time you run the macro. With a Low setting, the
macro will simply run. If you need to maintain a high security level, you will have to set
it lower, run the macro, and then restore the higher setting. You will have to make the
change before each macro execution. If you have changed the security setting, you must
log off MS Project and then restart it for the new settings to take effect.
Once the security is settings are done, you can run the macro. With the target schedule
open, select Tools, Macro, Macros. Ensure that the TskPerfAna macro is highlighted.
Press Run.
The plug in first does edit checks to ensure that the planned value and earned value are
available—that means resources have been assigned to tasks, resource rates have been
entered, and a baseline has been set. If the values are not available, processing halts and
PFD User Manual Task Analyzer
2
©2008
ProjectFlightDeck
Project Flight Deck
User Manual
Task Performance Analyzer
an error message is posted. If the preparatory work has been done, the program proceeds,
prompting for the time periods to analyze (months or weeks). Because the weekly time
interval has proven the most common one for projects using the tool, the default period
has been set to Weeks. The plug in then prompts for the “As Of” date. The Analyzer
will report on results up to and including that date. The “As Of” date is normally the date
on which the reporting period ends. The current date is used as the default. The system
detects and prompts for the date format being used in your schedule. Once the two
prompts have been completed, the Analyzer runs. In the upper left line of the screen,
progress messages are displayed.
Note: if the schedule is large and the time period selected is small, the standard version
takes about 1 second per 100 tasks.
The Analyzer automatically opens an Excel file, creates appropriate tabs, and places the
results in them. For comments on how to use the output, see the next section.
Practice
The first step is to review the Schedule Analysis tab. It contains three graphs. The first
shows the Baseline Schedule vs. the Earned Schedule.
2/24/2008
2/10/2008
1/27/2008
1/13/2008
12/30/2007
12/16/2007
12/2/2007
11/18/2007
11/4/2007
10/21/2007
10/7/2007
9/23/2007
9/9/2007
8/26/2007
8/12/2007
35
30
25
20
15
10
5
0
7/29/2007
Cumulative Time
Baseline Schedule vs. Earned Schedule
Figure 1
The Baseline Schedule (in Figure 1, the top line, dark blue, diamond markers) represents
the expected progress on the schedule. The Earned Schedule line (in Figure 1, the bottom
line, hot pink, square markers) represents the actual progress on the schedule. For more
information on the theory behind the graph, see the information available for download
on www.projectflightdeck.com.
Figure 1 shows a gap between the baseline and the actual results. The fact that the actual
is tracking below the baseline indicates that there are problems with the schedule. Had it
PFD User Manual Task Analyzer
3
©2008
ProjectFlightDeck
Project Flight Deck
User Manual
Task Performance Analyzer
been tracking on or above the baseline, that would have indicated that the project was on
or ahead of schedule. The next figure illuminates the situation.
1/29/2008
12/29/2007
11/29/2007
10/29/2007
9/29/2007
8/29/2007
Schedule Performance
Index
1.2
1
0.8
0.6
0.4
0.2
0
0
-2
-4
-6
-8
-10
-12
7/29/2007
Schedule Variance
Schedule Variance(t) and SPI(t)
Figure 2
Figure 2 shows the Schedule Variance (left scale, bottom line, dark blue, diamond
markers) and the Schedule Performance Index (right scale, top line, hot pink, square
markers). The suffix “(t)” indicates that these values are measures using Earned
Schedule analysis, rather than the traditional Earned Value metrics. Again, see the
information for download from www.projectflightdeck.com on the theory behind the
measures.
The Schedule Variance is simply the difference between the baseline and the actual. If
the Schedule Variance is greater than 0, the project is ahead of schedule; if it is equal to
0, the project is on schedule, and if it is less than 0, the project is behind schedule. In
Figure 2, it appears that the project started out well, but now has begun to fall behind
schedule. Moreover, the gap is widening.
The Schedule Performance Index is the ratio between the baseline and the actual. If the
Schedule Performance Index is greater than 1, the project is ahead of schedule; if it is
equal to 1, the project is on schedule, and if it is less than 1, the project is behind
schedule. Be sure you read the blue line versus the left axis and the pink line versus the
right axis. The horizontal lines on the graph are associated with the left axis. You need
to be careful in assessing where the pink is in relation to the values on the right axis, as
there are no lines specifically associated with those values. In Figure 2, it appears that
the project started out well, but the situation is beginning to deteriorate.
PFD User Manual Task Analyzer
4
©2008
ProjectFlightDeck
Project Flight Deck
User Manual
Task Performance Analyzer
The Task Performance Analyzer contains a third graph. This one shows how well the
schedule is adhering to the plan. The idea is like a wheel being in alignment. Perfect
wheel alignment has a value of 1. Wheels cannot be aligned more than perfectly. They
can, however, be aligned less than perfectly. Hence, schedule alignment has a maximum
value of 1 and, frequently, has a value less than one. The more the schedule varies from
perfect alignment, the more risk there is of failure. Here is a chart that illustrates results
from the same schedule used in the previous Figures.
1.2
1
0.8
0.6
0.4
0.2
0
0.8
0.6
0.4
0.2
1/29/2008
12/29/2007
11/29/2007
10/29/2007
9/29/2007
8/29/2007
0
Alignment Adjusted
for Rework
1
7/29/2007
Schedule Alignment
(Perfect Fit=1)
Schedule Alignment and Adjusted Alignment
Figure 3
It is clear that the project has been tracking close to perfect alignment. Within the past
week, however, the alignment has begun to drop off. That is a warning sign to the
Project Manager. The Analyzer provides additional information to help the Project
Manager assess and respond to the problem, as will be shown below. Before proceeding,
a brief comment is due on the Adjusted Alignment line.
Tasks that are done before their planned date are subject to rework. This is an experience
familiar in software development projects, where coding that is done before design is
complete often has to be reworked. The earlier in the project that work is done ahead of
plan, the larger the impact later. The plug in has an algorithm that determines the amount
of rework required for tasks completed ahead of time and adjusts the alignment figures
automatically. That is reflected in the Adjusted Alignment line on the graph.
PFD User Manual Task Analyzer
5
©2008
ProjectFlightDeck
Project Flight Deck
User Manual
Task Performance Analyzer
Finally, the table of numbers sometimes tells the story more precisely than the graphs.
Consider Figure 4.
Figure 4
The numbers show the SPI(t) dropping over the last three weeks. The Schedule
Alignment figure shows a decline in the final week reported. It appears that the schedule
efficiency has been dropping off for several weeks, and now the alignment with the plan
is beginning to deteriorate. Both are warning signs that something is amiss in the
schedule.
The Analyzer assists the Project Manager by highlighting the tasks at risk. The Task
Analysis tab contains a complete listing of the detailed tasks in the project, along with an
analysis of their individual performance. Below, you fill find a sample taken from the
actual results produced by the plug in. A sample is used because the full results cover
too much for display here.
Tasks have been grouped and labeled for illustration purposes—the rest of the data is
lifted directly from the tool.
Here is the sample list of tasks.
PFD User Manual Task Analyzer
6
©2008
ProjectFlightDeck
Project Flight Deck
User Manual
Task Performance Analyzer
Figure 5
Knowing that the graphs of the overall schedule indicate a problem, the Project Manager
can quickly focus on the tasks at risk: those that are ahead (and therefore may require
rework) and those that are behind (and must be caught up). The Reason Code indicates
how each individual task is performing. The numerical values provide insight into the
behaviour of individual tasks. Based on this information, the Project Manager can take
remedial action to bring the schedule back on track.
The groupings provide the Project Manager with information useful for retrospective
analysis (historical tasks and whether they were on time, early, or late), re-planning
(future tasks), and housekeeping (where clean up is required, e.g., if tasks have been
added but not resourced or baselined).
The final tab displays basic project information.
Figure 6
In practice, the graphs and the numerical table act as early warning instruments. They
portray the performance, or lack thereof, on a schedule. Experienced Project Managers
often have an intuitive understanding of how things are going. Quantitative analysis
supplements the intuition and provides hard data that they can use to inform and express
their intuitions.
PFD User Manual Task Analyzer
7
©2008
ProjectFlightDeck
Project Flight Deck
User Manual
Task Performance Analyzer
This is especially true on large projects. The size and complexity of such schedules
makes it difficult to grasp and explain the overall picture. The Task Analyzer assists
Project Managers in identifying problems early, evaluating the specific tasks at risk, and
taking remedial steps to bring the project back on track.
PFD User Manual Task Analyzer
8
©2008
ProjectFlightDeck