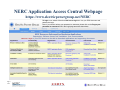
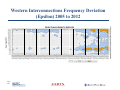
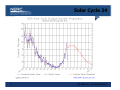
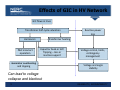
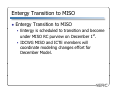
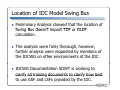
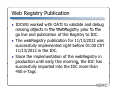
1
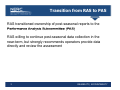
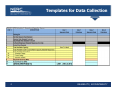
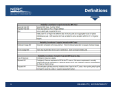
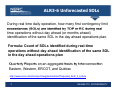
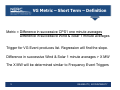
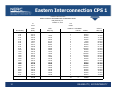
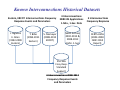
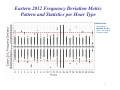
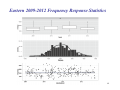
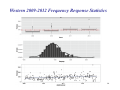
Presentation 1 Review Data Request q for Post 2011/12 / Winter and 2012 Summer Assessments Jessica Bian and Matthew Varghese, NERC ORS Meeting, Meeting November 13-14 13 14, 2012 Agenda • • • • Transition from RAS to PAS p for data collection Templates Instructions Definitions 2 RELIABILITY | ACCOUNTABILITY Transition from RAS to PAS RAS transitioned ownership of post-seasonal reports to the Performance Analysis Subcommittee (PAS) RAS willing to continue post-seasonal data collection in the near-term, but strongly recommends operators provide data directly and review the assessment 3 RELIABILITY | ACCOUNTABILITY Templates for Data Collection 4 RELIABILITY | ACCOUNTABILITY Instructions 5 RELIABILITY | ACCOUNTABILITY Definitions 6 RELIABILITY | ACCOUNTABILITY Presentation 2 Revised Situation Awareness Metrics Jessica Bian and Matthew Varghese, NERC ORS Meeting, g, November 13-14,, 2012 Agenda • ALR3-6 Unforecasted System Operating Limit Violations g y Rating g SOL Exceedances • ALR3-7 Emergency 2 RELIABILITY | ACCOUNTABILITY ALR3-6 Unforecasted SOLs During real time daily operation, how many first contingency limit exceedances (SOLs) are identified by TOP or RC during real time operations without day ahead (or months ahead) identification of the same SOL in the day ahead operations plan. Formula: Count of SOLs identified during real-time operations p without day y ahead identification of the same SOL in the day ahead operations plan Quarterly Q t l Reports R t on an aggregate t basis b i by b Interconnection I t ti Eastern, Western, ERCOT, and Quèbec http://www.nerc.com/docs/pc/rmwg/pas/metrics/Proposed_ALR_3_6.docx 3 RELIABILITY | ACCOUNTABILITY ALR3-7 Emergency SOL Exceedances During real time daily operation, how many first contingency SOL limit exceedances (which exceed 100% of emergency limit) are not acted upon (no mitigation plan orders issued) by the TOP or RC within 35 minutes from the first time the SOL exceeded 100% of the emergency limit. Formula: SOL Emergency_Rating_Exceedance = Number of First Contingency g y SOL Limit Violations (which ( exceed 100% of emergency limit) not acted upon within 35 minutes Quarterly Reports on an aggregate basis by Interconnection Eastern, Western, ERCOT, and Quèbec http://www.nerc.com/docs/pc/rmwg/pas/metrics/Proposed_ALR_3_7.docx 4 RELIABILITY | ACCOUNTABILITY Presentation 3 Metric Proposals p to Measure Reliabilityy Impact p of Variable Generation Integration Jessica Bian and Matthew Varghese, NERC ORS Meeting, Meeting November 13-14 13 14, 2012 Agenda • • • • • • • The Need for a VG Metric Long Term Load following VG Metric Load Following VG Metric Definition & Calculation Short Term vs. Long g Term metrics Short Term Regulation VG Metric Regulation VG Metric Definition & Calculation Background Information • CPS1 Definition • CPS1 D Data t ffor EI 2 RELIABILITY | ACCOUNTABILITY The need for a VG Metric VG Metrics measure the supply-demand imbalance due to VG VG Metrics quantify change in operating reserves due to VG VG Metrics development recommended by IVGTF Task 1-4 http://www.nerc.com/docs/pc/ivgtf/IVGTF p p g _Task_1_4_Final.pdf p 3 RELIABILITY | ACCOUNTABILITY VG Metric – Long Term – Definition Metric = Difference in Load following for 10 years Difference in Wind and Solar for 10 years 4 RELIABILITY | ACCOUNTABILITY 2006-2010 & 2010-2020 Pilot Trend 5 RELIABILITY | ACCOUNTABILITY 2006-2010 & 2010-2020 Tables 6 RELIABILITY | ACCOUNTABILITY VG Metric – Long Term vs. Short Term • Long Term Metric does not reflect time trends of wind • Regulation (5 min ) is preferred to Load Following (1 hr) • RS recommended that CPS1 reflects Regulation well • CPS1 can change g because of several factors • Capture change in CPS1 only for a change in wind or solar • Threshold for change similar to Frequency Event thresholds • These “events” will be similar to Frequency Response • Linear regression will calculate the VG metric as the slope 7 RELIABILITY | ACCOUNTABILITY Regulation is reflected in CPS1 http://www.caiso.com/Documents/Integration‐RenewableResourcesReport.pdf PDF Page 87 of 231 8 RELIABILITY | ACCOUNTABILITY VG Metric – Short Term – Definition Metric = Difference in successive CPS1 one minute averages Difference in successive Wind & Solar 1 minute averages Trigger for VG Event produces list. Regression will find the slope. Difference in successive Wind & Solar 1 minute averages > X MW The X MW will be determined similar to Frequency Event Triggers 9 RELIABILITY | ACCOUNTABILITY 10 RELIABILITY | ACCOUNTABILITY CPS1 Definition Definition of CPS1 (Control Performance Standard 1) The CPS1 equation can be simplified as follows: CPS1 (i CPS1 (in percent) = 100* [2 – t) 100* [2 (Constant)* (Frequency Error)*(ACE)] (C t t)* (F E )*(ACE)] The Scheduled Frequency is 60 Hz ‐ except for ATEC (Time Error Correction) The largest CPS1 achievable is 200 percent. This occurs whenever ACE or Frequency Error is zero. The size of the Constant is equal to ‐10 * B / ε2 B is the Balancing Authority Bias g y Special Case: When a single Balancing Authority is an Interconnection ACE will always be “in phase” with Frequency Error The Bias terms will cancel out The Bias terms will cancel out CPS1 is a function of (Frequency Error) 2 and ε2 Adapted from RS document http://www.nerc.com/docs/oc/rs/NERC%20Balancing%20and%20Frequency%20Control%20040520111.pdf 11 RELIABILITY | ACCOUNTABILITY Eastern Interconnection CPS 1 e1 0.018 Hour Ending CPS1 Hourly CPS1 Daily Avg 1:00 2:00 3:00 4:00 5:00 6:00 7:00 8:00 9:00 10:00 11:00 12:00 13:00 14:00 15:00 16:00 17:00 18 00 18:00 19:00 20:00 21:00 22:00 23:00 0:00 115.13 122.73 143.22 126.09 -18.35 50.77 124.57 145.86 151.71 126.69 145 35 145.35 164.14 163.50 117.94 142.91 122.72 118.84 151 09 151.09 165.37 149.39 145.24 129.86 135.07 109.98 118.93 127.03 126.79 97.76 89.93 94.88 101.25 106.86 108.84 112 16 112.16 116.49 120.11 119.95 121.48 121.56 121.40 123 05 123.05 125.28 126.48 127.38 127.49 127.82 127.08 127.08 12 Eastern Interconnection NERC CONTROL PERFORMANCE STANDARD SURVEY Daily Summary for October 31, 2012 e10 0.0057 Violations Unavailable Periods 2 1 1 3 6 4 3 2 0 3 1 0 0 3 3 2 2 1 0 0 1 1 1 2 42 CPS2% 66.67% 83.33% 83.33% 50.00% 0.00% 33.33% 50.00% 66.67% 100.00% 50.00% 83 33% 83.33% 100.00% 100.00% 50.00% 50.00% 66.67% 66.67% 83 33% 83.33% 100.00% 100.00% 83.33% 83.33% 83.33% 66.67% 0 CPS2 % Daily Avg 75.00% 77.78% 70.83% 56.67% 52.78% 52.38% 54.17% 59.26% 58.33% 60 61% 60.61% 63.89% 66.67% 65.48% 64.44% 64.58% 64.71% 65 74% 65.74% 67.54% 69.17% 69.84% 70.45% 71.01% 70.83% 70.83% RELIABILITY | ACCOUNTABILITY Presentation 4 Consortium for Electric Reliability Technology Solutions NERC Applications Status Update p NERC Applications Status For Operating Reliability Subcommittee Little Rock, AR November 13-14, 2012 Gil Tam Agenda • NERC Application Status Summary NERC Application Status Summary – The IA, RA, and ARR applications were unavailable from 10/29 – / 11/4 due to damage to Verizon’s cable as result of / g Hurricane Sandy • Inadvertent Data Entry Website Implementation y p • NERC Application Access Central Webpage • IIntelligent Alarms and Epsilon Summary and t lli t Al d E il S d Trends Page 1 11.12 NERC Applications Status Summary Application Resource Adequacy ( (ACE Frequency) ) NERC Applications Status and Authorized Users (Many companies have several authorized users) Release 7.0 – Current Production version – 170 authorized users. Release 3.5 – Current Production version – 272 authorized users Inadvertent New website design to resolve existing application interface with Window 7 is near completion. EPG and NERC are working to install and test website and target for completion by November. (details on following slide) Area Interchange Error (AIE) Release 1.0 – Current production version – 122 authorized users Intelligent Alarms Release 1.0 – Current production version – 138 authorized users Frequency Monitoring and Analysis (FMA) Release 2.5 – Current production version – 118 authorized users Automated Reliability Release 1.0 – Current production version – 63 authorized users M hl Monthly reports through October 2012 and Seasonal reports through Summer 2012 have been h h O b 2012 d S l h hS 2012 h b Reports (ARR) posted in ARR website. (ARR website access details on following slide) Page 2 11.12 New Inadvertent D t E t W b it I l Data Entry Website Implementation t ti Page 3 11.12 • EPG has completed software design and sent software to NERC for EPG has completed software design and sent software to NERC for implementation ― NERC IT staff is installing software ― Testing is in progress ― Target is to complete and deploy in late November 2012 ― EPG will send notices and user instructions to all authorized users • NERC Will Provide Hosting Services NERC Will P id H i S i ― Web Address ― User Security ― Data Backup Data Back p • User Training ― EPG will schedule and provide a one‐hour training session via WebEx p g ARR Website Access • As a subscriber and recipient of the Daily Automatic Reliability Reports, you can also access the ARR Monthly Quarterly and Yearly reports as well you can also access the ARR Monthly, Quarterly and Yearly reports, as well as the archived Daily reports at the following website: https://www.electricpowergroup.net/ARR To access the above website, use your EPG To access the above website use your EPG Username and password to Username and password to login – Note: If you do not already have a password (or forgot your username or password) and need to activate one for the first time, please go to the EPG Login Page at https://www.electricpowergroup.net/userAccount/acctLogin.aspx and Page at https://www.electricpowergroup.net/userAccount/acctLogin.aspx and click on the Forgot your password or username? link on This Page and follow instructions • If you have any questions, please contact EPG at 626.685.2015 or via email support@electricpowergroup com [email protected] • You can also use this link to contact EPG: https://www.electricpowergroup.net/contactUs.aspx and use the Contact U form Us f Page 4 11.12 NERC Application Access Central Webpage https://www electricpowergroup net/NERC https://www.electricpowergroup.net/NERC To login to our website follow the Click here to login link. Use your EPG Username and password to login. Note: if you need to retrieve your password or username, please click on the Forgot your password or username? link in the Login page and follow instructions. Page 5 11.12 I-Alarms Summary and Trends 2008 to 2012 Interconnection Page 6 11.12 FTL & Long Term Alarms Short Term Alarms Eastern Decreased* Increased Western No Change Increased ERCOT Decreased Decreased 6 11.15.11 Eastern Interconnections Frequency Deviation (Epsilon) 2005 to 2012 Page 7 11.12 7 11.15.11 Western Interconnections Frequency Deviation (Epsilon) 2005 to 2012 Page 8 11.12 ERCOT Interconnections Frequency Deviation ((Epsilon) p ) 2006 to 2012 No data in Januaryy 2011 Page 9 11.12 Any questions regarding the NERC/CERTS applications please contact: Gil Tam Tam@electricpowergroup com [email protected] (626) 685-2015 Page 10 11.12 Presentation 5 Effects of Geomagnetic Disturbances on Bulk Power Systems Frank Koza Vice-Chair, NERC GMD Task Force Executive Director, Operations Support, PJM Solar Cycle 24 2 RELIABILITY | ACCOUNTABILITY Doomsday GMD Scenario “Linked to the celestial spectacle are enormous fluctuations of the magnetic field in Earth's magnetosphere, which are causing immense flows of electric current in the upper atmosphere over much of the planet. Those huge currents disturb Earth's Earth s normally quiescent magnetic field, which in turn induces surges of current in electrical, telecommunications, and other networks across entire continents. Streetlights flicker out; electricity is lost. A massive planetary blackout has occurred, leaving vast swaths of North and South America, Europe, Australia, and Asia without power. Within a few months, the crisis has deepened. In many areas, food shortages are rampant, drinking water has become a precious commodity, and patients in need of blood transfusions, insulin, or critical prescription drugs die waiting. Normal commerce has ground to a halt, replaced by black markets and violent crime. As fatalities climb into the millions, the fabric of society starts to unravel.” 3 RELIABILITY | ACCOUNTABILITY PJM—Center of the Scenario According to the scenario.. •Based on a projected 5 000 nT/min 5,000 T/ i storm, t large l numbers of EHV transformers will fail • S Since ce transformers a so esa are e custom-built and not sourced domestically, recovery could take years 4 RELIABILITY | ACCOUNTABILITY Coronal Mass Ejections Magnetosphere Energetic Charged Particles Heliosphere 5 Ionosphere RELIABILITY | ACCOUNTABILITY Geomagnetic Disturbances B t 6 E RELIABILITY | ACCOUNTABILITY GMD Detection 7 RELIABILITY | ACCOUNTABILITY NASA Solar Wind Prediction Source: WSA-Enil Solar Wind Tool 8 RELIABILITY | ACCOUNTABILITY Effects of GIC in HV Network GIC flows in lines Transformer half‐cycle saturation Harmonics P&C incorrect operation Reactive power loss Transformer heatingg Capacitor bank or SVC Ti i Tripping – l loss or reactive support Generator overheating Generator overheating and tripping Voltage control, limits, contingency management Voltage and angle stability Can lead to voltage collapse and blackout 9 RELIABILITY | ACCOUNTABILITY GMD Probability >300nT/min 10 RELIABILITY | ACCOUNTABILITY GMD Task Force Report 11 Major Major Conclusion • Most likely result from a severe GMD is the need to maintain voltage stability h d l bl to avoid voltage collapse and blackout Major Conclusion • System operators and planners need tools to maintain reactive power supply tools to maintain reactive power supply Major Conclusion • Some transformers may be damaged or f b d d lose remaining life, depending on design and current health RELIABILITY | ACCOUNTABILITY GMDTF—Phase 2 Task Teams working on the following: • Team 1 – Vulnerability Assessment ea 2 – Equipment qu p e t Modeling ode g • Team • Team 3 – GIC Modeling • Team 4 – System Operating Practices 12 RELIABILITY | ACCOUNTABILITY Team 4 – Sys Ops Practices Task Team #4 working on the following: • NERC Alert Review Operating at g Procedures ocedu es Template e p ate • Ope • Notification Process • Operator Training Template 13 RELIABILITY | ACCOUNTABILITY FERC NOPR on GMD NERC required to: • Stage 1 ‐‐ Create a NERC standard(s) (within 90 days!) to require transmission entities to have operating procedures to deal with GMD procedures to deal with GMD • Stage 2 ‐‐ Create a NERC standard(s) (within 6 months!) to address the need for assessments of the months!) to address the need for assessments of the transmission system to identify facilities that are vulnerable to GMD and develop mitigation strategies. p g g 14 RELIABILITY | ACCOUNTABILITY PJM Response to the NOPR • PJM has had an operating procedure since shortly after the HQ Blackout in 1989 (FERC Stage 1 Req’t) ft th HQ Bl k t i 1989 (FERC St 1 R ’t) • PJM Transmission Owners have installed Ground Induced Current (GIC) detectors at a number of Induced Current (GIC) detectors at a number of facilities (and more are on the way) • PJM, in cooperation with the PJM Planning PJM in cooperation with the PJM Planning Committee, is working on a proposal to conduct a vulnerability assessment of the PJM system (Target y y ( g completion: Second Quarter of 2013) (FERC Stage 2 Req’t) 15 RELIABILITY | ACCOUNTABILITY Questions? Presentation 6 SPP Reliability: SPP Reliability: PTDF Report November 13‐14, 2012 Robert Rhodes [email protected] 501.614.3241 PTDF Information: Statistics from September-October, 2012 Flowgate: Valliant – Lydia 345 kV (5220) 3 TLRs issued Flowgate: Red Willow – Mingo 345 kV (5221) 2 TLRs issued Flowgate: Nebraska City – Cooper 345 kV (6030) 3 TLRs issued Flowgate: Temp 40 Iatan – Stranger Creek 345 kV flo Iatan – St Joseph 345 kV (Temp 40) 3 TLRs issued 2 FG 5220 Valliant‐Lydia 345 kV 3 FG 5220 Valliant‐Lydia 345 kV FG 5220 Valliant‐Lydia 345 kV • Used to Control North to South flows Used to Control North to South flows • 138 kV Outages of Craig – Ashdown, Craig ‐ Broken Bow and Craig Broken Bow Tap, caused many Sub Bow, and Craig ‐ Broken Bow Tap caused many Sub Transmission (69kV) Contingencies to appear on AEP RTCA for loss of Lydia – Valliant 345 kV RTCA for loss of Lydia Valliant 345 kV • Controlled FG to 500 MW to alleviate • TEMP67_18664 Dequeen – Patterson 69kV flo Valliant – Lydia 345kV built to monitor. FG 5220 Valliant‐Lydia 345 kV X X X 69 kV 615 TEMP67_18664 TEMP67 18664 Description: Dequeen – Patterson 69kV (ftlo) Valliant – Lydia 345kV Monitored: Dequeen – Patterson 69kV (EMS: DEQUEEN – DEQ_REA 69kV) Contingent: Valliant – Lydia 345kV (EMS: VALLIANT – LYDIA 345kV) Norm Limit: 48 Emer Limit: 48 Contingency ID: VALL LODF: 0.06831 5 FG 5221 Red Willow‐Mingo 345 kV FG 5221 ‐ Red Willow Mingo 345 kV FG 5221 ‐ Red Willow FG 5221 Red Willow‐Mingo Mingo 345 kV 345 kV – Red Willow‐Mingo 345 kV PTDF is used to maintain voltage on the 115kV system in the SECI control area. Large North to South flows requires large amounts of reactive power at the Mingo substation where there is ti t th Mi b t ti h th i little reactive resources causing low voltage on surrounding 115 kV system. surrounding 115 kV system. • The normal limit is 717 MW, but for this situation we run it at under 600 MW 7 FG 5221 ‐ Red Willow‐Mingo 345 kV g FG 6030 Nebraska City – Cooper 345 kV 9 FG 6030 Nebraska City – Cooper 345 kV • Used to control heavy North to South flows during an outage of Cooper unit and during an outage of Cooper unit and Cooper – Mark Moore 345 kV • Used as proxy for FG 18661 Temp 66: Nebraska City – Cooper 345 kV flo Fallow Avenue – Grimes 345 kV • Monitored Element of FG 18661 • FG 18661 had not been made Market Coordinated by MISO Coordinated by MISO 10 FG 6030 Nebraska City – Cooper 345 kV FG 6030 Nebraska City – Cooper 345 kV X X X FG 17699: Temp 40 Iatan FG 17699: Temp 40 Iatan – Stranger Creek Stranger Creek 345 kV flo Iatan – St Joseph 345 kV FG 17699: Temp 40 Iatan FG 17699: Temp 40 Iatan – Stranger Creek Stranger Creek 345 kV flo Iatan – St Joseph 345 kV • Used as proxy to control RTCA contingency Jarbalo – p y g y 166 St 115 kV flo Iatan – St Joseph 345 kV – Contingency showed up due to outage of Stranger Contingency showed up due to outage of Stranger – Craig 345 kV – FG was built the following day (Temp 65) FG was built the following day (Temp 65) – Iatan outlet issue Temp 40 and Temp 65 Temp 40 and Temp 65 XX outage Presentation 7 Consortium for Electric Reliability Technology Solutions CERTS Research Supporting Reliability Performance Standards NERC Interconnections Frequency Control Performance and d Timeline Ti li for f Frequency F Response R Standard St d d For: NERC Operating p g Reliabilityy Subcommittee By: Carlos Martinez – CERTS/ASR Little Rock, Arkansas, November 13, 2012 1 Presentation Outline Timeline for the NERC Frequency Response standard f q y p Overview of Interconnections 2008‐2012 Frequency Control performance assessment and datasets Eastern interconnection 2012 Frequency Regulation Eastern interconnection 2012 Frequency Regulation metrics identification and quantification Interconnections 2008‐2012 Events Frequency Response metrics statistics 2 Estimated Timeline for NERC Frequency Response Standard 3 Estimated Timeline for NERC Frequency Response Standard Nov6 2012 Nov30 2012 Non binding Non-binding SDT ballot response to (Passed) public comments Dec 2012 Feb 2013 Final ballot NERC Board May 2013 Aug 2013 NERC Filing g With FERC FERC NOPER Nov 2013 Dec 2013 Industryy Start FR Comments for NOPER, Standard FERC Order 4 IInterconnections i 2008 2008-2012 2012 Frequency F Control Performance Assessment Study 5 NERC Interconnections 2008-2012 Frequency Control Performance – Assessment Interconnections Frequency Control Performance Frequency Regulation (Secondary Control) (Secondary Control) Frequency Response (Primary Control) (Primary Control) Preliminary Objectives: y j • Identify performance metrics • Quantify performance metrics • Impact on reserves • Impact on Inadvertent Impact on Inadvertent • Impact on Time Error • Impact of variable generation • Impact of Market Products • Primary control withdraw • Risk assessment • Control Standards Adequacy 6 Known Interconnections Historical Datasets Eastern, ERCOT Interconnections Frequency Response Events and Parameters J. Ingleson E. Allen (1992 2009 (1992‐2009 Eastern) T. Bilke (1994‐2011 Eastern)) S. Niemeyer (2008‐2012 ERCOT) 4 Interconnections 4 Interconnections NERC‐RS Applications 1‐Min., 1‐Sec. Data NERC Archive 2002‐2012 & 2008‐2012 2008 2012 1‐Min. 1‐Sec. RS‐FWG Freq. Resp. Standard Support 4 Interconnections 2008‐2012 4 Interconnections 2008 2012 Frequency Response Events and Parameters 3 Interconnections Frequency Response CERTS‐LBNL (2002‐2008 FERC 2010 FERC 2010 Report) Eastern 2012 Frequency E F Regulation R l i Metrics Identification and Quantification 8 Eastern 2012 Frequency Deviation Metric Pattern and Statistics pper Hour Type yp OBSERVATIONS: • Data quality ?? • Hours 14, 15, 16 ?? Hours 14 15 16 ?? • Hour 7, morning pk. • Duration impact 9 Eastern 2012 Frequency Deviation Metric Pattern and Statistics pper Month Type yp OBSERVATIONS: • Above 60: 22 to 4 • Below 60: 10 to18 Below 60: 10 to18 • Most abnormal: 16 • Most variable: 23 10 EASTERN 2012 FREQUENCY STATISTICS PER HOUR/MONTH – 1 SECOND DATA OBSERVATIONS: • Above 60: 22 to 4 • Below 60: 10 to18 • Most abnormal: 16 • Most variable: 7, 23 • Duration impact ?? OBSERVATIONS: • Most abnormal: Apr • Most variable: Jan, Feb, Mar b 11 NERC Interconnections 2009 to 2012 Events Frequency Response Statistics 12 Eastern 2009-2012 Frequency Response Statistics 13 Western 2009-2012 Frequency Response Statistics 14 ERCOT 2009-2012 Frequency Response Statistics 15 16 QUESTIONS 17 Presentation 8 Interchange Distribution Calculator Working g Group p ((IDCWG)) Update NERC ORS Yasser Bahbaz – IDCWG Chair November 12th , 2012 IDCWG Update • Meetings/Conference Calls • IDC Change Order Updates • Other Items p • GTL Update Implemented ● CO 328 – Intra Hour Tag Curtailments An analysis is being g performed to determine if this change order is sufficient to handle the 15-Minute Scheduling correctly. ● CO 346: TLR Auto Acknowledgment IDC is now setup such that each sink impacted Reliability Coordinator can set up to automatically acknowledge the TLR actions based on configurable time intervals after a new TLR instance Development/Testing ● CO 322: PFV Generation Priority Submissions ● CO 330: Authorization of OATI Use of IDC Data for DOE Studies ● Will be moved to development p once a final methodology gy is reached at BPS. Will be revised as needed. Same Data is being requested for 2011 ** Not approved by IDCWG IDCWG. Requesting ORS feedback. CO 336: Changes to IDC Factor Calculation Timing This will be moved for development if deemed need after an evaluation on the behavior of status changes is completed by IESO and MISO. ● CO 350 Increase the Initial Limit for NNL Relief Provided During TLR Issuance ● CO 351 – Update p the Flowgate g GLDF Display p y to Show PJM Historic Control Areas Development/Testing ● CO 352: Various Enhancements to the NNL Re-Dispatch Worksheet ● CO 354: Sending IDC TLR ID to SPP Via WebData Interface ● CO 355: Make Informational Flowgates Selectable in Study TLR Mode Meetings/Conf Calls ● August 15th – 16th (MISO, (MISO St Paul) ● October 16th (8 – 5) – 17th (8 – 5) BPS Joint Meeting on 17th (1 – 5) ● November 16th – Conference Call ● January J 29th – 30th ( 8 – 5), 5) OATI Offi Offices iin R Redwood d d Cit City. DRAFT/Evaluation ● CO 326: PFV Metrics Maybe revised after a final methodology is reached at BPS BPS. ● CO 353: PSEC – SOCO Dynamic Tags ● CO 356: TVA RC Requires all IPPs to be a Pseudo B l Balancing i A Authority th it iin th the IDC ● BOF CO 16: PSSE Version Change IDCWG Update Other Items Entergy Transition to MISO ● Entergy Transition to MISO Entergy is scheduled to transition and become under MISO RC purview on December 1st. IDCWG MISO and ICTE members will coordinate modeling changes effort for December Model Model. Location of IDC Model Swing Bus ● Preliminary Analysis showed that the location of Swing S i Bus B doesn’t d ’t impact i t TDF or GLDF calculation. ● The analysis were fairly thorough, however, further analysis were requested by members of the IDCWG on other environments of the IDC. ● IDCWG Documentation SDWT is working to clarify all training documents to clarify how best to use GSF and LSFs provided by the IDC. IDC Reference Document IDCWG approved the following recommendation: d ti IDCWG proposes that The Flowgate Administration Reference Document, Parallel Flow Calculation Procedures Reference Document, and Reliability Coordinator Reference Document sections of the NERC Operating Manual sections of the NERC Operating Manual be removed and replaced with a hyperlink to the appropriate document that is posted on the NERC website. The appropriate documents would be the IDC User’ss Manual and SDX User User User’ss Manual. Manual Web Registry Publication ● IDCWG worked with OATI to validate and debug missing i i objects bj t in i the th WebRegistry W bR i t prior i to t the th go live and publication of the Registry to IDC. ● The webRegistry publication for 11/13/2012 was successfully implemented right before 01:00 CST 11/13/2012 in the IDC. ● Since the implementation of the webRegistry in production p oduct o u until t ea earlyy tthiss morning, o g, tthe e IDC C has as successfully imported into the IDC more than 450 e-Tags Web Registry Publication ● After the implementation of the g y in IDC, TLR activityy has been webRegistry conducted without any major issues reported ● OATI reported certain E-Tags E Tags with missing object IDs – Further Inquiry of the impact of this issue is outstanding. outstanding IDCWG Update GTL Update IDCWG Update IDCWG is working with the BPS to draft a IDC GTL User’ss Manual. User Manual The intent is to highlight g g how the current IDC will change to successfully implement BPS requirements as dictated in the whitepaper. This document would serve as complimentary material for the NAESB Executive Committee responsible for the approval of the methodology. IDCWG Update Presentation 9 Vic Howell Manager, Operations Engineering WECC RC Pre-Identified IROL Establishment & Treatment 11/13/2012 ORS Meeting – Little Rock, AR Background • September 8th Blackout Report – the WECC RC should recognize that IROLs exist • Stems from the June 27, 2007 IROL Philosophy letter from Operating Practices Subcommittee (now retired) • As a result, there are no established criteria for pre-identifying IROLs 2 Background • SOL Methodology revised early 2012 contains a process the RC uses to determine when an SOL qualifies as an IROL – Phase I. • Phase II – a WECC-wide effort to address 19 key issues • Establish criteria for pre-defined IROLs 3 ORS Discussion Objective • To understand how other RCs establish and treat pre-defined IROLs 4 ORS Discussion Topics 1. Does the IROL define the point where the system “breaks”, or does it define the point where the system becomes N-1 insecure? 2. Is the IROL a number, or is it a “condition” (i.e., a number or set of numbers along with a pre-defined set of system conditions)? 3. Are IROLs generally based on stability issues (PV/QV analysis, transient analysis) or something else? 4. When establishing IROLs, is consideration given to the amount of load lost or at risk? 5 ORS Discussion Topics 5. Do IROLs ensure N-1 security or N-1-1 security? 6. Is an adjustment period allowed (i.e., if an unexpected contingency occurs that leaves the system in an N-1 insecure state, a 30 minute adjustment period is allowed to re-position the system back to an N-1 secure state)? 7. Are pre-defined IROLs updated as you get closer to real-time? 8. Are TPL criteria (such as Category C contingencies) used for establishing IROLs? I.e., do IROLs protect against multiple Facility Contingencies? 6 Questions? Presentation 10 DEWG Status Update ORS Meeting November 13, 2012 DEWG ISN Node Meeting Participation 10/18/2012 7/12/2012 ALCOA Duke ENTERGY ERCOT FPL HQT IESO ISO‐NE MISO NBSO NERC NYISO PJM SCEG SEPA SOCO SPP TVA WECC X 4/19/2012 X X 1/12/2012 10/20/2011 7/14/2011 X X X X X X X X 4/14/2011 1/13/2011 X X X X X X X X X X X X X X X X X X X X X X X X X X X X X X X X X X X X X X X X X X X X X X X X X X X X X X X X X X X X X X X X X X X X X X X X X X X X X X X 2 Committee Documents • Completed review of all DEWG documents • Non-relevant documents retired • Perform yearly review of all active documents 3 NERCNet concerns • SaskPower applied for NERCNet extension 1st quarter of 2011 – Required due to MISO retiring St. Paul ICCP servers • Effort not completed as of today • MISO extended MISO’s WAN to SaskPower to facilitate data transfer • DEWG iis requesting ti meeting ti with ith NERC tto discuss this issue along with NERCNet support at upcoming January/2013 meeting – Provide an update to ORS once this meeting occurs 4 Discuss NERCNet Option 2 requirement • Currently, no requirements for RC to have the NERCNet Option 2 (backup) • If Option 1 (Primary) fails, RCs lose data from these sites • Prohibits network testing as can’t switch sites from one option to the other • DEWG committee is asking ORS for direction on requiring this capability 5 Current Efforts - DDF Data Definition Files are not being updated on a regular basis Effort has been delayed due to other efforts Efforts underway to correct this issue Starting to review who has submitted updated files in the last quarter starting with 3rd qtr, 2011 Requirement to submit at least once per every six(6) months 6 DEWG DDF update ALCOA Duke ENTERGY ERCOT FPL HQT IESO ISO‐NE MISO NBSO NERC NYISO PJM SCEG SEPA SOCO SPP TVA WECC 2012 2012 3rd/4th qtr 1st/2nd qtr 2011 3rd/4th qtr X X X N/A N/A N/A X X N/A / X N/A / X N/A / X X X X N/A X X X X N/A N/A N/A N/A N/A N/A / N/A / N/A / N/A N/A N/A 7 PMU Data Definition Files Version 1 of the PMU data definition file has been approved C Contains t i meta-data t d t d definition fi iti ffor PMU measurements t Couldn’t reach consensus on a common naming convention for signal names Effort was tabled until new PMU standards are in production p Signal name length goes from 16 to 256 characters Validation tool is available to verify PMU DDF file before submittal to NERC ISN repository NERC ISN repository is available for RC modeling groups to access/submit DDF files g y is available,, this tool is to be retired Once NASPI registry Initial effort to scope effort was delayed in 2011 8 PMU Real-Time data transfer using NERCNet Currently, no available network for RCs to exchanged Synchrophasor data NASPIN NASPINet design d i iis available il bl b but no iimplementation l i iin the h near future MISO is seeing 3-6 seconds latency using internet W Wantt to t leverage l existing i ti NERCN t infrastructure NERCNet i f t t ffor PMU data transfer Minimal cost to add this capability A Actual t l usage costs t will ill b be assigned i d tto RC RCs using i capability, bilit nott intended to be a socialized cost MISO’s WAN currently supports ICCP and PMU traffic with no issues (approximately 150 PMUs) Additional bandwidth required 9 PMU Real-Time data transfer using NERCNet (continued) MISO requested approval for test from TWG TWG approved initial test to validate transfer of PMU data Test will be coordinated with all RC control rooms thru TWG/DEWG personnel Initial test will be a single PMU data exchange in each direction MISO requested approval for test from TWG TWG approved initial test to validate transfer of PMU data Test will be coordinated with all RC control rooms thru TWG/DEWG personnel p 10 PMU Real-Time data transfer using NERCNet (continued) MISO and NYISO are working on plans to perform this test in two phases (short and extended durations) Initial conf confusion sion on test as DEWG chairman wasn’t asn’t a aware are of the two phase request Resolved during conference call November 13th, 2012 Phase I is currently planned for Thursday Thursday, November 15th, 2012 for an eight(8) hour duration Conference bridge to be available during initial test set-up Requesting that each RC participate in call from respective control room Test will consist of one PMU in each direction Terminated if any issue is observed or requested by any RC Phase II is tentatively planned to start Tuesday Tuesday, November 27tth, 2012 for a 30 day duration Test will follow the same procedure as noted above 11 PMU Real-Time data transfer using NERCNet – Next Steps After sucessful tests: DEWG and TWG will be asked to approve allowing PMU data on NERCNet ORS to approve – does this need to go any other NERC committees? MISO has a requirement to use Synchrophasor data in the Control Room, need a private network to exchange data Current C t NERCNet NERCN t upgrade d tto MPLS is i b behind hi d schedule: h d l Allows ICCP traffic to have a higher priority More capability to monitor network traffic Approximately pp y 75% of option p 2 sites ((backup) p) are transitioned, behind schedule Not sure what timeline is for option 1 sites (primary) Synchrophasor data is the new tool for control rooms Need network for transmission of this data (not Internet) If it’s not NERCNet, then will need to install a new network (expensive) Need to push industry to have capability for Synchrophasor data 12