1
1 Introduction
1.1
Profiler: An Overview
The standard COPAS system measures the value of extinction and fluorescence signals by integrating each signal over
the time that the threshold signal is above the threshold value. The result for each signal is a single value that has
obscured any details of the changing intensity of the signal while the signal is being integrated. Therefore, an object
containing a small intense fluorescent spot and another object with a low diffuse level of florescence throughout would
appear the same despite dramatically different spatial organization of the fluorescence signal.
Instead of making a single integrated measurement of a signal, the Profiler option digitizes the instantaneous
signal level. The result is a list of successive point measurements made while the object passes through the flow
cell. An object containing a small bright fluorescent spot will produce a fluorescence signal with a corresponding
narrow peak, and the Profiler will digitize the peak into a succession of numbers that directly trace the
fluorescence peak as it passed through the flow cell.
The computer can now perform tests that will detect the presence of different colored fluorescent peaks for the short time
they were present in the original signal, and note how much each individually rises above its own background level.
This ability to detect short-duration signal peaks that would be swamped out by a single integrated measurement is one
way in which the Profiler can enhance detection sensitivity.
Positional information
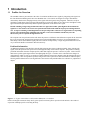
An additional advantage of the Profiler is that all digitized points have been recorded proximally, along with the peak
signal, so that the position of the peak can be located proportionally in the total list of points. This permits extracting
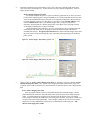
positional information from the complete profile, rather than simply the presence or absence of peaks. Notice how the
fluorescence profile signal aligns with the microphotograph in Figure 1. Profiles can be collected for the changes in
optical density (which we refer to as extinction or EXT) and three fluorescence channels, along the length of the object,
simultaneously. This correspondence permits testing for the relative positions of fluorescent markers within an object,
allowing another dimension for resolving differences between the analyzed individuals in a collection or population of
objects.
70000
60000
50000
40000
30000
20000
10 0 0 0
0
Figure 1: C. elegans worm with str-1::GFP; mab-5::dsRed; unc-17::zsYellow
Profile of transgenic nematode clearly shows green expression in head, yellow expression in the animal’s vulva and red
expression in multiple specific cells along the body.
2