1
•
•
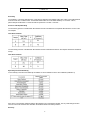
Reagents from different lot numbers must not be interchanged.
If preferred, mix in equal volumes, in sufficient quantities for the assay, Reagent 1 (Biotinylated Antibody) and
Reagent 2 (Enzyme Labeled Antibody) in a clean amber bottle. The combined reagent is stable for seven (7) days
when stored at 4°C. Then use 50 µL of the mixed antibody into each well. This alternative method should replace
Step (3) and (4), to be followed with the incubation.
•
When mixing avoid splashing of reagents from wells. This will affect assay precision and accuracy.
ULATION OF R
CALCULATION OF RESULTS
Manual Method
1. For the 450 nm readings, construct a dose response curve (calibration curve) using the first five calibrators
provided, i.e. Calibrators A, B, C, D and E. For the 405 nm readings, construct a second dose response curve using
Calibrators A, D, E and F.
2.
Assign the concentration for each calibrator stated on the vial in mU/mL. Plot the data from the calibration curve on
linear graph paper with the concentration on the X-axis and the corresponding A.U. on the Y-axis.
3.
Draw a straight line between 2 adjacent points. This mathematical algorithm is commonly known as the "point-topoint" calculation. Obtain the concentration of the sample by locating the absorbance unit on the Y-axis and finding
the corresponding concentration value on the X-axis. Patient and control samples should be read using the 450 nm
nd
for EPO concentrations up to the penultimate [2 to the highest] calibrator, i.e. Calibrator E. EPO concentrations
above the concentration of the penultimate calibrator (in the example shown below as 120 mU/mL) should be
interpolated using the 405 nm reading.
Automated Method:
4.
Computer programs using cubic spline or 4 PL [4 Parameter Logistics] or Point-to-Point can generally give a good
fit. For the 450 nm readings, construct a dose response curve (calibration curve) using the first five calibrators
provided, i.e. Calibrators A, B, C, D and E. For the 405 nm readings, construct a second dose response curve using
Calibrators A, D, E and F.
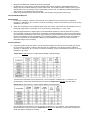
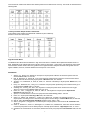
Sample Data at 450 nm [raw A.U. readout against distilled or deionized water]
* Because the Concentration of these samples are > the Concentration of Calibrator E, e.g. 120 mU/mL, it is
recommended to use the data obtained at 405 nm as shown in Sample Data at 405 nm in the table below.
Sample Data at 405 nm [raw A.U. readout against distilled or deionized water]
¶ For samples with concentrations < the concentration of Calibrator E, e.g. 120 mU/mL, it is recommended to use
the data obtained at 450 nm as shown in Sample Data at 450 nm in the table above. This practice should give the
results with optimum sensitivity of the assay.
4