1
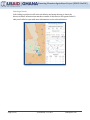
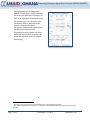
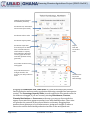
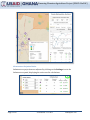
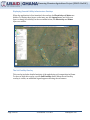
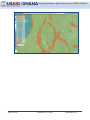
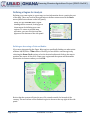
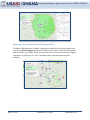
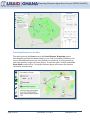
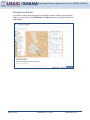
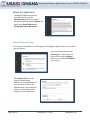
Financing Ghanaian Agriculture Project (USAID-FinGAP) USAID-FinGAP User Manual Contents Overview ..................................................................................................................... 3 Regions and Districts Included in the Software .............................................................................................. 3 Application Functionality Walkthrough ........................................................................ 4 Infrastructure Markers ............................................................................................................................................... 4 Showing Infrastructure Sites ................................................................................................................................ 4 Regions and Districts ................................................................................................................................................... 5 Selecting a District .................................................................................................................................................... 6 Infrastructure Projection Ratios ......................................................................................................................... 9 Taking Screenshots and Exporting Data .......................................................................................................... 10 NOTE: Taking a Screenshot ............................................................................................................................... 11 .............................................................................................................................................................................................. 11 Location Information ................................................................................................................................................ 12 Page 1 of 27 Last Edited: 5/12/2015 Nautilytics LLC Financing Ghanaian Agriculture Project (USAID-FinGAP) Farms ................................................................................................................................................................................ 12 Displaying Essential Utility Infrastructure Overlays ................................................................................. 14 The Soil Fertility Overlay ........................................................................................................................................ 14 Defining a Region for Analysis .................................................................................... 16 Defining an Area using a Circle and Radius.................................................................................................... 16 Defining an Area using Point-to-Point Polygon Tool ................................................................................. 17 Calculating Distances on the Map ....................................................................................................................... 18 Adding and Editing Infrastructure Sites ...................................................................... 19 Editing Existing Infrastructure............................................................................................................................. 19 Infrastructure in Edit Mode ............................................................................................................................... 20 Adding New Infrastructure .................................................................................................................................... 21 Submitting New Site Information via SMS .................................................................................................. 21 Sharing Your Results .................................................................................................. 22 About the Application ................................................................................................ 23 How to Contact the Team ........................................................................................................................................ 23 Appendix A - Infrastructure Markers .......................................................................... 25 Appendix B - Districts and Regions ............................................................................. 26 Page 2 of 27 Last Edited: 5/12/2015 Nautilytics LLC Financing Ghanaian Agriculture Project (USAID-FinGAP) Overview The Financing Ghanaian Agriculture Project (USAID-FinGAP) is an interactive webbased software program demonstrating where agricultural investment is located now, and where agricultural investment opportunities are likely in the future (i.e. inputs, transportation, storage, and processing) given presumptive production increases, specifically above the 8th parallel in Ghana. The software is designed to enable users to build scenarios that demonstrate where new warehouses, processing plants, logistic centers and other infrastructure and services will be required as a result of increased production of rice, maize and soy in Northern Ghana. Users can modify specific data points that lead them to different investment scenarios over time, such as production at 10%, 25%, 50%, 100%, or 150% of projected. The software enables prospective investors, financiers, agribusiness entrepreneurs and project developers to identify specific supply chain investment opportunities that are likely to generate high returns on investment and their probable locations within the target region, or district. Regions and Districts Included in the Software The following regions and all districts within are included in the software: Brong-Ahafo Northern Upper East Upper West For the full list of regions and districts, see Appendix B - Districts and Regions Page 3 of 27 Last Edited: 5/12/2015 Nautilytics LLC Financing Ghanaian Agriculture Project (USAID-FinGAP) Application Functionality Walkthrough The application consists of the following main components: Infrastructure Markers shown on the map to indicate the location and type of infrastructure, including Irrigation Sites and Business Advisory Services. See Appendix A - Infrastructure Markers for a full list of types of infrastructure included in this application. Regions and Districts as shapes that you can hover over using your mouse and left-click to view more details of the selected region or district. Farms shown as areas of different color indicating the types of crops grown at a specific location. Zoomed out of the map, these farms appear as rounded areas, larger than actual size. As you zoom in, the map will change to show the actual shapes of these farms. At closest zoom levels, farms can be clicked to show more details on the ownership. Infrastructure Markers These markers represent physical infrastructure sites located in Ghana. Showing Infrastructure Sites On the left of the screen you can find the main toolbar for showing or hiding details on the map. The first button is used to toggle the display of the Legend toolbar. Page 4 of 27 Last Edited: 5/12/2015 Nautilytics LLC Financing Ghanaian Agriculture Project (USAID-FinGAP) To show the locations of specific infrastructure on the map, click on the appropriate marker type on the menu. If there are many sites within a close distance of each other, they will appear clustered with a total count. Zooming in on a cluster will break apart the cluster and show the actual locations. Regions and Districts When the map is first loaded, the orange-shaded areas represent districts within Ghana that can be analyzed in more detail. The application has production data for each of these districts, and selecting a district will show these data. The Legend has two options that you can use to show or hide the names of Regions and Districts on the map. The picture shown has both Region and District labels visible. To find a specific location on the map, use the Search box at the top of the screen. If your search term is found, the map will zoom in to the location automatically. Page 5 of 27 Last Edited: 5/12/2015 Nautilytics LLC Financing Ghanaian Agriculture Project (USAID-FinGAP) Selecting a District Left-clicking on a district will select the district and zoom the map to show the district in detail. Infrastructure markers outside of this district will appear faded. A side panel will also open with more information on the selected district: Page 6 of 27 Last Edited: 5/12/2015 Nautilytics LLC Financing Ghanaian Agriculture Project (USAID-FinGAP) The right panel shows Compound Annual Growth Rate (CAGR)1 statistics for each of the different crop types, as well as an aggregate of the three crops. On the panel you can choose to view production data for different crops, generate forecasts for future production, and identify requirements for additional infrastructure. Hovering over a data point will show additional information, as well as the trend line equation, which is used in forecasting2. The year-over-year growth of an investment over a specified period of time. For constructing the linear trend line, an Ordinary Least Squares (OLS) regression is used to best fit the data. 1 2 Page 7 of 27 Last Edited: 5/12/2015 Nautilytics LLC Financing Ghanaian Agriculture Project (USAID-FinGAP) CAGR (Compound Annual Growth Rate) Summary Production Year Time Slider, 2013 to 2023 (forecasted) Production Selector Tabs Production Capacity Slider Production Graph with forecasted years as dashed lines, red dashed lines to reflect 100% vs. capacity slider difference. Hovering over the graph shows the trend line equation tooltip (pictured). Export Data and Screenshot Tools Area Under Production and Yield graphs Projected Infrastructure changes related to the forecast year and production levels. Infrastructure Projection Ratio Settings Dragging the Production Year Time Slider to a year in the future will forecast future production and area under production data using a straight line least squares routine. The Percentage Capacity Slider is used to adjust the forecasted results. As the sliders are dragged, if you are currently viewing Warehouses, Tractors, Financial Institutions or Processors on the map, you may see forecasted sites appear. Forecasted sites appear as marker icons with dashed borders. These sites are placed at the centroid of the selected district on the map. Dragging these markers shows distances to local infrastructure, giving more insight on where a future site could be built should production increase at the anticipated rate. Page 8 of 27 Last Edited: 5/12/2015 Nautilytics LLC Financing Ghanaian Agriculture Project (USAID-FinGAP) Infrastructure Projection Ratios Infrastructure projections are adjusted by clicking on the Settings icon in the Infrastructure panel, displaying the ratios used in calculations: Page 9 of 27 Last Edited: 5/12/2015 Nautilytics LLC Financing Ghanaian Agriculture Project (USAID-FinGAP) Production ratios are calculated in the following manner: 1. A production ratio is calculated for each district – [total production of specified crop] / [# of specified infrastructure sites]. For example, one district may produce 10,000 tonnes of corn and have four processing facilities, therefore the amount of production needed for one additional processing facility is (10,000/4 = 2,500 tonnes). 2. Once a production ratio is calculated for each district, each crop, and each infrastructure type, an average of the ratios are calculated over crop and infrastructure type to produce the table above. Taking Screenshots and Exporting Data The two buttons on the side of the panel give you the ability to take your findings outside of the application and present your results to prospective investors. The Screenshot tool gives you the option to snap a picture of the current results as a downloadable PDF. The Export Data button exports the currently visible district data, as well as forecasts, into a .csv (Comma Separated Values) data file that can be easily imported into an external tool, such as Microsoft Excel, for further analysis. Page 10 of 27 Last Edited: 5/12/2015 Nautilytics LLC Financing Ghanaian Agriculture Project (USAID-FinGAP) NOTE: Taking a Screenshot In addition to the screenshot tool, you can use your built-in Operating System tools to take a screenshot. On Microsoft Windows The Print Screen / PrtScn button on the keyboard will take a screenshot of the currently displayed screen straight to your clipboard, and you can paste this directly into a tool like Microsoft Word. Alternatively, holding down the Alt key when pressing Print Screen will take a screenshot of the current window. More information can be found here: http://windows.microsoft.com/enus/windows/take-screen-capture-print-screen - take-screen-capture-printscreen=windows-8 Built-in to Windows 7 and above is a tool called Snipping Tool. To launch this tool, type "Snipping " into the Start menu search box and it will appear very quickly in the results. Once the tool is running, you can click to take a new screenshot of your window by dragging a rectangle selection. More information on Snipping Tool can be found here: http://windows.microsoft.com/enus/windows/use-snipping-tool-capture-screen-shots - 1TC=windows-8 On a Mac To take a screenshot of part of your screen: Press Command (⌘)-Shift-4. You'll see that your cursor changes to a crosshair pointer. Move the crosshair pointer to where you want to start the screenshot. Drag to select an area. To adjust the area, hold Shift, Option, or the Space bar while you drag. More information can be found at https://support.apple.com/en-us/HT201361 Page 11 of 27 Last Edited: 5/12/2015 Nautilytics LLC Financing Ghanaian Agriculture Project (USAID-FinGAP) Location Information As you move your mouse cursor around the screen you will see information about coordinates, and the name of the hovered district and region, shown at the bottom of the screen. The numbers displayed indicate the North/South Latitude and the East/West Longitude of the location in Degrees Minutes Seconds. Farms Farms are shown in two different styles on the map. When you are zoomed out to see more of the country at once, farms will be shown with enlarged circular areas that are centered over the actual farm location. As you zoom in closer to view the farms in more detail, the map will switch to showing the farms with shapes that match their known shapes and sizes. Page 12 of 27 Last Edited: 5/12/2015 Nautilytics LLC Financing Ghanaian Agriculture Project (USAID-FinGAP) When zoomed in close enough to the map to view farms in detail, left-click on a farm with your mouse to show ownership information Page 13 of 27 Last Edited: 5/12/2015 Nautilytics LLC Financing Ghanaian Agriculture Project (USAID-FinGAP) Displaying Essential Utility Infrastructure Overlays When the application is first launched, the overlays for Electricity and Water are hidden. To display these layers on the map, use the Legend menu and click on a layer to change its visibility. In the screenshot below, the Electricity and Water layers are visible: The Soil Fertility Overlay This overlay includes detailed analysis of the underlying soil composition in Ghana. To show or hide this overlay, use the Soil Fertility menu. When the soil fertility overlay is visible, an additional legend appears showing the soil names: Page 14 of 27 Last Edited: 5/12/2015 Nautilytics LLC Financing Ghanaian Agriculture Project (USAID-FinGAP) Page 15 of 27 Last Edited: 5/12/2015 Nautilytics LLC Financing Ghanaian Agriculture Project (USAID-FinGAP) Defining a Region for Analysis Defining your own region is a great way to view information about a particular part of the map. There are tools in the application to define custom areas in the Draw menu (third button down on the left panel). When you are in Draw mode, region shading will be removed, leaving you a clean canvas for defining your own regions. To return to normal map operation, you can click the icon that appears at the bottom of the side panel. Defining an Area using a Circle and Radius If you were interested in the Upper West region, specifically finding out what exists within a 10, 25, 50 or 75km radius of Sabuli, you can define a custom region by selecting the Draw Circle option, select the desired radius and click on the map to position the center of the circle. Name your region and the system will determine what exists in that area when you click OK: Notice that the system will trim the area if it extends outside the bounds of the country. The area in km2 of the finalized region is shown at the top-right of the side panel. Page 16 of 27 Last Edited: 5/12/2015 Nautilytics LLC Financing Ghanaian Agriculture Project (USAID-FinGAP) Defining an Area using Point-to-Point Polygon Tool To define a different area, perhaps a unique area that better-fits your purpose, you can use the Draw Polygon menu option. When in this mode, left-click to add points that will define your shape. When you have the area you want, you click the original start point, or right-click to "close" the shape and create the custom area for analysis: Page 17 of 27 Last Edited: 5/12/2015 Nautilytics LLC Financing Ghanaian Agriculture Project (USAID-FinGAP) Calculating Distances on the Map The third option in the Draw menu is the Draw Distance Waypoints option. Selecting this tool from the menu enables you to click on the map to define a route. As you add additional points, the total distance is calculated. It is also possible to enter this mode by a right-click on a district. To exit this mode, click the same Exit Draw Mode icon as before. Closing the distance popup will remove the distance calculation from the map. Page 18 of 27 Last Edited: 5/12/2015 Nautilytics LLC Financing Ghanaian Agriculture Project (USAID-FinGAP) Adding and Editing Infrastructure Sites The application includes the ability for end-users to edit information about existing infrastructure. For example, an end-user may want to reflect a change of ownership of a facility or perhaps add information that was not previously available. It is also possible for end-users to add new infrastructure sites to the map and include details about the nature of the site for the benefit of others. Once edits and additions have been made, the USAID-FinGAP Admin team will review the changes and, once they are approved, make them visible on the map. Editing Existing Infrastructure From the left menu, select the first menu option to view the Legend, and to show or hide markers for each of the different infrastructure types. Select the type of infrastructure you want to view, and then navigate the map to find the site you wish to edit. Once you have located your site, you can click on the marker on the map to view the details of the site: Click the Edit button to start editing the information and the fields will change to allow you to adjust the data: Page 19 of 27 Last Edited: 5/12/2015 Nautilytics LLC Financing Ghanaian Agriculture Project (USAID-FinGAP) Infrastructure in Edit Mode User-edited fields have an orange border. Clicking the Add New Row button adds a new field - in the example, this has been called "Extra Information". Infrastructure can be moved on the map while in edit mode to correct the physical location of the site. Click and drag the marker while in edit mode to adjust the latitude and longitude of the location. If you have made a mistake, clicking Cancel will undo your changes. To submit your changes, click Update. Page 20 of 27 Last Edited: 5/12/2015 Submitting your changes requires an email address (so that an Administrator can contact you later for additional information or clarification). Once approved, your changes will appear on the live site. Nautilytics LLC Financing Ghanaian Agriculture Project (USAID-FinGAP) Adding New Infrastructure Adding new infrastructure is a process very similar to editing existing infrastructure. The menu Add New Infrastructure is opened by clicking the fourth button down on the left: The above image shows adding a new warehouse facility to the map while viewing all the available data on utility infrastructure and existing warehouse sites. Clicking on the dashed marker will open a popup with fields that you can fill in to enter the details of the new facility. Once the new data is entered, you can submit your changes. Once approved by an Administrator, your new site will appear on the map. User-added sites are shown with green borders around them to differentiate them from the original data. Submitting New Site Information via SMS In addition to the web interface, users can submit information about new sites or amendments to existing sites via a quick SMS text message to the Administrators. The SMS number is: +233 505 551 190 Page 21 of 27 Last Edited: 5/12/2015 Nautilytics LLC Financing Ghanaian Agriculture Project (USAID-FinGAP) Sharing Your Results If you have located an interesting site and want to share details of this site with others, you can click on the Facebook or Twitter buttons at the top of the main page header. Page 22 of 27 Last Edited: 5/12/2015 Nautilytics LLC Financing Ghanaian Agriculture Project (USAID-FinGAP) About the Application Clicking the fifth button on the controls tab will open the Information panel. Here you are presented with information About the application, Data Sources and Frequently Asked Questions. How to Contact the Team If you require assistance or are having trouble using the application, you can enter a contact request. The sixth button launches the Contact panel, where you can either fill in a simple Contact form or you can send Feedback via a survey. The Contact Us form is for general feedback and comments. On submitting this form an email is sent to an Administrator, who will aim to contact you promptly with a response to your questions. Page 23 of 27 Last Edited: 5/12/2015 Nautilytics LLC Financing Ghanaian Agriculture Project (USAID-FinGAP) The Survey will help guide the team for future versions of this software. USAID-FinGAP would welcome all your comments and feedback. Page 24 of 27 Last Edited: 5/12/2015 Nautilytics LLC Financing Ghanaian Agriculture Project (USAID-FinGAP) Appendix A - Infrastructure Markers3 Agri-Input Company: a business (size ranges from corner shop to corporation) that sells inputs such as seeds, fertilizers, pesticides and herbicides as well as small tools to farmers. May also provide advisory services on the use of these inputs. Business Advisory Services (BAS) Provider: a professional services firm that provides business planning, finance, management, and marketing support to agribusinesses. Irrigation Site: an area with facilities for holding and distributing water for irrigation year-round. Mechanization Center: a center where farmers may hire and seek repairs to agricultural equipment. Processing Facility: a site where agricultural produce is converted from its raw state into a state ready for either human consumption or further processing as an input. For example, maize may be processed and then purchased for further processing into poultry feed Warehouse: a building for storing agri-inputs, raw materials, farm produce, semifinished and finished products, agricultural machinery and spare parts as well as non-agricultural products Tractors: a mechanized vehicle for farm activities including land clearing, ploughing, planting, agrichemical spraying, harvesting, and transport of produce to next destination Haulage Station: a designated location where small, medium, and large trucks dock to receive and/or deliver agricultural produce for market Financial Institution (FI): organizations that provide financial intermediation to a wide spectrum of businesses including agribusinesses located in the project’s Zone of Influence. These include equity and impact investors, commercial banks, rural and community banks, cooperative credit unions and financial NGOs. Commercial Farm: small, medium and large scale farms producing food and nonfood crops, as well as farm animals, for sale on domestic and international markets Contact [email protected] if you would like high-definition copies of these icon markers for promotional purposes. 3 Page 25 of 27 Last Edited: 5/12/2015 Nautilytics LLC Financing Ghanaian Agriculture Project (USAID-FinGAP) Appendix B - Districts and Regions The following list covers the complete list of Districts and Regions that are presented with data in this software: Region District Brong-Ahafo Asunafo North Municipality Asunafo South Asutifi Atebubu Amantin Berekum Municipality Dormaa East Dormaa Municipality Jaman North Jaman South Kintampo North Municipality Kintampo South Nkoranza North Nkoranza South Pru Sene Sunyani Municipality Sunyani West Tain Tano North Tano South Techiman Municipality Wenchi Municipality Jirapa Lambussie Karni Lawra Nadowli Sissala East Sissala West Wa East Wa Municipality Wa West Bawku Municipality Bawku West Bolgatanga Municipality Bongo Builsa Garu Tempane Upper West Upper East Page 26 of 27 Last Edited: 5/12/2015 Nautilytics LLC Financing Ghanaian Agriculture Project (USAID-FinGAP) Northern Page 27 of 27 Kasena Nankana Kasena Nankana West Talensi Nabdam Bole Bunkurugu Yunyoo Central Gonja Cheriponi East Gonja East Mamprusi Gushegu Karaga Kpandai Nanomba North Nanomba South Saboba Savelugu Nanton Sawla Tuna Kalba Tamale Metropolitan Tolon Kumbungu West Gonja West Mamprusi Yendi Municipality Zabzugu Tatale Last Edited: 5/12/2015 Nautilytics LLC