1
Methods and Data Comparability Board
Aquatic Sensor Workgroup
Quality Assurance (ACRR) Matrix
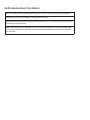
QA Checklist for Calibration, Quality Checks, and Record Keeping
to Ensure that Data Are of Known and Documented Quality
April 19, 2010
acwi.gov/methods
This page intentionally left blank.
Quality Assurance Matrix: Affect, Check, Record, Report
Scope
The Matrix provides recommendations for the minimal array of actions deemed necessary for collection of usable data of known and documented quality.
The Matrix is focused on the quality of the measurement, i.e., the performance of the measurement system. Issues related to what the Result represents in the monitored
environment are not included; please see the companion document “Sensors Deployment Guide.”
This matrix should be used in conjunction with, not instead of, the sensor’s User Manual and the Program's Standard Operating Procedures (SOP).
Users of turbidity sensors should also consult the Turbidity Addendum, a companion document to this Matrix, available at the ASW website, http://watersensors.org.
Sources
The structure of this matrix, with its breakdown into actions to Affect, Check, Report, and Record the quality of monitoring data, was developed in 2002 by Dr. Revital
Katznelson for the California State Water Resources Control Board.
GS - USGS National Field Manual, various chapters, and Wagner et al, 2006.
TX - TCEQ SWQM Program manual, ampm_011 and Chapter 8 2007,
NR - National Estuarine Research Reserve's (NERR) System-Wide Monitoring Program (SWMP), SOP for the YSI 6-Series Sondes.
PD - An experienced State Monitoring Program operator in California, personal communication (no formal protocol)
WR - the QA officer for a volunteer monitoring Program in California, personal communication (no formal protocol)
Various Users Manuals and other guidance documents from sensors manufacturers
Modes
Attended (discrete measurements): each measurement is recorded manually into a data sheet, or the readings of all sensors are logged as one discrete ‘sample.’
Unattended (continuous, or time-series measurements): the Sonde is programmed for automatic measurements and data logging at specified intervals, then deployed
for a given time period, and then retrieved for downloading of the logged data as a deployment-episode file. This mode also includes real-time transmission of the data
(telemetry).
For Calibration (Actions to Affect) and Accuracy Checks (Actions to Check)
Each set of the final recommendations should include reference to all relevant items among the following:
(1) the number of points (e.g., 2-point calibration);
(2) the value of each point (e.g., zero and a value above the environmental range);
(3) the frequency and timing (e.g., once a month, or immediately after deployment);
(4) the temperature of the Standard (e.g., 25 C, or middle of environmental range; this is not relevant to temperature sensors);
(5) the resolution (e.g., within 0.1 degrees C for thermistors; resolution may not be relevant to characteristics other then temperature); and
(6) the orientation of the sonde (e.g., horizontal; this is very important for depth measurements including measurements for vertical profiles); and
Some cells will contain this set in reference to ‘periodic,’ plus another set for ‘annual.’
Continued on Reverse...
Continued from Front
Assumptions
1
All calibration and quality checks records include Instrument ID, Date, Time, and Operator’s name, and these records are effectively linked to the Project, the
Location, etc..
2
Records of sensor’s operating parameters (e.g., cell constant, mV, etc.), recorded per manufacturer’s instructions, are also included.
3
All DO probes also contain a thermistor, but not all of them are associated with a barometer. Compensations for barometric pressure and salinity are done per
specific protocol’s instructions.
4
All conductivity and pH probes also contain a thermistor and have a built-in automatic temperature compensation (ATC) capability; compensation algorithms may
vary in level of sophistication (e.g., some pocket instruments may simply correct the reading by 2% for each degree C).
5
All monitoring results are reported after compensation for temperature, salinity, and atmospheric pressure as relevant (salinity is often calculated from conductivity
sensors’ output).
6
Depth sensors are always situated at the center of the sonde’s radial cross-section. (This should be verified with the manufacturer.)
7
For Attended monitoring, there is no time for buildup of a fouling layer during the Trip.
Acknowledgements
A unique public-private partnership worked on this document and included the following members:
• Revital Katznelson, PhD, Contract lead
• Dan Sullivan, USGS, Workgroup co-chair
• Gayle Rominger, YSI Inc., Workgroup co-chair
• Chuck Spooner, USEPA, National Monitoring Council co-chair
• Chuck Dvorsky, Texas CEQ
• Mike Sadar, Hach Co.
• Cristina Windsor, In-Situ
• Mike Cook and Rob Ellison, YSI Inc.
• Janice Fulford, USGS
• Jason Harrington, Greenspan Analytical
A review board provided invaluable feedback and included:
• Eva DiDonato and Pete Penoyer, National Park Service
• Mario Tamburri, Alliance for Coastal Technologies
• Jami Montgomery, USEPA
• Rick Wagner, Andy Ziegler, and Eric Vowinkel, USGS
• Eli Greenbaum, Oak Ridge National Laboratory
• Tamim Younos, Virginia Tech University
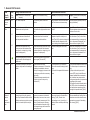
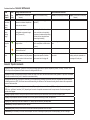
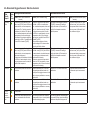
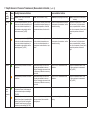
1. General: All Sensors
Data
Quality
Aspect
Mode
(See
Notes)
Quality Assurance Actions
Affect (Control, act to influence the
Documentation Actions
Check (Test to evaluate or verify)
Record (Keep everything documented)
outcome)
Report (Communicate the data quality
indicator)
Operator’s
competence
All
Train, refresh, supervise.
Run proficiency tests, review work
products.
Record operator name, test/review date,
and Test outcome or review summary.
Pass/fail procedure-specific proficiency
tests (by individual).
Accuracy/
Bias
All
Use certified non-expired Standards for
calibration and accuracy checks.
Compare previous lot/batch of standards
with new lot with a high-resolution instrument.
Reading of standard solutions from the
two lots.
Report "Standard Solution Drift," the
difference between values measured in
solutions of the two lots.
All
Calibrate the instrument at the project's
prescribed values and intervals and
under the prescribed conditions.
Conduct accuracy checks at the project's
prescribed values and intervals and
under the prescribed conditions.
Instrument reading, value of standard,
temperature /pressure /salinity as relevant [Tips A1-A2], electrode voltage, cell
constant, and other diagnostics as relevant, including their acceptable ranges.
Report bias: Instrument drift, i.e., difference from known ("true") value of standard, expressed either in measurement
units or as percent of Standard's "true"
value, whichever is higher [Tip A3].
All
Calibrate the instrument after every
service event and after instrument has
been subject to an impact (e.g., during
transport or deployment).
Conduct and accuracy check after every
service event and after the instrument
has been subject to an impact (e.g., during transport or deployment).
Instrument reading and value of standard.
Report bias: Instrument drift, i.e., difference from known ("true") value of standard, expressed either in measurement
units or as percent of standard's "true"
value, whichever is higher.
Avoid switching the power off or disconnecting the sensor from its display unit
between sites.
Check accuracy after turning the instrument on again [Comment A1].
Precision
All
Use consistent procedures under same
conditions, always wait for the reading to
stabilize.
Repeat measurements often.
(i) Repeat measurements 3-5 times after
the reading has stabilized, under controlled (non-changing) environment in the
lab, during every calibration or accuracy
check event.
(ii) Repeat field measurements at each
site/point in at least 2 sites per trip
[Comment A2].
(i) Record several (3-5) consecutive
values after instrument reading's stabilization.
(ii) Results of the repeated field measurements.
(i) Compute the standard deviation of the
3-5 values and report in measurement
units.
(ii) Compute the relative percent difference (RPD), which is the difference
between repeated field measurements
pair (or between two extreme values
among several repetitions), expressed as
percentage of pair average.
(iii) Compute the relative standard deviation (RSD), which is the standard deviation expressed as a percentage of the
average of all repeated values [Tip A4].
Lack/
Extent of
interference or
contamination
All
Clean the probe before and after each
use and never let it dry dirty, promptly
wash off any Standard materials used for
calibrations and accuracy checks, protect
sensors from harmful liquids or vapors.
In situ: Measure in stream before moving sensor (or measure in bucket with
stream water), then move, clean, return
to stream/bucket, measure again. After
retrieval: Conduct two-point accuracy
check w Standards at zero and at high
end of expected range, before and after
cleaning the probe.
Document sensor fouling with a digital
camera and inspection records before
cleaning [Tip A5]. Record Instrument readings in situ (or bucket), or in
Standard, before and after probe fouling
removal.
Calculate fouling error (bias) as the
difference between the reading of the uncleaned sensor and the cleaned sensor,
expressed as a percent of the reading
after cleaning [Tip A2].
Continued on Reverse...
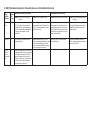
Continued from Front General:
Data
Quality
Aspect
Mode
(See
Notes)
All Sensors
Quality Assurance Actions
Affect (Control, act to influence the
Documentation Actions
Check (Test to evaluate or verify)
Report (Communicate the data quality
indicator)
Validity:
instrument
is functional
All
Protect sensors, probes, display-units,
& consoles from extreme temperatures,
shocks, and solar radiation.
Observe response in changing conditions
[Tips A6-A7].
Validity:
within
working
range
All
Select the appropriate probe or 'gain' for
the anticipated environmental range of
values. [Comment A3]
For Turbidity: Check if results are below
the max. value that can be reported by
the instrument (as determined by holding
a lint-free cloth over the optical sensor
and recording the turbidity).
Take your measurement only after the
reading stabilizes.
Observe reading (the time length will be
short for some probes, and few minutes
for others).
Validity:
response
rate
Record (Keep everything documented)
outcome)
Several readings that move both up and
down.
Narrative
Number of matches and number of
mismatches
Calculate % match, i.e., the number of
matching result pairs, expressed as a
percentage of all result pairs.
Program the device to log a measurement after sufficient time.
Correctness
Have the scribe call the result back to the If results were also logged automatically,
instrument reader and verify they entered compare data captured on field data
the correct number into the correct box in sheet to same data in the logger file.
the data sheet.
General: Tips & Comments
[Tip A1] The word "compensation" is used here for all kinds of readings adjustments for specific temperature, pressure, or salinity. The word "correction" is only used for adjustments of Results to correct for fouling and/or drift error.
[Tip A2] Corrections for fouling and drift error are not within the scope of this matrix, and users should seek further guidance. In any case, if the dataset
has been corrected for fouling or drift, it should be communicated clearly.
[Tip A3] Measurement bias (or the extent of inaccuracy) is often reported as a percentage, by different terms such as percent bias, percent accuracy,
or relative percent error (RPE). All of these terms mean the same thing: the difference of an Instrument’s reading from the known value, expressed as
percent of the known value.
[Tip A4] Precision can be reported as (1) standard deviation (SD), or as (2) relative percent difference (RPD), or as (3) relative standard deviation
(RSD) a.k.a. coefficient of variations (%CV), depending on the number of repeated measurements and the requirements of the data management
system or the Program.
[Tip A5] Photographic records of fouling and inspection records should be kept with all data files, and may be used to disqualify data.
[Tip A6] Faulty temperature sensor will invalidate all DO, salinity, specific conductivity, pH data, and depth data.
[Tip A7] Faulty conductivity sensor will invalidate all DO, salinity, specific conductivity, and depth data.
[Comment A1] This may be relevant only to DO and pH.
[Comment A2] Many Accuracy checks and all Precision checks cannot be performed in the ‘Cal’ mode.
[Comment A3] In a few cases you can test a diluted sample, but dilution is meaningless (and may alter the tested property) for most ‘vital signs’.
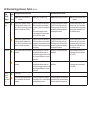
2. Temperature Sensors: Thermistor or RTD
Data
Quality
Aspect
Accuracy/
Bias
Precision
Lack of
interference or
contamination
Mode Quality Assurance Actions
(See
Affect (Control, act to influence the
Notes)
outcome)
[Tip T1]
Documentation Actions
Check (Test to evaluate or verify)
Record (Keep everything documented)
Report (Communicate the data quality
indicator)
Take your measurement only after the
reading stabilizes.
Field thermometer and sonde thermistor:
Conduct three-point accuracy check in
the lab, at the minimum, mid-value, and
maximum of the expected range, once
per year, using NIST-certified thermometer [Tip T2] with 0.1 C [Tip T3] resolution.
[Tip T4]
Average of three repeated measurements, the "true" value of NIST Standard,
and the specified accuracy of the NIST
Standard.
Report bias: Maximal Instrument drift or
difference from "true" value, expressed
in measurement units.
Take your measurement only after the
reading stabilizes.
Sonde thermistor: Conduct three-point
accuracy check at min/mid/max values
of expected range, using a NIST-certified
thermometer in the lab, before leaving for
deployment [Tip T5]. Conduct one-point
accuracy check against the field thermometer in the field, at stream temperature, before installation and during every
maintenance event.
Conduct one-point accuracy check in the
lab, at room temperature, using a NISTcertified thermometer, immediately after
retrieval.
Average of three repeated measurements, the "true" value of NIST standard,
and the specified accuracy of the NIST
standard.
Report bias: Maximal Instrument drift or
difference from "true" value, expressed
in measurement units.
Use consistent procedures under same
conditions.
Repeat measurements 3-5 times after the Results of the 3-5 measurements after
reading has stabilized, under controlled
stabilization;.
(non-changing) environment in the lab,
and during every calibration or accuracy
check event.
Compute the standard deviation of the
3-5 values and report in measurement
units [Tip T6].
Use consistent procedures under same
conditions.
Repeat measurements 3-5 times after the Results of the 3-5 measurements after
reading has stabilized, under controlled
stabilization.
(non-changing) environment in the lab,
and during every calibration or accuracy
check event.
Compute the standard deviation of the
3-5 values and report in measurement
units [Tip T6].
Clean probes.
Clean probes [Comment T1].
Temperature Sensors: Tips & Comments
[Tip T1] RTD (Resistance Temperature Detectors) measure temperature-related changes in resistance of a long, fine wire wrapped around a ceramic
rod.
[Tip T2] The NIST thermometer needs to be re-certified every two years.
[Tip T3] Resolution of 0.1 C is mandatory because the thermistor readings are used for temperature compensation in all other sensors on the sonde.
[Tip T4] Always conduct an accuracy check after the instrument fell or was hit by an object.
[Tip T5] Verify current NIST-certified or NIST-traceable certification (of sonde sensor and field thermometer) every time.
[Tip T6] Precision can be reported as (1) standard deviation (SD), or as (2) relative percent difference (RPD), or as (3) relative standard deviation
(RSD) a.k.a. coefficient of variations (%CV), depending on the number of repeated measurements and the requirements of the data management
system or the Program.
[Comment T1] Assumption: Temperature sensors are less impacted by fouling than other sensors.
3. Specific Conductance Sensors: Conductivity Cell
Data
Quality
Aspect
Accuracy/
Bias
Precision
Lack of
interference or
contamination
Mode
(See
Notes)
Quality Assurance Actions
Affect (Control, act to influence the
Documentation Actions
Check (Test to evaluate or verify)
Record (Keep everything documented)
outcome)
Report (Communicate the data quality
indicator)
Conduct one-point calibration in the lab,
at a value in the middle of anticipated environmental range, at room temperature
[Tips SP1-SP3], before each trip.
Conduct two point calibration in the field,
at values that bracket expected range, at
stream temperature, before first use of
the day.
Make sure the probe is properly hydrated
before calibration and before each use;
assure sufficient voltage.
Conduct a one-point accuracy check in
the lab, at a mid-range value, at room
temperature [Tip SP2], within 24 hours of
trip's end.
Temperature of standard, instrument conductivity reading, temperature compensation factor (if needed), and "true" value of
standard
Report bias: Instrument drift, i.e., difference from known ("true") value of
Standard, expressed either in measurement units or as percent of Standard's
"true" value, whichever is higher.
Conduct two-point calibration in the lab,
at zero and at value higher than expected
range, at room temperature, before
deployment and at every maintenance
event (if needed)
Conduct three-point accuracy check, with
Standards at min/mid/max values of expected range, plus a zero check in air, at
room or field temperature, within 24 hrs of
retrieval and at every maintenance event,
before and after cleaning.
Temperature of standard, instrument conductivity reading, temperature compensation factor (if needed), and "true" value of
standard.
Report bias: Instrument drift, i.e., difference from known ("true") value of
Standard, expressed either in measurement units or as percent of Standard's
"true" value, whichever is higher.
Use consistent procedures under same
conditions.
Repeat measurements 3-5 times after the Results of the 3-5 measurements after
reading has stabilized, under controlled
stabilization.
(non-changing) environment in the lab,
during every calibration or accuracy
check event.
Compute the standard deviation of the
3-5 values and report in measurement
units [Tip SP4].
Clean probes.
Clean probes, treat with anti-fouling
agents, adjust deployment duration or
maintenance intervals to local conditions.
Run fouling comparison test. Measure
stream water (in situ or in bucket) before
and after cleaning the probe.
Pre-cleaning inspection and photographic
records of fouling. Instrument readings
before and after probe fouling removal.
Specific Conductance Sensors: Tips & Comments
[Tip SP1] It may be beneficial to conduct calibrations and accuracy checks at 25 C, even if the sensor has automatic temperature compensation.
[Tip SP2] Always rinse sensors twice with standard prior to performing checks and calibrations.
[Tip SP3] Calibrating linear conductivity sensors is best done with a strong conductivity signal (i.e., 1,000 uS/cm or higher); above this value choose a
standard that is close to your expected values.
[Tip SP4] Precision can be reported as (1) standard deviation (SD), or as (2) relative percent difference (RPD), or as (3) relative standard deviation
(RSD) a.k.a. coefficient of variations (%CV), depending on the number of repeated measurements and the requirements of the data management
system or the Program.
4A. Dissolved Oxygen Sensors: Electro-chemical
Data
Quality
Aspect
Accuracy/
Bias
Precision
Lack of
interference or
contamination
Mode
(See
Notes)
Quality Assurance Actions
Affect (Control, act to influence the
Documentation Actions
Check (Test to evaluate or verify)
Record (Keep everything documented)
outcome)
Report (Communicate the data quality
indicator)
Conduct a two-point calibration in the
lab, at zero [Tip DO1] and at 100% air or
water saturation, at room temperature,
before each Trip. Conduct a one-point
calibration in the field, at 100% saturation, at ambient temperature, before first
measurement of each monitoring day.
Re-calibrate if the elevation change between sites is >500m. Re-calibrate after
Power Off/On if needed [Tip DO2]
Conduct a one-point accuracy check in
the field, at 100% air or water saturation, at ambient temperature, after each
site (i.e., before the next site). Conduct
a one-point accuracy check in the lab,
at 100% air or water saturation, at room
temperature, within 24 hrs of monitoring day's end, and after Power Off/On if
needed [Tip DO2]
Run periodic comparisons of instrument's readings to DO values as determined by the Winkler titration.
Temperature and atmospheric pressure
[Tip DO3], Instrument DO reading in
mg/L, and looked-up DO saturation (in
mg/L) at that temperature and atmospheric pressure.
Report bias: Instrument drift, i.e., difference from known ("true") value of Standard, expressed either in measurement
units or as percent of Standard's "true"
value, whichever is higher.
Conduct a two-point calibration in the
lab, at zero [Tip DO1] and at 100% air or
water saturation, at room temperature,
before each deployment.
Conduct one-point calibration in the field,
at 100% air or water saturation, during
every maintenance event if needed, at
ambient field temperature.
Conduct a two-point accuracy check in
the field, at zero [Tip DO1] and 100% air
or water saturation, at ambient temperature, during every maintenance event,
before and after cleaning.
Conduct a one-point accuracy check in
the lab, at 100% air saturation, at room
temperature, within 24 hours of retrieval,
before and after cleaning.
Temperature and atmospheric pressure
[Tip DO3], Instrument DO reading in
mg/L, and looked-up DO saturation (in
mg/L) at that temperature and atmospheric pressure.
Report bias: Instrument drift, i.e., difference from known ("true") value of Standard, expressed either in measurement
units or as percent of Standard's "true"
value, whichever is higher.
Use consistent procedures under same
conditions.
Repeat measurements 3-5 times after
Results of the 3-5 measurements after
the reading has stabilized, under constabilization.
trolled (non-changing) environment in the
lab, during every calibration or accuracy
check event.
Compute the standard deviation of the
3-5 values and report in measurement
units.
Clean probes.
Clean probes, adjust deployment duration or maintenance intervals to local
conditions.
Run fouling comparison test. Measure
stream water (in situ or in bucket) before
and after cleaning the probe.
Pre-cleaning inspection and photographic records of fouling, instrument readings
before and after probe fouling removal.
Dissolved Oxygen Sensors: Tips & Comments
[Tip DO1] Prepare the "Zero DO solution" fresh each day by dissolving 1 gram sodium sulfite and a few crystals of cobalt chloride in 1 liter deionized
water.
[Tip DO2] Powering off may cause loss of calibration in some instruments; check manufacturer’s instruction and avoid powering off between sites if
needed.
[Tip DO3] Verify that the built-in thermistor has been certified within the last 4 months. Accuracy of barometers needs to be checked once a year.
[Tip DO4] Methods include excitation/fluorescence and recording of quenching, either of the intensity or of the lifetime of the fluorescence signal.
Probe brand names include LDO, ROX, ODO, RDO, OPTODE, OPTRODE, and D-OPTO (list updated 7/24/09).
[Tip DO5] A two-point calibration, at zero and 100% saturation, is recommended only if the sensor will be used in anoxic or low-oxygen environments.
[Tip DO6] Precision can be reported as (1) standard deviation (SD), or as (2) relative percent difference (RPD), or as (3) relative standard deviation
(RSD) a.k.a. coefficient of variations (%CV), depending on the number of repeated measurements and the requirements of the data management
system or the Program.
4B. Dissolved Oxygen Sensors: Optical [Tip DO4]
Data
Quality
Aspect
Accuracy/
Bias
Precision
Lack of
interference or
contamination
Mode
(See
Notes)
Quality Assurance Actions
Affect (Control, act to influence the
Documentation Actions
Check (Test to evaluate or verify)
Record (Keep everything documented)
outcome)
Report (Communicate the data quality
indicator)
Keep the sensor hydrated at all times.
Conduct a one-point calibration in the
lab, at 100% air saturation, at room temperature, before each trip [Tip DO5]
Conduct a one-point accuracy check, at
100% air saturation, at room temperature, within 24 hours of monitoring day’s
end.
Run periodic comparisons of instrument’s readings to DO values as determined by the Winkler titration.
Temperature and atmospheric pressure
[Tip DO3, Previous Page], Instrument
DO reading in mg/L, and looked-up DO
saturation (in mg/L) at that temperature
and atmospheric pressure
Report bias: Instrument drift, i.e., difference from known (“true”) value of standard, expressed either in measurement
units or as percent of standard’s “true”
value, whichever is higher.
Keep the sensor hydrated at all times.
Conduct a one-point calibration in the
lab, at 100% air saturation, at room temperature, before each deployment.
Conduct a one-point accuracy check, at
100% air saturation, at room or ambient
temperature, at every maintenance event
and within 24 hrs of retrieval, before and
after cleaning.
Temperature and atmospheric pressure
[Tip DO3 Previous Page], Instrument
DO reading in mg/L, and looked-up DO
saturation (in mg/L) at that temperature
and atmospheric pressure.
Report bias: Instrument drift, i.e., difference from known (“true”) value of Standard, expressed either in measurement
units or as percent of Standard’s “true”
value, whichever is higher.
Use consistent procedures under same
conditions.
Repeat measurements 3-5 times after
Results of the 3-5 measurements after
the reading has stabilized, under constabilization.
trolled (non-changing) environment in the
lab, during every calibration or accuracy
check event.
Compute the standard deviation of the
3-5 values and report in measurement
units [Tip DO6].
Use consistent procedures under same
conditions
Repeat measurements 3-5 times after
Results of the 3-5 measurements after
the reading has stabilized, under constabilization.
trolled (non-changing) environment in the
lab, during every calibration or accuracy
check event.
Compute the standard deviation of the
3-5 values and report in measurement
units [Tip DO6].
Clean probes.
Clean probes, adjust deployment duration or maintenance intervals to local
conditions.
Run fouling comparison test. Measure
stream water (in situ or in bucket) before
and after cleaning the probe.
Pre-cleaning inspection and photographic records of fouling, instrument readings
before and after probe fouling removal.
Dissolved Oxygen Sensors: Tips & Comments
[Tip DO1] Prepare the "Zero DO solution" fresh each day by dissolving 1 gram sodium sulfite and a few crystals of cobalt chloride in 1 liter deionized
water.
[Tip DO2] Powering off may cause loss of calibration in some instruments; check manufacturer’s instruction and avoid powering off between sites if
needed.
[Tip DO3] Verify that the built-in thermistor has been certified within the last 4 months. Accuracy of barometers needs to be checked once a year.
[Tip DO4] Methods include excitation/fluorescence and recording of quenching, either of the intensity or of the lifetime of the fluorescence signal.
Probe brand names include LDO, ROX, ODO, RDO, OPTODE, OPTRODE, and D-OPTO (list updated 7/24/09).
[Tip DO5] A two-point calibration, at zero and 100% saturation, is recommended only if the sensor will be used in anoxic or low-oxygen environments.
[Tip DO6] Precision can be reported as (1) standard deviation (SD), or as (2) relative percent difference (RPD), or as (3) relative standard deviation
(RSD) a.k.a. coefficient of variations (%CV), depending on the number of repeated measurements and the requirements of the data management
system or the Program.
5. pH Sensors: Hydrogen-Ion Electrode
Data
Quality
Aspect
Accuracy/
Bias
Precision
Lack of
interference or
contamination
Mode
(See
Notes)
Quality Assurance Actions
Affect (Control, act to influence the
Documentation Actions
Check (Test to evaluate or verify)
Record (Keep everything documented)
outcome)
Report (Communicate the data quality
indicator)
Conduct two-point calibration in the lab,
w Standard Buffers at pH 7 and pH 10
(or pH 4), at room temperature, before
each trip.
Conduct two-point calibration in the field,
at pH 7 and pH 10 (or pH 4), at stream
temperature, before measurements at
each site [Tip pH1]
Calibrate after Power Off/On if needed
[Tip pH2].
Conduct a two-point accuracy check in
the lab, w standard buffers at pH 7 and
pH 10 (or pH 4), at room temperature,
within 24 hours of trip’s end, and after
Power Off/On if needed [Tip pH2].
For each pH, record instrument reading
before adjustment, temperature of standard, and “true” value of standard.
Report bias: maximal Instrument drift or
difference from “true” value, expressed in
measurement units
Conduct a two-point calibration in the
lab, at pH 7 and pH 10 (or pH 4), at room
temperature, before each deployment.
Conduct a three-point calibration in
the field, at pH 4,7, and 10, at stream
temperature, during every maintenance
event if needed.
Conduct a three-point accuracy check at
pH 4,7, and 10, at stream temperature,
during every maintenance event, before
and after cleaning. Conduct a two-point
accuracy check, at pH 7 and 10, at room
temperature, within 24 hrs of retrieval,
before and after cleaning.
For each pH, record instrument reading
before adjustment, temperature of standard, and “true” value of standard.
Report bias: Maximal instrument drift or
difference from “true” value, expressed in
measurement units.
Use consistent procedures under same
conditions.
Repeat measurements 3-5 times after
Results of the 3-5 measurements after
the reading has stabilized, under constabilization;
trolled (non-changing) environment in the
lab, during every calibration or accuracy
check event.
Compute the standard deviation of the
3-5 values and report in measurement
units [Tip pH3].
Clean probes.
Clean probes, treat with anti-fouling
Run fouling comparison test. Measure
agents, adjust deployment duration or
stream water (in situ or in bucket) before
maintenance intervals to local conditions. and after cleaning the probe.
Pre-cleaning inspection and photographic records of fouling. Instrument readings
before and after probe fouling removal.
pH Sensors: Tips and Comments
[Tip pH1] For pH measurements of low-conductivity waters, obtain low ionic-strength buffers.
[Tip pH2] Powering off may cause loss of calibration in some instruments; check manufacturer’s instruction and avoid powering off between sites, or
re-calibrate, if needed.
[Tip pH3] Precision can be reported as (1) standard deviation (SD), or as (2) relative percent difference (RPD), or as (3) relative standard deviation
(RSD) a.k.a. coefficient of variations (%CV), depending on the number of repeated measurements and the requirements of the data management
system or the Program.
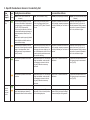
6. Turbidity Sensors: Light-Scattering
Data
Quality
Aspect
Accuracy/
Bias
Precision
Lack of
interference or
contamination
Mode
(See
Notes)
Quality Assurance Actions
Affect (Control, act to influence the
Documentation Actions
Check (Test to evaluate or verify)
Record (Keep everything documented)
outcome)
Report (Communicate the data quality
indicator)
Follow manufacturer’s instructions
and use only their recommended
standards [Tip TU1]. At a minimum,
conduct a three-point calibration in the
lab, using freshly-diluted standards
at zero, mid-range, and high end of
expected environmental range, at room
temperature, before each trip. [Tip TU3]
Conduct a two-point accuracy check in
the lab, using manufacturer’s verification
standards, at zero and at high end of
environmental range, within 24 hours of
trip’s end. Conduct a one-point accuracy
check in the field, using manufacturer’s
verification standards at mid-range
value, at stream temperature, before
measurements at each site.
Run periodic comparisons with other
methods.
For each standard, record instrument
turbidity reading, in the technologydesignated measurement unit [Tip
TU2], and “true” value of standard.
Report maximal bias: Bias is computed
for each standard as the percent difference between readings before calibration
and readings at the same range after
calibration.
Follow manufacturer’s instructions and
use only their recommended standards
[Tip TU1]. At a minimum, conduct a
three-point calibration in the lab, using
freshly-diluted standards at zero, midrange, and high end of expected environmental range, at room temperature,
before deployment. Conduct a two-point
calibration in the field, at min and max
of range, at stream temperature, during
every maintenance event if needed.
Conduct a three-point accuracy check in
the field, using manufacturer’s verification standards at min/mid/max values
of range, at stream temperature, during
every maintenance event, before and
after cleaning.
Conduct a three-point accuracy check in
the lab, using manufacturer’s verification standards at min/mid/max values
of range, at room temperature, within
24 hours of retrieval, before and after
cleaning.
For each standard, record instrument
turbidity reading, in the technologydesignated measurement unit [Tip TU2],
and “true” value of standard.
Report maximal bias: Bias is computed
for each standard as the percent difference between readings before calibration
and readings at the same range after
calibration.
Use consistent procedures under same
conditions
Repeat measurements 3-5 times after
Results of the 3-5 measurements after
the reading has stabilized, under constabilization.
trolled (non-changing) environment in the
lab, during every calibration or accuracy
check event.
Compute the standard deviation of the
3-5 values and report in measurement
units [Tip TU4].
Conduct a pre-cleaning visual inspection
and take pictures [Tip TU4].
Conduct two-point accuracy check, at
zero and at high end of expected range,
before and after cleaning the probe.
Calculate “fouling drift” as the percent
difference between the calibrant reading
of the uncleaned sensor and the cleaned
sensor.
Clean probes.
Clean probes often, treat with anti-fouling agents, adjust deployment duration
or maintenance intervals to local conditions, verify functionality and correct
parking of wipers.
Visual inspection records and picture IDs
[Tip TU5.]
Record instrument readings in standard
before and after probe fouling removal.
Turbidity Sensors: Tips and Comments
The QA Matrix refers only to dynamic turbidity sensors (where the sample moves over the sensor).
[Tip TU1] Because of the immense variability in the light-scattering properties of natural waters, there is no universal standard for turbidity that can
represent a "true" value. Moreover, there is a huge variability in turbidity sensors’ structure, performance, and response to various light-scattering particles in water. It is important to use the manufacturers' standards to achieve the specified performance of the sensor. Please see the Turbidity Addendum document for more information.
[Tip TU2] Turbidity sensors vary widely in their light source, detectors’ angles, and number of detectors and light sources. Each combination of these
factors is associated with a specific technology-designated measurement unit that must be used for reporting turbidity values. Please see the Turbidity
Addendum document for more information.
[Tip TU3] Turbidity sensors often report negative values in crystal-clear waters; this is due to traces of turbidity in the zero calibration standard.
[Tip TU4] Precision can be reported as (1) standard deviation (SD), or as (2) relative percent difference (RPD), or as (3) relative standard deviation
(RSD) a.k.a. coefficient of variations (%CV), depending on the number of repeated measurements and the requirements of the data management
system or the Program.
[Tip TU5] Inspection records and/or pictures may be used to disqualify data. Photographic records of fouling on and around the sensors is extremely
useful for data interpretation and QA, and must be kept with the data files.
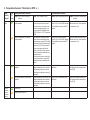
7. Depth Sensors: Pressure Transducers (Non-vented or Vented, [Tip DE 1])
Data
Quality
Aspect
Accuracy/
Bias
Precision
Lack of
interference or
contamination
Mode
(See
Notes)
Quality Assurance Actions
Affect (Control, act to influence the
Documentation Actions
Check (Test to evaluate or verify)
Record (Keep everything documented)
outcome)
Report (Communicate the data quality
indicator)
Conduct one-point calibration [Tip DE2]
at the site, at ambient atmospheric pressure in air, at ambient temperature, at
the intended sonde orientation, before
each measurement [Tip DE3].
Conduct one-point accuracy check at the Record the ambient barometric pressure,
site, at ambient atmospheric pressure in the temperature, the orientation, and the
air, at ambient temperature, at the field
instrument’s reading.
use sonde orientation, at the site visit’s
end.
Conduct one-point calibration [Tip DE2]
at the site, at ambient atmospheric pressure in air, at ambient temperature, at
the intended sonde orientation, before
each deployment [Tip DE4].
Conduct one-point accuracy check at
the site, at ambient atmospheric pressure in air, at ambient temperature, at
the deployment sonde orientation, upon
retrieval.
Use consistent procedures under same
conditions.
Repeat measurements 3-5 times after
Results of the 3-5 measurements after
the reading has stabilized, under constabilization.
trolled (non-changing) environment in the
lab, during every calibration or accuracy
check event.
Compute the standard deviation of the
3-5 values and report in measurement
units [Tip DE5].
Record the ambient barometric pressure, Report bias: Instrument drift, i.e., differthe temperature, the orientation, and the ence from known (“true”) atmospheric
instrument’s reading.
pressure, expressed either in measurement units or as percent of known (“true”)
atmospheric pressure, whichever is
higher.
Keep the depth-sensor’s port unobstructed at all times. Vented: keep vent
and inner chamber dry and watertight
[Tip DE6]
Keep the depth-sensor’s port unobstruct- Conduct a one-point accuracy check in
ed at all times (clean it immediately after water upon retrieval, before and after
retrieval); coat it with anti-fouling paint
cleaning the port.
if needed. Vented: keep vent and inner
chamber dry and watertight [Tip DE6].
Report bias: Instrument drift, i.e., difference from known (“true”) atmospheric
pressure, expressed either in measurement units or as percent of known (“true”)
atmospheric pressure, whichever is
higher.
Instrument’s reading before and after
cleaning.
Depth Sensors: Tips and Comments
Standard (non-vented) pressure transducers (a.k.a. depth sensors) have an opening to the water column on one side and vacuum on the opposite side;
they do not ‘sense’ the atmospheric (barometric) pressure, and their measurement results must be post-processed to correct for barometric pressure at
each point in time. However, they can be deployed anywhere for continuous monitoring without a cable.
Vented pressure transducers (a.k.a. level sensors) have an opening to the water column on one side and an opening to the atmosphere on the opposite
side; they keep ‘sensing’ the atmospheric (barometric) pressure and subtracting it from the total (barometric plus hydrostatic) pressure, so the measurement results reflect the true depth, However, they must always be used/deployed with a venting cable that leads to a humidity-free inner chamber.
[Tip DE1] Vented Depth probes must be connected via a vented cable at all times and have active desiccant in the inner chamber.
[Tip DE2] Depth sensors’ slopes are calibrated by the manufacturers, but it is always necessary to ‘zero’ the sensor’s reading to ambient conditions by
adding the depth offset at the ambient barometric pressure (and the elevation offset if needed).
[Tip DE3] A Depth measurement Result of a non-vented sensor reflects the sum of barometric pressure and hydrostatic pressure (head), and must be
post-processed, i.e. corrected for the real barometric pressure, at each measurement’s time.
[Tip DE4] Continuous Depth measurements must be post-processed, i.e., corrected with continuous barometric pressure measurements (captured at
the same elevation) for each logging point in time.
[Tip DE5] Precision can be reported as (1) standard %deviation (SD), or as (2) relative percent difference (RPD), or as (3) relative standard deviation (RSD) a.k.a. coefficient of variations (%CV), depending on the number of repeated measurements and the requirements of the data management
system or the Program.
[Tip DE6] To keep vents dry and watertight, replace desiccant before expiration date, and check/lubricate O-rings in cable and bulkhead connectors
very often.
8. ORP (Oxidation Reduction Potential) Sensors: Noble Metal Electrode
Quality Assurance Actions
Documentation Actions
Data
Quality
Aspect
Mode
(See
Notes)
Accuracy/
Bias
All
Clean electrode, with aqua regia [Tip
OR1] if needed. Use submersible
equipment for in-situ measurements.
Conduct flowthrough measurements
in oxygen-impermeable, airtight
equipment.
Conduct one-point accuracy check
with standard, Zobell’s Solution [Tip
OR2], at room temperature, before
and after field use.
Precision
All
Use consistent procedures under
same conditions.
Repeat measurements 3-5 times
Results of the 3-5 measurements
after the reading has stabilized, under after stabilization.
controlled (non-changing) environment in the lab, during every calibration or accuracy check event.
Lack of
interference or
contamination
All
Avoid prolonged exposure of probe to
hydrogen sulfide. Avoid moving probe
from Zobell’s solution into iron-rich
waters. Be aware of the effects of
chromium, vanadium, and other ions
that are stronger reducing agents
than hydrogen or platinum.
Affect (Control, act to influence the
Check (Test to evaluate or verify)
Record (Keep everything documented)
outcome)
Report (Communicate the data quality
indicator)
Record the type of reference electrode being used, the solution’s temperature, the observed mV potential
of the Zobell’s solution (emf), and the
(looked-up) mV potential of the reference electrode (Eref).
Calculate the difference, in mV,
between Eh theoretical value and the
observed Eh (emf plus Eref) in the
Zobell’s solution.
Compute the standard deviation of
the 3-5 values and report in measurement units [Tip OR3].
ORP Sensors: Tips and Comments
Oxidation-reduction potential (ORP), a.k.a Reduction-Oxidation-Redox- potential (Eh) can delineate qualitatively strong redox gradients; for example,
those found in stratified lakes and rivers with an anaerobic zone, in an oxidized surface flow that becomes anaerobic after passing through stagnant
organic-rich systems, and in mine-drainage discharges. [GS nfm 6.5 p.18]
[Tip OR1] To prepare the aqua regia, mix 1 volume concentrated nitric acid with 3 volumes of concentrated hydrochloric acid.
[Tip OR2] Standard Zobell’s Solution can be prepared in the lab periodically by a skilled analyst.
[Tip OR3] Precision can be reported as (1) standard deviation (SD), or as (2) relative percent difference (RPD), or as (3) relative standard deviation
(RSD) a.k.a. coefficient of variations (%CV), depending on the number of repeated measurements and the requirements of the data management
system or the Program.