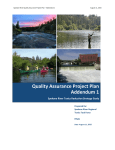
1
Design and Application of a Remote Water Quality and Quantity Lab for Research and Education Chelsea N. Green Report submitted to the Faculty of the Virginia Polytechnic Institute and State University in partial fulfillment of the requirements for the degree of Master of Science in Civil Engineering Vinod K. Lohani, Chair William E. Cox Tamim Younos April 28, 2011 Blacksburg, Virginia Abstract A real-time water and weather monitoring system will be implemented on Virginia Tech’s campus in 2011. The system, called the LabVIEW Enabled Watershed Assessment System (LEWAS) Laboratory, will use LabVIEW as the primary data processing software for water quality parameters, flow, and weather measurements. Data will be collected using a variety of sensors and transmitted in real-time via wireless internet. It will be able to sample as often as multiple times per second and will not require field visits to download data or alter sampling frequency. All parameters will be accessible through a web-publishing tool. The data can be used for research, education, and design applications in water resources engineering. The design of the system required comprehensive planning and interdisciplinary collaboration. Methods and rationale for site and equipment selection and construction are discussed. Specific equipment includes a water quality sonde (measures pH, dissolved oxygen, water temperature and conductivity), a flow meter and a weather station. Testing and calibration techniques for all equipment are outlined. As of April 11, 2011, a total of $32,500 was spent on equipment and 800 estimated man-hours were contributed to LEWAS design. Potential applications of LEWAS for developing hands-on learning modules are discussed. A LEWAS-based activity has already been incorporated into a freshman level engineering course (Engineering Education) of approximately 1500-1600 students. Using the concept of LabVIEW’s Virtual Instruments (VIs), an interactive screen displays water data in real-time. The VI can be directly accessed and adjusted by students in real-time as part of an introduction to sustainability. Adjustments were made to sampling frequency, and instantaneous results were shown during class. Hands-on activities using LEWAS Lab data for two upper level courses are also proposed. Specific personal contributions to the interdisciplinary LEWAS Lab are also discussed. These include acting as the lead Civil Engineering design contact for the lab as well as instructing and incorporating LEWAS material into the freshman engineering course. 1 Acknowledgements Many individuals have contributed to this work and warrant recognition. I would like to sincerely thank my advisor, Dr. Vinod K. Lohani, for his input, support and guidance throughout the project. I would also like to thank Dr. William Cox and Dr. Tamim Younos for generously taking the time to serve on my committee. The project would have been impossible without the NSF Department-Level Reform and NSF/REU grants (DLR Grant 0431779 and NSF-REU Site Grant 0649070) that provided funding for the lab equipment. I would like to express my gratitude to all those who have worked in the LEWAS Lab. Specifically, thanks to Parhum Delgoshaei, a PhD student in EngE, for providing electrical and programming expertise to a Civil Engineering student. Thanks also to the undergraduate Lab members: Steve Holmes, Faizan Qureshi, Divyang Prateek, and Mike Sadowski for their hard work. Further thanks to all of the EngE 1024 instructors and graduate students who aided in the implementation of the water quality module and to the Engineering Education department for funding my work as a Teaching Assistant for the course. Finally, thank you to my family and friends for supporting me throughout all my years of education. 2 Table of Contents Abstract................................................................................................................................................................. 1 Acknowledgements .............................................................................................................................................. 2 Introduction ......................................................................................................................................................... 4 Review of Literature ............................................................................................................................................. 6 Laboratory Design ............................................................................................................................................... 9 Preparation ....................................................................................................................................................... 9 Equipment .......................................................................................................................................................... 10 Water Quality Sonde ..................................................................................................................................... 10 Flow Meter and Weather Station .................................................................................................................. 12 Power and Data Storage ................................................................................................................................ 12 Software and Mounting Devices.................................................................................................................... 13 Equipment Calibration ...................................................................................................................................... 13 pH Calibration ........................................................................................................................................... 15 Dissolved Oxygen Calibration................................................................................................................... 15 Conductivity Calibration ............................................................................................................................ 14 Sonde Maintenance ....................................................................................................................................... 16 Flow Meter Calibration ............................................................................................................................. 16 Installation .......................................................................................................................................................... 17 Educational Experimentation ............................................................................................................................ 22 Example 1: Engineering Exploration (EngE 1024) ..................................................................................... 22 Example 2: Intro to Environmental Engineering (CEE 3104).................................................................... 24 Mass Balance Workout Problem ............................................................................................................. 24 Example 3: Hydrology (CEE 4304) ............................................................................................................. 26 Runoff-Rainfall Ratio Workout Problem ................................................................................................. 27 Summary and Future Work .............................................................................................................................. 30 References .......................................................................................................................................................... 32 Appendix A: Outdoor Lab Pricing .............................................................................................................. 34 Appendix B: Outdoor Lab Drawings (Fall 2010, created by Mike Sadowski) .......................................... 38 Appendix C: Know your Watershed Worksheet........................................................................................ 42 3 Introduction The National Academy for Engineering (NAE) included “provide access to clean water” in its recent list of 14 grand challenges for engineering (NAE, 2011). The challenge requires engineers to consider two facets of water resources: supply and quality. Due to the expected increase in challenges surrounding water supplies (Cox, 2008), and the current limitations of water quality reports (Kaurish and Younos, 2007), there is a need for effective monitoring of quantity and quality. Water monitoring can be used to identify negative trends over time and to alert against pollution. Past methods of monitoring water resources have generally been costly and time consuming. They often required sending individuals to the field to physically measure parameters, or download records from a data storage device. After the data was acquired, it still needed to be processed for use. Additionally, samples collected at increments of once a month or even once a day provide limited insight into all of the characteristics of a body of water. Recently, engineers and scientists have begun to use real-time data collection instead of field sampling. Real-time refers to data that is collected and processed simultaneously to its natural occurence. The USGS, for example, now provides publicly available, “real-time” data for stream gages across the United States (USGS, 2011). However, the USGS data is not accessible until at least one hour after it is recorded and the lowest sampling increment is fifteen minutes. Though real-time data is starting to become more prevalent for applications such as the USGS, it is hardly used to discuss water sustainability topics in education. Driven by the available real-time technology, and the need for sustainability education, a LabVIEW Enabled Watershed Assessment System (LEWAS) Lab was developed on Virginia Tech’s campus. The Lab will provide high resolution water monitoring capabilities and can be used to introduce water resources concepts to all levels of engineering students. The LEWAS Lab will successfully integrate real-time monitoring with in-house developed software in a LabVIEW environment, a relatively un-explored discipline. Users will be able to remotely dial into sampling instruments and control them from anywhere with internet access. Virtual controls will be used to save power, optimize sampling rate, turn off instruments altogether, and determine when calibration is necessary. In addition to these time-saving benefits, no data or major changes in the aqueous environment will be missed by real-time sampling rates. 4 Stroubles Creek was chosen as the site of the lab because of its proximity to Virginia Tech campus buildings and environmental significance. The Creek flows through the Town of Blacksburg, then into a retention pond known as the Duckpond. After the stream leaves the pond it is designated as impaired by the Virginia Department of Environmental Quality (DEQ) (Stroubles, 2006). An impaired body of water is “too polluted or otherwise degraded to meet water quality standards” (EPA, 2011). Figure 1 shows the path of the impaired segment of Stroubles Creek. As required by the Clean Water Act (section 303(d)), the Total Maximum Daily Load (TMDL) was determined for Stroubles Creek (Stroubles Creek, 2006) by the Biological Systems Engineering Department at Virginia Tech. The TMDL is the maximum amount of pollutants that a waterbody can receive without exceeding water quality regulations (EPA, 2011). Some of the stressors of the stream include sedimentation, increased development, and stream channel modifications, in addition to others. As development continues on the Virginia Tech campus and in Blacksburg, it is important to monitor the changes in water quality and quantity. When changes occur, instantaneous access to data will allow for quicker responses to pollutants. Project Objectives This project addresses the following two objectives: i) testing and calibration of the LEWAS water sensors and ii) demonstrating the educational value of LEWAS data in a variety of engineering courses. Figure 1: Impaired Portion of Stroubles Creek (Stroubles Creek, 2006) 5 Review of Literature LEWAS Lab, once completed, will provide data that can be used for a variety of in-class and/or field laboratory activities. The goals of educational laboratories include enhancing mastery of the subject, developing scientific reasoning and developing practical skills. The importance of directly tying laboratory activities into lecture courses is also documented (NRC, 2006). Typical collegiate science courses are comprised of a lecture portion and a separate laboratory portion that may move at a pace unrelated to the lecture. A more effective methodology is relating hands-on activities directly to the subjects covered in lecture. Funding and space can also limit students’ laboratory experiences. In response to budget cuts, some schools use online laboratories to replace real laboratory experiences. Distance learning and online engineering courses are both becoming more prevalent and require the use of online laboratories. If online laboratories are going to replace real labs, it is important that they are of the same standard as real laboratories and are widely available so that students can access them anywhere (Bourne, 2005). Two online “laboratories” are commonly used for engineering education: virtual and remote. Virtual laboratories use computers to simulate realistic conditions whereas remote laboratories allow students to interact with real data via the internet (Nedic et al., 2003). Virtual laboratories are often used when money or space are the major constraints. These laboratories emulate traditional classroom equipment and procedures. Students are able to conduct experiments online with virtual instruments such as circuit boards. For example, they are sometimes used in the field of electrical engineering to reduce the cost of expensive materials such as breadboards. Figures 2 and 3 show example Electrical Engineering virtual labs. The laboratory in Figure 2 allows students at Johns Hopkins University to build virtual electrical circuits. Figure 3 shows a virtual lab that allows students to use a virtual equipment such as DC motors for experiments. 6 Figure 2: Virtual Circuits Laboratory: http://www.jhu.edu/virtlab/logic/logic.htm Figure 3: Virtual Laboratory Equipment: http://128.238.129.242/ Typical virtual laboratories are available through the websites of the developers, or accompany textbooks. This set-up provides educators or instructors with readily available lab assignments that they are unable to manipulate. While proprietary software and websites have their place, they do not allow for creativity, and force students through laboratory experiments at a pace that may be different than the lecture they attend. Developing a virtual laboratory in-house allows for increased flexibility. Using software that has a web-publishing feature also allows for activities to be available to anyone, anywhere. An in-house online laboratory can be tailored by individual instructors to fit the needs of specific courses and activities. The data can be used in conjunction with current lab activities or as a stand-alone replacement for some. Remote laboratories, like virtual laboratories, are readily available online. However, remote laboratories do not require students to use virtual equipment in order to acquire data. Remote 7 laboratories are comprised of a site that houses real equipment and monitors one or more parameters which are then relayed to a website. Students are more likely to use this type of data for research, data management and community education (Glasgo, 2004). LEWAS station and website will have the capacity to act as a remote laboratory for collecting water data. As previously stated, the USGS currently provides the broadest network of real-time water data. An overview of national stream data is available on the USGS website (http://waterdata.usgs.gov/nwis/rt). It provides both statewide and gage specific summaries. While the data is very thorough for water quantity, or flow rate, water quality data is much less abundant. Only a percentage of all of the gage sites include water quality data. Additionally, the real-time data provided is in the form of a daily mean summary rather than a constantly progressing graph of data as is expected from “real-time”. In addition to the USGS, Universities, small watershed committees, and municipalities have developed real-time sensor networks for their use. Table 1 provides a summary of some of these selected water monitoring practices. Table 1: Examples of Current Water Monitoring Practices Organization/ Location USGS (USGS, 2011) Miami University of Ohio (Fondriest, 2011) Utah State University (Utah, 2011) Malwai (Under Development) (Zennaro et al., 2009) University of Minnesota (Brezonik et al., 2007) Purpose Sensors Telemetry Government and Public Use Water Quality Sondes and Flow Meters Acoustic Doppler Satellite Research/ Education Water Quality Buoys Cellular Antenna Real-time Conservation Water Quality Sondes and Flow Meters 90-FLT Water Quality Sensor Radio Real-Time Watershed Group Website Wireless Internet – “Sun SPOT” networks, embedded network sensing Cellular Antenna/ Modem 60 Measurements per day (capable of 1 ever 1-300 seconds) 20 minutes Web Publishing Water Quality Monitoring in a Developing Nation (Improve Quality) Research/ Education Water Quality Sondes, Flow Meters, Rain Gages, Nutrient Analyzers 8 Sampling Interval 5-60 minute Display USGS website (http://waterdat a.usgs.gov/nwis/ rt) Website “Acquatic Classroom” Campus Network (once per day) Laboratory Design Preparation The first, and most critical, step in the design of the outdoor LEWAS laboratory was the site selection. A major factor in the selection was how the data would be communicated from the field to the internet, or the method of telemetry. Telemetry is usually accomplished in one of three ways: satellite, cellular, or wireless internet. Satellite systems require a webpage dedicated to receiving the data which is generally programmed by the manufacturer of the telemetry and is costly. Cellular services come at a cost of the service in the area and are likely to fluctuate. Wireless internet can be unreliable and reach only a narrow area. For this case, wireless internet was chosen for its broad availability on Virginia Tech’s campus. VT Wireless covers a broad range of classroom buildings and is free of cost to Virginia Tech faculty and students. The following criteria were identified for site selection: within reach of campus wireless cross section with > 1’ of flow (for accuracy of flow meter) space for a solar panel and antenna Based on these criteria, three sites were considered for the outdoor component of LEWAS and are shown in Figure 4. Site 1 is the outflow from Virginia Tech’s Duckpond, and is farthest from campus buildings. Sites 2 and 3 are locations of inflow into the pond that are both closer to campus buildings, but each have less overall flow than Site 1. 9 21 N 13 1 Figure 4: Potential Sites (Bing Maps) All of the chosen sites had at least one cross section that could satisfy the flow requirement. A group of two Engineering faculty and two graduate students visited each of these sites on two occasions to determine which would be most beneficial for an outdoor lab. Site 1 was quickly determined to be too far out of the reach of the Campus wireless, and was ruled out. Sites 2 and 3 both received adequate wireless service, but Site 2 was in an area less traveled by pedestrians, and therefore deemed safer for the equipment. Site 2 was also close enough to Hahn Hall that installing an antenna increasing the strength of the wireless signal to the site could be possible. When site 2 was officially chosen it also had to be approved by the campus architect. In order to seek this approval, a sample design was created, and the necessary approval was obtained. Equipment Water Quality Sonde Prior to the establishment of the outdoor laboratory, a Hydrolab MS5 Water Quality Sonde (Figure 5) was purchased for a Summer NSF/REU program. The Sonde has four “ports” that can be used to measure four water quality parameters; pH, dissolved oxygen, temperature and conductivity. The four parameters were chosen because of their individual importance to stream health. The pH level (which measures acidity) in a body of water affects various 10 Figure 5: MS 5 Sonde chemical and biological processes (EPA 2010). Most aquatic organisms need a pH range of 6.58.0 in order to survive. Fluctuations in pH could be a result of factors such as acid rain or geologic changes in the watershed. The second parameter, Dissolved Oxygen (DO) is a measure of the concentration of oxygen gas in water. Respiration by aquatic life, decomposition of organic matter, and runoff from urban and agricultural areas can deplete dissolved oxygen. Drops in DO levels can be stressors of aquatic life and an indicator of increased sediments or nutrients in the water (EPA, 2010). DO levels above 4-5 mg/L are desired in order to support aquatic life. A stream’s dissolved oxygen levels are also dependent upon water temperature. As the temperature of the water increases dissolved oxygen levels decrease. The temperature of the stream determines the rates at which chemical and biological processes occur. Aquatic organisms are dependent on specific temperature ranges for their optimal health (usually between 5-35°C). These vary based on specific species, but high temperatures can deplete DO and affect or kill sensitive species. The final parameter, conductivity, is a measure of water’s ability to pass an electrical current. Conductivity is an indicator of the concentration of dissolved solids in a stream. It typically ranges between 150-500 microsiemens per centimeter in healthy streams. The geology of the area through which a stream flows and salts associated with runoff play a key role in the conductivity levels. Studies have shown that conductivity can be an indicator of a stream’s response to urbanization (EPA, 2010). These parameters could be expanded in the future to fit the needs of the stream (Hach Company, 2006). Alternative parameters include turbidity, chlorophyll a, and ion-selective electrodes (to measure select nutrients). Each of these parameters can be measured at intervals as low as multiple times per second. In addition to the sonde, power cords were also purchased for RS-232 connectivity and increased length. A LabVIEW program was developed by an undergraduate student to process data collected by the sonde (Kenny et al., 2008). The program was developed primarily as a tool for teaching Data Acquisition concepts to freshmen engineering students. Water quality sondes are generally controlled by proprietary software, but the development of the LabVIEW program allows for broader access to the sonde, even when it is deployed. LabVIEW’s web publishing tool allows for the VI to be publicly available and altered. For example, the sampling rate of the sonde can be edited by anyone with access to the internet. 11 Flow Meter Water quantity data is also desired for the site. Since the various Stroubles Creek branches all have relatively shallow flow, the Sontek/YSI Argonaut –SW (Shallow Water) was chosen (Figure 6). The SW can accurately monitor flow in Figure 6: SonTek Flowmeter water depths as shallow as 1’ using Doppler technology. The user must specify the channel geometry, but otherwise the SW is ready to be deployed as soon as it is received. Weather Station A weather station was also purchased to record wind speed and direction, rainfall intensity and duration, barometric pressure and air temperature. The Vaisala Weather Transmitter WXT520 was chosen (Figure 7) because of its capacity to be integrated into LabVIEW and low power requirements. The Weather Station should be as far away from tall buildings or other obstructions as possible, to ensure accuracy of rainfall data. But, because the LEWAS site was chosen prior to the purchase of the Weather Station, an adjustment factor may need to be determined. This should be done by using data from the Blacksburg Figure 7: Vaisala Weather Station National Weather Service should be used for comparison. Power and Data Storage All of the LEWAS instruments will be powered by solar panels, and energy will be stored in batteries. Two (Power Up) solar panels will be used (Figure 8). The water quality sonde only requires the power of one panel, but the addition of flow and weather parameters increases the power requirements. The power calculations were done by Virginia Tech graduate student Parhum Delgoshaei who estimates the total equipment consumption to be around 15 Watts. Data that is collected will be stored and also wirelessly routed via a National Instruments (NI) compactRIO (cRIO). The cRIO (Figure 9) will act as both a data logger and a Figure 8: Power Up Solar Panel control mechanism for the system and is able to withstand rugged environments. It 12 Figure 9: NI cRIO has a modular design that allows for additional storage capacity and programming if future space requirements exceed current expectations (Lohani et al., 2009). A table of pricing and more manufacturer details for all of the equipment in this section can be found in Appendix A. Mounting Devices Additional materials for safe deployment of the sensors and power equipment were also purchased. The Nexsens AVSS Stainless Steel iSIC Enclosure (Figure 10) was chosen to house the data collection unit (cRIO). The enclosure was desirable for this application because it is resistant to vandalism (comes with individualized key) and weather. It will house the cRIO device and has room for a battery. The enclosure has holes that are pre-drilled for wiring and to attach conduits. An enclosure was also purchased for the sonde itself (Figure 11). It will protect the sonde from both vandalism and large debris. Figure 11: Protective Casing for Sonde Figure 10: Enclosure LabVIEW There is a substantial software component of the LEWAS lab. The NI software, LabVIEW allows for relatively simple interfacing between all types of measurement hardware. LabVIEW is able to acquire data from the sonde, flowmeter and weather station as well as alter internal hardware settings. Contrary to the typical idea of programming software, LabVIEW is visually based. It is designed for use in research and data acquisition and often used by scientists and engineers. The programming environment is based on data flow and can be followed in the same way as a flowchart. Each LabVIEW program is comprised of a “Front Panel” and “Block Diagram”; the former is a user interface and the latter is for programming. The Front Panel can be used to control instruments and view data by someone without programming or LabVIEW knowledge. It was chosen for this project for its ease of use, educational benefits and broad range of capabilities. 13 The software is also used to introduce programming to freshmen engineering students at Virginia Tech, which makes it ideal for research and educational applications. Equipment Calibration Before equipment is deployed, it must first be calibrated to ensure accuracy. For the sonde, specifically, calibration is done using the proprietary software, OTT’s Hydras 3. Since the sonde is comprised of individual probes, each is calibrated separately. The temperature probe is an exception, and requires no calibration. Calibration instructions from the manufacturer are provided for each of the remaining three parameters below (Hach, 2010). Calibration videos are also available for all of the sensors at Hach Environmental’s Website (http://www.hydrolab.com/web/ott_hach.nsf/id/pa_videos_and_transcripts.html). Conductivity Calibration The sonde has been calibrated, but will need to be calibrated again in the future. The optimum order for calibration is conductivity first, pH second and dissolved oxygen third. This is because the de-ionized water used to calibrate for conductivity can affect pH calibration and the dissolved oxygen membrane needs a minimum of four hours to soak. The temperature probe does not need to be calibrated. To begin calibration, the sonde is first connected to the proprietary software, Hydras 3LT. When the sonde finishes its initialization, the software is used to navigate to the calibration and SpCond tabs, respectively. The first calibration point is done with a dry sensor to establish a zero point. Then, the sensors is rinsed with de-ionized water and thoroughly dried. After the sensor has been rinsed, a value of ‘0’ should be entered and then the calibrate button should be pressed. A “Calibration successful” message will appear. Next, the storage cup is filled approximately 25% full with a conductivity standard higher than the highest expected value of the water at the deployment site (12.856 for Stroubles Creek). Then the cap is screwed on and the sonde is shaken for about six seconds. Then, the cap is emptied and filled again, this time so the conductivity cell is completely submerged. It takes about one minute for the readings to stabilize. When the readings are stable, the value of the standard is entered. A “Calibration successful” message appears. This calibration needs to be done before deployment. Extra buffer solutions may need to be ordered for its calibration. 14 pH Calibration Hydras 3LT is used for pH calibration as well. The pH sensors are first rinsed and dried. Then, the calibration cub is filled about 25% with pH buffer 7 shaken for six seconds. Then the buffer is poured out and re-filled to the top of the sensor. After the pH reading stabilize, the value of 7 is entered and the calibrate button is pressed. A “Calibration Successful” message will appear. Then, pour out the pH 7 buffer and fill the cup about 25% full of pH 4 or 10 buffer solution depending on the deployment conditions (10 is more applicable for Stroubles Creek). Repeat the steps above for this buffer solution. A third buffer may be used to ensure linearity. For example, if pH 10 is used, a pH 4 buffer can be used to check the readings, but calibration should not be repeated. This calibration has successfully done for the LEWAS sonde. Buffer solutions will need to be re-ordered after multiple calibrations. If the pH readings continue to drift for an extended period of time, or jump up and down, the sensor may need to be cleaned or replaced. Dissolved Oxygen Calibration Prior to calibration, the sensor’s membrane must be replaced for accuracy. The o-ring at the top of the sensor is removed and the old membrane and electrolyte are discarded. The anode and cathode should also be checked. The anode is the white or off-white triangle in the center of the sensor and the cathode is the gold ring around the top of the sensor. If the anode is no longer white, the sensor needs to be replaced. If the cathode is no longer gold or appears tarnished or dirty, it can be gently cleaned with a cotton swab and toothpaste, a mildly abrasive detergent or hand cleaner with pumice. After these are checked, the inside of the sensor is rinsed with the ‘DO’ electrolyte that came with the sonde. The sensor is then re-filled with electrolyte so that there is a slight dome on top and no bubbles. A new membrane is then placed over the top and secured with the o-ring so that it does not wrinkle and no air is trapped underneath it. If bubbles exist, the membrane should be discarded and a new membrane should be used. Finally, trim any excess membrane away with scissors. After multiple calibrations, new membranes and electrolyte solutions will need to be purchased. Then, the sensor is soaked in clean water for a minimum of 4 hours prior to calibration. The dissolved oxygen readings will drift if the sensor is calibrated early. 15 Clark Cell dissolved oxygen calibration is done using the DO% Sat tab of Hydras 3LT. First, the sensor is rinsed with tap water. Then, the calibration cup is filled with tap water to the bottom of the o-ring on the sensor. Any drops of water on top of the DO membrane are removed. After the DO readings stabilize, the current barometric pressure is entered and the calibrate button is pressed. A “Calibration successful” message will appear. The dissolved oxygen sensor is now calibrated. These directions were followed using a barometric pressure from the Blacksburg National Weather Service forecast office. They should be repeated when the Vaisala Weather Station is operational and can be used for the barometric pressure reading. Dissolved Oxygen measurements should remain relatively constant in mg/L, but the % saturation will fluctuate due to changes in barometric pressure. Since a weather station will also be available, it will be possible to integrate pressure calibrations into the % saturation measurements. It should be noted that a calibration option could eventually be added to the LabVIEW VI so that calibration could be done in the field. Sonde Maintenance In addition to calibration, the sensors should be cleaned occasionally, either when build-up is evident, or if the sonde has been stored for a long period of time (such as during the winter). A basic checklist for cleaning includes: cleaning the pH sensor, replacing the reference electrolyte, replacing the pH reference, replacing the DO cap and the Dissolved Oxygen electrolyte. When in storage, the sonde’s calibration tube should be filled with water. According to the manufacturer there is no set time after which the sonde should be re-calibrated. Instead, it is recommended to check the sonde after about a month for excess debris. If debris has accumulated, Simple Green d Pro 3 is recommended for cleaning the probes using soft toothbrushes and q- tips. In general, the parameters should also be monitored for major changes outside of what is expected. When changes are observed, the sonde should be re-calibrated. It will generally be a trial-and-error procedure until the appropriate length of time is determined. Flow Meter Calibration 16 The flow meter must also be calibrated, but if done correctly only one calibration is necessary. The flow meter uses Doppler technology to measure velocity and depth (Figure 12). Therefore, the user must input the area (or shape) of the cross-section so that the flow meter can calculate flow. This can be done by surveying of the bottom of the creek bed or by taking approximate measurements by hand. The more accurately the measurements are done, the more accurately the flow meter will report discharge. This step cannot occur until the final position of the flowmeter has been determined. The instrument will be fully accurate when submerged in at least 1’ of water and partially functional to 0.7’. If water height readings are below these values at any time, flow data should not be included in analysis because accuracy is compromised. Since the flowmeter has not yet been deployed, it was taken to a flume in a hydraulics lab for testing. The flowmeter measured data within the flume using the known dimensions of the flume and a known flow. The results showed that the flowmeter was accurate. It should be noted that the Vaisala Weather Transmitter does not need to be calibrated before installation. Figure 12: Argonaut-SW Measurements (adapted from User Manual) Installation Installation of the fully functional LEWAS is scheduled to occur in the spring/summer of 2011. The lab is not yet operational largely due to the scarce availability of Virginia Tech Facilities crews. Contacting the correct departments for each stage of installation proved to be a difficult task. Once contacted, the individuals were usually hesitant to discuss the project until specific work orders were filed. In July of 2009 initial contacts were made with the facilities department. The lab team met with Martha Wirt, a Civil Engineer in the Facilities Department. She then provided the contact information for Mark Helms (the director of Facilities) and also to help us gain approval 17 from the University architect for our project. A tentative design shown in Figure 13 was shared with him. This initial design was comprised of a mounting pole to hold the solar panel and mounting box. A wooden platform was included in this design for easy access to the site for programming. Figure 13: Initial Site Design: Summer of 2009 After meeting with the facilities department on September 20, 2011 (Leon Law, Tim Meadows, and Anthony Watson), the design was altered to what they believed to be best for the site. Their alterations included one concrete structure instead of a wooden platform. The revisions also utilized of a nearby light pole to mount the solar panels rather than the originally proposed small metal pole. A drawing of their alterations is included in Figure 14. More views of the site design are available in Appendix B. 18 Solar Panel Sonde Flow Meter Enclosure Direction of Flow Figure 14: LEWAS Lab Final Design (by Michael Sadowski) The design shows the concrete structure that holds two wooden poles (already installed). The poles will support the mounting box, which will house the cRIO and a battery. A conduit is then run from the concrete structure to the top of the outlet structure for wiring. The flow meter and the sonde will be wired directly through this conduit. The solar panel and weather station will be mounted on the existing light pole and also run through conduit to the mounting box. Figure 15 shows a view of the deployed sonde. 19 Figure 15: Test Run of Sonde Deployment (April 1, 2011) In September of 2010, the protection for the sonde was mounted at the site and a concrete base was attached to the flowmeter by the facilities. A hole was also bored along the top of the outlet structure for wiring purposes. A specific wireless router has been mounted on top of Hahn Hall to strengthen the signal. See Figure 16 for the current state of the site. All the components of the lab are ready to be deployed and the design work is complete. As soon as Virginia Tech Electric is able to provide wiring, the equipment can be taken to the field and the lab will be operational. When all equipment has been installed, the system will transmit data from each of the previously mentioned devices. Real-time data for pH, dissolved oxygen, conductivity, temperature, flow, rainfall, wind direction, barometric pressure, and humidity will all be available. A test of the water quality sonde was done in the Spring of 2011. Sample output (in the form of a webpage) is seen in Figure 17. In total, the lab work has required an estimated 800 man-hours including and a cost of approximately $32,500 in equipment costs until April 11, 2011. This includes subsidiary materials such as waders, wireless routers, and other materials essential to the lab. 20 Wireless Router (Hahn Hall) Future Site of Solar Panels Posts for Enclosure (to house cRIO and battery) Sonde Mount and Enclosure Figure 16: Current Outdoor Components (April 2011) Temperature pH Conductivity DO Figure 17: Sample Real-Time Data from Stroubles Creek 21 Educational Experimentation In the following, example applications of LEWAS lab for three levels of engineering coursework are discussed. The examples will be based on a student who enters the Civil Engineering program with a focus on water resources. Figure 18: Courses and LEWAS Objectives Example 1: Engineering Exploration (EngE 1024) EngE 1024 is the freshmen level engineering course at Virginia Tech that is taken by all students in the department. Two objectives for the course are to “graph numeric data and derive simple empirical functions” and to “demonstrate a basic awareness of contemporary global issues and emerging technologies, and their impact on engineering practice”. An activity based on the LEWAS laboratory has been implemented in this course for the past four semesters. LEWAS Data was first used for educational purposes in the Fall of 2009. During this semester students were given a “Know Your Watershed Worksheet” (Appendix C) to complete prior to a demonstration of the outdoor laboratory. The worksheet creates a familiarity with the watershed they are living in as well as some information about water quality monitoring. After the worksheet was completed, students were then exposed to a demonstration in lecture. First, they were shown how data acquisition works with LabVIEW in general. This was done using a temperature probe and a bottle of water. Then, they were shown a Skype video of the sonde as it measured water quality parameters. They were also shown the data in real time on a website (Figure 19). This activity was repeated in Spring ’10, Fall ’10 and Spring ’11. 22 Figure 19: In-class LEWAS demonstration in Fall ‘09 The demonstration was done in the large lecture portion of the course in Fall ’09 and Spring ’10. In Fall ’10, the demonstration was moved to smaller workshop sections and done by individual teaching assistants in each class. Survey data from Fall ’09 and Fall ‘10 shows a generally positive response to the LEWAS activity (Figures 20 and 21). The results show that the activity consistently enhanced students’ curiosity about environmental issues and overall knowledge of watersheds and water quality problems. One disconnect students encountered was confusion between what they were seeing on Skype and what they were seeing via LabVIEW web-publishing. When the lab is fully operational and it is possible for students to visit the site, the data will become more relevant. Percent of Students (%) My knowledge of watersheds and local water quality problems was enhanced by the "Know your Watershed" worksheet 50 40 30 Fall 2009: n=329 20 Fall 2010: n=610 10 0 Strongly Agree Neutral Disagree Strongly no Agree Disagree answer Figure 20: Exit Survey Data (Question 1) 23 Percent of Students (%) Access to real-time environmental data can enhance my awareness and curiosity about environmental issues such as the state of an impaired stream that runs through campus 60 50 40 30 20 Fall 2009: n=329 10 Fall 2010: n=610 0 Figure 21: Exit Survey Data (Question 2) Example 2: Intro to Environmental Engineering (CEE 3104) The Civil and Environmental program at Virginia Tech offers a wide variety of courses with specialty fields such as Structural and Geotechnical Engineering. Many of the specific “tracks” such as these begin with an introductory course that broadly covers the field. The introduction to Environmental Engineering course (generally taken as a sophomore) covers hazardous waste, water and wastewater treatment, air and groundwater pollution and basic environmental regulations. Commonly, students are asked to perform mass balance calculations in this course. The following is an example application of LEWAS lab data to CEE 3104 (with a solution). Mass Balance Workout Problem The Virginia Tech Duckpond has a surface area of approximately 103,000 ft2. There are two small streams that flow into the Duckpond and one that flows out (Figure 22). The outflow from the pond is recorded as 3 cfs during the month of August. The inflow from the Main Branch is 1.5 cfs. The inflow from the Webb Branch can be determined by using the LEWAS lab website (link provided here) and checking the average flow rate for August. You will also determine the average rainfall depth for the month of August using this site. 24 If the volume of the pond increases by 5,000 ft3 in August; find the evaporation rate in inches per month. You may assume that no water is lost through infiltration. Webb Branch Inflow N Duckpond Outflow Main Branch Inflow Figure 22: Virginia Tech Duckpond (from Bing Maps) Solution: Students will record different data for precipitation and flow; this solution uses 3.68 inches for precipitation and 1.5 cfs as the flowrate. The precipitation is determined by summing all precipitation for the month. The average flowrate can be determined by integrating the flow over a specified time interval. An example for 2 hours is below (where flow = 1.5 cfs): 2 + 0.0489x + 1.3495 R² = 0.929 1.55 1.5 1.45 1.4 1.35 1.3 1.25 1.2 1.15 Flow Poly. (Flow) 8:00 8:10 8:20 8:30 8:40 8:50 9:00 9:10 9:20 9:30 9:40 9:50 10:00 Flow Flow vs. Time y = -0.0041x Time 25 Use the basic principle of mass-balance: Accumulation = input – output Accumulation was given (change in storage), and the input will be the two inflows and precipitation. Output will be the outflow from the pond and evaporation. This leads to the following equation: ∆𝑆 = 𝑄𝑖𝑛1 + 𝑄𝑖𝑛2 + 𝑃 − 𝐸 − 𝑄𝑜𝑢𝑡 Where ∆𝑆 is change in storage, Q is flowrate in cfs, P is precipication in inches, and E is evaporation in inches. Students should realize that each term should be in the same units. Here, units of volume per month are the most practical. To convert the flowrates students will have to multiply by time and remember that there are 31 days in the month of August. Inches of rainfall can be converted by multiplying by the surface area of the lake to get a volume. So, 5,000𝑓𝑡 3 𝑓𝑡 3 31 𝑑𝑎𝑦𝑠 86,400 𝑠𝑒𝑐𝑜𝑛𝑑𝑠 𝑓𝑡 3 31 𝑑𝑎𝑦𝑠 86,400 𝑠𝑒𝑐𝑜𝑛𝑑𝑠 = (1.5 ∗ ∗ ) + (1.5 ∗ ∗ ) 𝑚𝑜𝑛𝑡ℎ 𝑠 𝑚𝑜𝑛𝑡ℎ 𝑑𝑎𝑦 𝑠 𝑚𝑜𝑛𝑡ℎ 𝑑𝑎𝑦 + (3.68 𝑖𝑛𝑐ℎ𝑒𝑠 1 𝑓𝑜𝑜𝑡 𝑓𝑡 3 31 𝑑𝑎𝑦𝑠 86,400 𝑠𝑒𝑐𝑜𝑛𝑑𝑠 ∗ ∗ 103,000𝑓𝑡 3 ) − 𝐸 − (3 ∗ ∗ ) 𝑚𝑜𝑛𝑡ℎ 12 𝑖𝑛𝑐ℎ𝑒𝑠 𝑠 𝑚𝑜𝑛𝑡ℎ 𝑑𝑎𝑦 𝐸 = 260,998 𝑓𝑡 3 1 12 𝑖𝑛𝑐ℎ𝑒𝑠 𝑖𝑛𝑐ℎ𝑒𝑠 ∗ ∗ =3 2 𝑚𝑜𝑛𝑡ℎ 103,000𝑓𝑡 1 𝑓𝑜𝑜𝑡 𝑚𝑜𝑛𝑡ℎ Example 3: Hydrology (CEE 4304) Hydrology is a senior level course in Civil Engineering. One of seven course objectives is to “use streamflow and precipitation from the internet”. Data is often taken from large websites such as the USGS or NOAA for these examples. Those organizations provide data for their gage sites which may not accurately represent every area. Providing data from a location on campus will make analysis more realistic. Many tasks in this course require finding precipitation or flow data in order to process and analyze it. Using LEWAS lab data for these tasks provides a plethora of activities. 26 Runoff-Rainfall Ratio Workout Problem Determining Rainfall Excess in our Local Watershed Consider the local Stroubles Creek watershed, shown below: Real-time precipitation and flow data is available for the Webb Branch sub-watershed (~800 acres) which includes portions of Blacksburg and Virginia Tech. Current and past data can be viewed on the LEWAS Lab website: [insert URL here]. On [insert date here], a storm occurred in the watershed between 8:00-11:00 am. According to a resident, the following rainfall intensities were observed on her property: Time in/15 min 8:00 0.005 8:15 0.025 8:30 0.055 8:45 0.075 9:00 0.175 9:15 0.42 9:30 0.48 9:45 0.6 10:00 0.405 10:15 0.21 10:30 0.065 27 Use the LEWAS site to verify that these intensities were correctly documented. Record the values from the site (if any differences), as well as the flow records from that morning. Use this data to determine the runoff-rainfall ratio. You should create an intensity duration curve and a runoff hydrograph as part of this procedure. You may need to assume a baseflow for the stream based on past LEWAS data. Discuss how the runoff-rainfall ratio would change if another storm occurred later that same day. Solution: Students will first record the data and plot the rainfall intensity: Precipitation in inches/15 minutes Rainfall Intensity y = -0.0045x3 + 0.0675x2 - 0.208x + 0.1681 R² = 0.9164 0.7 0.6 0.5 0.4 0.3 in/15 min 0.2 Poly. (in/15 min) 0.1 0 -0.1 8:00 8:15 8:30 8:45 9:00 9:15 9:30 9:45 10:0010:1510:30 Time If using Excel, they can apply a polynomial function to the data and integrate to determine total rainfall. Using the polynomial above, the total rainfall is 2.531”. Use this to find the total rainfall volume: 1 𝑓𝑜𝑜𝑡 Convert inches to feet: 2.531 𝑖𝑛𝑐ℎ𝑒𝑠 × 12 𝑖𝑛𝑐ℎ𝑒𝑠 = 0.2109 𝑓𝑡 𝑜𝑓 𝑟𝑎𝑖𝑛𝑓𝑎𝑙𝑙 Convert acres to square feet: 800 𝑎𝑐𝑟𝑒𝑠 × 43560 𝑓𝑡 2 1 𝑎𝑐𝑟𝑒 = 34,848,000𝑓𝑡 2 Total rainfall volume: 0.2109 𝑓𝑡 × 34,848,000𝑓𝑡 2 = 7,350,024 𝑓𝑡 3 28 They will then use the flow data they record. Some sample data is below. Students will need to realize that their hydrograph will extend beyond the time period of the storm itself. For this example, assume a baseflow of 1.5 cfs. Time 8:00 8:15 8:30 8:45 9:00 9:15 9:30 9:45 Runoff (cfs) 1.5 3.2 4 10 16 24 35 41 Runoff Hydrograph Time 10:00 10:15 10:30 10:45 11:00 11:15 11:30 11:45 Runoff (cfs) 46 53 58 45 31 19 7 1.6 y = -0.0947x3 + 1.5769x2 - 1.442x - 0.9813 R² = 0.9234 70 60 50 Flow (cfs) 40 30 Runoff (cfs) 20 Poly. (Runoff (cfs)) 10 -20 11:45 10:45 11:00 11:15 11:30 9:30 9:45 10:00 10:15 10:30 8:30 8:45 9:00 9:15 -10 8:00 8:15 0 Time The plotted hydrograph will vary based upon the real data, the type of polynomial fit will also vary. Students will need to realize that their integrated function should subtract a constant of the baseflow. Total runoff is 398.5 cfs in this case (by integrating the above function), which must be converted to ft3 for comparison to rainfall. 29 398.5 × 𝑓𝑡 3 3600 𝑠 1.75 ℎ𝑜𝑢𝑟𝑠 × × = 2,510,683 𝑓𝑡 3 𝑠 1 ℎ𝑜𝑢𝑟 1 Therefore, the runoff-rainfall ratio is: 2,510,683 𝑓𝑡 3 = 0.34, 𝑜𝑟 34% 7,350,024 𝑓𝑡 3 Students should list 34% as the percentage of rainfall that becomes runoff. The discussion should point out that if another storm occurred, the runoff-rainfall ratio would grow closer to 1. They may also discuss where losses of precipitation occur, mainly infiltration. Personal Contribution The LEWAS laboratory is comprised of a rotating cast of engineering students. However, two supervisors have remained constant: a lead Electrical Engineering student and a lead Civil Engineering student. I have been the lead Civil Engineering student for the past two years, providing leadership and supervision for the undergraduate students working for the project. In addition to mentoring students, I also taught the workshop section of EngE 1024 for four semesters and created an activity using LEWAS data for the class. I also designed and chose the materials for the outdoor laboratory. I contacted and met with Virginia Tech construction personnel on several occasions and created digital drawings for the laboratory design. Summary and Future Work First and foremost, the electrical wiring must be done as soon as possible, and the equipment should be fully deployed. After this is done, one all-inclusive LabVIEW VI will be developed to showcase all of the monitoring equipment. Currently, VIs for the sonde and the weather station have been developed. Within the next year, a VI should be developed to control the flowmeter, and a combination of the three should be complete. This type of VI can be web-published and publicly available in the same manner as USGS real-time data. The information can be built upon and more stations can be integrated to create a sensor network. The general “modular” design of the system also allows for the integration of more instruments in the future. Currently, nitrogen and phosphorus measurements are not available for the sonde, but would be a good addition to 30 the laboratory equipment when they are. Samples for future integration into engineering education curriculum are discussed above. LEWAS data should also be used for future research and real-life monitoring efforts. It would be valuable to develop a statistical analysis on the optimal sampling rate (in order to save as much energy as possible and also represent storms as accurately as possible). Water quality and quantity parameters could be used for research questions that focus on water resources and development in Blacksburg. The high level of sensitivity would be ideal for drawing cause and effect relationships between water quality and development. Many computer and electrical engineering design challenges also exist. Integrating the LEWAS VI’s into one master VI and creating a “smart” VI that senses when no major changes are occurring within the river are two of the initial challenges. The potential uses of LEWAS are many; limited only by the imagination of researchers and instructors. 31 References Brezonik, Patrick L., L. G. Olmanson, M. E. Bauer, and S. M. Kloiber, 2007. Measuring Water Clarity and Quality in Minnesota Lakes and Rivers: A Census-Based Approach Using RemoteSensing Techniques. Cura Reporter. http://water.umn.edu/Documents/Brezonik_et_alMeasuring_Water_Clarity.pdf. Accessed 7 March 2011. Cox, W.E., 2008. Sustaining Adequate Public Water Supply: The Challenges Ahead. ASCE: World Environmental and Water Resources Congress 2008 Ahupua'a. Honolulu, Hawaii, May 12-16. Environmental Protection Agency (EPA), 2010. CADDIS: The Causal Analysis/Diagnosis Decision Information System. http://www.epa.gov/caddis/index.html. Accessed 11 January 2011 Environmental Protection Agency (EPA), 2010. Monitoring and Assessing Water Quality – Volunteer Monitoring. http://water.epa.gov/type/rsl/monitoring. Accessed 7 March 2011. Environmental Protection Agency (EPA), 2011. Impaired Waters and Total Maximum Daily Loads. http://water.epa.gov/lawsregs/lawsguidance/cwa/tmdl/index.cfm Cited 6 April 2011. Fondriest Environmental, 2011. Aquatic Classroom: students learn the future of their field on Acton Lake. http://www.fondriest.com/news/aquatic-classroom-students-learn-the-future-of-theirfield-on-acton-lake.htm. Accessed 7 April 2011. Hach Hydromet, 2010. Calibration Videos and Transcripts. http://www.hydrolab.com/web/ott_hach.nsf/id/pa_videos_and_transcripts.html. Accessed 3 March 2011. Hach Company, 2006. Hydrolab DS5X, DS5, and MS5 Water Quality Multiprobes User Manual. http://www.stevenswater.com/catalog/products/water_quality_sensors/manual/S5_Manual.pdf. Accessed 15 November 2010. Henjum, Michael B., Hzalski, R. M.,Wennen C.R., Arnold W., and P.J. Novak, 2009. Correlations between in situ sensor measurements and trace organic pollutants in urban streams. J. Environ. Monit. 12: 225-233. Kaurish, F. and T. Younos, 2007. Developing a Standardized Water Quality Index for Evaluating Surface Water Quality. Journal of the American Water Resources Association 43(2): 533-545. Kenny, J., Delgoshaei, P., Gronwald, F., Lohani, V. and Younos, T., 2008. “Integration of LabVIEW into Stroubles Creek Watershed Assessment”, 2008 NSF REU Proceedings of Research Research Opportunities in interdisciplinary Watershed Sciences and Engineering 32 Lohani, V. K,. Delgoshaei, P., and Green, C., 2009. Integrating LabVIEW and Real-Time Monitoring Into Engineering Instruction. Proceedings of the 2009 ASEE Annual Conference and Exposition, Austin, TX, June 14-17. National Academy for Engineering, 2011. Grand Challenges for Engineering. http://www.engineeringchallenges.org/cms/challenges.aspx. Accessed 3 April 2011. National Instruments, 2011. NI CompactRIO. http://www.ni.com/compactrio. Accessed 7 February 2011. Nedic, Z., J. Machotka, and A. Nafalski, 2003. Remote Laboratories Versus Virtual and Real Laboratories. 33'd ASEE/IEEE Frontiers in Education Conference. Boulder, CO, November 58. Reuter, R., T. H. Badewien, A. Bartholomä, A. Braun, A. Lübben, and Rullkötter, J., 2009. A hydrographic time series station in the Wadden Sea (southern North Sea). Ocean Dynamics 59:195–211. SonTek, 2008. Argonaut-SW Expanded Description. http://www.sontek.com/pdf/expdes/Argonaut-SW-Expanded-Description.pdf. Accessed 3 April 2011. Strobl, Robert O. and Robillard, P.D., 2008. Network design for water quality monitoring of surface freshwaters: A review. J. Environ. Management 87: 639-648 Stroubles Creek IP Steering Committee, Virginia Tech Department of Biological Systems Engineering, and Virginia Water Resources Research Center, 2006. Upper Stroubles Creek Watershed TMDL Implementation Plan. Toran, F., D. Ramierez, A.E. Navarro, S. Casans, J. Pelegri and J.M. Espi, 2001. Design of a virtual instrument for water quality monitoring across the Internet. Sensors and Actuators. 76:281-285. USGS, 2011. USGS Real-Time Water Data for the Nation. http://waterdata.usgs.gov/nwis/rt. Accessed 7 April 2011. Utah Water Research Laboratory, 2011. Real-Time Streamflow and Water Quality Monitoring. http://www.bearriverinfo.org/data/usurealtime.aspx. Accessed 5 March 2011. Zennaro M., A. Floros, G. Doga, T. Sun, Z. Cao, C. Huang, M. Bahader, H. Ntareme, and A. Bagula, 2009. On the Design of a Water Quality Wireless Sensor Network (WQWSN): an Application to Water Quality Monitoring in Malawi. IEEE. 2009 International Conference on Parallel Processing Workshops. 33 Appendix A: Outdoor Lab Pricing Item: Manufact urer: Quantity: Date: Function: Orion 4-Star pH/ISE waterproof portable meter Thermo Scientific 1 9/1/20 09 pH/ISE meter Price (all quantiti tes) $856.00 9107BNMD epoxy low maintenance pH/ATC Triode 1210005 soft field case Thermo Scientific Thermo Scientific Thermo Scientific Thermo Scientific Thermo Scientific Thermo Scientific Hach Company Hach Company SonTek 1 ph/ATC meter - case - electrode solution - pH 4.01 buffer - pH 7.00 buffer - pH 10.01 buffer - Phosphorus testing kit Nitrogen testing kit $158.00 Flowmeter 1 $7,030. 00 $1,258. 00 9/3/20 09 9/4/20 09 Wireless Networking WSN $149.00 14 dB Directional Antenna Hotek Technologi es Ubiquiti Networks National Instrumen ts Netgear 9/1/20 09 9/1/20 09 9/1/20 09 9/1/20 09 9/1/20 09 9/1/20 09 7/29/2 009 7/29/2 009 9/28/2 009 9/22/2 009 Antenna $149.99 Wireless-G Ethernet Bridge Linksys 2 Wireless Bridge $129.86 Surge Protector Dynex 1 Surge Protector $11.99 CD-R Discs Dynex 10 Light Scribe DVD+R Memorex 20 Wireless-G PCI Adapter Linksys 1 8/27/2 009 8/20/2 009 8/28/2 009 8/28/2 009 8/28/2 009 8/28/2 009 910060 pH electrode storage solution 910410 pH 4.01 buffer pouches 910710 pH 7.00 buffer pouches 911010 pH 10.01 buffer pouches TNT. Total Phosphorus 50 Tests RGT Set TNT Total Nitrogen Argonaut Flowmeter Dissolved Oxygen Meter PCI Card + Wireless Antenna WSN Starter Kit 1 5 x 60mL 10 pack 10 pack 10 pack 1 1 1 1 Card, 2 Antennas 1 34 Portable Dissolved Oxygen Meter - $1,799. 00 $3.99 $14.99 Desktop Wireless Card $45.99 Canon Powershot A1 Canon 1 Wireless Presenter/Laser Targus 1 CAT 6 Network Cable 1 Portable Hard Drive Geek Squad iomega External VGA Video Card Tritton 1 Logitech Quickcam Logitech Video Card for LV Station (DELL) iPAQ 210 Handheld PC DELL 1 + 2 black spherical cams 1 HP 1 Fujitsu Battery Pack Fujitsu 2 Thinkpad T400 Battery Lenovo 1 Thinkpad T400s Battery Lenovo 1 Dell 1209S Projector DELL 1 1 8/28/2 009 8/28/2 009 8/28/2 009 8/28/2 009 8/28/2 009 8/28/2 009 8/7/20 09 6/9/20 09 Thinkpad T400s 10m Detachable Cable for Sonde Sonde Power Cable to Battery Sonde External Power Adapter Interface Solar Cell and Regulator 2 GB RAM Solder Station Sealed Rechargeable Battery Box of old equipment LaserJet 1200 Printer $199.99 Laser Pointer/Presenter 14' Ethernet Cable $39.99 320GB Hard Drive $79.99 VGA Converter $44.99 Webcam $73.79 8/13/2 009 Thinkpad T400 12V Battery Charger Digital Camera Reading RS-232 measurements Checked out by Parhum Notebook Battery $399.00 Checked out by Parhum Projector $120.00 Checked out by Dr. Lohani Checked out by Parhum Battery Charger $1,548. 00 $1,649. 00 $46.99 $298.00 $120.00 $500.00 Black & Decker Hydrolab 1 1 $510.00 Hydrolab Hydrolab 1 1 $54.94 $95.00 2 Notebook RAM $300.00 $16.00 Soldering Iron $22.99 12V Rechargeable Battery $134.95 Radio Shack NexSens HP 8/18/2 009 $23.39 8/20/2 009 8/20/2 009 1 1 1 (currently not working) 35 - SunSaver-6 Rubber Cleated Hipboot (size 5) Rubber Cleated Hipboot (size 11) HP Laserjet 1012 DELL Optiplex 360 (VT000317872) DELL Optiplex 360 (VT000318227) MS-5 Water Quality Sonde NI 8 Channel Input Analog Module NI 9870 Module NI 9802 Module SEA cRIO xLAN Module cRIO 9072 DELL Optiplex 360 - Parhum's office (VT000314336) Weather Station (Vt000321588) Electrical Mounting Box Mastech Power Supply HY3010EX 30V 10A Over Voltage Over Current Protection Rosin Core Solder (1 Lb.) 100 ohm 1W 5% Metal-Oxide Film Resistor (2-Pack) 20-Ft. 3/4" High DielectricStrength PVC Tape Fully Insulated Mini 1-1/4" Alligator Clips Solderless Insulated Spade and Ring Tongues (75-Pack) Red 120 MCD intensity, T-1-3/4 (5mm) size LED Morningst ar RedHead RedHead 1 Solar Controller 1 (2 boots) 2 (2 boots) Waders Waders $79.98 - HP DELL 1 1 $700.00 DELL 1 Printer Computer; mouse, keyboard, monitor Computer; mouse, keyboard, monitor Hydrolab 1 National Instrumen ts National Instrumen ts National Instrumen ts National Instrumen ts National Instrumen ts Dell 1 $4,575. 00 - 1 $521.10 1 $989.10 1 $968.00 1 $599.70 Vaisala 1 Nexsens 1 1 1 Computer; mouse, keyboard, monitor 3/10/2 010 1 box 5 box 5 box 2 box 1 box 2 box 36 3/10/2 010 3/10/2 010 3/10/2 010 3/10/2 010 3/10/2 010 3/10/2 010 $700.00 $755.48 $2,000. 00 $959.81 $149.95 $13 $7 $10 $7 $3 $3 25-Ohm 3-Watt Rheostat 2 box 35-Ft. Black Automotive Hookup Wire (10AWG) 35-Ft. Red Automotive Hookup Wire (10AWG) Multicolor Wire Wraps 1 box Heat-shrink Tubing Set (36Pack) ZT-4-MIL Fume Extraction system, 120 Volts, includes six filters with unit RadioShack® 17-Piece Precision Screwdriver Set Ultra-Fast Receptacles & Tabs 1 box 45-Watt Desoldering Iron 1 6 ft DVI-D Single Link LCD Flat Panel Monitor Cable - M/M A03 26 A-Hr Battery (Nexsens) 1 40W, 12V SOLAR MODULE 2 10A, 24V CHARGE CONTROLLER 1 20' OUTPUT WIRE 1 POLE MOUNT FOR SOLAR MODULES BATTERY INTERCONNECT 1 NI 9221 8-Channel, ±60 V, 800 kS/s, 12-Bit Analog Input Module NI 9936 - 10 screw-terminal plugs for any 10-position screwterminal module 2 box 1 box 1 1 set 10 piece 1 1 National Instrumen ts National Instrumen ts 1 1 Total 3/10/2 010 3/10/2 010 3/10/2 010 3/10/2 010 3/10/2 010 3/10/2 010 $8 3/10/2 010 3/10/2 010 3/10/2 010 3/10/2 010 3/10/2 010 3/10/2 010 3/10/2 010 3/10/2 010 3/10/2 010 3/10/2 010 3/10/2 010 $15 3/10/2 010 $26 $18 $18 $3 $3 $175 $20 10.99 $19.99 $134.95 $482.36 $52.50 $20.67 $75.55 $6.92 $476 $32,491 .44 37 Appendix B: Outdoor Lab Drawings (Fall 2010, created by Mike Sadowski) B-1: Top View of Site Design - 38 Outdoor Lab Drawings (Fall 2010, created by Mike Sadowski) B-2: View of Enclosure and Wiring 39 Outdoor Lab Drawings (Fall 2010, created by Mike Sadowski) B3: View from Stream of Wiring to Flow Meter and Sonde 40 Outdoor Lab Drawings (Fall 2010, created by Mike Sadowski) B4: View of Light Pole with Mounted Solar Panels 41 Appendix C: Know your Watershed Worksheet Now that you know basics of LabVIEW, we’ll introduce you to some applications of LabVIEW. Application 1: Temperature measurement In workshop 12, you will use a temperature probe for recording cooling rate of a fluid (water or milk). The probe will be connected to a computer through a data acquisition system (DAQ). LabVIEW will process the temperature data. See Figure 1. Figure 1: Temperature Demo Application 2: Integration of LabVIEW with Water Monitoring Hardware for Watershed Monitoring What is a watershed? A region that is drained by a river/stream and its tributaries; an area of land characterized by all runoff traveling to the same outlet. See Figure 2. Figure 2: Watershed Representation (http://pulse.pharmacy.arizona.edu/images/watrshed.jpg ) 42 Know your Watershed Worksheet What watershed are we a part of at Virginia Tech? The answer is “New River Watershed.” This watershed covers a portion of southwest Virginia, including a sub-watershed called “Stroubles Creek Watershed.” Stroubles Creek watershed encompasses Virginia Tech and begins with headwaters upstream of the University. The creek then travels through downtown Blacksburg in open channels and/or pipes, is then piped under the drillfield, and then flows into the Duckpond on VT’s campus. Stroubles Creek is formed from two main tributaries – Central Branch and Webb Branch – and receives flow from a number of other unnamed perennial streams. These two tributaries flow into the Duck Pond on the Virginia Tech campus, with the main Stroubles Creek channel beginning at the pond’s outfall. ACTIVITY 1- Watershed Mapping This is to be done as a pre-lecture activity. What larger watersheds does Stroubles creek contribute to? If a raindrop falls at the top of the Stroubles Creek Watershed, it eventually flows to the Gulf of Mexico. Use online resources and maps to determine the missing rivers/watersheds in the progression below. Stroubles creek New River ____________________ ___________________ Mississippi Gulf of Mexico Over the years, a number of water bodies in the country have been declared “impaired” by the Environmental Protection Agency (EPA). Please review the first four questions and answers at below site: http://www.epa.gov/waters/ir/attains_q_and_a.html#3 In 1998, researchers at the Virginia Department of Environmental Quality (DEQ) found that a 4.87 miles segment of the stream in the lower part of the Stroubles Creek watershed violates benthic standards. The term “benthic” refers to aquatic organisms living in a body of water. The impaired segment begins just below the Duck Pond. Nonpoint source pollution from agricultural activity and increased urbanization of the upper portion of the watershed are suspected source of impairment. (http://www.vwrrc.vt.edu/stroubles/watershed/watershed.html). One step toward restoration of an impaired stream is monitoring key water quality parameters. Some examples of water quality parameters are: pH, dissolved oxygen, water temperature, and conductivity. Water quality measurement equipment, like a water quality sonde shown in Figure 3, is used for monitoring water quality. Figure 3: Water Quality Sonde 43 Know your Watershed Worksheet Why are these parameters important? • pH – For a healthy stream/river pH of water ranges between 6.5-8.0. pH values outside of this range can harm the natural biological and chemical processes of organisms within the system.. • Dissolved Oxygen – Oxygen is essential to the survival of all aquatic organisms. The oxygen content of a body of water is measured in terms of dissolved oxygen or DO. DO is a function of water temperature; the higher the temperature the lower the DO. • Temperature – The temperature of water plays an important role in characterizing its quality. Aquatic organisms remain healthy as along as water temperature is in certain range. Specific temperature ranges are dependent on species (some prefer higher or lower). However, changes to a specific water body’s temperature for long periods of time can cause organisms to become stressed or to die off. • Conductivity - Conductivity is a measure of the ability of water to pass an electrical current. It can be measured as the amount of inorganic dissolved solids and should remain relatively constant within a specific stream. Changes in conductivity are indicators that water entering the stream is changing from something other than natural processes. • Benthics – As discussed, the term refers to aquatic organisms (see Figure 4) living in a bod of water. Examples include crayfish, snails, clams, leeches, and worms. Changes in water quality result in changes in the types, numbers, and/or diversity of benthics because they are affected by physical, chemical and biological conditions of the stream. Therefore, they are also good indicators of unnatural changes within the stream. Figure 4: Benthic Organisms http://pubs.ext.vt.edu/442/442-556/442-556.html#L1 Figure 5 shows existing landuse in upper Stroubles Creek watershed. It’s interesting to note that that the headwater region (i.e., upper part) of the watershed is urbanized while the lower part of watershed still has forested landuse. 44 Know your Watershed Worksheet Figure 5: Existing landuse in Stroubles Creek watershed As part of a research project funded by the National Science Foundation, a LabVIEW Enabled Watershed Assessment System (LEWAS) is under development. This system will have capability to monitor water quantity and quality parameters in real-time from the Stroubles Creek. A demonstration of this system will be given during workshop 11. Pl. see figure 6. Figure 6: LabVIEW Enabled Watershed Assessment System 45