1
LOADVIEW VERSION3
OPERATOR'S MANUAL
©2002 Load Technology Inc.
LoadView Version 3.0.16 - 05/12/2010
Information in this document is subject to change without notice and does not represent a
commitment on the part of Load Technology Inc (Loadtec). The software described in
this document is furnished under the Software License Agreement set forth in The Load
Technologies Software License Agreement. This software may be used or copied only in
accordance with the terms of the license. No parts of this User's Manual may be
reproduced, stored in a retrieval system (except as provided for by Load Technology
Inc.), or transmitted in any form or by any means electronic or mechanical, including
photocopying and recording, for any purpose, without the express written consent of
Load Technology Inc.
Copyright © 2001-2010 by Load Technology Inc, All Rights Reserved.
Printed in the United States of America
Load Technology Inc.
525 Commerce Circlr.
Mesquite, NV 89027
U.S.A.
LoadView® is a trademark of Load Technology Inc.
Microsoft is a registered trademark, Windows, and Excel are trademarks of the Microsoft
Corporation.
DOCUMENTATION/DRAWING
TERMS OF USE
This documentation and drawings (document) provided are subject to the
following rules, guidelines, policies, and conditions.
OWNERSHIP
Load Technology ( LOADTEC ) owns the contents of this document. The inclusion with
equipment or supply after in support of purchased equipment or parts does not transfer
ownership to the purchaser or owner of the equipment that this document details. Specific
payment or purchase of copy(s) of this document does not transfer ownership.
COPYRIGHT
All content included on these pages are protected by U.S. and international copyright
laws. Further, even if not specifically noted as copyrighted, we consider this document in
its entirety as copyrighted. By using this document, you agree to honor all applicable
copyright laws and practices.
USE OF PROPRIETARY INFORMATION
This document includes detailed design information that is confidential, proprietary, and
may include trade secrets of LOADTEC. This information is not meant for public
dissemination, but made available only to you, the customer, for repair and maintenance
purposes only. By accessing this information, you are representing that your use is for
repair and/or maintenance only. You further represent that you will not use any of the
information for any purpose other then repair and/or maintenance or disseminate to any
third party or competitor for any reason.
WARRANTIES AND DISCLAIMERS
The contents of this document are provided without any warranties, either express or
implied, and it explicitly disclaims any implied warranties of merchantability or fitness for
a particular purpose.
APPLICABLE LAW AND DISPUTE RESOLUTION
By accessing this document, you agree that the laws of the State of Nevada will govern all
disputes that arise concerning the use of this document. Any disputes brought concerning
the terms of this agreement shall be in a state or federal court located in the State of
Nevada, Clark County.
DocUseTerms11032010(2).doc
Contents
At a glance
1 - Software License Agreement
2 - Introduction
3 - Installation
4 - Quick Start Guide
5 - The Main Data Screen
6 - Program/System Configuration
7 - Data Logging
8 - High Speed Response Data
9 - Test Scripts
10 - User Screens
LoadView Version 3.0.16
©2002 Load Technology Inc.
Table of Contents
LoadView Version 3
LoadView Version 3
Table of Contents
LoadView Version 3 ______________________________________________________ i
Table of Contents ________________________________________________________ i
List of Illustrations _______________________________________________________v
1.0 Load Technology's Software License Agreement ______________________ vii
1.0.1 Grant of License _______________________________________________ vii
1.0.2 Copyright ____________________________________________________ vii
1.0.3 Other Restrictions _____________________________________________ viii
1.1 Limited Warranty ________________________________________________ viii
1.1.1 Customer Remedies ____________________________________________ viii
1.1.2 No other Warranties _____________________________________________ ix
1.1.3 No Liability for Consequential Damages ____________________________ ix
2.0 Introduction ________________________________________________________ 1
2.1 New features of LoadView version 3 __________________________________ 1
2.2 Manual Conventions _______________________________________________ 3
3.0 Installation _________________________________________________________ 4
3.1 Registration/Licensing _____________________________________________ 5
3.2 Minimum System Requirements _____________________________________ 6
4.0 Quick Start Guide____________________________________________________ 7
4.1 Connect the System Under Test______________________________________ 7
4.2 Setup your Test Requirements ______________________________________ 8
4.3 Setup User Settings ________________________________________________ 9
4.4 Turn on the Cooling Fan(s) _________________________________________ 9
4.5 Setup High Speed Response Data ___________________________________ 10
4.6 Setup Data Logging_______________________________________________ 10
4.7 Adjust the Load __________________________________________________ 10
4.8 Start a Test Script ________________________________________________ 11
5.0 The Main Data Screen _______________________________________________ 12
5.1 The Main Menu __________________________________________________ 13
©2002 Load Technology Inc.
i
LoadView Version 3.0.16 - 05/12/2010
LoadView Version 3
Table of Contents
5.1.0 The File Menu ________________________________________________
5.1.1 The Screens Menu _____________________________________________
5.1.2 The Data Menu _______________________________________________
5.1.3 The Scripting Menu ____________________________________________
5.1.4 The Messages Menu ___________________________________________
5.1.5 The Help Menu _______________________________________________
13
13
14
14
15
16
5.2 The Quick Button Tool Bar ________________________________________
5.2.1 The Fan Control Button _________________________________________
5.2.1.1 The Fan Control Screen ___________________________________
5.2.2 The Load On/Off Control Button _________________________________
5.2.3 The Log Control Button _________________________________________
5.2.4 The Script Button(s)____________________________________________
5.2.5 The High Speed Response Buttons ________________________________
5.2.6 The Network Controller Buttons __________________________________
16
16
17
18
18
19
19
20
5.3 The Data Section _________________________________________________ 21
5.4 The Control Section ______________________________________________
5.4.1 The Automatic Page ____________________________________________
5.4.1.1 Direct Load Setting _________________________________________
5.4.1.2 Entering the Power Factor ___________________________________
5.4.1.3 Jogging the Load Setting ____________________________________
5.4.1.4 Power Factor Adjustment ____________________________________
5.4.1.5 The Preset Load Panel ______________________________________
5.4.1.6 The Load Setting Bar Graph __________________________________
5.4.1.7 Test Setup "Change" Buttons _________________________________
5.4.2 The Logging Page _____________________________________________
5.4.3 The Response Page ____________________________________________
5.4.4 The Manual Page ______________________________________________
24
24
24
25
25
26
26
26
27
27
29
30
6.0 Program/System Configurations _______________________________________ 31
6.1 Program Configuration ___________________________________________
6.1.1 The System Setup Page _________________________________________
6.1.1.1 Setting up the LoadView File Paths ____________________________
6.1.1.2 Message Log File __________________________________________
6.1.1.3 Demo Mode Setup _________________________________________
6.1.2 The Connection Page ___________________________________________
32
32
33
34
34
35
6.2 Network Controller Configuration __________________________________ 36
6.3 The Test Setup Screen ____________________________________________
6.3.1 The Test Setup Page____________________________________________
6.3.1.1 The Genset Capacity ________________________________________
6.3.1.2 Genset Nominal Voltage _____________________________________
6.3.1.3 Load Type ________________________________________________
6.3.2 The User Settings Page _________________________________________
6.3.2.1 Preset Loads Setting ________________________________________
6.3.2.2 Nominal Settings ___________________________________________
©2002 Load Technology Inc.
ii
38
39
39
39
40
40
41
41
LoadView Version 3.0.16 - 05/12/2010
LoadView Version 3
Table of Contents
6.3.2.3 Upon Loss of Com _________________________________________ 41
6.3.2.4 Control Voltage Type _______________________________________ 41
6.3.3 Step Setups Page ______________________________________________ 42
6.4 Sensor Calibration _______________________________________________
6.4.1 Voltage Sensor Calibration ______________________________________
6.4.2 Current Sensor Calibration ______________________________________
6.4.3 Sensor Zero Page ______________________________________________
43
44
45
46
6.5 The License Manager _____________________________________________ 47
6.6 Update System Firmware __________________________________________ 47
7.0 The Data Logging System ____________________________________________ 48
7.1 Recording Data (Logging) _________________________________________
7.1.1 Data Logging Concepts _________________________________________
7.1.1.1 User Defined Data Channels __________________________________
7.1.1.2 User Defined Channel Configuration ___________________________
48
48
49
49
7.2 The Log Viewer __________________________________________________
7.2.1 The File Menu ________________________________________________
7.2.1.1 Opening a Log Data File _____________________________________
7.2.1.2 Exporting to CSV __________________________________________
7.2.1.3 Printing Log Data Files ______________________________________
7.2.2 The Edit Menu ________________________________________________
7.2.2.1 Selecting Data Channels to View ______________________________
7.2.2.2 Recording User Data Channels ________________________________
51
52
52
54
54
58
59
61
8.0 High Speed Response Data ___________________________________________ 62
8.1 HSR Configuration _______________________________________________ 63
8.2 Plotting HSR Data________________________________________________
8.2.1 Plot Zoom Controls ____________________________________________
8.2.2 HSR Voltage and Frequency Recovery _____________________________
8.2.3 Plot Filtering _________________________________________________
8.2.4 Viewing Plot Data (non-graphical) ________________________________
8.2.5 Plot Configuration _____________________________________________
65
67
67
68
69
70
9.0 Test Scripting ______________________________________________________ 72
9.1 The Script File Editor _____________________________________________
9.1.1 The Script Editor Quick Buttons __________________________________
9.1.2 Test Step Types _______________________________________________
9.1.2.1 The Load Bank Group ______________________________________
9.1.2.2 The Logging Group_________________________________________
9.1.2.3 The Response Group ________________________________________
9.1.2.4 The User Data Group _______________________________________
72
74
75
76
79
80
82
10.0 User Screens (Custom Designed Screens) ______________________________ 83
10.1 Working with User Screens _______________________________________ 84
10.1.1 The Pop Up Menu ____________________________________________ 84
©2002 Load Technology Inc.
iii
LoadView Version 3.0.16 - 05/12/2010
LoadView Version 3
Table of Contents
10.1.1.1 The Meter Panel Grid ______________________________________ 85
10.2 The Meter Devices_______________________________________________
10.2.1 The Digital Meter_____________________________________________
10.2.2. The Bar Graph Meter _________________________________________
10.2.3 The Analog Meter ____________________________________________
10.2.4 The Graphic Device ___________________________________________
10.2.5 The Log Viewer Panel _________________________________________
10.2.5.1 The Log Viewer Panel Buttons _______________________________
10.2.6 The Button Device ____________________________________________
87
88
88
88
89
90
90
92
10.3 The Edit Mode __________________________________________________ 93
10.3.1 The Selected Meter ___________________________________________ 93
10.3.2 The Meter Editor _____________________________________________ 94
10.3.2.1 The Data Page ____________________________________________ 95
10.3.2.1.3 The Data Type Setting __________________________________ 95
10.3.2.1.2 Data Channel Settings __________________________________ 96
10.3.2.1.2 Autoscale Data ________________________________________ 97
10.3.2.1.3 Bar Graph Orientation __________________________________ 98
10.3.2.2 The Ranges Page __________________________________________ 99
10.3.2.2.1 The Range Colors and Reset Times _______________________ 100
10.3.2.2.2 The Range Type Setting________________________________ 100
10.3.2.2.2.3 Percent Range (%) ________________________________ 101
10.3.2.2.2.4 The Direct Range _________________________________ 102
10.3.2.2.2.5 The Center Zero Range _____________________________ 103
10.3.2.3 The Panel Setup Page _____________________________________ 104
10.3.2.4 The Label Setup Page _____________________________________ 106
10.3.2.5 The Meter Dial Settings ___________________________________ 108
10.3.2.6 The Bitmap Page _________________________________________ 111
10.3.2.6.1 The Glyph Page ______________________________________ 112
10.3.2.7 The Sounds Page _________________________________________ 113
10.3.2.8 The Button Style Page ____________________________________ 114
Index _______________________________________________________________ 117
©2002 Load Technology Inc.
iv
LoadView Version 3.0.16 - 05/12/2010
Table of Contents
LoadView Version 3
List of Illustrations
Figure 1 - The Main Data Screen __________________________________________
Figure 2 - The System Message Window ____________________________________
Figure 3 - The Quick Button Tool Bar ______________________________________
Figure 4 - The Fan Control Screen_________________________________________
Figure 5 - Log File Dialog _______________________________________________
Figure 6 - The Node Selection Window _____________________________________
Figure 7 - The Data Section (Digital Meter Page) _____________________________
Figure 8 - The Data Section (Bar Graph Page) _______________________________
Figure 9 - The Data Section (Status Page) ___________________________________
Figure 10 - The Control Section (Automatic Page) ____________________________
Figure 12 - The Control Section (Logging Page) ______________________________
Figure 13 - Log Headings Editor __________________________________________
Figure 14 - The Control Section (Response Page) _____________________________
Figure 15 - The Control Section (Manual Page) ______________________________
Figure 16 - The File Menu _______________________________________________
Figure 17 - Program Configuration (System Setup Page) _______________________
Figure 19 - The Connection Page__________________________________________
Figure 20 - Network Controller Configuration Screen _________________________
Figure 21 - The Test Setup Screen _________________________________________
Figure 22 - User Settings Page ____________________________________________
Figure 23 - Step Setups Page _____________________________________________
Figure 24 - Sensor Calibration Window_____________________________________
Figure 25 - Current Cal Page _____________________________________________
Figure 26 - Sensor Zero Page _____________________________________________
Figure 27 - License Manager _____________________________________________
Figure 28 - Record User Data Window _____________________________________
Figure 29 - User Defined Channel Setup Window _____________________________
Figure 30 - Log File Viewer ______________________________________________
Figure 31 - Open Log File Dialog _________________________________________
Figure 32 - CSV File Example ____________________________________________
Figure 33 - Log Print Page Setup __________________________________________
Figure 35 - Printer Setup Dialog __________________________________________
Figure 36 - Channel Selection Window _____________________________________
Figure 37 - Record User Defined Channel Dialog_____________________________
Figure 38 - HSR Configuration Screen _____________________________________
Figure 39 - Response (HSR) Plot Screen ____________________________________
Figure 40 - HSR Plot Printout ____________________________________________
Figure 41 - Voltage and Frequency Recovery Data ____________________________
Figure 42 - HSR Tabular Data ____________________________________________
Figure 43 - The Script File Editor _________________________________________
Figure 44 - The Script Test Setup Editor ____________________________________
Figure 45 - Set Load Editor ______________________________________________
©2002 Load Technology Inc.
v
12
15
16
17
19
20
21
22
22
24
27
28
29
30
31
32
35
36
38
40
42
43
45
46
47
49
50
51
52
54
55
58
59
61
63
65
66
67
69
73
76
77
LoadView Version 3.0.16 - 05/12/2010
LoadView Version 3
Table of Contents
Figure 46 - Record Data Line Editor _______________________________________ 79
Figure 47 - HSR Configuration Screen _____________________________________ 80
Figure 48 - User Designed Screen _________________________________________ 83
Figure 49 - The Log Viewer Panel _________________________________________ 90
Figure 50 - Log Setup Dialog _____________________________________________ 91
Figure 51 - Meter Editor_________________________________________________ 94
Figure 52 - The Data Page _______________________________________________ 95
Figure 53 - The Ranges Page _____________________________________________ 99
Figure 54 - The Panel Setup Page ________________________________________ 104
Figure 55 - Bevel Setting Examples _______________________________________ 105
Figure 56 - The Label Setup Page ________________________________________ 106
Figure 57 - Label Setting Examples _______________________________________ 107
Figure 58 - The Meter Dial Settings Page __________________________________ 108
Figure 59 - Analog Meter Settings ________________________________________ 109
Figure 60 - Meter Angle Setting Examples __________________________________ 110
Figure 61 - The Bitmap Page ____________________________________________ 111
Figure 62 - The Glyph Page _____________________________________________ 112
Figure 63 - The Sounds Page ____________________________________________ 113
Figure 64 - The Button Style Page ________________________________________ 114
Figure 65 - Button Style Examples ________________________________________ 114
©2002 Load Technology Inc.
vi
LoadView Version 3.0.16 - 05/12/2010
License Agreement & Warranty
1.0 Load Technology's Software License Agreement
This is a legal agreement between you (either an individual or an entity)
the end user, and Load Technology Inc. If you do not agree to the terms of
this agreement, promptly return the software package and accompanying
materials (including written materials and binders or other containers) to
the place you obtained them for a full refund.
1.0.1 Grant of License
This Load Technology Inc (Loadtec) License Agreement (“License”)
permits you to use the copy of the current version of this Loadtec software
(“Software”) on any single computer, provided the Software is in use only
on one computer at any given time. If you have multiple Licenses for the
Software, then at any time you may have as many copies of the Software
in use as you have Licenses. The Software is “in use” on a computer when
it is loaded into the temporary memory (i.e., RAM) or installed into the
permanent memory (e.g., hard-disk, CD ROM, or other storage device) of
that computer, except that a copy installed on a network server for the sole
purpose of distribution to other computers is not “in use”. If the
anticipated number of users of the Software will exceed the number of
applicable Licenses, then you must have a reasonable mechanism or
process in place to assure that the number of persons using the Software
does not exceed the number of Licenses. If the Software is permanently
installed on the hard-disk or other device of a computer (other than a
network server) and one person uses that computer more than 80% of the
time it is in use, then that person may also use the Software on a portable
or home computer.
1.0.2 Copyright
The Software is owned by Load Technology Inc or its suppliers and is
protected by United States copyright laws and international treaty
provisions. Therefore, you must treat the Software like any other
copyrighted material (e.g., a book or musical recording) except that you
may either (a) make a copy of the Software solely for back-up or archival
purposes, or (b) transfer the Software to a single hard-disk provided you
keep the original solely for back-up or archival purposes. You may not
copy the written materials accompanying the Software.
©2002 Load Technology Inc.
vii LoadView Version 3.0.16 - 05/12/2010
License Agreement & Warranty
1.0.3 Other Restrictions
This Loadtec License Agreement is your proof of license to exercise the
rights granted herein and must be retained by you. You may not rent or
lease the Software, but you may transfer your rights under this Loadtec
License Agreement on a permanent basis provided you transfer this
License Agreement, the Software, and all accompanying written materials
and retain no copies, and the recipient agrees to this Agreement. You may
not reverse engineer, reverse compile, or disassemble the Software. Any
transfer of the Software must include the most recent update and all prior
versions.
1.1 Limited Warranty
Load Technology Inc warrants that (a) the Software will perform
substantially in accordance with the accompanying written materials for a
period of ninety (90) days from the date of receipt; and (b) any hardware
accompanying the Software will be free from defects in materials and
workmanship under normal use and service for a period of one (1) year
from the date of receipt. Any implied warranties on the Software and
hardware are limited to ninety (90) days and one (1) year respectively.
Some states do not allow limitations on duration of a implied warranty, so
the above limitation may not apply to you.
1.1.1 Customer Remedies
Load Technology's entire liability and your exclusive remedy shall be, at
Load Technology's option, either (a) return of the price paid or (b) repair
or replacement of the Software or hardware that does not meet Load
Technology's limited Warranty and that is returned to Loadtec with a copy
of your receipt. This limited Warranty is void if failure of the Software or
hardware results from accident, abuse, or misapplication. Any replacement
Software will be warranted for the remainder of the original warranty
period or thirty (30) days, whichever is longer.
©2002 Load Technology Inc.
viii LoadView Version 3.0.16 - 05/12/2010
License Agreement & Warranty
1.1.2 No other Warranties
Load Technology disclaims all other warranties, either expressed or
implied, including but not limited to implied warranties of merchantability
and fitness for a particular purpose, with respect to the Software, the
accompanying written materials, and any accompanying hardware. This
limited warranty gives you specific legal rights. You may have others,
which vary from state to state.
1.1.3 No Liability for Consequential Damages
In no event shall Load Technology Inc. or its suppliers be liable for any
damages whatsoever (including, without limitation, damages for loss of
business profits, business information, or pecuniary loss) arising from the
use of or inability to use this Load Technology Inc product, even if Load
Technology Inc has been advised of the possibility of such damages.
Because some states do not allow the exclusion or liability for
consequential or incidental damages, the above limitation may not apply
to you.
For more information about Load Technology's licensing policies call
Load Technology Inc at (702) 643-8750 or write:
Customer Service Department
Load Technology Inc
4225 Production Court
Las Vegas, Nv. 89115
or fax to: (702) 643-8751
©2002 Load Technology Inc.
ix
LoadView Version 3.0.16 - 05/12/2010
Operator's Manual
LoadView Version 3
LoadView Version 3.0
2.0 Introduction
Welcome to LoadView version 3.0. The LoadView software turns your
IBM compatible PC computer into a control center for Load Technology's
load banks and load bank systems. LoadView provides easy access to all
of the data and controls of these systems.
LoadView connects to the remote system via the computer's serial port.
The remote system can be a single load bank, a resistive load bank with a
connected inductive load bank, or a system of load banks connected to a
Network Controller.
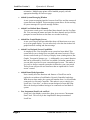
2.1 New features of LoadView version 3
Many new enhancements have been added to LoadView version 3. The
following highlights the most significant of those changes.
•
Added Network Controller Interface
LoadView version 3 has been designed to operate with the Loadtec
Network Controller. This allows a system to be made up of a combination
of up to 8 different Resistive/Inductive load banks.
•
New File Pathing Scheme
All of LoadView's files are now maintained in a new user configured
directory structure. This structure makes it easy for complete system
definitions (i.e. data files, screen designs, test scripts, etc..) to be copied
from one system to another by simply copying the root directory.
•
Added Sensor Calibration
Complete sensor calibration (voltage, current, and auto zeroing) can now
be performed from within LoadView directly.
•
New And Improved Log Data Viewer
A completely new Log Data Viewer has been added to LoadView. This
viewer fixes many of the deficiencies of the previous system and allows
the Log to be viewed as data is being recorded. You can now scroll
through the data in a large file without losing the column headings.
•
New Log Data Print Handler
Added to the new Log Viewer is a whole new set of print functions. You
can control the headings, user description data, font size, and print
©2002 Load Technology Inc.
Page 1
LoadView Version 3
Operator's Manual
orientation. Multiple page prints will be handled properly with the
appropriate headings on each new page.
•
Added System Messaging Window
A new system-messaging interface between LoadView and the connected
system has been designed. This messaging system allows for the tracking
of system messages in a special message window.
•
Added User Defined Data Channels
You can now record up to 8 user defined data channels into the Log Data
file. You can setup the names and units for these channels and you will be
prompted to enter the data as data lines are recorded to the log.
•
Added Bar Graph Display Screen
A new screen layout has been added that shows all data items on an easy
to view bar graph display. You can selectively color the data in these bar
graphs based on warning and alarm settings.
•
Added User Designed Screen Capabilities
A completely new User designed screen system has been added. This
system allows you to design your own data and control screen(s). These
screens can be made up of a variety of display items (Analog meters, Bar
Graphs, Text panels, bitmaps, etc…). Additionally every control function
that can be performed by LoadView is available via button controls that
you can place anywhere in your custom designed screens. This makes it
very easy to design a custom system that is tailored to your exact needs.
These screens can provide user interfaces that are optimized for "touch
screen" control.
•
Added Demo Mode Operation
Now virtually all of the functions and features of LoadView can be
explored even without a Load Bank or Network Controller hooked up.
With the new demo mode, the system will emulate from 1 to 8 load banks
connected via a Network Controller. This makes it easy to simply give
LoadView a "test drive", or allows custom designed screens and script
files to be developed without having to be connected to a load bank or
system.
•
New Instrument Panel Look and Feel
LoadView's data display screens have been given a newer "Instrument
Panel" look. This new style has simplified the data presentation of
LoadView.
Page 2
LoadView Version 3.0.16 - 05/12/2010
Operator's Manual
LoadView Version 3
2.2 Manual Conventions
There are several special conventions that will be followed throughout this
text. These conventions should make it easier for you to get to the
information you need quickly.
Warning! This indicator is used to highlight information that is
critical to the operation or configuration of the system. Typically
information of this type can have an adverse effect on the operation of the
system if incorrect or inappropriate settings are entered.
Special note. This indicator will be used to highlight data that
provides additional background information on the subject at hand.
This indicator will be used to identify information that is specific to
operation of a networked system. LoadView is capable of being
connect to a single load bank or a system of networked load banks that are
controlled by the Network Controller.
Differing typefaces will also be used to further highlight different
types of data.
Italics - this typeface will be used to indicate new terms that are
being introduced or indexed keywords.
Boldface - this typeface will be used to indicate text that you must
enter (i.e. in response to an on screen dialog).
[Optional] - text contained in brackets indicates optional data
entry.
©2002 Load Technology Inc.
Page 3
LoadView Version 3
Operator's Manual
3.0 Installation
LoadView is distributed on CD-ROM, 3.5" floppy disks, or over the
Internet via a single executable installation file. The LoadView system is
made up of a few executable files and numerous configuration and setup
files. Please insure that you have met the "Minimum System
Requirements" (as specified below) before installing LoadView.
CD-ROM
1. Insert the distribution CD into your CD-ROM drive.
2. If "AutoRun" is enabled, the install program will start
automatically.
3. If your CD dose not "AutoRun" then Click on Start, and Select
Run.
4. Type in D:\SETUP.EXE (if your CD-ROM is not drive D, type the
appropriate letter instead).
5. Click OK to install.
6. Follow the on screen instructions.
FLOPPY DISKS
1. Insert the installation diskette #1 into your floppy drive.
2. Click on Start, and select Run.
3. Type in A:\SETUP.EXE (if your floppy is not drive A, then type
the appropriate letter instead).
4. Click OK to install.
5. Follow the on screen instructions.
Internet/e-mail (Single File Install)
1. Click on Start, and select Run.
2. Enter the single file name (either LDVIEW3.EXE or
LV3DEMO.EXE) or browse to the file using the BROWSE button.
3. Once the file name has been entered or selected, Click OK to
install.
4. Follow the on screen instructions.
The install software will install all of the required files on your computer's
hard drive. Once the programs have been installed, LoadView can be
started from your computer's Start menu -- Press the Start button,
Programs and select the LoadView group. From within that group select
LoadView.
Page 4
LoadView Version 3.0.16 - 05/12/2010
Operator's Manual
LoadView Version 3
3.1 Registration/Licensing
The LoadView software and the optional High Speed Response system
must be licensed for use. Previous versions of LoadView made use of a
specialized "Key File". For compatibility sake, LoadView version 3 can
also make use of this key file.
Due to the new networking capabilities a more sophisticated
registration/licensing system had to be developed. In this new system, the
registration and licensing is contained in the remote system (i.e. the Load
Bank, Network Controller, etc…).
There are three types of information that is maintained in the remote
system. These are the:
•
•
•
System Registration - Each hardware system (i.e. Load Bank,
Network Controller, etc…) must be registered for use. An
unregistered system will not allow any data to be measured or load
to be applied.
LoadView License - This license is used to allow the remote
system to be connected to LoadView.
High Speed Response License - This license is used to enable
the High Speed Response system.
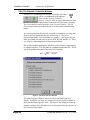
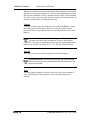
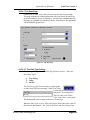
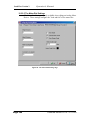
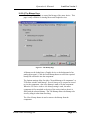
When LoadView is
started if no Key File
is found or the
LoadView license is
not enabled in the
remote system, then
this dialog will be
shown. From this
dialog, you can
select one of the following:
• Load a Key File
• Enter license numbers (via the License Manager)
• Run in the Demo mode
• Cancel, run unlicensed
©2002 Load Technology Inc.
Page 5
LoadView Version 3
Operator's Manual
3.2 Minimum System Requirements
LoadView will operate on virtually any IBM Compatible computer with
enough Hard Drive space to contain its files, and memory to operate.
There is a point at which a lesser computer begins to operate so slowly
that the system becomes much less useful. The following is to be
considered a "guide" to the minimum recommended system:
• IBM Compatible Computer
• 233 MHz Pentium or better Processor
• Operating System: Windows® 9x, 2000, or NT 4.0 or newer.
LoadView will NOT operate on Windows 3.1x
• Memory: 32 MB
• Hard Drive: Recommend 100 MB of free hard drive space
• Video: LoadView main data screens have been designed for a 640
x 480 resolution display screen. This was done to accommodate
the most readily available laptop screen sizes. Much more intricate
and detailed screens can easily be designed using the Custom
Screen capabilities of LoadView.
• Keyboard
• Mouse or trackball
• At least one serial port.
Page 6
LoadView Version 3.0.16 - 05/12/2010
Operator's Manual
LoadView Version 3
4.0 Quick Start Guide
LoadView has been design to maximize your testing efficiency. This
section is meant to give you an overall view of the process of testing. The
details of each of the input screens and controls of LoadView are covered
in other sections of this manual. If you are new to LoadView, you should
begin by studying the other sections of this manual in its entirety first.
Then come back to this section.
The test process can be reduced to these simple steps:
1. Connect to the system under test.
2. Power up your system under test.
3. Power up the test system (Load Bank(s) or the Network
Controller).
4. Enter the Test Setup data.
5. Turn on the cooling fan(s).
6. Begin Testing.
Note that steps 4, 5, and 6 can actually be performed from within a test
script if you are using script files. Otherwise these steps must be
performed manually. In essence load cannot be applied until the load
bank(s) are on and the cooling fans running. If there are any system errors
while the cooling fans are starting up, you will be informed via messages
and will not be allowed to continue until the error is corrected.
4.1 Connect the System Under Test
Follow the documentation for your load bank(s), and or the Network
Controller to connect your power source under test. Once the power
source is connected and power up, you are ready to begin testing.
Power On the Load Bank(s)
The connected load bank system needs to be powered on.
Network System - If you are using a Networked system (via the
Network Controller), the load banks can be turned on from the
Main Data Screen. The Green LED on the "LB Power"
button indicates the state of the networked load banks. If
the LED is off, click the mouse on this button to turn on the
load banks.
©2002 Load Technology Inc.
Page 7
LoadView Version 3
Operator's Manual
If you are not using a networked system, then the load bank must be
turned on from its local control panel, or a connected Remote User
Interface.
Once the load banks are turned on, and the power source is running, the
voltage readings will indicate the current bus voltages.
4.2 Setup your Test Requirements
LoadView needs some information about the system that you are testing.
This information is entered via the Test Setup screen. The Test Setup
screen is accessed via Setup from the File Menu, pressing the Genset Size
"Change" button, or pressing the Nominal Voltage "Change" button.
The Genset
Size and
Nominal
Voltage
buttons shown are visible on the Automatic Page of the Control Section.
Clicking either of these buttons provides access to the Test Setup screen.
Note that the term Genset Size simply implies the capacity of your power
source (the system under test). This may or may not be a generator or
system of generators.
Page 8
LoadView Version 3.0.16 - 05/12/2010
Operator's Manual
LoadView Version 3
4.3 Setup User Settings
There are additional User Settings that can be made. These settings
include the Preset Load values, Jog Value, and others. Modify/Enter any
User Settings as required.
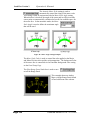
4.4 Turn on the Cooling Fan(s)
Before load can actually be applied, the cooling fan(s) in each load bank
must be turned on. If you are testing via a pre-defined script
file, the fan(s) can be controlled from the script itself. If you
are not using a test script, then the cooling fans must be turned
on manually. The Fan Control Button is used to control the
cooling fan(s). If the fans are running, then this button will animate a
rotating fan. If the fan(s) are off, then it will appear as shown. Click this
button to toggle the fan(s) on and off.
©2002 Load Technology Inc.
Page 9
LoadView Version 3
Operator's Manual
Networked System - If the Network Controller is setup to operate
with independent fan control, then pressing the Fan Control Button
will open the Fan Control Screen. From this screen turn on/off the fans as
required.
4.5 Setup High Speed Response Data
If your system includes the optional High Speed Response system (HSR),
then it must be setup and enabled if it is to be used. The High
Speed Response system is configured via the Response page of
the Control Section. The High Speed Response system is
enabled/disabled via the indicated button. The HSR system
can also be configured from within a test script.
4.6 Setup Data Logging
If you want to Log Data, then Data Logging must be setup. Data Logging
is configured via the Logging page of the Control Section.
Data can be logged based on time interval, change in load
setting, or both. Data Logging is enabled/disabled via the Data
Logging Button. Data Logging can also be configured from
within a test script.
4.7 Adjust the Load
The main goal of the load bank system is to apply load to the system under
test, and measure the results. Once the above steps have been performed,
adding load is very simple. There are various ways in which you can
manually set the load being applied. These are:
• Direct Load Entry - Whenever the Automatic Page of the Control
Section is showing, simply typing in the desired load value
followed by the Enter key enters that load. For instance, typing
"500" and pressing the Enter key will place 500 KW of load on the
system. Furthermore, if there are inductive load bank(s) in the
system, the power factor can also be entered (i.e. entering "500.85"
would place 500 KW of load at a 0.85 power factor). A power
factor alone can be entered by pressing the decimal point key "."
then entering the desired power factor. (ref. 5.4.1 The Automatic
Page).
Page 10
LoadView Version 3.0.16 - 05/12/2010
Operator's Manual
•
•
LoadView Version 3
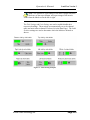
Selecting a Preset Load Value - Simply clicking one of the Preset
Loads keys
will place the
appropriate
load on the
system. If a
power factor command had been previously entered, then that
power factor will be maintained when a Preset Load button is
clicked.
Toggling Load On/Off - Once a load command
has been entered by any of the above methods,
then pressing the Load On/Off Button will toggle
the load off and on.
4.8 Start a Test Script
If you are testing via a test script, then all that needs to be done before the
test is started is to insure that the system is connected and powered on (4.1
Connect the System Under Test). The test script can be written to perform
all other required setup as a part of the test.
Select Scripting | Execute Script | … from the Main Menu
to select the script
file to run. The
Run Script quick
button can also be used to
execute the most recently used
script file.
©2002 Load Technology Inc.
Page 11
LoadView Version 3
Operator's Manual
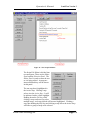
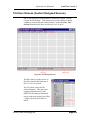
5.0 The Main Data Screen
When LoadView begins operating, the Main Data Screen is shown on the
screen. This is the main interface to the LoadView system.
Figure 1 - The Main Data Screen
The Main Data Screen is divided into three sections. These are:
1. The Tool Bar.
2. The Data Section
3. The Control Section.
As with most Windows® programs, LoadView also contains a Main
Menu. The Main Menu is the pull-down menu at the top line of the screen
Page 12
LoadView Version 3.0.16 - 05/12/2010
Operator's Manual
LoadView Version 3
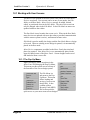
5.1 The Main Menu
The Main Menu bar is made up of six menus. These are the File Menu,
Screens Menu, Data Menu, Scripting Menu, Messages Menu, and the Help
Menu.
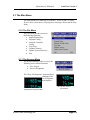
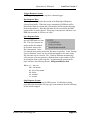
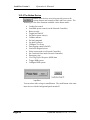
5.1.0 The File Menu
The File Menu provides access to
the following functions:
• Import/Export Data
• Program Config…
• Network Controller
Config…
• Test Setup…
• Calibrate Sensors…
• Update System Firmware…
• Exit
5.1.1 The Screens Menu
The Screens Menu provides access to the
following screen related functions:
• User Screens
• Show Off Segments
The "Show Off Segments" function allows
changing of the
Seven Segment
data displays.
Off Segments Active (Checked)
©2002 Load Technology Inc.
Off Segments Inactive
(Unchecked)
Page 13
LoadView Version 3
Operator's Manual
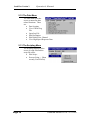
5.1.2 The Data Menu
The Data Menu provides
access to numerous data
related functions. These
are:
• Data Logging
• View Current Log
File
• Open Log File
• Edit Description
• Edit Default User Channel
• View High Speed Response Data
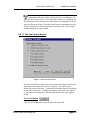
5.1.3 The Scripting Menu
The Scripting Menu provides
access to script files and the
script file editor.
• Edit Script…
• Execute Script > {Most
recently Used File list}
Page 14
LoadView Version 3.0.16 - 05/12/2010
Operator's Manual
LoadView Version 3
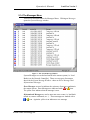
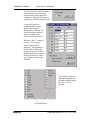
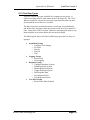
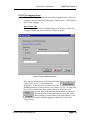
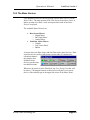
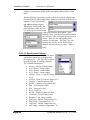
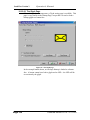
5.1.4 The Messages Menu
There are no functions under the Messages Menu. Clicking on Messages
opens the System Message window.
Figure 2 - The System Message Window
System Messages are created and stored in the remote system (i.e. Load
Bank(s) or the Network Controller). There are two types of messages
shown in the System Message Window - these are Error Messages and
Informational Messages.
Error Messages are used to indicate the existence of an error condition in
the remote system. Error Messages are indicated with a
or
icon.
The yellow icon indicates that the message is new.
Informational Messages are used to note non-error events (i.e. load bank
turned on, sensors calibrated, etc…). These messages are marked with a
or icon. Again the yellow icon indicates a new message.
©2002 Load Technology Inc.
Page 15
LoadView Version 3
Operator's Manual
5.1.5 The Help Menu
The Help Menu provides access to
LoadView's help system. The
About function under the Help
Menu provides access to the
LoadView About window. This
window provides information on
the system type, version number,
and enabled serial numbers.
The About Box indicates the
Internal File version number,
LoadView system version number
and the enabled serial number list.
Note that the Enabled serial
numbers will only be shown for
systems that make use of the Key
File. Newer systems are enabled via the Licenses Manager (ref. 3.1
Registration/Licensing)
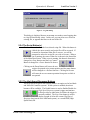
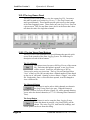
5.2 The Quick Button Tool Bar
The Tool Bar shown at the top of the Load View Main Data Screen is
made up of a variety of "Quick Buttons" as shown:
Figure 3 - The Quick Button Tool Bar
Each of these buttons provides a "Quick" interface to their selected
functions.
5.2.1 The Fan Control Button
The Fan Control Button provides both an indication of the current state of
the cooling fan(s), and a method to control the
fan(s). Clicking this button toggles the Fan(s)
On/Off. There is a process that must take place
in the load banks when the fans are commanded
on. This process can take many seconds.
Status messages are shown in the Status Bar of the Main Data Screen that
indicates the state of this process.
Page 16
LoadView Version 3.0.16 - 05/12/2010
Operator's Manual
LoadView Version 3
Network System - If the Network Controller is configured for
independent fan control, then clicking the Fan Control Button will
open the Fan Control Screen. If the Network Controller is configured for
fixed fan control, then the fan(s) at each module are commanded on or off
when this button is clicked. Note that when fans are commanded on, they
will be "sequenced" so that the generator system does not see the load of
all fans starting at the same instant.
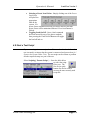
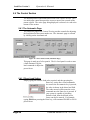
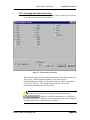
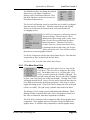
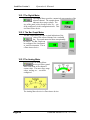
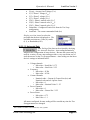
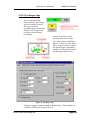
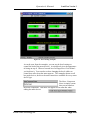
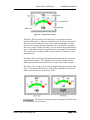
5.2.1.1 The Fan Control Screen
Figure 4 - The Fan Control Screen
The Fan Control Screen shows the current status of the fans of each of the
load banks connected to the Network Controller. The check boxes
indicate the status of the fans - a checked box indicates that the cooling fan
at that node is turned on. Clicking a check box, or the text to the right of
it, will cause the cooling fan of the load bank at that node to be toggled
on/off.
The All Off Button
Click the All Off Button to cause all fans to be turned off.
©2002 Load Technology Inc.
Page 17
LoadView Version 3
Operator's Manual
The All On Button
Click the All On Button to cause the fans at each load bank connected to
the Network Controller to be turned On. Again the fans will be
"sequenced" on - one at a time.
The Auto On Button
The Auto On Button causes the system to turn fans On/Off as required
automatically. When this button is clicked, the system will insure that
there is enough load capacity to achieve 125% of the Genset Capacity (as
configured in the Test Setup screen) and a 0.80 power factor (if there is
sufficient inductive load available).
If required, all of the fans in the connected load banks will be turned on.
The maximum load the system can apply is the sum of each of these load
banks. If more capacity is on than is needed, then the excess load bank(s)
will be turned off. The design goal of the Auto On function is to minimize
the number of load banks that are turned on, thus resulting in the lowest
possible minimum load.
5.2.2 The Load On/Off Control Button
The Load On/Off Control Button provides an indication of the current
load state and a method for controlling the load.
Clicking this button toggles the load On/Off.
When there is load on the system, and this
button is pressed the system saves the current
load settings then turns off all load steps (both resistive and inductive
load). After the load has been turned off via this button, then clicking it
again will restore all load settings to the previously saved values.
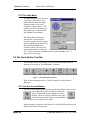
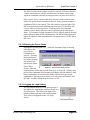
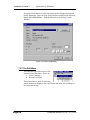
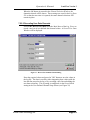
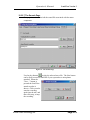
5.2.3 The Log Control Button
The Log Control Button is used to turn on and off the Data Logging
functions and to show the current state of Data Logging. If
Data Logging is off, then clicking this button
will cause logging to be started. If the
selected log file exists when this button is
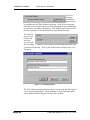
clicked, then the Log File Dialog is displayed.
Page 18
LoadView Version 3.0.16 - 05/12/2010
Operator's Manual
LoadView Version 3
Figure 5 - Log File Dialog
This dialog is displayed because an attempt was made to start logging data
to a log file that already exists. In this case you can either over-write the
existing file, or append data lines to the end of the file.
5.2.4 The Script Button(s)
This button is used to start the last selected script file. When this button is
clicked, the most recently used script file will be executed. If
it cannot be determined what file to execute, you will be
prompted to select the script file you wish to execute. When a
test is running, the status of that test is shown in the Status Bar
of the Main Data Screen. When a test is running, this button's function is
changed to a Stop function and the Log Control
Button is changed to a Pause function as shown.
Clicking on the Pause Button will cause the test
script to be paused at its present position and the pause button
will be changed to a Resume function. Clicking on Resume
will cause the test to resume operation from point at which it
was paused.
5.2.5 The High Speed Response Buttons
The High Speed Response data system (HSR) is an option to the load bank
and Network Controller systems. If this system is enabled, then these
buttons will be available. The Enable button is used to Enable/Disable the
High Speed Response system's trigger mechanisms.
It also provides an indication of whether the trigger is
currently enabled. The Resp Data button is used to
display a graph of either the current High Speed
Response data (stored in the load bank system), or a stored HSD (High
Speed Data) file.
©2002 Load Technology Inc.
Page 19
LoadView Version 3
Operator's Manual
5.2.6 The Network Controller Buttons
If LoadView is connected to a Network Controller, then there
will be two additional Quick Buttons.
These are the Network Controller
Buttons. They are used to control and select the load
banks that are connected to the Network Controller.
The View button is used to open the Node Selection Window. The LB
Power button is used to control the power at each of the connected load
banks.
In a networked system the network controller is constantly receiving data
from each of the load banks that are connected to it. The power
measurements made at the load banks are complex -- that is that they are
made up of both real and reactive power (KW, KVAR, and KVA). There
is a complex relationship between these measurements.
Due to this complex relationship, data from each load bank cannot simply
be summed together. The data must be combined mathematically. This is
one of the primary functions of the Network Controller.
KVA = KW 2 + KVAR 2
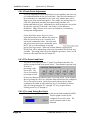
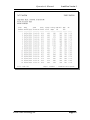
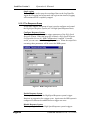
Figure 6 - The Node Selection Window
The Node Selection Window is used to select what data LoadView
display. LoadView can show the Combined Data from all load banks, or
show the data from a specific node. This form is also displayed when an
attempt is made to show the Manual Load Step page when the system is in
the Combined Data mode.
Page 20
LoadView Version 3.0.16 - 05/12/2010
Operator's Manual
LoadView Version 3
This window also provides information on the load banks that are
connected to the Network Controller. The size of the load bank, its
voltage rating, serial number, and the current state of its cooling fan is
shown.
When a connection is made to a load bank node, the View button is
changed to indicate what node is connected. In the example
shown, the system is connected to the load bank at node 5.
Clicking this button will again open the Node Selection
Window. All measured and calculated data shown in the
Data Section will be the data from the connected node, or the Combined
Data when in the Combined mode.
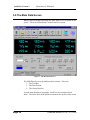
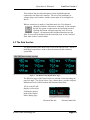
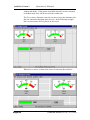
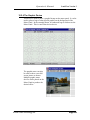
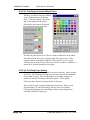
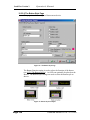
5.3 The Data Section
The upper portion of the Main Data Screen is the Data Section. This is a
multi-page control that is used to show the measured and calculated
system data.
Figure 7 - The Data Section (Digital Meter Page)
The different pages of the Data Section are selected via the tabs along the
top of the page. The Digital Meter Page, shown above, provides a digital
indication of each of the measured and calculated data items.
KVA versus KVAR
display is selected by
clicking the desired
mode in the Digital
Meter display page.
©2002 Load Technology Inc.
Page 21
LoadView Version 3
Operator's Manual
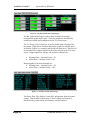
Figure 8 - The Data Section (Bar Graph Page)
The Bar Graph Meter Page is used to show each data item using a
horizontal bar graph display item. These bar graphs are automatically
scaled based on the data configured via the Test Setup screen.
The Use Range Colors check box is used to enable limit coloring of the
bar graphs. If this box is checked, then the bar graphs are colored green
for normal, Yellow as a warning, and Red for an alarm level. These levels
are automatically computed based on the values entered in the Test Setup
screen. Ranges applied to voltage, and frequency channels are:
•
•
Warning State = Nominal Value ± 5%
Alarm State = Nominal Value ±10%
Ranges applied to all other channels are:
• Warning State = Nominal Value + 5%
• Alarm State = Nominal Value + 10%
Figure 9 - The Data Section (Status Page)
The Status Data Page displays "status like" information from the remote
system. This includes, temperatures, Control voltage and frequency,
interlock/safety switch status, and firmware version numbers.
Page 22
LoadView Version 3.0.16 - 05/12/2010
Operator's Manual
LoadView Version 3
Network System - When LoadView is connected to a networked
system (via the Network Controller) the status information shown
on this page depends on what Data Mode is active. If viewing Combined
Data, then the temperature data reflects the maximum temperature of all
nodes. The remaining status data is zero (or off for switch states). When
connected to a given node, then this data reflects the status information
from that node. The node selection is made via the Network Controller
Buttons (see section 5.2.6 The Network Controller Buttons).
©2002 Load Technology Inc.
Page 23
LoadView Version 3
Operator's Manual
5.4 The Control Section
The bottom portion of the Main Data Screen is the Control Section. This
is a multi-page control that provides access to most of the controls of the
remote system. The active page being displayed is selected via a tab at the
bottom of the section.
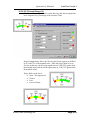
5.4.1 The Automatic Page
The Automatic page of the Control Section provides controls for adjusting
the load placed on the system under test. The Automatic page is selected
by clicking on the Automatic tab.
Figure 10 - The Control Section (Automatic Page)
This page is made up of a few panels. The Set Load panel is used to enter
a load command, Jog the
load command or adjust the
power factor.
5.4.1.1 Direct Load Setting
Simply typing the numeric load value required, and then pressing the
Enter key, enters direct Load commands.
As soon as the first numeric key is pressed,
the value is shown in the direct load field.
The value entered will become the active
command once the Enter key is pressed. If
your system is capable of providing
Inductive load, then the desired power
factor can also be entered. For example,
typing 500.8 then pressing the Enter key, will command 500 KW at a 0.80
power factor.
Page 24
LoadView Version 3.0.16 - 05/12/2010
Operator's Manual
LoadView Version 3
The direct load in current (amps) can also be entered. First insure that the
"Amps" radio button is selected, and then enter the desire load in amps.
Again the command is actually acted upon when you press the Enter key.
Once a power factor command has been entered, it will remain in effect
until a new power factor command is entered. In the previous example, a
command of 500.8 was entered. This will cause the system to place 500
KW of resistive load, and a sufficient inductive load (375 KVAR in this
case) to achieve a 0.8 power factor. Entering a new load command
without a power factor will cause a new load setting at the same power
factor. For example if a load command of 700 is entered (with no decimal
portion) then the load will be commanded to 700 KW and the system will
adjust the inductive load to maintain the 0.80 power factor (525 KVAR in
this case).
5.4.1.2 Entering the Power Factor
Pressing the decimal point key (.) while the Automatic Page is showing
will allow a new
power factor
command to be
entered. Pressing
the decimal point
key before pressing
any numeric key
activates the Power
Factor Entry
Figure 11 - Power Factor Entry Screen
Screen. Enter the
required power factor and press the Enter key, or click OK. Setting a new
power factor command in this manner will change only the Inductive load
being commanded, the resistive load (KW) will remain as previously
commanded. Entering a power factor of .0 will remove all reactive load
(KVAR). In effect setting the power facto to 1.00.
5.4.1.3 Jogging the Load Setting
The Jog buttons on the Set Load panel provide a
mechanism for stepping the load up or down by a
fixed increment. The value to the right of the
buttons indicates the size of the Jog Increment.
This value is configured via the Test Setup
Screen.
©2002 Load Technology Inc.
Page 25
LoadView Version 3
Operator's Manual
5.4.1.4 Power Factor Adjustment
If you are operating a system with Inductive load capability, then there are
two additional buttons on the Set Load Panel. Since the load elements of
the load bank(s) are commanded in an "open loop" manner there can be
slight errors in the actual load applied. For example the cooling fan(s) in
each of the load banks and their associated wiring contribute to a
background Inductive load. Additionally the load elements are not perfect
they provide a given KVAR load ± the accuracy of the Inductors
themselves. Many of these errors can be accounted for via numerous
settings and configurations.
Given all of these issues, the power factor
adjust buttons have been added to the system to
allow the power factor to be "tweaked" in to
exactly the commanded value. Once the load
and power factor have been commanded, press
the PF Adj up or down buttons to step the
power factor up or down. When one of these buttons is pressed, the
KVAR load will be adjusted up or down by the smallest KVAR load step
available. The setting achieved by this method is persistent - that is it will
remain in effect until the fans are turned off.
5.4.1.5 The Preset Load Panel
The Preset Load Panel provides 5 "preset" load buttons that allow for
quickly setting the load to the preset values. These buttons represent load
in terms of
percentage of the
Genset Size. The
Genset Size and the
percentage of each
of the preset buttons are entered via the Test Setup screen. In the example
shown, pressing the 100% key will place load equivalent to the configured
Genset Size on the system. Again a previously entered power factor
command will remain in effect when the Preset Load button is clicked.
Note also that pressing the "F1" through "F5" keys is equivalent to
clicking preset key #1 through #5.
5.4.1.6 The Load Setting Bar Graph
The Load Setting Bar Graph indicates the current load command (in KW).
This bar graph is scaled by the
configured Genset Size value. The
actual command value is also
indicated.
Page 26
LoadView Version 3.0.16 - 05/12/2010
Operator's Manual
LoadView Version 3
5.4.1.7 Test Setup "Change" Buttons
The Genset Size and Nominal Voltage values are also shown on the
Automatic Page. Pressing either of the "Change" buttons provides quick
access to the Test Setup Screen.
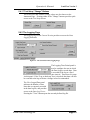
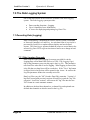
5.4.2 The Logging Page
The Logging Page of the Control Section provides access to the Data
Logging functions.
Figure 12 - The Control Section (Logging Page)
The Logging Time Period panel is
used to configure the rate in which
the Data Logger records data. Data
is recorded to the log at a fixed
time interval. That interval is setup
via this panel. If the "Log on load step" box is checked, then data will also
be recorded to the log each time a change in load is commanded.
The View Logged Data panel
indicates the number of data
lines that are currently recorded
in the data log file, and provides
access to the Data Log Viewer.
Pressing the "View" button opens the currently defined log file.
©2002 Load Technology Inc.
Page 27
LoadView Version 3
Operator's Manual
The User
Channel
Definitions
panel is used
to configure the User Data Channel recording. If the "Record user data
channels" box is checked, then you will be prompted for user-defined data
as each line is recorded to the data log. The "Man Record" button is used
to force recording of a new data line in the log (Manual Record).
The Log File
panel is used
to show and
select the
active log file.
The "Headings…" button is used to edit the user heading information that
is stored in the data log. The Log File indicates the currently active Log
File name.
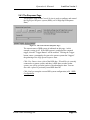
Figure 13 - Log Headings Editor
The Title and Description information that is stored in the log file is edited
via the Log Headings Editor. These headings are stored into the log file
and are printed with the log data when the log is printed.
Page 28
LoadView Version 3.0.16 - 05/12/2010
Operator's Manual
LoadView Version 3
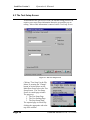
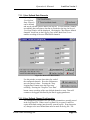
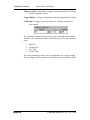
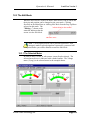
5.4.3 The Response Page
The Response Page of the Control Section is used to configure and control
the High Speed Response system (HSR) (ref 8.0 High Speed Response
Data).
Figure 14 - The Control Section (Response Page)
The current status of HSR system is indicated on this page - in this
example, tracing is off. If the HSR system is configured for a manual
trigger, then the "Trigger Button" will be enabled. Clicking the Trigger
button causes a command to be sent to the remote system that "triggers"
the gathering of the High Speed Response Data.
Click View Data to view a plot of the HSR data. If LoadView is currently
connected to a remote system, and there is HSR data recorded in that
system, you will be given the option of downloading the data. You can
also view a plot of a previously stored HSR data file.
Click Config to setup the current HSR system configuration (ref 8.1 HSR
Configuration).
©2002 Load Technology Inc.
Page 29
LoadView Version 3
Operator's Manual
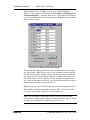
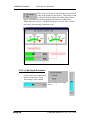
5.4.4 The Manual Page
The Manual Page is used to show the status of and control the setting of
each load step in the system.
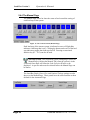
Figure 15 - The Control Section (Manual Page)
Each load step of the remote system is indicated as on or off (light blue
indicates a load step that is on). Clicking the button under each of the load
step indicators toggles that load step On/Off. Pressing an associated
function key (F1 - F12) can also be used.
Network System - In a networked system, attempting to select the
Manual Page (clicking the Manual Tab) when the system is in the
Combined Data mode will cause the Node Selection Window to be
displayed. A specific node must be selected before the Manual Page can
be shown.
The Load Bar Graph, Genset Size, and Nominal Voltage settings are also
shown on the Manual Page. These panels have the same function as those
defined for the Automatic Page.
Page 30
LoadView Version 3.0.16 - 05/12/2010
Operator's Manual
LoadView Version 3
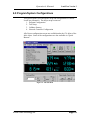
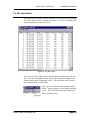
6.0 Program/System Configurations
This section guides you through the setup and configurations of various
LoadView parameters. The major setup screens are:
1. Program Configuration
2. Test Setup
3. Calibrate Sensors
4. Network Controller Configuration
All of these configuration screens are available under the File Menu of the
Main Menu. Some of the configurations are also available via "Quick
Buttons".
Figure 16 - The File Menu
©2002 Load Technology Inc.
Page 31
LoadView Version 3
Operator's Manual
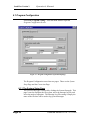
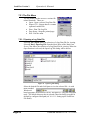
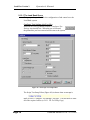
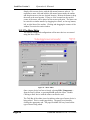
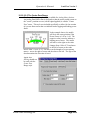
6.1 Program Configuration
Select File | Program Config… from the Main Menu to open the
Program Configuration Screen.
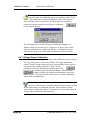
Figure 17 - Program Configuration (System Setup Page)
The Program Configuration screen has two pages. These are the System
Setup Page and the Connection Page.
6.1.1 The System Setup Page
The System Setup Page is selected by clicking the System Setup tab. This
page is used to configure the file system, select the message log file, and
select the mode of operation. The Message Log File setting is simply the
name of the file that will be used to log system messages.
Page 32
LoadView Version 3.0.16 - 05/12/2010
Operator's Manual
LoadView Version 3
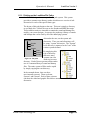
6.1.1.1 Setting up the LoadView File Paths
LoadView is designed to use a specific file path system. This system
provides a common root directory under which there are a series of subdirectories for each of the specific data types.
The layout of this path begins at the root. This root is simply a directory
on you hard drive. Below the root are the Sounds and BMP directories.
These sub-directories are intended to contain the sound and bitmap files
used by your screen designs. In essence they make up a library of sounds
and bitmaps that can be used by all of the underlying systems.
Also under the root, are the system subdirectories. There can, and often times will
be, many "system" directories. The "System"
level directory is meant to be the "root" of the
various systems defined.
Root Path
Sounds
BMP
System
Data
By employing this
type of directory
Scripts
structure, many
systems can exist
Figure 18 - File paths
under a given root
directory. Each of these systems can then make
use of a common library of sound and bitmap
files. The entire system of files can be copied
by simply copying the root directory.
Screens
In the example shown, there are three
user/customer systems. These are demo,
System1, and System2. Each of these systems
can share the sound and graphic files that are stored in the sound and bmp
directories.
©2002 Load Technology Inc.
Page 33
LoadView Version 3
Operator's Manual
The Root directory can be entered, or Browsed for via the "Browse"
button from the Program Configuration Screen. The User/customer Name
can be directly entered or browsed for by pressing the Browse… button.
Data, Scripting,
and Screens
must be entered
as required.
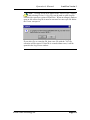
When you exit from the Program Configuration Screen LoadView will
check to insure that each of the directories specified exist on you hard
drive. Any directories that do not exist will automatically be created.
6.1.1.2 Message Log File
The Message log file parameter is used to select the file that the system
messages will be stored into. The "Browse…" button can be used to select
an existing file, or a name for a new file can simply be entered. When the
system messages are received, this file will automatically be created if it
does not exist.
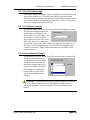
6.1.1.3 Demo Mode Setup
If the "Demo Mode" box is checked, then the system will operate in the
Demo Mode. When in the Demo Mode, LoadView will emulate being
connected to a Network Controller with one to eight load bank nodes. The
configuration parameters for the Demo Mode are read from a Demo
Configuration File (*.dcf). This file is produced by the DemoCfg
Page 34
LoadView Version 3.0.16 - 05/12/2010
Operator's Manual
LoadView Version 3
program. The dcf file is selected from this page of the Program
Configuration screen. Whenever a change is made to the Demo system,
LoadView will have to be stopped and restarted before the changes will
take effect.
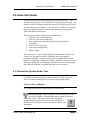
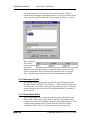
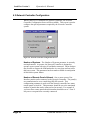
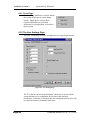
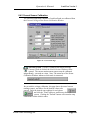
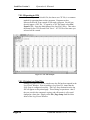
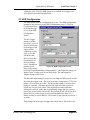
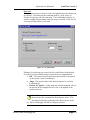
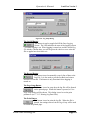
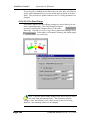
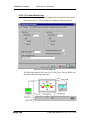
6.1.2 The Connection Page
The Connection Page is used for setting up the connection to the external
load bank or Network Controller. The COM port (COM1 - COM4) will
be selected as well as the baud rate.
Figure 19 - The Connection Page
Warning! - The communications between LoadView and the external
system must be setup correctly or the system will not operate. Insure that
the COM port selected matches the port at which the cable is connected
between the computer's serial port and the remote system. The baud rate
must also be selected correctly. The Load Bank and Network Controller
systems are normally configured to operate at 38.4 kBaud.
©2002 Load Technology Inc.
Page 35
LoadView Version 3
Operator's Manual
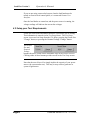
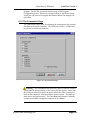
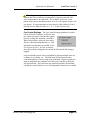
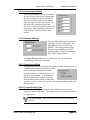
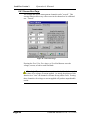
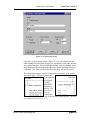
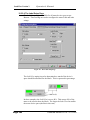
6.2 Network Controller Configuration
When LoadView is connected to a Network Controller, the Network
Controller Configuration Screen will be available. This screen is used to
configure the special parameters required by the Network Controller
system.
Figure 20 - Network Controller Configuration Screen
Number of Systems - The Number of Systems parameter is currently
not implemented. At present, the Network Controller is designed to
operate as one system with up to 8 load banks connected. Future designs
may be able to connect the load bank nodes in a way that can form more
than one system. This parameter has been made available in anticipation
of this future system feature.
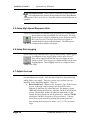
Number of Remote Panels Allowed - One or more remote User
Interface panels can be connected to the Network Controller. The panel(s)
are communicated to over a multi-drop RS-485 network. This
configuration parameter is used to tell the Network controller how many
remote panels to look for. This parameter should be set to the maximum
number of panels that can be connected to the network. For example if
you have three remote panels then this number should be set to 3 even if
only one or two panels are currently connected.
Page 36
LoadView Version 3.0.16 - 05/12/2010
Operator's Manual
LoadView Version 3
Warning! - Setting the Number of Remote Panels Allowed to an
amount that is lower than the actual number of panels connected will
cause some panels to be inoperable. For example: if there are 5 user
panels in the system and this parameter is set to 3, then panels 4 and 5 will
not operate. It is also important to insure that the Node Address of each
panel be set to a different value (i.e. 1, 2, 3, 4, and 5 in this case).
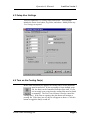
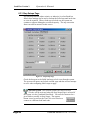
Fan Control Settings - The Fan Control Settings parameter is used to
tell the Network Controller, LoadView, and
any connected remote User Interface panels
how the cooling fans should be controlled.
When Independent is selected, the cooling
fans are controlled independently (i.e. each
load bank's cooling fan is controlled via the
Fan Control Screen). If Fixed is selected,
then all load bank cooling fans are turned on/off when the fan setting is
toggled.
Large load bank systems can be assembled by placing multiple units in a
container or on a trailer, etc.. The load buses of these units are then
connected together to form a single large load bank. In these systems the
separate load banks are combined via a Network Controller to look like
one big load bank. Since the buses are connected together all load bank
cooling fans should either be on or off, independent control is not sensible.
©2002 Load Technology Inc.
Page 37
LoadView Version 3
Operator's Manual
6.3 The Test Setup Screen
As described in the Quick Start Guide, the normal testing process will
require you to enter some information about the system that you are
testing. Most of this information is entered via the Test Setup Screen.
Figure 21 - The Test Setup Screen
Clicking "Test Setup" in the File
Menu, or pressing the "Change"
button in various places on the
Main Data Screen selects the Test
Setup Screen. The Test Setup
Screen is a multi-page window.
The pages are:
1. The Test Setup Page
2. The User Settings Page
3. The Step Setups Page
The required page is selected by
clicking the appropriate tab at the
top of the window.
Page 38
LoadView Version 3.0.16 - 05/12/2010
Operator's Manual
LoadView Version 3
6.3.1 The Test Setup Page
As the name implies, this page is used to configure the system for the test
that you are about to run. Generally your remote system will remain
somewhat fixed, the exception to this can of course be networked systems
in which load banks are being added or taken away. The Test Setup Page
is used to configure the system under test.
6.3.1.1 The Genset Capacity
The Genset Capacity or Genset Size is one of the more important settings.
The bar graph displays and all userdefined meters that employ Auto
Scaling make use of this value. The
Preset Buttons on the Automatic
Page of the Control Section (on the
Main Data Screen) are setup based
on this value. Preset steps from within test scripts will also make use of
this value. In effect this parameter is used to "Scale" the displays and
controls of LoadView. This parameter should be set to total size of the
system under test.
6.3.1.2 Genset Nominal Voltage
This parameter is used to inform LoadView and the remote system of the
voltage of system under test.
This parameter is used to make
decisions about minimum and
maximum voltages and how to
scale the load steps. As shown
this parameter is a pull down
box that allows you to select
one of the predefined system
voltages.
Warning! - As stated this parameter is used to setup system safeties
(i.e. over-voltage trips) fan controls, and high/low voltage controls.
Setting this parameter incorrectly can have an adverse effect on your
system.
©2002 Load Technology Inc.
Page 39
LoadView Version 3
Operator's Manual
6.3.1.3 Load Type
The Load Type parameter is used to inform
the system of the type of system being
tested -- Single-phase or three-phase.
Certain calculations are performed
differently for a Single-phase versus threephase system.
6.3.2 The User Settings Page
The User Setting Page is used to configure the user specific parameters.
Figure 22 - User Settings Page
The "Use fan loss in load step calculation" check box is used to tell the
system whether it is to compensate for fan loss in the load step
calculations. If this box is checked, then the configured fan loss value will
be removed from the commanded load value.
Page 40
LoadView Version 3.0.16 - 05/12/2010
Operator's Manual
LoadView Version 3
6.3.2.1 Preset Loads Setting
These five parameters are used to configure
the size of each of the Preset Load buttons.
The values entered are the percentage of
full scale load that is place on the system
when the respective button is clicked. The
full-scale load is determined from the
Genset Size value that is entered via the Test
Setup Page. These settings are also used to
scale the Meter Soft Keys of the remote
system.
6.3.2.2 Nominal Settings
The Jog Value and Power Factor Preset
values are entered via this panel. The
Jog Value is used to scale the Jog
function. This setting scales the Jog
Step size at the load bank, any User
Interface panels, and on the Automatic
Page of the Control Section.
The Power Factor Preset value is used to scale the Jog Value when
commanding an Inductive load bank.
6.3.2.3 Upon Loss of Com
This parameter defines what action the system will take on loss of com. If
communications between LoadView and the
remote system are disrupted, the remote
system can either: (1) take no action, or (2)
shutdown the load bank. If the shutdown
option is selected, the remote system will
drop all loads and turn off the cooling fans,
upon loss of com. A Loss of Computer Com! message will be added to the
message queue.
6.3.2.4 Control Voltage Type
The Control Voltage Type setting is used to inform the system of the
expected control voltage type. This setting can be set to either three-phase
or Single-phase.
Network System - This control is not required for a networked
system.
©2002 Load Technology Inc.
Page 41
LoadView Version 3
Operator's Manual
6.3.3 Step Setups Page
If a load step element (either resistive or inductive) in a load bank has
failed, these settings can be used to lockout the failed step until such time
as it can be repaired. When a load step is locked out, the system can
continue to operate although at a reduced capacity. The step correction
factor can also be entered via this screen.
Figure 23 - Step Setups Page
Check the box next to the failed load step to lock it out from the system.
The system will ignore any locked out load steps and thus will not attempt
to use it when computing which steps to apply.
Network System - In a network system, the Node Selection
Window will be activated when the Step Setups Page is selected if
the system is in the Combined Data Mode. You must be connected to a
given Node to modify its Step Setups. The connect
button is used to activate the Node Selection Window to
connect to a different load bank node.
Page 42
LoadView Version 3.0.16 - 05/12/2010
Operator's Manual
LoadView Version 3
6.4 Sensor Calibration
The system's voltage and current sensors can be calibrated and/or zeroed
from within LoadView. Selecting Calibrate Sensors… from the File
Menu opens the Sensor Calibration Window.
Figure 24 - Sensor Calibration Window
This window is a multi-page control - the pages are:
1. The Voltage Cal Page.
2. The Current Cal Page.
3. The Sensor Zero Page.
The page is selected by clicking the required tab.
©2002 Load Technology Inc.
Page 43
LoadView Version 3
Operator's Manual
Note - New calibration coefficients will be computed by the remote
system(s) when the calibration data is sent to them, via the "Send"
button. The coefficients are however temporary - they will remain in
effect until the system is turned off. The Keep button is provided to
request the remote system(s) to save the new calibration
to non-volatile memory.
The normal process is to make all required calibration changes (i.e.
default, voltage cal, current cal, etc..) then save or "Keep" these values
when you exit the Sensor Calibration Window. If changes have been
made and not saved, you will be informed when you exit the window.
6.4.1 Voltage Sensor Calibration
The voltage channels of each load bank can be calibrated from the Voltage
Cal Page of the Sensor Calibration Window. This page indicates the
current "Actual" voltage being read by the system and provides a place to
enter the desired voltage (per phase). If the "Actual"
readings are incorrect, then enter the desired values (for
each phase) and click the Send Button. When the Send
button is clicked, the calibration information is sent to the
remote system. The Default button can be used to return the calibration
values to their defaulted state.
Network System - If LoadView is connected to a networked
system, via the Network Controller, then all voltage sensors, at each
of the remote nodes, are calibrated when the "Send" button is clicked
when in the Combined Data Mode. If connected to a given node, then the
voltage will be calibrated at that node only.
Page 44
LoadView Version 3.0.16 - 05/12/2010
Operator's Manual
LoadView Version 3
6.4.2 Current Sensor Calibration
The current measurement channels of each load bank are calibrated from
the Current Cal Page of the Sensor Calibration Window.
Figure 25 - Current Cal Page
Network System - If in the Combined Data Mode when the
Current Cal tab is clicked, the Node Selection Window will be
opened. The current measurement sensors must be calibrated
independently - one node at a time. Note: The status bar of the Sensor
Calibration Window indicates which node is connected.
Just as with the voltage calibration, this page shows the actual current
readings (amps), and allows for the desired values to be
entered. Enter the desired amp readings for each phase
and click the "Send" button to send them to the remote
system. Clicking the "Default" button will return the amp
calibrations to their default values.
©2002 Load Technology Inc.
Page 45
LoadView Version 3
Operator's Manual
6.4.3 Sensor Zero Page
The voltage and current measurement channels can be "zeroed". This
zeroing function allows any offset errors in the channels to be calibrated
out - "zeroed".
Figure 26 - Sensor Zero Page
Pressing the Zero Volts, Zero Amps, or Zero Both buttons zeros the
voltage, current, or both at each load bank.
Warning! - The voltage and current channels should only be zeroed
when there is no voltage or current applied. As stated, the purpose of this
function is to "zero" the channel to account for any offset errors. Zeroing
these channels with voltage or current applied will produce unpredictable
results.
Page 46
LoadView Version 3.0.16 - 05/12/2010
Operator's Manual
LoadView Version 3
6.5 The License Manager
The system registration, LoadView, and High Speed Response data
licensing are accessed via the License Manager.
Figure 27 - License Manager
System registration, LoadView and High Speed Response system license
number must be obtained from Load Technology. The system's serial
number is shown in this dialog and will be required.
Load Technology Inc.
Customer Service Department
4225 Production Court
Las Vegas, Nv. 89115
1 - 800 - LOADTEC
[email protected]
6.6 Update System Firmware
Selecting File | Update System Firmware from the Main Menu starts the
Firmware Update program. This software provides a method in which the
serial port of the computer can be used to download new firmware to each
of the remote systems. This includes load bank(s), Network Controllers,
and the User Interface Panels. The details of operating the Firmware.exe
software are documented in the Firmware manual.
©2002 Load Technology Inc.
Page 47
LoadView Version 3
Operator's Manual
7.0 The Data Logging System
One of the sub-systems of the LoadView software is the Data Logging
system. The Data Logging system provides:
•
•
•
Data recording functions - Logging.
Up to 8 channels of user defined data.
A viewer for displaying and printing Log Data Files.
7.1 Recording Data (Logging)
Data is continuously communicated from the remote system (Load Bank
or Network Controller) to LoadView. As each data frame is received it is
processed by LoadView to update all data displays and user defined
screens. The Data Logger operates behind the scenes to record data to the
selected Log Data File at a given time interval and/or on a change in load
command.
7.1.1 Data Logging Concepts
Most controls of the Data Logging System are provided for via the
Logging Page of the Main Data Screen (ref 5.0.4.2 The Logging Page).
One of the parameters setup via this page is the Log File. This parameter
tells LoadView what file to use for logging. When logging is started, this
is the file that new data lines will be recorded to. If the "View" log button
is clicked, this is the file that will be opened in the viewer. In essence the
Log File parameter defines the currently active file.
Data Log Files carry the "ldf" (Loadtec Data File) extension. Version 1.0
log files (created with previous versions of LoadView) used the "log" file
extension. LoadView version 3 will convert old "log" files into the new
"ldf" format in a semi-automatic manner.
In addition to the data lines themselves, a channel list, and optional user
defined data channels are also be stored in the Log File.
Page 48
LoadView Version 3.0.16 - 05/12/2010
Operator's Manual
LoadView Version 3
7.1.1.1 User Defined Data Channels
Up to eight
User Defined
Data Channels
can be defined
and stored with the system's data in the log file. If User Defined Channels
are enabled, then each time a data line is recorded to the log, the Record
User Data Window will be displayed. Checking the "Record user defined
channels" check box on the Logging Page of the Main Data Screen
enables recording of the user defined data channels.
Figure 28 - Record User Data Window
Use this window to enter data values for each of
the configured channels. Press the Ok button to
store the entered values. Pressing the "Stop
Logging Data" button cause the log to stop
recording. Pressing the "Stop Rec. User Data"
button causes recording of the user defined channels to stop. Data will
continue to be logged as defined by the Data Logging parameters.
7.1.1.2 User Defined Channel Configuration
The configuration parameters for user-defined channels are actually stored
in the Log Data File. When a new Log Data File is created, LoadView
copies the default settings into the newly created log file. From that point
on, changes to the user-defined data must be made in the log file. The
©2002 Load Technology Inc.
Page 49
LoadView Version 3
Operator's Manual
default parameters are configured via the User Channel Definition
Window. This window is accessed by clicking Data | Edit Default User
Channel Definitions… from the Main Menu. The Channel Check Boxes
are used to enable/disable each of the channels. Enter the desired channel
name and units values.
Figure 29 - User Defined Channel Setup Window
The Record Mode setting defines how the user data channels are merged
into the log data. When Merge with last line is selected, then the entered
user data values will be merged with the last line that was recorded in the
log. Again if "Record user defined channels" is enabled, then the Record
User Data Window will be displayed when a data line is recorded to the
log. Once the OK button is pressed, your entered values will be recorded merged into the last line recorded in this case.
When Record new line is selected, the values entered in the Record User
Data Window will be merged with the current data. A new line will be
recorded to the log that is made up of this merged data.
Note - It is important to understand that once a data log file has been
created, these configuration parameters are then stored into the file. These
settings can be changed from within the Log File Viewer.
Page 50
LoadView Version 3.0.16 - 05/12/2010
Operator's Manual
LoadView Version 3
7.2 The Log Viewer
The Log Viewer is used to view the contents of a stored data log. Pressing
the "View" button on the Log Page will cause a Log Viewer window to be
opened showing the current Log File.
Figure 30 - Log File Viewer
As can be seen this window shows the data lines recorded in the selected
file. If you are viewing the current log file, then data will continue to be
added to this window if logging is active. The scroll bars can be used to
move up and down or left to right.
The Log Viewer window also contains a Main
Menu. Various functions are available from this
menu. These functions are grouped in the File,
Edit, and Help menus.
©2002 Load Technology Inc.
Page 51
LoadView Version 3
Operator's Manual
7.2.1 The File Menu
The File menu provides access to various file
related functions. These are:
• Open - Open a selected Log Data File
• Export CSV - Export data to a comma
separated variable file.
• Print - Print The Log File
• Page Setup - Setup the printed page.
• Exit - Exit the menu.
7.2.1.1 Opening a Log Data File
Selecting File | Open allows the selection of a Log Data File for viewing.
Selecting Data | Open Log File from the Main Menu of the Main Data
Screen, also allows the selection of a Log Data File for viewing. When the
Open function is selected, the Open Log File dialog will be shown.
Figure 31 - Open Log File Dialog
Select the desired file and click Open to view the selected file. As with
most standard
Windows®
based programs, the directories can be "navigated to" using the navigation
tools. The default directory that is selected when this dialog is opened is
defined by configured data path (ref. 6.0.1.1.1 Setting up the LoadView
File Paths).
Page 52
LoadView Version 3.0.16 - 05/12/2010
Operator's Manual
LoadView Version 3
Note: - Clicking on the arrow button in the "File of Type:" control,
and selecting Version 1.0 Log Files can be used to open a log file
created with a previous version of LoadView. When an attempt is made to
open an old version Log file it must be converted to a new style file before
the Viewer can open it.
If you select Yes to create the file, then a new file with the ".ldf" file
extension will be created. If that file is created without error, it will be
opened in the Log Viewer window.
©2002 Load Technology Inc.
Page 53
LoadView Version 3
Operator's Manual
7.2.1.2 Exporting to CSV
A Comma Separated Variable file, also know as a CSV file, is a common
method for exporting data to other programs. Programs such as
Microsoft's Excel® is an example of just such a program. Excel® can
directly import a CSV file. To export to a CSV file simply select File |
Export CSV… from the Main Menu of the Log File Viewer. Then enter
the name for the CSV file and Click "Save". A CSV file of the name you
selected will be created.
Figure 32 - CSV File Example
7.2.1.3 Printing Log Data Files
Printing Log Data Files is very simple once the file has been opened in the
Log Viewer Window. Prior to printing a Log Data File, insure that the
Page Setup is configured correctly. The Page Setup formats how the log
file will appear on the printed page. These setting are persistent - that is
they are saved in the computer's registry and will remain in effect until
changed at a later date. Simply select File | Page Setup from the Main
Menu of the Log Viewer Window.
Page 54
LoadView Version 3.0.16 - 05/12/2010
Operator's Manual
LoadView Version 3
Figure 33 - Log Print Page Setup
From the Log Page Setup window (Figure 33) you can control how and
what headings are printed on the page, the orientation of the page, the font
size, and the margins. The left and right heading values are printed at the
top left and top right of the printed page if the Enable Headings check box
is checked. If it is not checked, then these headings will not be printed.
The Orientation setting is used to configure the orientation of the printed
data on the page - Portrait or Landscape.
The right and
left margin
settings
control the
margins as
shown. The
font size is
used to
control the
size of the text on the printed page. The font
size can be set to 8,9,10,11, or 12.
©2002 Load Technology Inc.
Page 55
LoadView Version 3
Operator's Manual
Once all of the parameters have been entered, press one of the following
buttons:
OK - Press the OK button to save all changes and exit the Page
Setup Screen.
Print… - Press the Print… button to print the log. The log will be
printed using all of the configured settings.
Printer… - Press this button to selected the desired printer and
make and specific changes to the printer's properties.
Cancel - Press this button to exit without saving any changes.
Figure 34 - Log Print Example
Page 56
LoadView Version 3.0.16 - 05/12/2010
Operator's Manual
©2002 Load Technology Inc.
LoadView Version 3
Page 57
LoadView Version 3
Operator's Manual
Press the Printer Button to select the printer and/or change any required
printer properties. Once the Page Setup has been configured as required,
simply select File | Print… from the Main Menu of the Log Viewer
Window.
Figure 35 - Printer Setup Dialog
7.2.2 The Edit Menu
The Edit Menu provides access to the
channel related functions. These are:
• Select Channels
• Record User Data
These functions are used for selecting
which channels to display in the Log Viewer and allow for recording of
user data into the log.
Page 58
LoadView Version 3.0.16 - 05/12/2010
Operator's Manual
LoadView Version 3
7.2.2.1 Selecting Data Channels to View
Press Edit | Select Channels from the Main Menu of the Log File Viewer
to activate the Channel Selection Window.
Figure 36 - Channel Selection Window
This window is used to select which data items are to be shown in the Log
File Viewer. Click the desired channel, or the Check Box, to
enable/disabled the channel. Each channel checked will be shown in the
Log Viewer Window. The channels selected for the Viewer also
determine the channels that will be printed.
Note - The Show Combined Data check box is only used if
LoadView is connected to a resistive load bank that has an
Inductive load bank connected to it. If this box is
checked, then the data shown will be the combined
data from the Inductive and Resistive load banks.
©2002 Load Technology Inc.
Page 59
LoadView Version 3
Operator's Manual
The User Channels control is used to
enable/disable the user defined
channels and to allow them to be
configured. Press the Edit button to
edit the User Defined Channel setups.
Checking the Show box
enables/disables the user
defined data channels.
When Show is checked, the
user defined data channels
will be available in the
Channel Selection Window.
When the "Edit…" button is
pressed a User Channel
Setup Window will be
displayed. The parameters
in this window reflect the
settings of the User Defined
Data channels that are stored
in the Log Data File. Make
any necessary changes and
click OK.
This example shows the
additional channels that
are made available when
the "Show" box is
checked.
Page 60
LoadView Version 3.0.16 - 05/12/2010
Operator's Manual
LoadView Version 3
When the OK button is pressed in the Channel Selection Window, the
channels selected will be shown. These settings are saved in the Log Data
File so that the next time it is opened, the same channel selections will
remain in place.
7.2.2.2 Recording User Data Channels
Select Edit | Record User Data from the Main Menu of the Log Viewer to
record a new set of user defined data channel values. A Record User Data
Window will be displayed.
Figure 37 - Record User Defined Channel Dialog
Enter the required values and press the "OK" button to save the values in
the log file. The data is saved by either integrating these values with the
last data line stored to the log, or by recording a new line and adding the
user data to that line. This is setting is configured via the Record Mode
setting in the User Defined Channel Setup Screen (see Figure 29)
©2002 Load Technology Inc.
Page 61
LoadView Version 3
Operator's Manual
8.0 High Speed Response Data
The High Speed Response (HSR) system is similar in function to having
an oscilloscope built into the Power Meter portion of the system. A
dedicated processor system in the Load bank electronics makes up the
Power Meter system. This system is constantly sampling data from each
of the voltage and current sensors and performs the true RMS calculations.
As each zero crossing of the "A" phase is detected, the computation for the
cycle is completed for each phase of voltage and current.
The HSR system provides a method in which a sample of each cycle for
each phase of voltage, power, and current can be recorded to a high-speed
data buffer. This data can then be downloaded from the high-speed buffer
to LoadView for plotting and review.
Like an oscilloscope, the HSR system provides triggering that allows predefined criteria to initiate the process. Once the trigger event occurs, the
system will begin recording data to the high-speed data buffer. The
Record Length parameter is used to determine how long data is recorded
after the trigger event occurs. The pre-trigger parameter is used to select
how many cycles before the trigger event are also captured to the data
buffer. The following are the available trigger event choices:
•
•
•
Change in Load - This setting causes a trigger to be generated
when a change in load command is sensed by the system.
Trigger Button - This setting is used to cause the trigger setting to
operate in a manual manner. In this mode a trigger can be
generated by the user clicking the "Trigger" button or from a
Trigger step type in a test script.
Conditional - In the Conditional mode, a pre-defined condition
can be assigned to a given channel. When that condition is met, a
trigger is generated. In the example shown, a trigger will be
generated when
the frequency
drops below 55
Hz.
Once the trigger mode
and parameters have been setup, the HSR system is ready to record data to
the data-buffer. The HSR system must be enabled before an actual trigger
can be generated. Once an event occurs and data is recorded to the buffer,
HSR will be disabled thus preventing any further triggers. This allows
you to download and view the data without the fear of a new trigger overPage 62
LoadView Version 3.0.16 - 05/12/2010
Operator's Manual
LoadView Version 3
writing the data. Once the HSR system is re-enabled, new triggers can
once again be generated and processed.
8.1 HSR Configuration
The HSR system must be configured prior to use. The HSR configuration
parameters are accessed via the HSR Configuration Screen. Click the
Config button from
the Response Page
to access the HSR
Configuration
Screen.
The Pre-Trigger
setting is defines
how many cycles of
data are stored prior
to the trigger event.
Under normal
conditions set this
value to 20, this
will insure that
there is some data
recorded prior to
the load change
event. Setting this
Figure 38 - HSR Configuration Screen
parameter to a
larger value could
be useful for troubleshooting certain problems -- the larger this setting, the
further "back" in time (prior to the block load). The maximum PreTrigger setting is 240 cycles.
The Record Length setting is used to set how long the HSR system records
data after the trigger event. The system can store a maximum of 7712 data
points (128.5 seconds @ 60 Hz). The larger this setting is, the more data
points are recorded. This data must be sent from the remote system to
LoadView over the serial cable. This download can take some time.
Setting this value for a time that is significantly longer than the recovery
time of the system under test provides no real benefit and will in fact slow
things down as it takes longer to record and download the data (i.e. it
makes no sense to record data for 120 seconds if your system recovers in 5
seconds).
This setting selects the type of trigger that will be used. The choices are:
©2002 Load Technology Inc.
Page 63
LoadView Version 3
Operator's Manual
Change in Load - in this mode; a trigger is generated whenever a change
in load command is issued.
Trigger Button - A trigger is generated when the trigger button is clicked.
Conditional - A trigger is generated based on a defined condition of a
data channel.
The Channel box allows selection of any of the measured/calculated data
channels. The condition box allows selection of one of the four condition
types:
1.
2.
3.
4.
Equal To
Not Equal To
Less Than
Greater Than
The Value parameter is used to set the conditional value. In the example
shown, a trigger will be generated when the frequency drops below 58 Hz.
Page 64
LoadView Version 3.0.16 - 05/12/2010
Operator's Manual
LoadView Version 3
8.2 Plotting HSR Data
To access the HSR plotting functions click the View Data button from the
Response Page. When the View Data button is clicked, if there HSR data
is currently recorded in the
remote system, you will be
given the option to
download the data. If you
click Yes, then the HSR
data will be downloaded
from the remote system.
Once the response data has been downloaded, the Response Plot Screen
will be opened. If you click No, then the Response Plot Screen will be
opened and you can browse for a previously save HSR plot file.
Figure 39 - Response (HSR) Plot Screen
The Plot Screen can also be access by selecting Data | View High Speed
Response Data from the Main Menu. The data file sub-title indicates the
name of the current file being viewed, "sample.hsd" in this example. If
the data viewed is the downloaded data from the remote system, then
"Current System Data" will be shown.
©2002 Load Technology Inc.
Page 65
LoadView Version 3
Operator's Manual
The graphics portion of the plot can show up to three data items:
1. Change in load marker
2. Voltage
3. Frequency
The red line is used to mark the point at which the load change, if there are
any, took place. The viewing of this marker is configurable and will not
be shown if it is disabled. The blue line is used to plot the measured
frequency. The black line is used to plot the voltage.
Click File | Open to select a different file to view. Click File | Save to
save the current plot data to a data file. Click File | Print to print a hard
copy of the plot.
Figure 40 - HSR Plot Printout
Page 66
LoadView Version 3.0.16 - 05/12/2010
Operator's Manual
LoadView Version 3
8.2.1 Plot Zoom Controls
The Plot Screen allows for "zooming in" on any part of the plot by simply
dragging a box in the area that you want to zoom in on. Click an hold the
left mouse button at the upper left corner of the are you want to zoom in
on. While holding the left mouse button down, drag a box to the bottom
left corner of the
desired area.
When the desired
box is shown
release the left
mouse button and
the plot will
change to show
the area in the
zoom box.
You can zoom in further by repeating this process with a new zoom
window. Whenever the plot is in the zoomed state, the zoom control
buttons will be active. Press the "<<" button to pan the plot to the left,
back in time. Press the ">>" button to pan
the plot to the right; forward in time. Each
time ZoomOut is pressed, the plot will
return to the previous zoom level. Once the plot has reached the full view
(not zoomed) then the Zoom control buttons will again be disabled.
8.2.2 HSR Voltage and Frequency Recovery
The data analysis tools built into the HSR system are capable of
computing the recovery time of the voltage and frequency. When the
power source (the GenSet) is hit with a block load, the voltage and
frequency will droop to some point, and then return to the original value
(provided the system is working correctly).
There must be one and only one load change in the data set for the system
to compute the recovery times. If there are no load changes, or more than
one load change in the data set, then the recovery times will be shown as
not available (N/A).
Figure 41 - Voltage and Frequency Recovery Data
©2002 Load Technology Inc.
Page 67
LoadView Version 3
Operator's Manual
The recovery times are expressed as percent of nominal. Nominal is the
value of the voltage and frequency channel at the moment the load change
was made. The voltage and frequency channels must drop below their
respective recovery % settings in order to be calculated. If not, their
recovery time will be shown as zero.
8.2.3 Plot Filtering
The plotted data can be configured to show the data for every cycle, or
data averaged of many cycles. Clicking the Filter up button increases the
averaging. Clicking the Filter Down button decreases the applied filtering.
Page 68
LoadView Version 3.0.16 - 05/12/2010
Operator's Manual
LoadView Version 3
8.2.4 Viewing Plot Data (non-graphical)
Press the View Button to view the underlying HSR data in a tabular
format. When this button is clicked, a data viewer showing each of the
data points will be shown. This viewer will show the line number, time,
frequency, and voltage. The time shown is the time relative to the trigger
event. In the example shown, the first data point is 391 msec (0.391
seconds) ahead of the trigger. This is indicative of the Pre-Trigger setting
when the trigger occurred.
Figure 42 - HSR Tabular Data
Select File | Print to print a hard copy of this data
.
©2002 Load Technology Inc.
Page 69
LoadView Version 3
Operator's Manual
8.2.5 Plot Configuration
The Plot Configuration Screen is used to configure the plot screen. Press
the Config button to access the Plot Configuration Screen.
The voltage recovery value defines, in percent of nominal, the amount that
the voltage channel must
"recover" to in the
calculation of the
recovery time. The
voltage value just prior to
the trigger is the
"nominal" value
The frequency recovery
value defines, in percent
of nominal, the amount
that the frequency channel
must "recover" to in the
calculation of the
recovery time. The
frequency value just prior
to the trigger is the
"nominal" value.
If "Plot load command changes" is checked, then a line will be added to
the plot, the red line, which indicates all changes in load command. This
box is normally checked. Uncheck it if you prefer the plot to be shown
without the load change line.
If the "Mark data points on plot" box is checked, each data point on the
plot is marked with an X.
Page 70
LoadView Version 3.0.16 - 05/12/2010
Operator's Manual
LoadView Version 3
Marking data points is normally only used when zoomed into an area on
the plot. If data points are marked when not zoomed, the lines will appear
totally covered with Xs.
©2002 Load Technology Inc.
Page 71
LoadView Version 3
Operator's Manual
9.0 Test Scripting
Test Scripting is another sub-system of the LoadView software. Test
scripts allow a test to be created via an easy to use script editor. This
editor produces script files that can then be executed by the LoadView
system. The following functions can be controlled via a test script file.
•
•
•
•
Load Bank Controls
o Set Operating Parameters (Test Setup)
o Set Load command
o Turn Cooling fan(s) On/Off
o Timed wait
Data Logging Controls
o Record a single data line to the Log Data File
o Control timed data recording
o Stop Data Logging
High Speed Response System Controls
o Configure the High Speed Response System
o Enable/Disable Triggers
o Plot the resultant data
o Save High Speed Response Data
Record User Defined Data Channels
9.1 The Script File Editor
A script test file is a made up of list of steps that define the actions the
system is to take. This collection of steps makes up the script file. Once a
script file has been created, it can be executed at a later date. Test script
files are created/edited via the Script File Editor.
Press Scripting | Edit Script… from the Main Menu of the Main Data
Screen to activate the Script File Editor.
Page 72
LoadView Version 3.0.16 - 05/12/2010
Operator's Manual
LoadView Version 3
Figure 43 - The Script File Editor
The Script File Editor is divided into
two main parts. These are the Editor
Panel and the Selection Panel. The
Editor Panel is used to show the test
as it is being edited. As steps are
inserted/deleted they will be shown
in this panel.
The test step that is highlighted is
the Active Step. Clicking a step
selects it as the Active Step. - It will
be indicated with a yellow highlight.
Holding down the Ctrl key while
clicking a step can be used to select
multiple steps - each step clicked will become highlighted. Clicking a
step, then holding the Shift key and clicking a step below the Active Step
will allow a group of steps to be selected.
©2002 Load Technology Inc.
Page 73
LoadView Version 3
Operator's Manual
9.1.1 The Script Editor Quick Buttons
There is a tool bar located at the top of the
Editor Panel that makes up a group of Quick
buttons. These buttons provide quick access to selected editing functions.
Selecting File | New from the Main Menu or pressing the New quick
button allows the creation of a new test script. If you've made
changes to the current test and not saved them, you will be warned and
given an opportunity to save your changes
The delete button is used to delete the selected steps from the test.
All selected steps will be deleted. Selecting Edit | Delete Line from
the Main Menu can also be used to delete the selected lines (steps). Note
that the Delete Key (Del) can also be used to delete the selected step.
Press the Edit Line quick button or select Edit | Edit Line from
the Main Menu to edit the Active Step. If the selected test step
does not require any additional information, the Edit Line quick
button will be disabled (grayed out). Double Clicking a test step can
also be used to edit the test step.
The Save and Open quick buttons are used to save the
current test or select a new test to open and edit. The save
button is only enabled when changes have been made. As such it also
serves as an indicator to show if the current test has been modified and not
saved. These functions are also available via File | Open, File | Save, and
File | Save As… of the Main Menu.
Note - The File
Menu contains a
Most Recently Used
(MRU) list of files. The
File Menu is selected by
pressing File from the
Main Menu. Simply click
the desired file to quickly
select that file for editing.
Page 74
LoadView Version 3.0.16 - 05/12/2010
Operator's Manual
LoadView Version 3
9.1.2 Test Step Types
There are various step types available for creating your test script. A
collection of these steps is what makes up the Test Script file - the "Test".
When a Script File is executed, each step is processed one after the other
in turn until the end of the test is reached.
The time required to perform the actions of each step vary dramatically
and in fact some step types cause the system to wait for a given period of
time. Since there is this "real time" element to processing test steps, a step
must complete its execution before the next step can begin.
The following list shows all of the available step types and how they are
grouped.
•
•
•
•
Load Bank Group
o Configure Test Settings
o Set Load
o Fan On
o Fan Off
o Wait
Logging Group
o Record Line
o Stop Logging
Response Group
o Configure Response System
o Enable Response System
o Disable Response System
o Trigger Response System
o Plot Response Data
o Save Response Data
o Stop Response System
User Data Group
o Record User Data Channels
©2002 Load Technology Inc.
Page 75
LoadView Version 3
Operator's Manual
9.1.2.1 The Load Bank Group
This group of steps allows for the configuration of and control over the
Load Bank system.
Configure Test Settings (Set Test Cfg)
Press the Set Test Cfg button to insert a Configure Test
Settings step into the test. When the test is executed,
the parameters you have entered will be sent to the system.
Figure 44 - The Script Test Setup Editor
The Script Test Setup Editor (Figure 44) is shown when an attempt is
made to edit a "Configure Test Settings" step type. Use this editor to enter
all of the required values (ref 6.3.1 The Test Setup Page)
Page 76
LoadView Version 3.0.16 - 05/12/2010
Operator's Manual
LoadView Version 3
Set Load
The Set Load step type is used to set the load applied to the unit under test
as required. You can select the command mode (i.e. KW, Amps, or
Percent of Capacity) and select duration. The Load Bank(s) must be on
with the cooling fan operational when this step is executed. If not, the Set
Load step will perform no real action.
Figure 45 - Set Load Editor
Editing a Set Load step type causes the Set Load Editor to be displayed.
Use the Power Entry Mode setting to select the load command mode:
• KW - The entered value is the desired power (KW) to be placed
on the system via the Load Bank(s).
• Amps - The entered value is the desired Amps to be set at the
Load Banks(s).
• Percent of Capacity - In this mode the entered command value is
the percent of the configured GenSet Size to be applied to the
system under test.
Note - If your system contains any Inductive Load Bank(s)
then you can also command the desired power factor. The
decimal portion of the command is the desired power factor
(i.e. 500.8 would apply 500 KW at 0.80 power factor).
©2002 Load Technology Inc.
Page 77
LoadView Version 3
Operator's Manual
When this command is executed, the desired load command is formulated
and placed on the system under test. Once the load setting has been made,
this step can optionally wait for a defined amount of time. If the Duration
of Load is set to a non-zero value, then the system will wait that number of
minutes/seconds before executing the next step.
Fan On
This step is used to force the cooling fans on at the Load Bank(s). Since
the starting up of cooling fan(s) takes some time, the system will not
proceed to the next step until the fans have actually turned on in the load
bank(s).
Networked System - In a networked system the Fan On command
will cause an Auto On fan command to be sent to the Network
Controller. The Auto On command will turn on the required load bank(s)
based on the GenSet Size setting (ref. 5.2.1.1 The Fan Control Screen).
Fan Off
This step is used to turn off the cooling fans in the load bank(s).
Networked System - In a networked system, this step command
the fans to be turned off at all load banks that are connected to the
Network Controller.
Wait
This step simply suspends execution of any steps for a given amount of
time. The duration of this suspension can be entered in minutes or
seconds.
Page 78
LoadView Version 3.0.16 - 05/12/2010
Operator's Manual
LoadView Version 3
9.1.2.2 The Logging Group
These steps are those that pertain to the Data Logging System. There are
currently only two step types in this group. These are the; (1) Record Line
and (2) Stop Logging.
Record Data Line
This step type provides for recording of data to the data log. When this
step type is edited, the Record Data Line Editor is shown.
Figure 46 - Record Data Line Editor
If the Specify Filename box is left unchecked then data is recorded to the
current Log File (see 7.1 Recording Data
(Logging)). If this check box is checked, then the
filename parameter is used to select a new current Log File. A single data
line will be recorded if the Once mode is selected. If At Interval is
selected, then the Record Interval parameter is used to set
the time interval in which data lines are recorded. Once
data recording is started with a given time interval, it will
continue until data logging is turned off (via the Stop
Logging step).
©2002 Load Technology Inc.
Page 79
LoadView Version 3
Operator's Manual
Stop Logging
This step type is used to stop the recording of data to the Log Data File.
Again once Logging has been started with a given time interval, logging
will continue until it is explicitly stopped.
9.1.2.3 The Response Group
As the name implies, this group of steps is used to configure and control
the High Speed Response system (ref. 8.0 High Speed Response Data).
Configure Response System
This step type is used to setup the trigger parameters of the High Speed
Response System. When this step type is edited, a High Speed Response
Configuration Screen (8.1 HSR Configuration) is opened. From this
screen you can enter each of the trigger parameters. When the script file is
executing, these parameters will be sent to the HSR system.
Figure 47 - HSR Configuration Screen
Enable Response System
This step is used to enable the High Speed Response system's trigger
functions in preparation for a trigger event. Again once the HSR system is
configured it still must be enabled before a trigger can occur.
Disable Response System
This step simply disables the High Speed Response system's triggers.
Page 80
LoadView Version 3.0.16 - 05/12/2010
Operator's Manual
LoadView Version 3
Trigger Response System
The Trigger step type is used top force a manual trigger.
Plot Response Data
This step is used to plot the data stored in the High Speed Response
System's data buffer. When this step is encountered, HSR data will be
downloaded from the system and a plot window will be opened showing
the downloaded data. Note that data must first be recorded in the HSR
system before it can be plotted. If this step is encountered, and there is no
HSR data recorded, it will have no effect.
Save Response Data
This step type is used to
store the HSR data to a data
file. The Save Options are
used to define the method
in which the name of the
file is determined. In the
Use entered name mode, the desired file name is specified. In the "Prompt
User for filename" mode, the user will be prompted for the name of the
file when this step is executed. The "Generate filename automatically"
will cause the system to generate a filename base on the number of files
saved and the name of the script file. An automatically generated file
name will have the following format: HSDyymmddhhnnss.hsd
Where: yy = the year
mm - the month
dd - day of the month
hh - hours
nn - minutes
ss - second
Stop Response System
This step type is used to stop the HSR system. If while data is being
recorded to the data buffer this step type is encountered, then the buffering
of data will be stopped.
©2002 Load Technology Inc.
Page 81
LoadView Version 3
Operator's Manual
9.1.2.4 The User Data Group
The only step type in this group is the Record User Data Channels type.
This type is used to force the recording of User Defined Data Channels to
the data log. When this step is encountered a Record User Defined
Channels Dialog will be opened allowing you to enter the desired data
values (ref. Figure 37).
Page 82
LoadView Version 3.0.16 - 05/12/2010
Operator's Manual
LoadView Version 3
10.0 User Screens (Custom Designed Screens)
One of the major new features added to LoadView version 3 are the
Custom Screen Designs. This system gives you the ability to design
completely custom data and control screens. Select Screens | User
Screens from the Main Menu to select the User Screens.
Figure 48 - User Designed Screen
The Main Menu provides access to
all of the features and functions of
the User Screens system.
The File Menu is used for file
related functions. This menu also
contains a Most Recently Used
(MRU) file list that provides quick
access to the most recently used files
- Simply click the desired file to
load it.
©2002 Load Technology Inc.
Page 83
LoadView Version 3
Operator's Manual
10.1 Working with User Screens
The Meter Panel portion of the user screen is the canvas on which Meter
Devices are placed. User screens can be in one of two modes: the Edit
Mode, or the Run Mode. Meter Devices can only be added, deleted,
edited, or positioned when in the Edit Mode. The size of the screen can
only be changed when in the Edit Mode. In the Edit Mode no meters are
updated with new data values.
The Run Mode is used to make the screen active. When in the Run Mode,
meter devices are updated with new data values (provided communication
with the remote system is active), and buttons become active.
Edit Mode is used to modify the design, and the Run Mode allows a design
to be used. When an existing screen design is opened, it is automatically
placed in the Run mode.
Meter Device components are added to the Meter Panel then sized and
placed as required. New Meter Devices are automatically placed in the
upper left hand corner of the Meter Panel. Screen designs can be saved
and loaded to/from a screen file.
10.1.1 The Pop Up Menu
Right-clicking the mouse anywhere in the
Meter Panel will bring up the Pop-Up Menu.
This menu provides quick access to many of
the functions of the screen design system.
The File Menu is a
sub-menu to the PopUp Menu. This menu
allows loading and
saving of your screen
design files. It also
contains a Most
Recently Used (MRU)
file list that provides
quick access to your most recent screen designs.
Page 84
LoadView Version 3.0.16 - 05/12/2010
Operator's Manual
LoadView Version 3
The Edit Menu allows for editing the selected
Meter Device (the Meter Component),
deleting, and Cut and Paste functions. Note
that these functions can also be accessed via
the indicated shortcut keys.
The Send to back function is used to control the way in which overlapped
meter devices are "stacked up". Selecting a meter device and clicking
Send to back will cause the selected meter to be placed behind all
overlapping devices.
Use Add New Component to add a new meter to
the screen design. The new device will be
added at the top left corner of the screen. Note
that a Graphic device will always be placed
behind any meters. Therefore if you add a
Graphic device to a screen and a meter device
is positioned at the top left corner, the Graphic
device will not be seen. You will have to move
the meter to access the graphic behind it.
Use Delete Component to delete the selected meter device. Note that this
is equivalent to the Cut function in the Edit Menu.
Use Panel Color to set the color of the Meter Panel.
10.1.1.1 The Meter Panel Grid
The working grid of the Meter Panel is setup via the
Grid Menu. Click Grid Size to change the size of the
grid. The default value is a 10 x 10 pixel grid. Grid
Visible is used to control the visibility of the grid. The
grid still exists and meter devices can still be "Snapped
to Grid" even if the grid is not visible (un-checked). Clicking Grid Visible
will toggle the grid on/off. Snap to Grid is used to cause all meter devices
to be lined up and sized to the nearest grid points. Click Snap to Grid to
toggle this setting on/off. Click Grid Color to change the color of the grid
(when it is visible). The grid is only available when in the Edit Mode.
The Bitmaps Visible setting is used to hide background bitmaps. When
Bitmaps Visible is checked all Graphic Meter components are shown, if
this value is unchecked, then these components are hidden.
The Hide Meters setting is used to temporarily hide all non-graphic meter
components. Since graphic meters are forced to always be behind nongraphic meters, it would be nearly impossible to edit the graphic meters
©2002 Load Technology Inc.
Page 85
LoadView Version 3
Operator's Manual
without this ability. If the meters are hidden when the screen is returned
to the Run mode, they will be forced to the visible state.
The Size to meters function is used to size the screen to the minimum size
that can contain the designed meter devices. In the following example,
there are three meter devices placed on the screen.
When Size to meters is clicked, the screen is resized as shown below:
Page 86
LoadView Version 3.0.16 - 05/12/2010
Operator's Manual
LoadView Version 3
10.2 The Meter Devices
User designed screens are built by placing various Meter Devices on the
Meter Panel. The main portion of the User Screen is the Meter Panel; it
makes up what is in effect a work area upon which each of the Meter
Devices are placed.
The available Meter Devices are:
•
•
Data Aware Meters
o Digital Meter
o Bar Graph Meter
o Analog Meter
Non-Data Aware Meters
o Graphic
o Log Viewer Panel
o Button
As shown there are Data Aware and Non-Data aware meter devices. Data
aware devices are used to indicate the current value of a measured or
calculated channel they display data.
Non-data aware
devices provide other
non-data functions.
Whenever the screen is in the Edit Mode, the User Design Tool Bar will
be shown. Clicking the buttons of this tool bar will place a new meter
device of the selected type in the upper left corner of the Meter Panel.
©2002 Load Technology Inc.
Page 87
LoadView Version 3
Operator's Manual
10.2.1 The Digital Meter
The Digital Meter provides a numerical representation of the
selected channel. The sample shown
indicates the average voltage. The
size of the panel, colors, borders, titles, etc… can
all be configured via the configuration tools. This
is a Data Aware device.
10.2.2. The Bar Graph Meter
The Bar Graph Meter provides a visual indication of the
value of the selected channel via a scaleable
bar. The actual numerical data can optionally
be shown. The Bar Graph can
be configured for a horizontal
or vertical orientation. This is
a Data Aware device.
10.2.3 The Analog Meter
The Analog Meter
device provides a panel
meter indication of the channel's
current value. The meter face, range
colors, scaling, etc… can all be
configured.
The Analog Meter device is a Data Aware device.
Page 88
LoadView Version 3.0.16 - 05/12/2010
Operator's Manual
LoadView Version 3
10.2.4 The Graphic Device
This device is used to place a graphic bitmap on the meter panel. It can be
used to place a logo or other special graphic on the background of the
Meter Panel. In the example shown, an embossed logo is tiled across the
Meter Panel. This is a non-Data Aware device.
The graphic meter can also
be used to show a non-full
screen picture as shown.
Multiple graphic meter
devices can be placed on the
Meter Panel to produce the
desired effect.
©2002 Load Technology Inc.
Page 89
LoadView Version 3
Operator's Manual
10.2.5 The Log Viewer Panel
The Log Viewer Panel is used to view the current Log File. In essence
this panel is made up of a mini Log Viewer (7.2 The Log Viewer) and
some special buttons. These buttons provide quick access to the settings
of the Data Logging System. There can be only one Log Viewer Panel on
a given screen. This is a non-Data Aware device in the sense that it does
not show the value of a single data channel.
Figure 49 - The Log Viewer Panel
10.2.5.1 The Log Viewer Panel Buttons
The Log Viewer Panel contains seven special buttons that provide quick
access to the controls of the Data Logging System. The following is a
description of each of these buttons.
The View Button
This button is used to open a full Log Viewer of the current
file. Each time this button is pressed, a new Log Viewer
will be created. LoadView will allow up to 20 Log
Viewers to be active at a given time. The Log Viewer Panel provides a
"view" of the Log File, but can only show a limited number of lines based
on the size of your panel. Opening a viewer allows a "bigger" view of the
file. Furthermore, once a viewer has been opened, it can be changed to
view a different file.
The Channels Button
This button is used to select which channels are shown in
the Log Viewer Panel view port. When this button is
pressed a Channel Selection Window (Figure 36) will be opened allowing
you to select the desired channels (ref. 7.2.2.1 Selecting Data Channels to
View).
The Setup Button
This button is used to setup the Data Logging System.
When this button is pressed, a Log Setup Dialog will be
shown. The active Log File, time interval, headings, and
record options can be set from this dialog.
Page 90
LoadView Version 3.0.16 - 05/12/2010
Operator's Manual
LoadView Version 3
Figure 50 - Log Setup Dialog
The On/Off Button
This button is used to toggle On/Off the Data Logging
System. The LED indicates the state of the logging system
- if lit data logging is on. When logging is turned on, and the current Log
File already contains data, you will be given the choice to over-write the
file or append new data lines to it.
The Record Button
This button is used to manually record a line of data to the
Log File. It is also used to provide feedback each time a
data line is recorded. This button is only functional when logging is
turned on.
The Page Setup Button
This button is used to setup how the log file will be formed
on the printed page. When this button is pressed, a Print
Page Setup dialog will be shown. This dialog is used to set the print
parameters (ref. 7.2.1.3 Printing Log Data Files).
The Print Button
This button is used to print the log file. When the file is
printed, the settings entered via the Page Setup will be used
to format the printed page.
©2002 Load Technology Inc.
Page 91
LoadView Version 3
Operator's Manual
10.2.6 The Button Device
Button meter devices are used to provide access to the
various features and controls of the LoadView system. The
following is a list of the functions available via the button meter:
•
•
•
•
•
•
•
•
•
•
•
•
•
•
•
•
•
Cooling fan control
Load bank power control (via the Network Controller)
Run test script
Toggle load On/Off
Set load to preset value(s)
Calibrate sensors
Set load command
Jog load Up/Down
Configure Test Setup
Data logging control (On/Off)
Load user designed screen
Select remote node (via Network Controller)
Set Combined Data mode (Network Controller)
Emergency stop
View High Speed Response (HSR) data
Trigger HSR system
Configure HSR system
You can select either a large or small button. The small button is the same
meter device with the background panel turned off.
Page 92
LoadView Version 3.0.16 - 05/12/2010
Operator's Manual
LoadView Version 3
10.3 The Edit Mode
When the user screen is in the Edit Mode, meter devices can be edited and
their size and position can be changed to suit your needs. Clicking
Run/Edit on the Main Menu or clicking Edit Mode from the Pop-Up Menu
selects the edit mode. The
"Editing…" shown on the
status bar indicates that the
screen is in the Edit Mode.
Note - User designed screens can be password protected. If an
attempt is made to edit a design that is protected, a password will
be required before you will be allowed to enter the Edit Mode.
10.3.1 The Selected Meter
In order to move, re-size, or edit a meter it must first be selected. The
selected meter device is indicated with a dashed outline. The Voltage
meter (V(avg)) is the selected meter in the example shown.
©2002 Load Technology Inc.
Page 93
LoadView Version 3
Operator's Manual
Simply click a meter device with the left mouse button to select it. To
reposition a meter click and hold the left mouse button inside the outline
and drag the meter to the new desired location. Release the button to drop
the meter at the new location. If Snap to Grid is turned on, the top left
corner of the meter will be placed on the nearest grid point. The meter can
be resized in a similar manner by dragging the corners, or the top, bottom,
left, or right lines of the outline. Clicking and dragging the corners of the
window can resize the entire window.
10.3.2 The Meter Editor
The various settings and configurations of the meter devices are entered
using the Meter Editor.
Figure 51 - Meter Editor
Once a meter device has been selected, selecting Edit | Component…
from the Pop-Up Menu, or pressing Ctrl-E opens the editor. DoubleClicking a meter device with the mouse can also be used.
The Title Bar of the editor is used to indicate what type of meter device is
being edited. This is a multi-page dialog. The pages are selected by
clicking the appropriate tab. The pages available will vary based on the
type of meter being edited.
Page 94
LoadView Version 3.0.16 - 05/12/2010
Operator's Manual
LoadView Version 3
10.3.2.1 The Data Page
Common to all Data Aware meter devices are the Data Page settings.
This page contains the configurations that select the data to be shown by
the device and how it is to be displayed. Not all of the configurations on
this page are available for each meter device; those that are not applicable
will be disabled (grayed out).
Figure 52 - The Data Page
10.3.2.1.3 The Data Type Setting
This setting will only be enabled for Digital Meter devices. There are
three Data Types:
1. Text String
2. Value
3. On/Off
The Text String type is used to place a simple panel
on the screen with a test message. When Text String
is selected, the text is simply
entered in "Text String" box.
The text color is set via the
Value Font Color - color panel.
The background color is setup on the Panel Setup Page.
When the Data Type is set to Value, the Digital Meter shows the value of
the selected data channel. The Value Font Color and Panel Setup Page
©2002 Load Technology Inc.
Page 95
LoadView Version 3
Operator's Manual
settings are also used to further define the display characteristics of the
meter.
The On/Off Data Type setting is used to show the status of a digital input.
Currently the only purely digital data channel in LoadView is the Rotation
channel. Future systems may
add additional digital inputs.
When in the On/Off mode, the
panel will show either the On
text or the Off text, based on the
value of the selected data channel. If the
channel is zero, then the Off text will be shown.
Any non-zero value will cause the On text to be
shown. There are also independent color
controls for each state. This Data Type was
included specifically for the Rotation data
channel as it has one of two values - ABC or
BAC.
10.3.2.1.2 Data Channel Settings
The Channel selection allows you to select
which data channel is to be displayed by
the meter device. Click the arrow to show
the pull-down list of available channels.
The available channels are:
• A(avg) - Average Current (amps)
• A(1) - Phase 1 current (amps)
• A(2) - Phase 2 current (amps)
• A(3) - Phase 3 current (amps)
• CtrlV(1) - Phase 1 Control Voltage
(Vrms)
• CtrlV(2) - Phase 2 Control Voltage (Vrms)
• CtrlFreq - Control frequency (Hz)
• CtrlRot - Control power rotation (Hz)
• Freq - Load frequency (Hz)
• KW - Total power (kw)
• KVA - Total VA
• KVAR - Total KVA Reactive (kva)
• PwrFactor - Power Factor (cos θ).
• Rotation - Load voltage rotation
• Exh Temp - Exhaust Temperature (°F)
• Delta Temp - Temperature rise (°F)
• Cab Temp - Cabinet Temperature (°F)
• Amb Temp - Ambient Temperature (°F)
Page 96
LoadView Version 3.0.16 - 05/12/2010
Operator's Manual
•
•
•
•
•
•
•
•
LoadView Version 3
V(avg) - Average Loaf Voltage (Vrms)
V(1) - Phase 1 voltage (Vrms)
V(2) - Phase 2 voltage (Vrms)
V(3) - Phase 3 voltage (Vrms)
VN(1) - Phase 1-nuetral volts (Vrms)*
VN(2) - Phase 2-nuetral volts (Vrms)*
VN(3) - Phase 3-nuetral volts (Vrms)*
GensetSize - Configured Genset Size from the Test Setup
configuration.
LoadCmd - The current commanded load (kw)
•
Display precision is used to select the
precision that the data is displayed to. The
available precisions are; Units (0), tenths
(0.1), or hundredths (0.01).
10.3.2.1.2 Autoscale Data
Auto Scaling of the data can be selected by checking
the Autoscale Data box. Auto scaling dramatically
simplifies the configuration of meter devices. Because the system may by
used for a variety of tests, auto scaling provides a very convenient way to
scale the meters via the Test Setup parameters. Auto scaling sets the meter
device's settings as indicated below:
•
•
•
•
•
Voltage channels
o Min value = NomVolts * 0.75
o Max value = NomVolts *1.25
Frequency
o Min value = 45 Hz
o Max value = 65 Hz
Current Channels
o Nominal value = Current @ Genset Size (kw) and
Nominal volts and a 0.8 power factor.
o Min value = 0
o Max value = Nominal Value * 1.25
Power Channels
o Min value = 0
o Max value = Genset Size *1.25
Power Factor
o Min value = 0.75
o Max Value = 1.1
All meters configured for auto scaling will be rescaled any time the Test
Setup parameters are changed.
*
Not available on "Delta" load connected (3 wire) systems
©2002 Load Technology Inc.
Page 97
LoadView Version 3
Operator's Manual
If the Value Visible box is checked, then the numerical
value of the channel is also shown. This setting is only
in effect for the Bar Graph and Analog Meter device
types. This check box will be checked and cannot be changed for a
Digital type meter device. The Bold check box is used to select whether
the value is shown using a bold font or not.
10.3.2.1.3 Bar Graph Orientation
The Bar Graph Orientation is
used to select the orientation of
the Bar Graph meter device.
This setting is only enabled
when editing a Bar Graph
device.
Page 98
LoadView Version 3.0.16 - 05/12/2010
Operator's Manual
LoadView Version 3
10.3.2.2 The Ranges Page
All Data Aware meter
devices implement data
range functions. Data ranges
are used to define Nominal,
Warning, and Alarm
operating regions for the data
channel. These regions can
be used to color the meter
accordingly.
A meter is said to be in the
Warning State when it's data
value lines within the Warning
Region. A meter is in the Alarm
State, when it's value lies within
the Alarm Region. Optionally a
sound file can be played when in
the Warning or Alarm states.
Figure 53 - The Ranges Page
All range settings are made through the Ranges Page. These settings are
common to all Data Aware meter devices.
©2002 Load Technology Inc.
Page 99
LoadView Version 3
Operator's Manual
10.3.2.2.1 The Range Colors and Reset Times
Range colors used for the Nominal,
Warning, and Alarm states are defined
via the Color panels on the Ranges
Page. Click the required color panel
and a color dialog will be shown
allowing the selection of the desired
color.
The Warning and Alarm Reset Times are used to define the rate in which
the defined sound file (.wav) is played when in the given state. In the
example shown, the defined sound file will be played every 2 seconds
while the data is in the Alarm or Warning states (if sounds are enabled). A
sound file is selected from the Sounds page.
10.3.2.2.2 The Range Type Setting
The range setting parameters provide two major functions. One is to span
the device. Bar Graph and Analog meter devices require this information
to be scaled correctly. The second purpose of the range settings is to
define the Nominal, Warning, and Alarm regions. These regions
effectively place limits on the data shown by the meter.
There are three types of range settings that can be used. These are the
Percent Range (%), the Direct Range, and the Center Zero Range.
Clicking the appropriate tab in the Ranges Page and checking the use
check box selects the range type.
Page 100
LoadView Version 3.0.16 - 05/12/2010
Operator's Manual
LoadView Version 3
10.3.2.2.2.3 Percent Range (%)
The Percent Range type is used to create Warning and Alarm regions that
are a computed, as a percentage of the Nominal Value.
In the example shown above, the Warning and Alarm regions are defined
at 25% and 75% of the nominal value. Since the Range Mode is set to
Greater in this case, the Warning region starts at 1250 (25% greater than
the nominal value) and the Alarm region starts at 1750 (75% greater than
the nominal value).
Range Mode can be set to:
• None - No ranges used
• Greater
• Less
• Less or Greater
©2002 Load Technology Inc.
Page 101
LoadView Version 3
Operator's Manual
If Auto Scaling is enabled (on the Data Page), the Min, Max, and Nominal
values will be automatically set as soon as the meter is placed in the Run
Mode. They will also be updated whenever the Test Setup parameters are
changed.
10.3.2.2.2.4 The Direct Range
As its name implies, the Direct Range settings are used to directly set the
meter's operating ranges. The Direct Range settings are
selected by clicking the "Ranges (Direct)" tab on the
Data Page. Click the Use direct ranges box to make Direct Ranges active.
In this mode, the Nominal, Warning, and Alarm ranges
are set directly.
Note: Using the Direct Range settings when Auto Scaling is active
can cause some unexpected results. This is because only the
"Range 1 start" and "Range 3 end" values are set by the Auto Scaling
functions - the remaining values are not changed.
Page 102
LoadView Version 3.0.16 - 05/12/2010
Operator's Manual
LoadView Version 3
10.3.2.2.2.5 The Center Zero Range
The Center Zero range style is only available for Analog Meter devices.
An Analog Panel Meter that is designed so that the meter needle returns to
the "center" position at zero (with no signal applied) is called a "Center
Zero" meter. This style was included specifically to allow for the creation
of a power factor meter that can indicate both a lagging and leading power
factor.
In the example shown, the needle
will be in the center position if the
Power Factor is 1.00 or -1.00. The
negative value is used to indicate a
leading power factor. The needle
will move to the right as the value
changes from 1.00 to 0.70 and move
to the left of center as the value
moves from -1.00 to -0.70. The meter can be thought of a two separate
meters - one to the right of center and the other to the left. The sign of the
data determines the direction of travel.
Again Auto
Scaling should not
be used with the
Center Zero
Range style.
©2002 Load Technology Inc.
Page 103
LoadView Version 3
Operator's Manual
10.3.2.3 The Panel Setup Page
The Panel Setup Page is used to configure the look and feel of the panel
of the meter device. These settings are common to all meter devices.
Figure 54 - The Panel Setup Page
The following identifies the Outer Bevel, Inner Bevel, Border Width, and
the Panel and bar background colors.
Page 104
LoadView Version 3.0.16 - 05/12/2010
Operator's Manual
LoadView Version 3
Figure 55 - Bevel Setting Examples
As can be seen from the examples, you can use the bevel settings to
control the look of the meter devices. A raised bevel gives the appearance
of sitting on top of. Where a lowered bevel will appear as if it is behind you look into it. You can also see how changing the bevel width can
control how tall or deep the meter appears. The examples shown are all
bar graph devices, however the same controls are available for every meter
device type.
The Meter Component
Name is simply a name
that you can attach to
the meter component. This name will appear in the status bar when
editing the meter device.
©2002 Load Technology Inc.
Page 105
LoadView Version 3
Operator's Manual
10.3.2.4 The Label Setup Page
The Label Setup Page is available for all meter device types except
Buttons. These settings are used to configure the meter's title and units
strings.
Figure 56 - The Label Setup Page
The Label Size setting is used to determine how much of the device's
space should be allocated for the labels. This is expressed in percentage.
In these examples, the Label Size is set to 40%. This causes 40% of the
meter to be used to show the labels. The larger the Label Size the smaller
the meter device space (the Bar in this case).
Page 106
LoadView Version 3.0.16 - 05/12/2010
Operator's Manual
LoadView Version 3
Note: Size pertains to a percentage of the meter's height when the
labels are on the top or bottom, and a percentage of the meter's
width when the labels are on the left or right.
The Title Settings and Units Settings are used to enable/disable their
respective headings. These strings are automatically set to the channel
name and units when a channel is selected (via the Data Page). The Label
Position settings are used to determine where the labels are located as
shown:
Figure 57 - Label Setting Examples
©2002 Load Technology Inc.
Page 107
LoadView Version 3
Operator's Manual
10.3.2.5 The Meter Dial Settings
The Meter Dial Settings are only available when editing an Analog Meter
Device. These settings configure the "look and feel" of the meter face.
Figure 58 - The Meter Dial Settings Page
Page 108
LoadView Version 3.0.16 - 05/12/2010
Operator's Manual
LoadView Version 3
Figure 59 - Analog Meter Settings
The Major Division marks on the meter face are the longer bold tick
marks as shown above. There is an implied Major Division at the start of
the meter (the left hand side of the scale) so the actual number of Major
Divisions is one more than the configured value. In the above example,
there are a total of 5 Major Divisions - the one at the 0'th position and four
more. Each Major Division is marked with an associated scale annotation.
The Annotation size setting is used to control the size of the meter scales
annotation text.
The Minor Division marks are the smaller tick marks that lie between the
Major Division marks. The configured value sets the number of these
marks that lie between each Major Division mark, four in this example.
The Meter Scale setting is used to set the height of the meter scale as show
above. This setting affects the size of the Major and Minor Division tick
marks as well as the size of the Range Panel.
The Show Bezel setting is used to turn on and off the meter
bezel as shown.
©2002 Load Technology Inc.
Page 109
LoadView Version 3
Operator's Manual
The Autosize Meter Scale setting is used to
automatically control the sizing of the meter scale.
This setting is used in conjunction with the Meter Scale Angle setting.
When this box is checked, the angle of the meter and its effective needle
center point are automatically calculated to best fit the available space for
the meter face. In the automatic mode, the Meter
Scale Angle is used to define the maximum angle
that will be used.
Figure 60 - Meter Angle Setting Examples
The Meter Scale Color is used to control the color applied to the Major
and Minor Division ticks and the scale annotations. The background color
of the meter face is controlled via the Panel/Bar background color setting
on the Panel Setup Page.
The Show Range Panel check box is used to turn
on/off the Range Panel.
This example shows an Analog
Meter with the Range Panel turned
off and a different color scheme.
Page 110
LoadView Version 3.0.16 - 05/12/2010
Operator's Manual
LoadView Version 3
10.3.2.6 The Bitmap Page
The Bitmap Page is used to control the bitmap of the meter device. This
page is only available for Analog Meter and Graphic devices.
Figure 61 - The Bitmap Page
A Bitmap can be loaded into a Graphic device or the background of an
analog meter panel. Click the Load Bitmap button to select the required
bitmap file and load it into the component.
The Options settings allow for either "Stretch bitmap to fit component" or
"Fill entire window with bitmap". Stretch bitmap to fit component is used
to size the component - that is the bitmap is made to fit the component.
When the Fill entire window with bitmap setting is used, the meter
component is first stretched to the size of the entire window, then it is
filled with the selected bitmap. The Tile Bitmap allows the bitmap to be
sized by tiling it rather than stretching.
The Clear Bitmap button is used to remove the bitmap from the
component.
©2002 Load Technology Inc.
Page 111
LoadView Version 3
Operator's Manual
10.3.2.6.1 The Glyph Page
When editing a button component, a Glyph setting page is available. This
page is very similar to the Bitmap Page, except that it is used to load a
bitmap glyph to a button face.
Figure 62 - The Glyph Page
In the example button shown, an envelope bitmap is loaded to a button
face. A button cannot have both a glyph and an LED - the LED will be
overwritten by the glyph.
Page 112
LoadView Version 3.0.16 - 05/12/2010
Operator's Manual
LoadView Version 3
10.3.2.7 The Sounds Page
This page is used to select/edit the sound file associated with the meter
component.
Figure 63 - The Sounds Page
to play the selected wave file. The New button
Use the play buttons
can be used to record a sound file if your system has a microphone
attached. When the
"New…" button is
pressed the LoadView
sound recorder is
shown. Click record to
start the recording,
speak into the mic, and
then click stop, to stop
the recording.
©2002 Load Technology Inc.
Page 113
LoadView Version 3
Operator's Manual
10.3.2.8 The Button Style Page
This page is used to configure a Button meter device.
Figure 64 - The Button Style Page
The Button Function setting is used to select the function of the button
(see 10.2.6 The Button Device). An LED can optionally be placed on the
Button. The Button Style settings are used to select the button style as
shown:
Figure 65 - Button Style Examples
Page 114
LoadView Version 3.0.16 - 05/12/2010
Operator's Manual
LoadView Version 3
The Button Caption and Label
Settings are used to set the text used
on the button and the panel
respectively. The caption value is
automatically preset with the
appropriate text when a button
function is selected. After the button function has been made, the caption
can be changed as required.
Use the Button size parameters to size the
button to meet your needs.
The "File" parameter is used to specify the name of the script file or screen
file. This parameter is only used if the Button Function is set to either
"Select Screen" or "Run Script". For Select Screen, this parameter is the
name of the user designed screen file that will be loaded when the button
is pressed. In the Run Script case, this is the name of the script file that is
to be run.
©2002 Load Technology Inc.
Page 115
Index
LoadView Version 3
Index
A
A(1) 96
A(2) 96
A(3) 96
A(avg) 96
About Box 16
Active Step 73, 74
Add New Component 85
Alarm 22, 99, 100, 101
All Off 17
All On 18
Amb Temp 96
Amps 25, 46, 77
Analog Meter 87, 88, 98, 103, 108
Annotation size 109
Auto On 18, 78
Auto Scaling 39, 97, 102
Automatic Page 8, 10, 24, 25, 27, 30, 39, 41
Autoscale Data 97
Autosize Meter Scale 110
B
Bar Graph 98
Bar Graph Meter 22, 87, 88
Bar Graph Meter Page 22
Bar Graph Orientation 98
Bitmaps Visible 85
Border Width 104
Button 10, 11, 16, 17, 18, 19, 44, 58, 87, 92
Button Caption 115
Button Device 92
Button Function 114, 115
C
Cab Temp 96
CD-ROM 4
Center Zero 100, 103
Center Zero Range 100
Change in Load 62
Channel Selection Window
Channels Button 90
59, 60, 61, 90
©2002 Load Technology Inc.
Page 117
LoadView Version 3
Index
COM port 35
Combined Data 20, 21, 23, 30, 42, 44, 45, 59, 92
Conditional 62
Configure Response System 75, 80
Configure Test Settings 75, 76
Connection 32
Connection Page 35
Control Section 8, 10, 12, 24, 27, 29, 30, 39, 41
cooling fan 7, 9, 16, 17, 21, 26, 37, 77, 78
CSV 52, 54
CtrlFreq 96
CtrlRot 96
CtrlV(1) 96
CtrlV(2) 96
Custom Screen Designs 83
Cut 85
D
Data Aware 87, 95, 99
data channel 61, 96, 99
Data Logging 10, 14, 18, 27, 48, 49, 72, 79, 90, 91
data ranges 99
Data Section 12, 21, 22
Data Type 95, 96
Data Types 95
Delete Component 85
Delete Line 74
deleting 85
Delta Temp 96
Demo Mode 2, 34
Digital Meter 21, 87, 88
Digital Meter Page 21
Direct Load Entry 10
Direct Range 100, 102
Disable Response System 75, 80
Display precision 97
E
Edit Line 74
Edit Mode 84, 85, 87, 93
Editor Panel 73, 74
Enable Response System 75, 80
Error Messages 15
Exh Temp 96
Export CSV 54
Page 118
LoadView Version 3.0.16 - 05/12/2010
Index
LoadView Version 3
F
Fan Control Button 9, 10, 16, 17
Fan Control Screen 10, 17, 37
Fan Control Settings 37
Fan Off 75, 78
Fan On 75, 78
File Menu 8, 13, 31, 38, 43, 52, 74, 83, 84
file path system 33
Freq 96
frequency recovery 70
G
Genset Size 8, 26, 27, 30, 39, 41, 97
GensetSize 97
Glyph 112
Glyph Page 112
Graphic 85, 87, 89
Grid 85, 94
H
Hide Meters 85
High Speed Response 5, 10, 14, 19, 29, 47, 62, 72, 80, 81, 92
High Speed Response License 5
HSR 10, 19, 29, 62, 80, 81, 92
HSR configuration 63
HSR Voltage and Frequency Recovery 67
I
Independent 37
Informational Messages
Inner Bevel 104
15
J
Jog
9, 24, 25, 41, 92
K
Key File 5, 16
KVA 20, 21, 96
KVAR 20, 21, 25, 26, 96
KW 96
L
Label 115
Label Position
107
©2002 Load Technology Inc.
Page 119
LoadView Version 3
Index
Label Setup Page 106
Label Size 106
Landscape 55
LB Power 7, 20
License Manager 5, 47
Load On/Off 11, 18
Load Setting 24, 25, 26
Load Type 40
LoadCmd 97
LoadView License 5
Log Data File 48, 49, 52, 54, 60, 61, 72, 80
Log File 14, 18, 19, 28, 32, 48, 50, 51, 52, 54, 59, 79, 90, 91
Log Headings 28
Log Page 51, 55
Log Viewer 1, 27, 51, 53, 54, 58, 59, 61, 87, 90
Log Viewer Panel 90
Logging Page 27, 48, 49
Logging Time Period 27
M
Main Data Screen 7, 12, 16, 19, 21, 24, 38, 39, 48, 49, 52, 72
Main Menu 11, 12, 13, 31, 32, 47, 50, 51, 52, 54, 58, 59, 61, 72, 74, 83, 93
Major Division 109
Man Record 28
Manual Page 30
Max value 97
Merge with last line 50
Meter Component Name 105
Meter Device 84, 85, 87
Meter Dial Settings 108
Meter Editor 94
Meter Panel 84, 85, 87, 89
Meter Scale 109
Meter Scale Angle 110
Meter Scale Color 110
Min value 97
Minor Division 109, 110
MRU 74, 83, 84
N
Network Controller 1, 2, 3, 5, 7, 10, 13, 17, 18, 19, 20, 21, 23, 31, 34, 35, 36, 37, 44,
48, 78, 92
Network Controller Buttons 20, 23
Node Selection Window 20, 21, 30, 42, 45
Nominal 8, 22, 27, 30, 39, 41, 97, 99, 100, 101, 102
Nominal Voltage 8, 27, 30, 39
Page 120
LoadView Version 3.0.16 - 05/12/2010
Index
LoadView Version 3
O
Off text 96
On text 96
On/Off 11, 16, 18, 30, 72, 91, 92, 95, 96
On/Off Button 91
Orientation 55
Outer Bevel 104
P
Page Setup 52, 54, 55, 56, 58, 91
Page Setup Button 91
Panel Setup Page 95, 104
Paste 85
Pause 19
Percent Range 100, 101
PF Adj 26
Plot Configuration 70
Plot Configuration Screen 70
Plot Response Data 75, 81
Pop-Up Menu 84, 93, 94
Portrait 55
power factor 10, 11, 18, 24, 25, 26, 77, 97
Power Meter 62
Preset Load 9, 11, 26, 41
Print Button 91
Program Configuration Screen 32, 34
PwrFactor 96
Q
Quick Button
16
R
Range Panel 109, 110
range type 100
Ranges Page 99, 100
Record Button 91
Record Length 62, 63
Record Line 75, 79
Record Mode 50, 61
Record new line 50
Record User Data 49, 50, 58, 61, 75, 82
Remote User Interface 8
Response Page ii, 29, 63, 65
Response Plot Screen 65
Resume 19
©2002 Load Technology Inc.
Page 121
Index
LoadView Version 3
Root directory 34
Rotation 96
Run Mode 84
Run Script 11, 115
S
Save Response Data 75, 81
Scripting 11, 13, 14, 34, 72
Select Channels 58, 59
Select Screen 115
Selected Meter 93
Selection Panel 73
Send to back 85
Sensor Calibration 1, 43, 44, 45
Set Load 24, 25, 26, 72, 75, 77
Set Test Cfg 76
Setup Button 90
Show Bezel 109
Show Range Panel 110
Size to meters 86
Snap to Grid 85, 94
Status Data Page 22
Stop Logging 49, 75, 79, 80
Stop Logging Data 49
Stop Rec. User Data 49
Stop Response System 75, 81
System Message 15
System Registration 5
System Setup 32
T
test script 7, 9, 10, 11, 19, 62, 72, 74, 75, 92
Test Setup 7, 8, 13, 18, 22, 25, 26, 27, 31, 38, 39, 41, 72, 76, 92, 97
Text String 95
Title Settings 107
Tool Bar 12, 16
Trigger Button 29, 62
Trigger Response System 75, 81
U
Units Settings 107
Use fan loss 40
Use Range Colors 22
User Channels 60
User Defined Data Channels
User Design Tool Bar 87
Page 122
2, 49, 72, 82
LoadView Version 3.0.16 - 05/12/2010
Index
LoadView Version 3
User Screens 13, 83, 84
User Settings 9, 38, 40
V
V(1) 97
V(2) 97
V(3) 97
V(avg) 97
Value 95
Value Font Color 95
Value Visible 98
View Button 90
VN(1) 97
VN(2) 97
VN(3) 97
voltage recovery 70
W
Wait 75, 78
Warning 3, 22, 35, 37, 39, 46, 99, 100, 101
©2002 Load Technology Inc.
Page 123