1
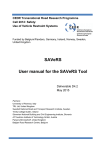
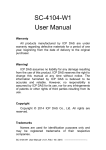
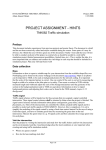
IMIS
Infrastructure Management
Information System
User Manual
Prepared by:
The Center for Transportation Research and Education
October 1998
Infrastructure Management Information System – User Manual
Page i
Infrastructure Management Information System
User Manual
Prepared for
Iowa Department of Economic Development
Sponsored by
US Department of Commerce, Economic Development Administration
Prepared by
Center for Transportation Research and Education
Iowa State University
Iowa State University Research Park
2625 North Loop Drive, Suite 2100
Ames, IA 50010-8615
Telephone: 515-294-8103
Fax: 515-294-046
Principal Investigator
Tom Maze
Project Manager
David Plazak
Application Developer
Dan Gieseman
October 1998
Infrastructure Management Information System – User Manual
Page ii
Table of Contents
Overview Of Microsoft Windows Terminology ....................................................................v
System Overview ..................................................................................................................... 1
Installation ............................................................................................................................... 1
Hardware and Software Requirements.................................................................................. 1
The IMIS User Interface ........................................................................................................ 2
The Map ................................................................................................................................ 2
Important Buttons.................................................................................................................. 2
The Zoom Buttons............................................................................................................. 3
The View Entire Map Button............................................................................................ 3
The Pan Map Button ......................................................................................................... 3
The Exit IMIS Button........................................................................................................ 3
Locating Map Features.......................................................................................................... 3
Important Buttons.................................................................................................................. 4
The ‘Find By’ buttons ....................................................................................................... 4
The Iowa Water Plan Database............................................................................................. 5
Database Overview ............................................................................................................... 5
Important Buttons.................................................................................................................. 6
The Information Button..................................................................................................... 6
The Data Aggregation Button ........................................................................................... 6
Access and Display of Water Plan Data................................................................................ 7
Deciphering Database Codes ................................................................................................ 8
The 1990 Census Database................................................................................................... 10
Database Overview ............................................................................................................. 10
Important Buttons................................................................................................................ 10
The Information Button................................................................................................... 10
The Data Aggregation Button ......................................................................................... 10
Access and Display of Census Data.................................................................................... 11
Thematically Mapping Census Data ................................................................................... 14
Overview of Thematic Mapping ......................................................................................... 14
Important Buttons................................................................................................................ 14
The Theme Mapper Button and Legend Window Button............................................... 14
The Data Aggregation Button ......................................................................................... 14
The Theme Mapper Tool..................................................................................................... 15
The Active Database Listbox .......................................................................................... 15
The Active Database Field Listbox................................................................................. 15
The Close Button............................................................................................................. 16
The Mode Tab ................................................................................................................. 16
The Start and End Color Range Listboxes...................................................................... 16
The Number of Ranges Listbox ...................................................................................... 16
The Type of Range Option Buttons ................................................................................ 16
Using the Theme Mapper Tool ........................................................................................... 17
The Road Database............................................................................................................... 20
Database Overview ............................................................................................................. 20
Infrastructure Management Information System – User Manual
Page iii
Important Buttons................................................................................................................ 20
The Information Button................................................................................................... 21
Access and Display of Road Data....................................................................................... 21
Other IMIS Features ............................................................................................................ 24
Important Buttons................................................................................................................ 24
The Select Tool Button ................................................................................................... 24
The Info Tool Button....................................................................................................... 25
Performing Database Queries in IMIS................................................................................ 25
List of Figures
Figure 1. User Interface Component Reference.........................................................................v
Figure 2. The IMIS User Interface............................................................................................ 2
Figure 3. Important Buttons for Manipulating the Map Window............................................ 3
Figure 4. Important Buttons for Locating Specific Geographic Areas .................................... 4
Figure 5. Find by City Dialog Box............................................................................................ 4
Figure 6. The PWSID Select Box ............................................................................................ 5
Figure 7. The Water Plan Button Pad ...................................................................................... 5
Figure 8. Important Buttons for Accessing Water Plan Data................................................... 6
Figure 9. The Data Aggregation Control Box.......................................................................... 6
Figure 10. IMIS Database Help Tool ....................................................................................... 9
Figure 11. The Census Button Pad......................................................................................... 10
Figure 12. Important Buttons for Accessing Census Data..................................................... 11
Figure 13. The Data Aggregation Control Box...................................................................... 11
Figure 14. Important Buttons for Accessing Census Data..................................................... 14
Figure 15. Theme Mapper Functions ..................................................................................... 15
Figure 16. Setting the Active Database.................................................................................. 15
Figure 17. Start Color Listbox Color Options........................................................................ 16
Figure 18. The Transportation Data Button ........................................................................... 20
Figure 19. Important Buttons for Accessing Transportation Data......................................... 20
Figure 20. The IMIS Menu Bar File Commands ................................................................... 24
Figure 21. The Mapinfo Tools Button Pad ............................................................................ 24
Figure 22. The Info Tool Box ................................................................................................ 25
Figure 23. IMIS Menu Bar Query Commands....................................................................... 25
Infrastructure Management Information System – User Manual
Page iv
OVERVIEW OF MICROSOFT WINDOWS TERMINOLOGY
Many of the user instructions contained in this documentation refer to the user interface
forms and dialog boxes, which send and receive information between the application and the
user. Figure 1 illustrates the different Windows components (called controls) referred to in
these user instructions.
Figure 1. User Interface Component Reference.
Form - The Windows components are
placed on a form. This is what the
user sees and interacts with.
ComboBox - Similar to Listbox.
The combobox's list portion is
hidden when not in use. Users
drop down the combobox's list
to pick items using the mouse.
Listbox - Users pick from
the list using the mouse.
Scrollbar - Used to Scroll up
and down when there are more
list items than can be displayed.
Textbox - Used to input and
display data to and from the
user.
This button is Disabled; The
dimmed color means that the
program needs more input before
it will Enable this button.
Button - Click the button
with the mouse to activate or
run certain portions of the
program.
Option Buttons Provide the user a
choice between several
items.
Infrastructure Management Information System – User Manual
Page v
SYSTEM OVERVIEW
The Infrastructure Management Information System (IMIS) is designed to answer questions
regarding public water supply, wastewater treatment, and census information. IMIS was
developed through a planning grant from the US Department of Commerce Economic
Development Administration to the Iowa Department of Economic Development.
INSTALLATION
User Note: Please read and understand the following install instructions before installing
the IMIS software.
Hardware and Software Requirements
IMIS requires Mapinfo 4.0 or higher to be installed on a Windows 95 or Windows NT
computer. Monitor settings can vary, but ‘Small Fonts’ must be selected in the System
Control Display Settings in order for data and buttons from IMIS to be displayed properly. A
CD-ROM drive is required to install IMIS. At least 40 megabytes must be available on the
machine for IMIS to be installed. It is recommended that the machine running IMIS have at
least 32 megabytes of RAM. Poor performance will result when running IMIS using less
RAM.
To install IMIS, place the IMIS Setup/Install disk in the CD drive of local machine. Using
Windows Explorer, double click on the ‘Setup.exe’ file in the ‘imis_install’ directory of the
CD. This program will install the necessary .dll files for running the IMIS environment.
When prompted for an install directory, change the directory to ‘C:\IMIS’. The program will
ask if it should create the IMIS directory. Answer ‘YES’ when prompted. When the install
program is finished, copy the contents of the IMIS directory on the CD to the ‘C:\IMIS’
directory. When doing this, Windows will ask if it should overwrite the existing ‘IMIS.exe’
file already in the ‘C:\IMIS’ directory. Answer ‘NO’ when prompted.
Once this is finished IMIS is ready for operation. Create a shortcut on the Desktop by
dragging the ‘IMIS.EXE’ icon from the ‘C:\ IMIS’ directory to the Desktop.
To activate IMIS, double-click on the IMIS icon.
Infrastructure Management Information System – User Manual
Page 1
THE IMIS USER INTERFACE
All of the information available to IMIS is accessed through the user interface. The basic
interface is entirely button driven. This means that clicking buttons displayed on the monitor
with the mouse can access most functions and data within IMIS. Figure 2 shows the basic
user interface of IMIS following start-up.
Figure 2. The IMIS User Interface
The Map
The large map in Figure 2 is referred to as the map window. The map window initially
displays the following:
•
•
•
Iowa counties.
IMIS pilot area boundaries.
The zip code boundaries within each of the pilot areas.
Important Buttons
Five buttons on the Main Button Pad are important to basic manipulations of the IMIS map
environment. These are the ‘Zoom In’, ‘Zoom Out’, ‘View Entire Map’, ‘Pan Map’, and
the ‘Exit IMIS’ buttons. These buttons are highlighted in Figure 3.
Infrastructure Management Information System – User Manual
Page 2
Figure 3. Important Buttons for Manipulating the Map Window
Zoom In
View Entire Map
Activate Theme Mapper
Zoom Out
Pan Map
Show Legend Window
Activate Layer Control
Information
Find Zip Code
Find PWSID
Find County
Data Aggregation
Find City
Show M.A.P Database Button Pad
Exit IMIS
The Zoom Buttons
Use the ‘Zoom In’ and ‘Zoom Out’ buttons to see specific areas of the map in greater or less
detail. Clicking the appropriate button with the mouse activates these tools. A single click
on the map window zooms in, or out, at the point where the tool is located. Holding the
mouse button and dragging creates a rectangular area of the new map extents.
The View Entire Map Button
Clicking on the ‘View Entire Map’ button restores the map window to its original view
showing the entire state.
The Pan Map Button
Clicking on the ‘Pan Map’ button provides a tool for re-centering the entire map, without
changing the zoom level. Use this tool to “slide” the map window in order to view features
at the edge of the map.
The Exit IMIS Button
Use the ‘Exit IMIS’ button to exit the IMIS environment.
Locating Map Features
IMIS provides several tools for the location of map features. Functionality is provided to
quickly locate any county, township, zipcode, or municipality. These tools are accessed
directly from the Main Button Pad.
Infrastructure Management Information System – User Manual
Page 3
Important Buttons
Four buttons on the Main Button Pad are important to locating specific geographic areas of
the IMIS environment. These are the ‘Find Zipcode’, ‘Find Township’, ‘Find County’,
and the ‘Find City’ buttons. These buttons are highlighted in Figure 4.
Figure 4. Important Buttons for Locating Specific Geographic Areas
Zoom In
View Entire Map
Activate Theme Mapper
Activate Layer Control
Find Zip Code
Find County
Data Aggregation
Zoom Out
Pan Map
Show Legend Window
Information
Find Township
Find City
Show M.A.P Database Button Pad
Exit IMIS
The ‘Find By’ buttons
This set of four buttons located on the lower part of the Main Button Pad allows location of a
particular geographic area.
Clicking one of these buttons activates the specific ‘Find By’ dialog box. Figure 5 displays
the ’Find by City’ dialog box. Use the mouse to select a specific geographic area to zoom to,
and then click the OK Button. To cancel the dialog box, click the small ‘X’ in the upper
right corner.
Figure 5. Find by City Dialog Box
Infrastructure Management Information System – User Manual
Page 4
THE IOWA WATER PLAN DATABASE
Database Overview
The Iowa Water Plan Database, provided by Midwest Assistance Program, is the public
water supply information component of the IMIS environment. The database consists of 12
tables containing the results of survey forms mailed to each public water supply. These
tables are linked together using a common identifier called the Public Water Supply
Identification Number (PWSID). The IMIS environment functions as a ‘front-end’ to these
tables, providing a geographic-link to water plan data, and user-friendly display of these data
(Appendix 1 diagrams the linkages of water plan and census data to geographic features in
the map window).
When a feature is selected in the map window using the Information Tool, all database
elements having the corresponding geographic area identifier are selected from the Iowa
Water Plan Database. The PWSID Select Box (see Figure 6) then displays the selected
PWSID numbers of these records.
Figure 6. The PWSID Select Box
Selection of an individual Public Water Supply from the PWSID Select Box displays the
Water Plan Button Pad (see Figure 7). This button pad facilitates access to the individual
Water Plan data forms, which display table information from the Water Plan to the user.
User Note: If a single entry appears in the PWSID Select Box, IMIS automatically loads all
water plan information for the entry. No user selection is necessary.
Figure 7. The Water Plan Button Pad
Distribution
Financial
Treatment
Planning / Assistance
Water Use
Rates
Mailing Addresses
Resources
Infrastructure Management Information System – User Manual
Page 5
Important Buttons
Two buttons on the Main Button Pad are important to the access of Iowa Water Plan
Database tables. These are the ‘Information’ and the ‘Data Aggregation’ buttons. These
buttons are highlighted in Figure 8.
Figure 8. Important Buttons for Accessing Water Plan Data
Zoom In
View Entire Map
Activate Theme Mapper
Activate Layer Control
Find Zip Code
Find County
Data Aggregation
Zoom Out
Pan Map
Show Legend Window
Information
Find PWSID
Find City
Show M.A.P Database Button Pad
Exit IMIS
The Information Button
Clicking this button enables the Information Tool. Use this tool to select specific map
features and retrieve any attributes linked to the feature. This is the basic tool used to access
each IMIS database.
The Data Aggregation Button
Clicking this button activates the Data Aggregation Control Box shown in Figure 9. Use
this tool to control the aggregation level of water plan data. For example, clicking the
‘County’ option button will select all public water supplies within a county selected from the
map using the Information Tool. For city-level water plan information, click directly on any
city corporation limit polygon.
Figure 9. The Data Aggregation Control Box
Infrastructure Management Information System – User Manual
Page 6
User Note: The Iowa Water Plan Database does not contain fields defining which township
each public water supply is located in; therefore, only census data may be accessed
whenever the township layer is active.
Access and Display of Water Plan Data
The following section details an example workflow for accessing the Iowa Water Plan
Database using the IMIS environment. For this example, information is sought regarding
water treatment in the Northeastern Iowa town of Lansing. It is assumed that the location of
Lansing is known.
User Note: The following workflow is only one approach to accessing data for Lansing, as
IMIS provides several methods for accessing each database.
Step 1. Activate Information Tool
With IMIS started, activate the Information Tool by clicking on the ‘Information’ button of
the Main Button Pad.
User Note: This is the default tool selected after IMIS startup, so it may already be
selected.
Step 2. Click on the zipcode or city polygon for Lansing.
Infrastructure Management Information System – User Manual
Page 7
Step 3. Select ‘City of Lansing’ from the PWSID Select Box.
Step 4. Select the ‘Treatment’ button from the Water Plan Data Buttons that appear.
The City of Lansing Public Water Supply Treatment Information is displayed. Close the
form using the small ‘X’ in the upper right corner.
The ‘Treatment’ form displays important information regarding water treatment within the
City of Lansing. Information is available regarding the number of gallons treated per year,
the name of the operator, and other items treated.
Deciphering Database Codes
Many times information entered into a database is coded to keep the size of data to a
minimum. For example, a road might have the classification of primary, secondary, or
municipal. To minimize database size, the codes 1, 2 and 3 are used. The IMIS environment
provides a tool to assist in decoding the actual value of any database entry code, or to find
out more information regarding any water plan database field.
Infrastructure Management Information System – User Manual
Page 8
For the previous example, the ‘Treatment’ form entry ‘Which Non-regulated Item’ spells out
which non-regulated items the City of Lansing is treating. The number 24 is all that is placed
in this field. To access the database help functionality of IMIS, click anywhere in the textbox
containing the codes in question. In this case, click on the textbox containing the number
24. The dialog box shown in Figure 10 appears, explaining that 2 and 4 are separate entries
signifying ‘Sulfates’ and ‘Odor’ are being treated in Lansing. All forms displaying water
plan information have this capability.
Figure 10. IMIS Database Help Tool
Infrastructure Management Information System – User Manual
Page 9
THE 1990 CENSUS DATABASE
Database Overview
The 1990 Census Database, provided by US Census Bureau, stores the demographic
component of the IMIS environment. The database consists of 3 tables containing various
census data grouped by income, employment, and housing categories. These tables are
linked together using a common identifier based on the census database key-fields. The
IMIS environment functions as a ‘front-end’ to these tables, providing a geographic-link to
census data, and user-friendly display of these data (Appendix 1 diagrams the linkages of
water plan and census data to geographic features in the map window).
Census data are available for county, township, zipcode, and municipal geographic areas.
The data displayed pertains to the geographic area selected using the Information Tool. The
Data Aggregation Control Box is used to change geographic layers. When a feature from the
map window is selected, the census data with the corresponding geographic area identifier
are selected from the Census Database. The Census Button Pad (see Figure 11) then enables
the viewing of some or all of the census database tables.
Figure 11. The Census Button Pad
Employment
Housing
Income
Clicking any button on the Census Button Pad makes visible the corresponding dialog form
displaying census data.
Important Buttons
Like the water plan database, the ‘Information’ and the ‘Data Aggregation’ buttons are
used to access census data. These buttons are highlighted in Figure 12.
The Information Button
Clicking this button enables the Information Tool. Use this tool to select specific map
features and retrieve any attributes linked to the feature.
The Data Aggregation Button
Clicking this button activates the Data Aggregation Control Box shown in Figure 13. Use
this tool to control the aggregation level of census data. For example, clicking the ‘County’
option button will display census data for any county selected from the map using the
Infrastructure Management Information System – User Manual
Page 10
Information Tool. For city-level census data, click directly on any city corporation limit
polygon.
Figure 12. Important Buttons for Accessing Census Data
Zoom In
View Entire Map
Activate Theme Mapper
Zoom Out
Pan Map
Show Legend Window
Activate Layer Control
Information
Find Zip Code
Find PWSID
Find County
Data Aggregation
Find City
Show M.A.P Database Button Pad
Exit IMIS
Figure 13. The Data Aggregation Control Box
Access and Display of Census Data
The following section details an example workflow for accessing census data using the IMIS
environment. For this example, information is sought regarding sewage treatment
information for the City of Adair. It is assumed that the location of Adair is known.
User Note: The following workflow is only one approach to accessing data for Adair as
IMIS provides several methods for accessing each database.
Infrastructure Management Information System – User Manual
Page 11
Step 1. Activate Information Tool
With IMIS started, activate the Information Tool by clicking on the ‘Information’ button of
the Main Button Pad.
User Note: This is the default tool selected after IMIS startup, so it may already be
selected.
Step 2. Click on the city polygon for Adair. The map window will re-center on the town of
Adair.
Step 3. Select the ‘Housing’ button from the Census Data Buttons that appear when census
data are loaded.
Infrastructure Management Information System – User Manual
Page 12
The form’s graphics and textboxes show that the vast majority of Adair homes are hooked to
public sewer, and to a public/private water system.
Infrastructure Management Information System – User Manual
Page 13
THEMATICALLY MAPPING CENSUS DATA
Overview of Thematic Mapping
The IMIS environment supports the use of thematic maps as a tool for database tables.
Thematic maps are a way to graphically visualize data through the assignment of colors to
map features based on values in the associated database. IMIS provides the Theme Mapper
Tool to create thematic maps of the three census database tables.
Important Buttons
Three buttons on the Main Button Pad are important to thematically mapping census data.
These are the ‘Activate Theme Mapper’, ‘Show Legend Window’, and ‘Data
Aggregation’ buttons. These buttons are highlighted in Figure 14.
Figure 14. Important Buttons for Accessing Census Data
Zoom In
View Entire Map
Activate Theme Mapper
Activate Layer Control
Find Zip Code
Find County
Data Aggregation
Zoom Out
Pan Map
Show Legend Window
Information
Find Township
Find City
Show M.A.P Database Button Pad
Exit IMIS
The Theme Mapper Button and Legend Window Button
Clicking the ‘Activate Theme Mapper’ button activates the Theme Mapper Tool used for
producing thematic maps of census data. The ‘Show Legend Window’ button activates a
window showing a legend of the corresponding color values produced by the Theme Mapper.
The Data Aggregation Button
Clicking this button activates the Data Aggregation Control Box. Use this tool to control
the aggregation level of census data. For example, clicking the ‘County’ option button will
thematically map census data for all counties.
Infrastructure Management Information System – User Manual
Page 14
The Theme Mapper Tool
The functions available to the Theme Mapper Tool are detailed in Figure 15. The remainder
of this section explains what functions each component of the Theme Mapper performs.
Figure 15. Theme Mapper Functions
Mode Tab
Active Database
Type of Range
Active Database Fields
Start Color Range
Number of Ranges
End Color Range
Close Theme Mapper
Help
The Active Database Listbox
Use this control to designate which of the three IMIS census tables to thematically map (see
Figure 16).
Figure 16. Setting the Active Database
The Active Database Field Listbox
This listbox displays each field contained in the present Active Database. Selecting a field
from this list will display a thematic map based on the values of these data.
Infrastructure Management Information System – User Manual
Page 15
The Close Button
Clicking the ‘Close’ button removes any thematic layers from the map window and closes
the Theme Mapper Tool.
The Mode Tab
The ‘Mode Tabs’ select whether the ‘Data’ or ‘Options’ form of the Theme Mapper is
displayed. Use the mouse to click on the desired tab.
The Start and End Color Range Listboxes
These listboxes control the range of colors used to produce thematic maps. Figure 17
displays the contents of the listbox.
Figure 17. Start Color Listbox Color Options
The Number of Ranges Listbox
The ‘Number of Ranges’ listbox sets the number of color ranges for which data are
displayed. The Theme Mapper Tool has default range setting of ‘5’.
The Type of Range Option Buttons
The ‘Type of Range’ option buttons set the manner in which ranges are calculated. The
options are:
•
Equal Ranges: the ranges divisions are separated equally, with no regard to the number
of records placed into each range.
Infrastructure Management Information System – User Manual
Page 16
•
•
Equal Count: the range divisions are calculated so as to have an equal amount of records
places in each range.
Natural Break: the ranges are calculated using a statistical algorithm so that the average
of each range is as close to as possible the values in the range. This method ensures that
the data in each range are reasonably close together.
Using the Theme Mapper Tool
The following section details an example workflow for thematically mapping census data
using the IMIS environment. For this example, an analysis of the number of households per
township is performed for the study area.
Step 1. Activate ‘Theme Mapper’ by clicking on the ‘Activate Theme Mapper’ button of the
Main Button Pad.
Step 2. Designate the ‘Housing Database’ as the Active Database.
Step 3. Activate Data Aggregation Control Box by clicking the ‘Data Aggregation Control’
button on the Main Button Pad.
Infrastructure Management Information System – User Manual
Page 17
Step 4. Change the aggregation level to ‘Township’ on the Data Aggregation Control Box.
Step 5. Change the range settings of the ‘Type of Range’ option buttons to ‘Equal Ranges’.
Step 6. Select the field containing information regarding the number of households in each
township.
Infrastructure Management Information System – User Manual
Page 18
Step 7. Activate the Legend Window by clicking the ‘Show Legend Window’ button on the
Main Button Pad.
Step 8. Use the Information Tool along with the Census Data Button Pad to query individual
census polygons for their actual values.
Infrastructure Management Information System – User Manual
Page 19
THE ROAD DATABASE
Database Overview
The Road Database, provided by Iowa Department of Transportation (Iowa DOT), is the
transportation information component of the IMIS environment. The database consists of 1
table containing various roadway inventory data such as street name, route name, and traffic
volumes. The IMIS environment functions as a ‘front-end’ to this table, providing a
geographic-link to roadway data, and user-friendly display of these data.
When a roadway feature is selected from the map window, the corresponding roadway record
is selected, and the Transportation Data Button is displayed (see Figure 18). This button
facilitates access to the roadway data form, which displays table information to the user.
Figure 18. The Transportation Data Button
Important Buttons
One button on the Main Button Pad is important to the access of Iowa DOT Road Data.
This is the ‘Information’ button. This button is highlighted in Figure 19.
Figure 19. Important Buttons for Accessing Transportation Data
Zoom In
View Entire Map
Activate Theme Mapper
Activate Layer Control
Find Zip Code
Find County
Data Aggregation
Zoom Out
Pan Map
Show Legend Window
Information
Find Township
Find City
Show M.A.P Database Button Pad
Exit IMIS
Infrastructure Management Information System – User Manual
Page 20
The Information Button
Clicking this button enables the Information Tool. Use this tool to select specific map
features and retrieve any attributes linked to the feature. This is the basic tool used to access
each IMIS database.
Access and Display of Road Data
The following section details an example workflow for accessing roadway information using
the IMIS environment. For this example, information is sought regarding the traffic volume
of East Main Street in Decorah. It is assumed that the location of East Main Street in
Decorah is known.
Step 1. Zoom to Decorah.
With IMIS started, activate the Find by City Dialog by clicking on the ‘Find by City’ button
of the Main Button Pad.
Step 2. Click on ‘Decorah’ and Press ‘OK’.
Step 3. Activate the Information Tool by clicking the ‘Information Tool Button’.
Infrastructure Management Information System – User Manual
Page 21
Step 4. Click on the desired section of Main Street with the Information Tool.
Step 5. Click on the ‘Transportation Data’ button when the data are loaded.
Step 6. View traffic volume on Transportation Data Form.
Infrastructure Management Information System – User Manual
Page 22
The form shows information for the section of East Main Street in Decorah. Information
displayed includes average daily traffic volume (highlighted), surface width, number of
lanes, and speed limit.
Infrastructure Management Information System – User Manual
Page 23
OTHER IMIS FEATURES
While IMIS is designed primarily for the access and analysis of data specific to infrastructure
management decisions, IMIS has the capability of incorporating other databases. This can be
performed because IMIS is acting as a ‘front-end’ to the Mapinfo Desktop Mapping package.
This means that IMIS can open and display other databases stored in a Mapinfo table format.
Tables are opened within IMIS in the same manner as Mapinfo would open a table.
Figure 20 shows the Mapinfo File commands located in the IMIS menu bar.
Figure 20. The IMIS Menu Bar File Commands
In addition, tables are added to the map window using the layer control. Mapinfo’s Info
Tool is provided as a way to access and analyze other data that is not part of the IMIS
environment.
User Note: Do not confuse the Information Tool of IMIS with the Info Tool of Mapinfo.
The Info Tool is used to access Mapinfo databases added to IMIS, while the Information
Tool is used to access data built into IMIS, such as the census and water supply databases.
These tools are placed on separate button pads to minimize confusion.
Important Buttons
The Mapinfo Tools Button Pad contains both the tools necessary for accessing databases not
part of the IMIS environment. These are the ‘Select Tool’ and ‘Info Tool’ buttons of the
Mapinfo software. These buttons are provided only for the access of data not originally part
of the IMIS environment.
Figure 21. The Mapinfo Tools Button Pad
Select Tool
Info Tool
The Select Tool Button
Use this button to select and de-select map features brought into the IMIS environment from
an outside source.
Infrastructure Management Information System – User Manual
Page 24
The Info Tool Button
Use this button to query individual map feature attributes. When a feature is selected, the
Info Tool Box containing the attributes is displayed. If the Info Tool selects more than one
feature, the Info Tool Box will provide a list of selection choices to the user. Figure 22
shows the Info Tool Box containing attribute data.
Figure 22. The Info Tool Box
Performing Database Queries in IMIS
To query a database for particular attribute-values, follow normal Mapinfo procedures for
building queries. Access Mapinfo’s ‘Select’ and ‘SQL Select’ commands from the IMIS
menu bar (see Figure 23).
Figure 23. IMIS Menu Bar Query Commands
Use the ‘Layer Control’ to add queries to the map window. Once, a query result is in the
map window, use the Mapinfo tools from the previous section to get information from the
map window.
Infrastructure Management Information System – User Manual
Page 25
Example of IMIS Mapinfo Query
The following section is a detailed example of how to perform a Mapinfo query in the IMIS
environment. For this example, all primary roads having a traffic-count greater than 5000
will be queried and added to the map window as a separate layer.
Step 1. Activate the Mapinfo Select Dialog.
Using the mouse, click on the ‘Select’ part of the ‘Query’ menu bar.
Step 2. Set the map layer to query in the ‘Select’ box.
For this example, the ‘demo_primary’ layer is the layer containing primary road traffic-count
data.
Step 3. Select which column in the primary road database to query.
Click the ‘Assist’ button to view all columns available for querying.
Infrastructure Management Information System – User Manual
Page 26
Using the mouse, pull down the ‘Columns’ listbox and select the ‘AADT’ field. The AADT
field represents the average annual daily traffic of the roadway. The ‘AADT’ field name will
appear in the ‘Type an Expression:’ textbox.
Step 4. Type an expression to define the criteria for which primary segments are selected.
For this example type ‘> 5000’ next to ‘AADT’ in the ‘Type an Expression:’ textbox. Click
the ‘OK’ button when finished.
User Note: The ‘Operators’ listbox can also be used to enter the ‘>’ symbol in the ‘Type an
Expression:’ textbox.
Step 5. Press the ‘OK’ button on the ‘Select’ dialog box.
Infrastructure Management Information System – User Manual
Page 27
This will query the primary road database and save the query in the default table named
‘Query1’. To change the name of the query, highlight ‘Selection’ in the ‘Store Results in
Table:’ box, and replace with another user-defined name. For this example, ‘QueryRoads’
was chosen as the name of the query table.
Step 6. Add the ‘QueryRoads’ layer to the map window using the layer control.
The roads fitting the query criteria will appear in red in the map window.
Infrastructure Management Information System – User Manual
Page 28