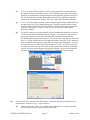
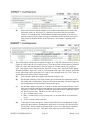
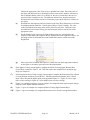
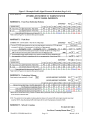
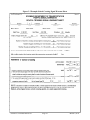
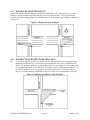
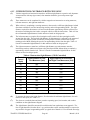
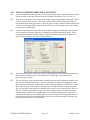
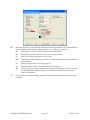
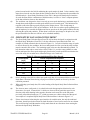
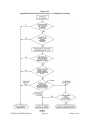
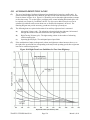
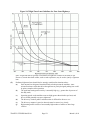
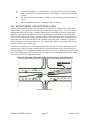
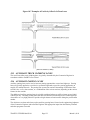
1
WYDOT
TRAFFIC STUDIES MANUAL
March 2011
WYDOT TRAFFIC STUDIES MANUAL
MARCH 2011
TABLE OF CONTENTS
CHAPTER 1 – INTRODUCTION ............................................................................................................................ 1
PURPOSE .............................................................................................................................................................. 1
AUTHORITY ........................................................................................................................................................ 1
SCOPE .................................................................................................................................................................. 1
BACKGROUND ................................................................................................................................................... 1
1.
DISTRIBUTION....................................................................................................................................... 1
1.1
ADDITIONAL COPIES ........................................................................................................................... 2
2.
REVISIONS AND ADDITIONS ............................................................................................................. 2
3.
FORMS ACCESS ..................................................................................................................................... 2
CHAPTER 2 – TRAFFIC SIGNAL STUDY PROCEDURE ................................................................................... 3
2.1
PURPOSE ................................................................................................................................................. 3
2.2
LEARNING OF THE CONCERN ........................................................................................................... 3
2.3
OBSERVATION OF CONCERN SYMPTOMS ..................................................................................... 3
2.4
ESTABLISHING BASIC AREAS OF CONCERN ................................................................................. 4
2.4.1
VEHICLE ............................................................................................................................................. 4
2.4.2
PEDESTRIAN ...................................................................................................................................... 4
2.4.3
CRASHES............................................................................................................................................. 5
2.5
DATA COLLECTION, REDUCTION AND SUMMARIZATION ........................................................ 5
2.6
DATA ANALYSIS AND INTERPRETATION ...................................................................................... 6
2.7
PREPARATION AND APPROVAL OF STUDY REPORT ................................................................... 6
2.8
DEVELOPMENT OF NEW TRAFFIC SIGNAL DESIGN .................................................................... 7
2.9
TRAFFIC SIGNAL RECONNAISSANCE REPORT ............................................................................. 9
2.10
IMPLEMENTATION ............................................................................................................................... 9
CHAPTER 3 – TRAFFIC SIGNAL WARRANT ANALYSIS .............................................................................. 11
3.1
PURPOSE ............................................................................................................................................... 11
3.2
TRAFFIC SIGNAL WARRANT ANALYSIS....................................................................................... 11
3.3
APPLICATION OF REDUCED (70%) WARRANT CRITERIA ......................................................... 12
3.4
APPROACH LANES ............................................................................................................................. 12
3.5
VOLUMES ............................................................................................................................................. 13
3.6
PRELIMINARY SCREENING .............................................................................................................. 14
3.7
TRAFFIC SIGNAL WARRANTS WORKSHEET................................................................................ 15
3.8
WARRANT 1, EIGHT HOUR VEHICULAR VOLUME ..................................................................... 28
3.9
WARRANT 2, FOUR-HOUR VEHICULAR VOLUMES .................................................................... 28
3.10
WARRANT 3, PEAK HOUR................................................................................................................. 28
3.11
WARRANT 4, PEDESTRIAN VOLUME ............................................................................................. 28
3.12
WARRANT 5, SCHOOL CROSSING ................................................................................................... 28
TRAFFIC STUDIES MANUAL
Page i
March 9, 2011
3.13
WARRANT 6, COORDINATED SIGNAL SYSTEM .......................................................................... 28
3.14
WARRANT 7, CRASH EXPERIENCE ................................................................................................. 29
3.15
WARRANT 8, ROADWAY NETWORK.............................................................................................. 29
3.16
WARRANT 9, INTERSECTION NEAR A GRADE CROSSING........................................................ 29
CHAPTER 4 – TURNING MOVEMENT COUNT ................................................................................................ 31
4.1
PURPOSE ............................................................................................................................................... 31
4.2
MANUAL TURNING MOVEMENT COUNT ..................................................................................... 31
4.3
AUTOMATED TURNING MOVEMENT COUNT.............................................................................. 31
CHAPTER 5 – CONDITION DIAGRAM .............................................................................................................. 33
5.1
PURPOSE .............................................................................................................................................. 33
5.2
COMPLETING THE CONDITION DIAGRAM ................................................................................... 33
CHAPTER 6 –SIGHT DISTANCE STUDIES........................................................................................................ 35
6.1
PURPOSE .............................................................................................................................................. 35
6.2
INTERSECTION SIGHT DISTANCE .................................................................................................. 35
6.2.1
APPROACH SIGHT TRIANGLES ................................................................................................... 35
6.2.2
DEPARTURE SIGHT TRIANGLES ................................................................................................. 36
6.2.3
OBSTRUCTIONS WITHIN SIGHT TRIANGLES ........................................................................... 36
6.3
SIGHT DISTANCE STUDY METHODS ............................................................................................. 37
6.3.1
UNCONTROLLED INTERSECTIONS ............................................................................................ 38
6.3.2
INTERSECTIONS CONTROLLED WITH STOP SIGNS ............................................................... 40
6.3.3
STOPPING SIGHT DISTANCE ........................................................................................................ 41
CHAPTER 7 – CRASH STUDY ............................................................................................................................. 43
7.1
PURPOSE ............................................................................................................................................... 43
7.2
COLLISION DIAGRAM ....................................................................................................................... 43
7.3
CRASH LISTING ................................................................................................................................... 43
CHAPTER 8 – STOP SIGN DELAY STUDY........................................................................................................ 47
8.1
PURPOSE ............................................................................................................................................... 47
8.2
STOP SIGN DELAY STUDY................................................................................................................ 47
8.3
FIELD OBSERVATION ........................................................................................................................ 47
CHAPTER 9 – PEDESTRIAN GAP STUDY ......................................................................................................... 49
9.1
PURPOSE ............................................................................................................................................... 49
9.2
PEDESTRIAN GAP STUDY FORM..................................................................................................... 49
9.3
PEDESTRIAN GROUP SIZE SURVEY ............................................................................................... 49
9.4
MINIMUM ADEQUATE GAP .............................................................................................................. 50
9.5
MEASURING GAP SIZES .................................................................................................................... 52
9.5.1
MULTI-DIRECTION GAP STUDY .................................................................................................. 52
9.5.2
TOTAL (COMBINED DIRECTION) GAP STUDY ......................................................................... 54
9.5.3
AVAILABLE GAP SURVEY ............................................................................................................ 57
TRAFFIC STUDIES MANUAL
Page ii
March 9, 2011
CHAPTER 10 – SIGNAL OPERATIONS STUDIES............................................................................................. 59
10.1
PURPOSE ............................................................................................................................................... 59
10.2
CONTROLLER PHASING .................................................................................................................... 59
10.3
LEFT-TURN OPERATION ................................................................................................................... 60
10.4
LEFT-TURN PHASING CRITERIA ..................................................................................................... 60
10.5
PROTECTED/PERMISSIVE LEFT-TURN PHASE CONTROL ......................................................... 61
10.6
PEDESTRIAN PHASES ........................................................................................................................ 61
10.7
PEDESTRIAN CROSSING DISTANCE MEASUREMENT ............................................................... 61
10.8
PRETIMED VERSUS ACTUATED CONTROL .................................................................................. 62
10.8.1 PRETIMED CONTROL ..................................................................................................................... 64
10.8.2 SEMI-ACTUATED CONTROL ........................................................................................................ 64
10.8.3 FULLY-ACTUATED CONTROL ..................................................................................................... 64
10.9
ISOLATED VERSUS SYSTEM OPERATION .................................................................................... 64
10.10
USE OF FLASHING OPERATION....................................................................................................... 64
10.11
OPERATIONAL REVIEWS .................................................................................................................. 65
10.11.1 SIGNALIZED INTERSECTION CHECKLIST ................................................................................ 65
10.11.2 LEFT-TURN PHASE OPERATIONAL REVIEW ............................................................................ 65
CHAPTER 11 – CURVE ADVISORY SPEED STUDY ........................................................................................ 69
11.1
PURPOSE ............................................................................................................................................... 69
11.2
USE OF THE DESIGN SPEED EQUATION ........................................................................................ 70
11.3
BALL-BANK INDICATOR METHOD ................................................................................................ 71
11.4
ESTABLISHING CURVE ADVISORY SPEEDS ................................................................................ 74
11.5
USE OF CURVE ADVISORY SPEED STUDY FORM ....................................................................... 75
11.6
TRUCK ADVISORY SPEEDS .............................................................................................................. 77
CHAPTER 12 – NO-PASSING ZONE STUDY ..................................................................................................... 79
12.1
PURPOSE ............................................................................................................................................... 79
12.2
NO-PASSING ZONE CRITERIA .......................................................................................................... 79
12.3
ESTABLISHING NO-PASSING ZONES ............................................................................................. 80
12.4
RANGE TRACKING ............................................................................................................................. 81
12.5
ONE VEHICLE METHOD .................................................................................................................... 82
CHAPTER 13 – SPEED STUDIES ......................................................................................................................... 85
13.1
PURPOSE ............................................................................................................................................... 85
13.2
SPEED STUDY DATA COLLECTION ................................................................................................ 85
13.3
SPEED STUDY DATA COLLECTION SHEET................................................................................... 86
13.4
SPEED STUDY WORKSHEET ............................................................................................................ 89
13.5
DETERMINATION OF APPROPRIATE SPEED LIMIT .................................................................... 93
13.6
DECLARATION OF SPEED LIMIT ..................................................................................................... 94
13.7
MINIMUM SPEED LIMITS .................................................................................................................. 94
TRAFFIC STUDIES MANUAL
Page iii
March 9, 2011
CHAPTER 14 – TRAVEL TIME AND DELAY STUDY ..................................................................................... 97
14.1
PURPOSE ............................................................................................................................................... 97
14.2
DEFINITIONS ........................................................................................................................................ 97
14.3
STUDY PROCEDURES ........................................................................................................................ 99
14.4
COLLECTING THE DATA ................................................................................................................. 101
14.5
ANALYSIS ........................................................................................................................................... 102
CHAPTER 15 – HIGHWAY LIGHTING STUDIES ........................................................................................... 105
15.1
PURPOSE ............................................................................................................................................. 105
15.2
LIGHTING WARRANTS .................................................................................................................... 105
15.2.1 CONTINUOUS FREEWAY LIGHTING ........................................................................................ 105
15.2.2 COMPLETE INTERCHANGE LIGHTING .................................................................................... 106
15.2.3 PARTIAL INTERCHANGE LIGHTING ........................................................................................ 106
15.2.4 NON-FREEWAY LIGHTING ......................................................................................................... 107
CHAPTER 16 – TRAFFIC SIGNAL REMOVAL STUDY ................................................................................. 109
16.1
PURPOSE ............................................................................................................................................. 109
16.2
STAGE 1 – PRELIMINARY SCREENING ........................................................................................ 109
16.2.1 SIGHT DISTANCE .......................................................................................................................... 111
16.2.2 SPECIAL SITE CONSIDERATIONS ............................................................................................. 111
16.2.3 WARRANTS .................................................................................................................................... 112
16.2.4 SPECIAL JUSTIFICATIONS .......................................................................................................... 112
16.3
STAGE 2 – DETAILED REMOVAL ANALYSIS.............................................................................. 112
16.3.1 EXPECTED INFLUENCE ON CRASHES ..................................................................................... 113
16.3.2 EXPECTED TRAFFIC FLOW RELATED IMPACTS ................................................................... 115
16.3.3 JURISDICTION-RELATED COSTS............................................................................................... 117
16.3.4 CANVAS PUBLIC OPPOSITION ................................................................................................... 117
16.3.5 SIGNAL REMOVAL DECISION.................................................................................................... 118
16.4
INTERSECTION CONTROL ALTERNATIVES ............................................................................... 118
16.4.1 TWO-WAY STOP CONTROL (TWSC) ......................................................................................... 118
16.4.2 ALL-WAY STOP CONTROL (AWSC) .......................................................................................... 118
16.4.3 ROUNDABOUT CONTROL ........................................................................................................... 118
16.5
REMOVAL PROCEDURE .................................................................................................................. 119
16.5.1 PUBLIC NOTIFICATION ............................................................................................................... 119
16.5.2 INSTALL INTERIM CONTROL .................................................................................................... 119
16.5.3 MONITOR CRASHES ..................................................................................................................... 120
SIGNAL REMOVAL ANALYSIS WORKSHEETS ........................................................................................ 121
STAGE 1 – INTERSECTION INVENTORY ................................................................................................... 121
STAGE 2 – PRELIMINARY SCREENING ..................................................................................................... 121
STAGE 3 – DETAILED ANALYSIS, TWO-WAY STOP CONTROL ........................................................... 122
TRAFFIC STUDIES MANUAL
Page iv
March 9, 2011
STAGE 3.1 – EXPECTED INFLUENCE ON CRASHES............................................................................ 122
STAGE 3.2 – EXPECTED TRAFFIC FLOW-RELATED IMPACTS ......................................................... 122
STAGE 3.3 – JURISDICTION-RELATED COSTS ..................................................................................... 125
STAGE 3.4 – ANTICIPATED STRENGTH OF OPPOSITION/SUPPORT FOR SIGNAL REMOVAL... 126
STAGE 3.5 – FINAL DECISION ................................................................................................................. 126
CHAPTER 17 – PREEMPTION – This chapter is under development ................................................................ 145
CHAPTER 18 – AUXILIARY LANE AND TRAFFIC IMPACT STUDIES ...................................................... 147
18.1
PURPOSE ............................................................................................................................................. 147
18.2
AUXILIARY LEFT-TURN LANES .................................................................................................... 147
18.2.1 RURAL GUIDELINES .................................................................................................................... 147
18.2.2 URBAN AND FRINGE AREA GUIDELINES ............................................................................... 148
18.3
AUXILIARY RIGHT-TURN LANES ................................................................................................. 150
18.4
OFFSET RIGHT- AND LEFT-TURN LANES ................................................................................... 152
18.5
AUXILIARY TRUCK CLIMBING LANES ....................................................................................... 153
18.6
AUXILIARY PASSING LANES ......................................................................................................... 153
18.7
AUXILIARY RIGHT-TURN ACCELERATION LANES.................................................................. 154
18.8
REVIEW OF TRAFFIC IMPACT STUDY REPORTS ....................................................................... 154
TRAFFIC STUDIES MANUAL
Page v
March 9, 2011
(This page intentionally left blank)
TRAFFIC STUDIES MANUAL
Page vi
March 9, 2011
CHAPTER 1 – INTRODUCTION
PURPOSE
This manual will be used to establish minimum standards for conducting traffic engineering studies on
roads under the jurisdiction of the Wyoming Department of Transportation (WYDOT). In addition, local
governmental agencies are recommended and encouraged to use the Traffic Studies Manual as a guideline
in conducting traffic engineering studies within their area of responsibility.
AUTHORITY
Federal Code of Regulations, 23 CFR 655.603; Wyoming Statute 31-5-112; Manual on Uniform Traffic
Control Devices for Streets and Highways, 2009 Edition (MUTCD); Wyoming Department of
Transportation Operating Policy, Policy Number 25-1.
SCOPE
This manual affects the WYDOT Traffic Program, WYDOT District Traffic Offices, WYDOT Planning
Program, and anyone else who performs traffic studies on the state highway system in Wyoming.
BACKGROUND
Section 1A.09 of the MUTCD recommends that early in the processes of location and design of roads and
streets, engineers should coordinate such location and design with the design and placement of the traffic
control devices to be used with such roads and streets. The decision to use a particular device at a
particular location should typically be made on the basis on an engineering study or the application of
engineering judgment. The MUTCD requires that an engineering study shall be performed by an
engineer, or by an individual working under the supervision of an engineer, through the application of
procedures and criteria established by the engineer. An engineering study shall be documented.
This manual will provide a more efficient, standardized process for compiling and analyzing data
collected during traffic engineering study activities. This manual will serve as a basic tool for district
traffic operations studies and as a guideline for local agencies in Wyoming.
This manual will constitute the minimum standards for use in conducting traffic engineering studies on
state highways in Wyoming. The manual’s chapters and data collection sheets are not shown in any
particular order. Accordingly, sections applicable to a specific situation or concern should be considered
on an individual basis.
District Traffic Engineers should ensure that studies performed by their staff or by consultants conform,
as a minimum, to the practices and techniques prescribed by this manual and shall incorporate the manual
by reference in consultant contract documents.
This manual was originally based on the organization and format of the Florida Department of
Transportation’s Manual on Uniform Traffic Studies (FDOT Manual Number 750-020-007), January
2000 (as revised March 2003). Copies of the original Florida manual can be purchased from Florida
Department of Transportation, Maps and Publications, 605 Suwannee Street, Mail Station 12,
Tallahassee, Florida 32399-0450, Phone (850) 414-4050, Fax (850) 487-4099. This Wyoming adaptation
of that manual has significantly modified the original manual.
1.
DISTRIBUTION
The official recipients of this manual will be the District Traffic Engineers, District Traffic Technicians,
Traffic Program managers and staff.
TRAFFIC STUDIES MANUAL
Page 1
March 9, 2011
1.1
ADDITIONAL COPIES
Consultants and other public users may request copies of the manual from Wyoming Department of
Transportation Traffic Program, 5300 Bishop Blvd., Cheyenne, WY 82009. Phone (307) 777-4491;
Fax (307) 777-3993.
2.
REVISIONS AND ADDITIONS
(1)
The State Traffic Engineer, both Assistant State Traffic Engineers, District Traffic Engineers and
the Traffic Studies Engineer will constitute the Manual Review Committee.
(2)
The Traffic Studies Engineer will periodically review, amend, or revise the manual to ensure its
compatibility with current technology and state-of-the-art methods and practices.
(3)
Comments or suggestions for improving the manual may be submitted in writing to the Traffic
Studies Engineer, 5300 Bishop Blvd., Bldg. 6101, Cheyenne, WY 82009, along with appropriate
supporting information or data. Any time a revision is initiated by the Traffic Studies Engineer,
comments will be solicited from the District Traffic Engineers and any other affected offices.
Their concerns, when appropriate, will be incorporated into the revision.
(4)
Substantive revisions, as determined by the Manual Review Committee, will be approved by the
State Traffic Engineer following the process established in the Standard Operating Policy.
3.
FORMS ACCESS
We have standardized all of the forms in this manual and they are available in the Forms Library.
Reproducible copies of all of the forms are in the Appendix.
•
•
•
•
•
•
•
•
•
•
•
•
•
•
Form TR-01 – Traffic Signal Warrants Worksheet (Excel Spreadsheet)
Form TR-01a – School Crossing Warrant Sheet (Excel Spreadsheet)
Form TR-01b – Intersection Near a Grade Crossing Warrant Sheet (Excel Spreadsheet)
Form TR-03 – Signal Removal Analysis Worksheet
Form TR-04 – Worksheet for Estimating Daily Impacts of Signal Removal and Replacement
by Two-Way Stop
Form TR-10 – Speed Study Data Collection Sheet
Form TR-11 – Speed Study Worksheet (Excel Spreadsheet)
Form TR-12 – Pedestrian Gap Study
Form TR-16 – Curve Advisory Speed Study
Form TR-17 – Rural Intersection Lighting Criteria
Form TR-18 – Operational Review Signalized Intersection Checklist
Form TR-19 – Left Turn Phase Operational Review
Form TR-22 – PC-Travel Field Worksheet
Form TR-25 – Traffic Impact Study Review Checklist
TRAFFIC STUDIES MANUAL
Page 2
March 9, 2011
CHAPTER 2 – TRAFFIC SIGNAL STUDY PROCEDURE
2.1
PURPOSE
(1)
The purpose of this chapter is to present to the traffic engineer a guide for conducting
comprehensive traffic signal studies. The information, techniques, and instructions presented
herein were formulated from the MUTCD and experiences of practicing traffic engineers.
(2)
This manual is not all-inclusive in addressing traffic signal study situations; rather, it is a general
guide for the traffic engineer to follow while investigating conditions and circumstances
regarding the installation of a new traffic signal or improvement of the operation of an existing
traffic signal. This manual will begin with an alleged problem concerning traffic control at a
particular location. The observation of the symptoms, establishment of areas of concern,
collection and analysis of data, and preparation of a traffic signal study report will be outlined in
subsequent chapters.
(3)
This chapter provides a logical and systematic data collection procedure for investigating traffic
signal requirements which allows the traffic engineer to use judgment to analyze local conditions
and interpret data as effectively and efficiently as possible with the resources available. By
following this chapter it is intended to minimize the collection of unnecessary or inappropriate
data and/or to reduce the number of trips to the field to collect additional data.
2.2
LEARNING OF THE CONCERN
(1)
The problem facing traffic engineers at this point has yet to be defined. This is the stage during
which the traffic engineer receives notice from the public, a civic organization, business, etc.,
regarding their desire or need for a traffic signal to be installed or modified at a given site. Often,
the traffic engineer or one of his/her staff has observed the situation, or another governmental
agency has brought it to their attention.
(2)
Regardless of the source, the traffic engineer is obligated to respond. However, to respond in a
professional manner requires some systematic investigation of the situation. Before a full scale
investigation is launched requiring a large amount of manpower and equipment, the traffic
engineer should conduct an observation of the site. If a great deal of delay is encountered, the
engineer should contact the reporting party about the action to be initiated.
2.3
OBSERVATION OF CONCERN SYMPTOMS
(1)
During the initial observation or field investigation of the site, a number of items should be noted.
The preparation of a condition diagram (Chapter 5) should be made at this time if none exists for
the site. The condition diagram shows the location of traffic control devices, intersection
geometry, and other physical features. If the engineer has an existing condition diagram, it
should be updated if necessary. Note that it is not necessary for this diagram to be drawn to scale.
(2)
In addition to preparing a condition diagram, the engineer should observe the operational
characteristics of the location and note any unusual or significant circumstances. Ideally, this
observation should be made during the hours of the day when the operational concerns were
reported to have occurred. Photographs of each approach often save subsequent trips back to the
study location.
(3)
With an understanding of the operation and a representation of conditions at the location, the
engineer is in a position to determine if a real problem exists or no further investigation is
warranted. If it is decided after the field investigation that no problem exists, the engineer should
respond either in writing or verbally to that person responsible for the initial contact regarding the
site. However, should it be determined that further investigation is warranted, the engineer
should continue the investigation. At this point, the engineer should notify the concerned
TRAFFIC STUDIES MANUAL
Page 3
March 9, 2011
party(ies) of his/her intention to investigate the site for possible signalization and inform them of
an approximate completion date.
2.4
ESTABLISHING BASIC AREAS OF CONCERN
(1)
Establishing the basic area(s) of concern draws a great deal from the traffic engineer’s experience
and judgment. Some cases can be easily diagnosed, such as excessive vehicle delays. Other
cases are more subtle in nature. Of course, the issue under consideration may be the result of
more than one basic area of concern.
(2)
Decisions made by the traffic engineer at this point will provide the basis for data collection
efforts to be made during the investigation. The areas of concern can be grouped into three basic
categories: vehicle, pedestrian, and crashes and are addressed in this section. Warrants for signal
installation, taken from the MUTCD, will be correlated with the studies indicated. This manual
will be of assistance in conducting many of the studies indicated as we have noted the appropriate
chapter or section.
2.4.1 VEHICLE
(1)
A vehicle problem can normally be diagnosed during the field observation without great
difficulty. Some of these characteristics are: excessive queue lengths, slow queue dissipation
rates, and/or large traffic volumes using the intersection, etc.
(2)
Typically, the data collected to determine the extent of a vehicle problem includes one or more of
the following:
(a)
Hourly approach volumes – from the turning movement count (Chapter 4) – for the
highest 8 hours of an average day, as required for MUTCD Warrants 1 – 5 and 7 – 9
(MUTCD Sections 4C.02 – 4C.06 and 4C.08 – 4C.10)
(b)
(c)
Stop sign delay study (Chapter 8)
(d)
Determination – from the condition diagram (Chapter 5) – of the clear storage distance as
required for MUTCD Warrant 9 (MUTCD Section 4C.10)
(e)
Travel time and delay study (Chapter 14)
Verification – from the condition diagram (Chapter 5) – that the distance to the nearest
signal in each direction is greater than 1000 feet as required for MUTCD Warrant 6
(MUTCD Section 4C.07), and the location meets the recommended signal spacing in
WYDOT’s access policy (see Chapter II of the WYDOT Access Manual).
2.4.2 PEDESTRIAN
(1)
A pedestrian problem can also be diagnosed through field observation. However, the severity of
this problem is difficult to ascertain without field data collection.
(2)
The types of data which may be needed for this investigation are summarized below:
(a)
Turning movement count (Chapter 4), that includes hourly approach volumes for the
highest 8 hours of an average day as required for MUTCD Warrants 1, 2, 3 and 8, and
pedestrian volumes, as required for MUTCD Warrants 4 and 5
(b)
(c)
Pedestrian gap study (Chapter 9) as required for MUTCD Warrants 4 and 5
(d)
Characteristics of pedestrians such as age, disability, average walking speed, etc.
Verification – from the condition diagram (Chapter 5) – that the distance to nearest
crosswalk, or signalized intersection is greater than 300 feet as required for MUTCD
Warrants 4 and 5
TRAFFIC STUDIES MANUAL
Page 4
March 9, 2011
2.4.3 CRASHES
(1)
The determination of an intersection’s crash potential during a short field observation is difficult.
Some obvious features of a high crash location may be damaged sign supports or excessive tire
skid marks; however, the number of crashes is not normally shown by the previous features. The
quickest and cheapest method of determining if crashes are a problem (e.g., significantly higher
than average for similar intersections), is to review past crash records for a minimum of three but
preferably five years. Crashes many times can also be related to the previously described
problems of vehicle and pedestrian delay, yet poor geometric design may be the overriding factor.
(2)
The following information can be used to further define a crash problem:
(a)
Hourly approach volumes and pedestrian volumes – from the turning movement count
(Chapter 4) – for the highest 8 hours of an average day, as required for MUTCD Warrants
1 – 5 and 7 – 9
(b)
(c)
(d)
(e)
(f)
(g)
(h)
(i)
(j)
(k)
Crash records/rates as required for MUTCD Warrant 7
Collision diagram (Chapter 7)
Speed study (Chapter 13) may be required for MUTCD Warrants 1-4 and 7
Intersection sight distances (Chapter 6)
Geometrics: vertical and horizontal
Pavement condition for skid resistance
Roadside hazards
Existing positive guidance through signing and marking
Existing highway lighting
Traffic conflict investigation and analysis
(3)
This list of data to be collected for each of the three basic areas of concern is neither all inclusive
nor suggested as a minimum effort. Keep in mind that data is required for justification (warrant
analysis) and other data is required for design and operation. Data for justification; however, is
not mutually exclusive of the data required for design and operation.
(4)
The engineer should not attempt to collect any of the data elements listed unless he is certain it
will ultimately be required for the study. In fact, certain elements should not be collected until
others have been reviewed. For example, hourly approach volumes (preferably fifteen minute
volumes) should be counted for analysis of traffic signal warrants, which is generally necessary
for each of the three areas of concern. Once the warrant analysis has been completed and the
problem(s) has been identified (and before any turning volumes are counted), the machine counts
should also be examined carefully to determine the control periods of interest. These periods of
interest are the peak and off-peak periods for which the various signal operation plans will be
designed.
2.5
DATA COLLECTION, REDUCTION AND SUMMARIZATION
Conducting the previously mentioned studies generates a large volume of data. The study sheets and
techniques available in this manual are designed to allow for use as field collection sheets, reduction
sheets, and summary sheets, thus reducing the amount of paperwork and time required to finalize field
work (A convenient manner in which to summarize and thus facilitate interpretation of the data required
for the MUTCD signal warrants is to complete the Traffic Signal Warrants worksheet, Form TR-01, in
Chapter 3). For more information regarding data collection, reduction, and summarization see the
individual chapters contained herein.
TRAFFIC STUDIES MANUAL
Page 5
March 9, 2011
2.6
DATA ANALYSIS AND INTERPRETATION
(1)
Once the appropriate data for the warrant analysis has been collected, it is the traffic engineer’s
responsibility to analyze and interpret it.
(2)
Application of the Traffic Signal Warrants worksheet can be made in a straightforward manner
and provides the traffic engineer with information concerning the minimum conditions for
justifying signal installation. Instructions for use of the Traffic Signal Warrants worksheet (Form
TR-01) are included in Chapter 3.
(3)
Further explanation of the individual warrants can be found in Part 4 of the MUTCD.
(4)
Engineering judgment plays an important role in the decision to signalize an intersection. The
traffic engineers need a thorough knowledge and understanding of any local conditions which
may or may not support the need for signalization. Situations may arise when a traffic signal is
best not installed even though one of the eight warrants may be met. Such a condition may exist
when minimum traffic volumes are present at a location, but signalization would severely
interrupt mainline movement to serve a relatively small side street movement. Some additional
considerations should be made by the engineer when minimum warrants have been met to insure
that installation of a signal does not create a greater problem. These considerations include, but
are not limited to the following:
(a)
Development of excessive queues on the major street
(b)
Queue dissipation rates
(c)
Spacing between adjacent signalized intersections
(d)
Highway and intersection geometry (turn lanes)
(e)
Distance to pedestrian crossings and distance pedestrians have to cross
(5)
Conversely, local conditions may, on rare occasions, dictate installation of a signal when the
minimum volume warrants are not met for the required eight hours. An example of this situation
is the entrance to a plant or office complex which generates sufficient traffic such as work trips,
to meet volume warrant criteria for several hours of the day (but less than the full eight hours) for
at least each weekday. These locations should be designed with an operation plan which may
include flashing operation during hours when full signal control is not justified. See Warrants 2
and 3 (Sections 3.9 and 3.10) in Chapter 3.
(6)
It is very important to note that even when a traffic signal is justified (e.g., it satisfies one or more
warrants), it may not contribute to the safety and efficiency of the roadway. Closely spaced
intersections in high volume corridors could all meet volume warrants, but signals are not
desirable at every cross street. Signals can be poorly designed, ineffectively placed, improperly
operated, and poorly maintained. Any of these conditions can negate the benefits intended by the
traffic signal installation. The traffic engineer should also be increasingly aware of energy
conservation and include these thoughts when signalization is considered.
2.7
PREPARATION AND APPROVAL OF STUDY REPORT
(1)
Proper documentation of all activities that have taken place from the initial allegation of a
problem through the warrant analysis is extremely important. A traffic signal study report which
includes the following elements (as needed) should be prepared:
(a)
(b)
(c)
(d)
Cover/Title page that is signed and sealed
Description and map of intersection being considered
Existing conditions and a diagram (sketch) – see Chapter 5
Crash analysis and Collision Diagram – see Chapter 7
TRAFFIC STUDIES MANUAL
Page 6
March 9, 2011
(e)
Warrant analysis – see Chapter 3
• Statement of use of 70 or 100 percent requirements
• Discussion of number of approach lanes used in the analysis
• Discussion of how right turns are considered in the analysis
• Analysis discussion of Warrants 1-9 (only those applicable)
• Discussion of delay study
• Discussion of capacity analysis with Synchro or HCS+
(f)
(g)
Recommendations (including sketch if applicable)
Supplemental information or data to be submitted (as appropriate)
• Completed Traffic Signal Warrants worksheets (Form TR-01)
• Turning movement counts for the existing intersection (8 hour - A.M., Noon and
P.M. peaks)
• Projected turning movement counts for the proposed intersection (A.M., Noon and
P.M. peaks) (if applicable)
• 24-hour machine counts
• Pedestrian counts (8 hours)
• Color photos of each approach
• Projected traffic data for new intersection (if applicable)
• Pertinent supplemental information if needed
• Computer program outputs
(2)
Guidelines for the content and format of this report are necessary to insure uniform report
preparation procedures and to expedite report review time.
(3)
The traffic signal study report should conclude one of the following: (1) no problem exists and
therefore no traffic signal is warranted; (2) a problem exists, but the solution is not a traffic
signal; (3) a problem exists and a traffic signal will correct or reduce the problem; or (4) a
problem exists and a traffic signal in conjunction with other improvements will correct or reduce
the problem.
(4)
In the first case, the traffic signal study should be terminated and the party initiating the request
should be notified. It may also be beneficial to disseminate further information explaining the
basis of the decision. In the second case, the traffic signal study should also be terminated,
another study (non-signal related) should be initiated to resolve the problem, and proper
notification should be given. In the third or fourth case, the study should be initiated to resolve
the problem, and proper notification should be given, also the study should be handed over to the
engineer(s) responsible for design. It is again advisable at this point to notify the party initiating
the request so that they are kept informed of the progress of the study.
2.8
DEVELOPMENT OF NEW TRAFFIC SIGNAL DESIGN
(1)
The design stage includes all activities that take place after justification of a new traffic signal
installation has been made or the modification of the operation of the existing signal is required.
These activities, which lead up to the traffic signal design reconnaissance report, include the
following:
(a)
(b)
(c)
(d)
(e)
Collect additional data (if needed)
Develop alternatives
Evaluate alternatives
Select “Best” alternative
Design improvement
TRAFFIC STUDIES MANUAL
Page 7
March 9, 2011
(2)
For the installation of a new traffic signal the additional data collection will generally be limited
to the turning volume counts for 15-minute time periods required for developing the signal
operating plan and controller timings. Data collected for the signal warrants are of course
available if needed. For modification of an existing signal the data available is often dated, so it
may also be necessary to collect some of the data elements outlined previously in addition to the
turning volumes. In any event it is advisable to develop alternative concepts prior to the
collection of additional data.
(3)
The alternative development, evaluation, and selection steps are significant steps in themselves
and are, therefore, only addressed in general terms in this manual. However, the basic approach
is presented in order to provide the user with guidelines necessary to properly conduct the traffic
signal study.
(4)
All reasonable alternative concepts should be considered by the engineer. These concepts should
then be screened based on any known constraints such as funding, future programmed
construction, etc. All of the alternatives determined to be feasible by the engineer should then be
evaluated using the optimization and simulation computer programs.
(5)
The first step is an isolated intersection analysis. Synchro is a valuable program with a Highway
Capacity Manual interface that can be used for design, analysis, and evaluation of isolated
intersections. By specifying appropriate commands and parameters, this program can select
optimal phase patterns and timings (cycle lengths and splits). Each alternative can be analyzed by
the measures of effectiveness included in the output reports. Several alternatives can also be
evaluated by comparative analysis to determine the best alternative. The Engineer of Record
should be responsible for any model result.
(a)
When modeling intersections using Synchro or HCS+, it is imperative that the factors
used in the analysis reflect actual Wyoming driving conditions. For example, the default
saturation flow rate should be set to 1600 vehicles per lane per hour of green. Field
observation of the traffic characteristics may be used to justify increasing the saturation
flow rate to 1700 where conditions indicate that driver behavior at the intersection is
more aggressive than the typical Wyoming intersection.
(b)
With the majority of intersections in Wyoming being located in relatively sparsely
populated areas, the traffic volumes can tend to fluctuate excessively throughout the day
and throughout the peak periods of the day. Therefore, when modeling intersections
using Synchro or HCS+, the actual peak hour factor for each movement should be used
for the analysis, rather than relying on the software’s default peak hour factors.
(6)
If the intersection is included in a linear arterial highway under study for progression, is part of a
grid network, or is part of an interchange with coordinated signals at each ramp terminal, a
Synchro analysis should be conducted. Synchro optimizes signal progression and is capable of
design and analysis of multiphase, actuated, as well as two phase, fixed time signal control.
(7)
It is advisable to examine all legitimate phasing patterns and determine the optimal cycle length
for an intersection regardless of whether it is isolated or part of a network. This may result in
significant time savings, because model output can be used to determine input values and ranges
necessary to run Synchro more effectively and more efficiently.
(8)
An economic analysis (cost effectiveness) should be conducted in conjunction with the computer
analyses and before proceeding to the implementation stage. Unfortunately, constraints beyond
the engineer’s control may sometimes not permit implementation of the best alternative.
(9)
Although input from the local agency is usually received through the traffic signal request, in all
cases the conceptual design should reflect any special needs or conditions the local agency
requires.
TRAFFIC STUDIES MANUAL
Page 8
March 9, 2011
2.9
TRAFFIC SIGNAL RECONNAISSANCE REPORT
(1)
Upon completion of the conceptual traffic signal design process, a design reconnaissance report
should be prepared. This report should include the following elements as a minimum:
(2)
(a)
(b)
(c)
(d)
All elements of the traffic signal study report (show report in the Appendix)
(e)
(f)
(g)
Recommendations of engineer
Additional data collected, if any
Description of alternatives
Description of analyses (including appropriate output from Synchro, SIDRA, VisSim or
HCS+)
Work to be performed
Approval of recommended concept
This report should be distributed to the State Traffic Engineer, both Assistant State Traffic
Engineers, Traffic Studies Engineer, District Traffic Engineer and Electrical Operations Engineer.
If the project involves geometric changes, such as ADA modifications, corner radii improvements
or the addition of turn lanes, the Highway Development Engineer should be included in the
distribution because Project Development will need to be involved with the geometric project
design and administration.
2.10 IMPLEMENTATION
(1)
Actual implementation of the improvement should take place as soon as possible after the traffic
signal study report and design reconnaissance report stages. Conditions change with time, and if
too much time lapses before implementation it may be necessary to repeat the entire traffic signal
study procedure. For this reason it is wise to plan traffic signal studies in close conjunction with
the State Transportation Improvement Program (STIP). If this is not done the result may be an
improvement that does not match the conditions at the site.
(2)
Following implementation, the engineer should always visit the site to determine if the traffic
signal is operating as designed. As a minimum, he should observe the operation during each
critical time period, keeping in mind the original concern and/or any other concerns identified in
the Traffic Signal Study Report. It is always a good idea to drive through the intersection from
all approaches and to make any critical turning maneuvers. The Operational Review Signalized
Intersection Checklist (Form TR-18) provides a convenient form on which to check each of the
signal components and note any concerns or deficiencies (see Chapter 10).
(3)
In some cases, data collection may be necessary to determine if and how well the improvement is
operating. This is particularly true for the after condition of a before and after study, where crash
data (Chapter 7), travel time and delay data (Chapter 14), etc., are required.
(4)
It is also advisable to follow through on the implementation of a traffic signal with an educational
program, preferably before any ground is broken, to increase public awareness of the change.
This should result in improved safety and efficiency during the transition, and it draws attention
to the traffic engineering activities, particularly safety and energy efficiency, that benefit the area.
TRAFFIC STUDIES MANUAL
Page 9
March 9, 2011
(This page intentionally left blank)
TRAFFIC STUDIES MANUAL
Page 10
March 9, 2011
CHAPTER 3 – TRAFFIC SIGNAL WARRANT ANALYSIS
3.1
PURPOSE
(1)
Section 4C.01 of the MUTCD requires that an engineering study of traffic conditions, pedestrian
characteristics, and physical characteristics of the location shall be performed to determine
whether installation of a traffic control signal is justified at a particular location.
(2)
This chapter provides a procedure to determine input into the decision of whether or not
conditions warrant the installation or the continued operation of a traffic signal.
3.2
TRAFFIC SIGNAL WARRANT ANALYSIS
(1)
The MUTCD requires that the investigation of the need for a traffic control signal shall include an
analysis of factors related to the existing operation and safety at the study location and the
potential to improve these conditions, and the applicable factors contained in the following traffic
signal warrants:
• Warrant 1, Eight-Hour Vehicular Volume
• Warrant 2, Four-Hour Vehicular Volume
• Warrant 3, Peak Hour
• Warrant 4, Pedestrian Volume
• Warrant 5, School Crossing
• Warrant 6, Coordinated Signal System
• Warrant 7, Crash Experience
• Warrant 8, Roadway Network
• Warrant 9, Intersection Near a Grade Crossing
(2)
Traffic signals should not be installed unless one or more of these nine warrants are satisfied.
Because these are minimum requirements, satisfaction of a traffic signal warrant or warrants shall
not in itself require the installation of a traffic control signal. Delay, congestion, crash
experience, confusion, or other evidence of the need for right-of-way assignment must be shown.
Geometric changes which may eliminate the need for a signal should be considered.
(3)
A warrant is a set of criteria which can be used to define the relative need for, and
appropriateness of, a particular traffic control device (i.e., STOP or YIELD sign, traffic signal,
etc.). Warrants are usually expressed in the form of numerical requirements such as the volume
of vehicular or pedestrian traffic. A warrant normally carries with it a means of assigning
priorities among several alternative choices. There are two fundamental concepts involved in this
determination:
(a)
The most effective traffic control device is that which is the least restrictive while still
accomplishing the intended purpose. For instance, geometric changes alone may negate
the need for a traffic signal.
(b)
Driver response to the influences of a traffic control device has been previously identified
by observation, field experience, and laboratory tests under a variety of traffic and driver
conditions.
(4)
Warrants should be viewed as guidelines, not as absolute values. Satisfaction of a warrant is not
a guarantee that the device is needed. The warrant analysis process is just one of the tools to be
used in determining if a traffic signal is warranted.
(5)
The application of warrants is effective only when combined with comprehensive analysis and
evaluation of available pertinent information, and the application of appropriate principles,
provisions, and practices as contained in the MUTCD and other sources, for the purpose of
deciding upon the applicability, design, operation, or installation of a traffic control device as
TRAFFIC STUDIES MANUAL
Page 11
March 9, 2011
noted in the definition of Engineering Study in Section 1A.13 of the MUTCD. In all cases, at
least one or more warrants must be fully met before a traffic signal installation is considered.
(6)
Most of the warrants have criteria associated with the number of approach lanes and reduced
criteria for rural and/or higher speed locations. Each traffic signal warrant analysis must
determine which criteria apply based on the number of lanes and whether or not the reduced
warrant criteria apply. Engineering judgment must be used to determine when to apply the
reduced criteria and the appropriate number of lanes to use for the warrant analysis.
3.3
APPLICATION OF REDUCED (70%) WARRANT CRITERIA
(1)
The MUTCD allows for the application of reduced (70%) traffic signal warrant criteria at certain
rural and/or higher speed locations. The application of the 70% criteria is applicable for
intersections that lie within the built-up area of an isolated community having a population of less
than 10,000, or where the posted or statutory speed limit or the 85th-percentile speed on the major
street exceeds 40 mph.
(2)
The application of the 70% criteria based on population only applies to communities in Wyoming
that do not currently have a signalized intersection (reduction based on speed may still apply). It
also does not apply to intersections lying outside the incorporated limits of a community, but
within the urban planning boundaries (typically within 3 miles, or otherwise as determined by the
Planning Program).
(3)
The application of the reduced warrant criteria based on speeds will be based on the posted speed
limit. If the speed limit is posted less than 40 mph, the reduced criteria do not apply based on
speeds (reduction based on population may still apply). If the posted speed limit is 45 mph or
greater, the reduced criteria applies. If the speed limit is posted at 40 mph, a spot speed study
(see Chapter 13) should be conducted at the intersection to determine whether or not the 85thpercentile speed is greater than 40 mph.
3.4
APPROACH LANES
(1)
Engineering judgment must be exercised in applying various traffic signal warrants to cases
where approaches consist of one lane plus one right or one left-turn lane. The site specific traffic
characteristics will dictate whether an approach should be considered as a one-lane approach or a
two-lane approach.
(2)
For a minor street approach with one lane plus a left-turn lane, engineering judgment would
indicate that it should be considered a one-lane approach if the traffic using the left-turn lane is
minor. In such a case, the total traffic volume approaching the intersection should be applied
against the signal warrants as a one-lane approach. The approach should be considered two lanes
if approximately half of the traffic on the approach turns left and the left-turn lane is of sufficient
length to accommodate all left-turn vehicles.
(3)
Similar engineering judgment and rationale should be applied to a street approach with one-lane
plus a right-turn lane. In the case of a right-turn lane, engineering judgment must also be
exercised relative to the degree of conflict of minor street right-turn traffic with traffic on the
major street. Thus, right-turn traffic should not be included in the minor street volume if the
movement enters the major street with minimal conflict. In such cases, the approach would be
evaluated as a one-lane approach and only the traffic in the through/left-turn lane considered.
(4)
In some cases the minor street approach may not be striped with multiple lanes, but may be of
sufficient width (typically 18 feet or more) to allow right-turning traffic to pass to the right of any
left-turn or through traffic and complete their turn with little delay. In this case, the approach
should be considered a single lane approach, but the right turn volumes from the minor street
should not be included in the warrant analysis.
TRAFFIC STUDIES MANUAL
Page 12
March 9, 2011
(5)
Minor street approaches having a single left-turn/through lane and a free flow right-turn lane
should be considered a single lane approach, and the right turn volumes from the minor street
should not be included in the warrant analysis.
(6)
Major street approaches having single through lanes with separate left or right-turn lanes are
typically considered one-lane approaches for the warrant analysis.
3.5
VOLUMES
(1)
The volumes of traffic used in a full signal warrant analysis should be the actual turning
movement count (see Chapter 4) taken for the highest 8 to 12 hours in an average day (a weekday
representing traffic volumes normally and repeatedly found at the location).
(2)
A review of the latest machine counts should be conducted first in order to determine:
(a)
The need for a turning movement count (i.e., if the volumes are too low then 8 to 12
hours of manual count are not needed and the warrant analysis may be completed based
on the machine counts only); and
(b)
The appropriate time periods for conducting the turning movement count.
(3)
In all of the warrants where hourly volumes are to be entered, any hourly period may begin on
any quarter hour (7:15, 7:30, 7:45 etc.), as long as there is no overlap among warranted hours.
(4)
An engineering study should consider the effects of the right-turn vehicles from the minor-street
approaches. Engineering judgment should be used to determine what, if any, portion of the rightturn traffic is subtracted from the minor street traffic count when evaluating the count against the
signal warrants.
(5)
The following factors should be considered when applying engineering judgment to determine the
portion of right-turn volumes included in the minor street volume:
(a)
(b)
(c)
(d)
(e)
(f)
(g)
Number of lanes on the minor street approach
Presence or absence of exclusive right-turn lane
Presence or absence of free flow right-turn lane
Availability of gaps in major street traffic
Sight distance available to right-turning vehicles
Percentage of minor street traffic which turns right
Pedestrian volumes
(6)
Section 3.4 includes several instances where right turn volumes would not be included in the
warrant analysis.
(7)
If free flow right-turn lanes are present, the right turn volumes should not be included in the
warrant analysis. This includes both free flow right-turns from the major street (right turn
volumes deducted from the major street volumes), and from the minor street (right turn volumes
deducted from the minor street approach volumes).
(8)
When a minor street approach consists of a single lane, but right-turn volumes exceed 50% of the
total traffic on the approach, some of the right-turn traffic can proceed with little delay, but some
will be impeded by through or left-turn traffic. Also, the presence of the right turn traffic, though
it may be able to turn with little delay adds delay to the through and left-turn traffic. In this case,
all of the left-turn and through volume plus 50% of the right turn volume should be considered in
the warrant analysis and the single lane approach criteria should be used.
TRAFFIC STUDIES MANUAL
Page 13
March 9, 2011
3.6
PRELIMINARY SCREENING
(1)
Prior to conducting a full traffic signal warrant analysis, existing two-way average daily traffic
(ADT) volume data should be reviewed to determine if the intersection experiences enough
traffic to possibly meet any traffic signal warrants. The ADT volumes for all state highway
routes are available in the latest Vehicle Miles Book published by the Department’s Planning
Program each year. The ADT volumes for most major city streets are also available from the
Department’s Planning Program. Table 3-1 shows the minimum ADT volumes below which it is
impossible to meet the 8-hour traffic signal warrant criteria.
(2)
The Equivalent ADT volumes indicated in the table are the minimum hourly volumes required to
meet the 8-hour warrant criteria multiplied by 8 (the number of hours that must meet the
minimum volume criteria). If either street at the intersection experiences traffic volumes below
the equivalent ADT for the applicable number of lanes and application of the full (100%) or
reduced (70%) criteria, it can be concluded that the intersection will not warrant the installation of
a traffic control signal, and the signal warrant study can be terminated. The requestor should be
notified of these findings per Chapter 2.
Table 3-1 ADT Volumes below which MUTCD Signal Warrants Cannot be Met
Number of Lanes for Vehicles Per Hour on
Moving Traffic on Each Major Street (Total of
Approach
Both Approaches)
Warrant 1
Condition A
Warrant 1
Condition B
Combination
of Warrants
1A & 1B
(3)
Equivalent ADT
Vehicles Per Hour on
Higher Volume Minor
Street Approach (One
Direction Only)
Equivalent ADT
Major St.
Minor St.
100%
70%
100%
70%
100%
70%
100%
70%
1
1
500
350
4,000
2,800
150
105
2,400
1,680
2 or more
1
600
420
4,800
3,360
150
105
2,400
1,680
2 or more
2 or more
600
420
4,800
3,360
200
140
3,200
2,240
1
2 or more
500
350
4,000
2,800
200
140
3,200
2,240
848
1
1
750
525
6,000
4,200
75
53
1,200
2 or more
1
900
630
7,200
5,040
75
53
1,200
848
2 or more
2 or more
900
630
7,200
5,040
100
70
1,600
1,120
1
2 or more
750
525
6,000
4,200
100
70
1,600
1,120
1
1
600
420
4,800
3,360
120
84
1,920
1,344
2 or more
1
720
504
5,760
4,032
120
84
1,920
1,344
2 or more
2 or more
720
504
5,760
4,032
160
112
2,560
1,792
1
2 or more
600
420
4,800
3,360
160
112
2,560
1,792
For the volumes in Table 3-1 to meet the 8-hour warrant criteria, all traffic during the day would
have to be concentrated into an 8-hour period, with no other traffic during the remaining 16 hours
of the day. Based on the normal distribution of traffic volumes throughout the day, the actual
two-way ADT volumes needed to meet the 8-hour warrant criteria is significantly higher than
those indicated in Table 3-1. Normal daily traffic distribution was analyzed to determine the
typical 24-hour traffic volumes that would be likely to meet the 8-hour warrant criteria. Table 32 shows the results of that analysis. If the roadway volumes on both approaches meet or exceed
the traffic volumes shown on Table 3-2 for the applicable number of lanes and application of the
full (100%) or reduced (70%) criteria, it does not necessarily mean that a traffic signal is
warranted and should be installed, but indicates that the intersection should be further analyzed
for possible signal warrants (a full warrant analysis should be conducted per the remainder of this
chapter). If the two-way ADT volumes on the approaches are less than those shown on Table 32, engineering judgment should be used to decide whether the traffic volumes are close enough to
need full warrant analysis or the volumes are too low to meet the warrant criteria.
TRAFFIC STUDIES MANUAL
Page 14
March 9, 2011
Table 3-2 ADT Volumes above which MUTCD Signal Warrants are Likely to be Met
Number of Lanes for
Moving Traffic on
Each Approach
warrant 1
condition a
Warrant 1
Condition B
Combination
of Warrants
1A & 1B
Vehicles Per Hour on
Major Street (Total of
Both Approaches)
Equivalent ADT *
Vehicles Per Hour on
Higher Volume Minor
Street Approach (One
Direction Only)
Equivalent ADT *
Major St.
Minor St.
100%
70%
100%
70%
100%
70%
100%
70%
1
1
500
350
8,300
5,810
150
105
4,600
3,220
2 or more
1
600
420
10,000
7,000
150
105
4,600
3,220
2 or more
2 or more
600
420
10,000
7,000
200
140
6,000
4,200
1
2 or more
500
350
8,300
5,810
200
140
6,000
4,200
1
1
750
525
12,500
8,750
75
53
2,300
1,610
2 or more
1
900
630
15,000
10,500
75
53
2,300
1,610
2 or more
2 or more
900
630
15,000
10,500
100
70
3,100
2,170
1
2 or more
750
525
12,500
8,750
100
70
3,100
2,170
1
1
600
420
10,000
7,000
120
84
3,680
2,576
2 or more
1
720
504
12,000
8,400
120
84
3,680
2,576
2 or more
2 or more
720
504
12,000
8,400
160
112
4,800
3,360
1
2 or more
600
420
10,000
7,000
160
112
4,800
3,360
* Box, P. “Warrants for Traffic Control Signals,” Traffic Engineering, November 1967
3.7
TRAFFIC SIGNAL WARRANTS WORKSHEET
(1)
The Traffic Signal Warrants worksheet is an Excel spreadsheet that has been developed to
simplify the traffic signal warrant analysis procedure. It is designed for the easy input of the
volume data and pertinent intersection conditions and to compile the results in a clear and
understandable format for use in justifying the installation of a new signal or the removal of an
existing signal.
(2)
This form summarizes data previously collected at the intersection. This data is drawn from a
larger set of data which can later be used to determine the proper design and operation should
signalization be warranted.
(3)
Most of the data entry for the Traffic Signal Warrants worksheet takes place on the “Input Sheet”.
All fields should be filled in as applicable. Figure 3-1 gives an example of the “Input Sheet”.
(a)
It is important that the city name be entered and spelled correctly because the spreadsheet
determines whether or not to apply the reduced warrant criteria based on the name of the
city. If the intersection is within the urban area boundary of an incorporated city, even
though it may be outside of the actual corporate limits, the city’s name should be used.
(b)
Enter the names and information for each of the approaches. Select “Yes” or “No” from
the dropdown lists in each of the blanks after a question.
(c)
The posted speed limit on the major street must be input for proper application of the
speed-based warrant reductions. If the speed limit is posted at 40 mph, the spreadsheet
will ask if the 85th-percentile speed exceeds 40 mph. This should be determined by a
spot speed study (see Chapter 13). Select “Yes” if the 85th percentile speed is greater
than 40 mph, or “No” if it is 40 mph or less, from the dropdown list next to the question
that is highlighted in red text.
(d)
The number of lanes per approach should be determined per Sections 3.4 and 3.5.
TRAFFIC STUDIES MANUAL
Page 15
March 9, 2011
Figure 3-1 Traffic Signal Warrants Input Sheet
TRAFFIC STUDIES MANUAL
Page 16
March 9, 2011
(4)
(e)
If “Yes” is selected for the question, “Is there a designated school crossing across the
uncontrolled roadway at this intersection?”, then a pedestrian gap study (see Chapter 9)
should be performed and the results tabulated on the Pedestrian Gap Study form (Form
TR-12) and the School Crossing Warrant Sheet (Form TR-01a) should be completed,
which can be found under the “Wrnt 5” tab of the Traffic Signal Warrants worksheet.
(f)
If “Yes” is selected for the question “Is there a railroad grade crossing within 140 feet of
the intersection on a STOP controlled approach?”, then the Intersection Near a Grade
Crossing Warrant Sheet (Form TR-01b) should be completed, and which can be found
under the “Wrnt 9 Input”, “Fig 4C-9” and “Fig 4C-10” tabs of the Traffic Signal
Warrants worksheet.
(g)
The traffic volumes can be input manually, but the recommended method is to copy the
volumes directly from the PetraPro software program. To prepare the count data, first
arrange the approaches in the order of Northbound, Southbound, Eastbound and
Westbound using the approach wizard tool. Then, if all of the count intervals start on the
hour (i.e., XX:00), change the interval length to 60 minutes using the “Tools” dropdown
menu in PetraPro, then selecting “Change Interval Length” and “60 minutes”. If any of
the count intervals were started on the quarter hour (i.e., XX:15, XX:30 or XX:45), the
count data will need to be moved to where it starts on the hour in order for the PetraPro
software to process the count data into full one-hour blocks. Also, any count intervals
that form incomplete hours must be deleted prior to changing the interval length.
Once all of the data is entered on the “Input Sheet”, additional data for the Crash Experience
warrant must be entered on “Pg 3” of the worksheet.
(a)
Under sub-section A, select “X” if adequate trial of alternatives to reduce crashes has
failed to reduce the crash experience at the intersection.
TRAFFIC STUDIES MANUAL
Page 17
March 9, 2011
(b)
(5)
Under sub-section B, enter the number of correctable crashes that have occurred at the
intersection each year, and select “X” if there have been more than five correctable
crashes in a 12 month period. Crashes that are considered susceptible to correction are
typically crashes involving either crossing or left-turning vehicles from the minor street
being struck by through vehicles on the major street. See Chapter 7 regarding crash
studies.
The peak four-hour volumes must be plotted on Figure 4C-1 if the full warrant criteria is used, or
Figure 4C-2 if the reduced (70%) criteria is used. The peak one-hour volumes must be plotted on
Figure 4C-3 if the full warrant criteria is used, or Figure 4C-4 if the reduced (70%) criteria is
used. These figures can be found under the “Pg 5 Full” or “Pg 5 70%” tabs in the Traffic Signal
Warrants worksheet. Figures 4C-1 and 4C-3 are included on the “Pg 5 Full” sheet for studies that
use the full warrant criteria, and Figures 4C-2 and 4C-4 are included on the “Pg 5 70%” sheet for
studies that use the reduced (70%) warrant criteria.
(a)
(b)
First, determine which sheet applies and select the respective tab.
(c)
On the blank worksheet, Figures 4C-1 and 4C-2 include four horizontal and four vertical
lines each of red, blue and green colors which are to be used to plot the appropriate points
for analysis. Figures 4C-3 and 4C-4 include one horizontal and one vertical line each of
red, blue and green colors. The lines are color coded to mean:
• Red = warrant criteria is met
• Blue = warrant criteria is close to being met (i.e., the point fall on or just below the
curve)
• Green = warrant criteria is not met.
(d)
To the right of each of the figures, a table of data indicates the peak eight hours of data
analyzed in the worksheet, including how much above or below the curve the point falls
for each hour. Positive numbers typically fall above the curve, while negative numbers
typically fall below the curve. This data is color coded as previously discussed to
On the blank worksheet, each figure contains green horizontal lines underlining each of
the possible lane configurations. Delete the lines that do not apply, leaving the applicable
lane configuration used for the analysis underlined in green.
TRAFFIC STUDIES MANUAL
Page 18
March 9, 2011
indicate the appropriate color of line to use to plot that hour’s data. Due to the scale of
the figure and inherent errors in plotting the points, some positive numbers will show as
blue to indicate that the point is on, or nearly on, the curve, but not above the curve as
required for the warrant to be met. The table also indicates how long the associated
horizontal and vertical lines need to be to accurately represent the respective volumes on
the figures.
(e)
Determine the four highest points to be plotted on the Four-Hour Warrant curves from the
four highest numbers under the “Volume Above/Below Criteria” heading. The color
coding will indicate how many points will be plotted in each color. Delete the extra
horizontal and vertical lines leaving just four horizontal and four vertical lines of the
appropriate colors.
(f)
Set the length of each of the lines by right-clicking on the line, selecting Size and
Properties, and entering the length of the line from the table to the right of the figure. Set
the length of line for horizontal lines in the Width field, and for vertical lines in the
Height field.
(g)
Move each of the horizontal and respective vertical lines into their appropriate locations
on the figure to accurately represent each of the plotted points.
(6)
If the School Crossing warrant applies, complete the School Crossing Signal Warrant Sheet
(Form TR-01a) under the “Wrnt 5” tab. This first requires the completion of a pedestrian gap
study (see Chapter 9).
(7)
If the Intersection Near a Grade Crossing warrant applies, complete the Intersection Near a Grade
Crossing Warrant worksheet (Form TR-01b). Enter the pertinent information on the “Wrnt 9
Input” sheet, then plot the highest point on the applicable figure (i.e., Figure 4C-9 for a single
lane over the crossing or Figure 4C-10 for multiple lanes over the crossing).
(8)
Figure 3-2, consisting of 6 pages, gives an example of a completed traffic signal warrant analysis
using the Traffic Signal Warrants worksheet.
(9)
Figure 3-3 gives an example of a completed School Crossing Signal Warrant Sheet.
(10)
Figure 3-4 gives an example of a completed Intersection near a Grade Crossing Warrant Sheet.
TRAFFIC STUDIES MANUAL
Page 19
March 9, 2011
Figure 3-2 Example Traffic Signal Warrants Worksheet (Page 1 of 6)
TRAFFIC STUDIES MANUAL
Page 20
March 9, 2011
Figure 3-2 Example Traffic Signal Warrants Worksheet (Page 2 of 6)
TRAFFIC STUDIES MANUAL
Page 21
March 9, 2011
Figure 3-2 Example Traffic Signal Warrants Worksheet (Page 3 of 6)
TRAFFIC STUDIES MANUAL
Page 22
March 9, 2011
Figure 3-2 Example Traffic Signal Warrants Worksheet (Page 4 of 6)
TRAFFIC STUDIES MANUAL
Page 23
March 9, 2011
Figure 3-2 Example Traffic Signal Warrants Worksheet (Page 5 of 6)
TRAFFIC STUDIES MANUAL
Page 24
March 9, 2011
Figure 3-2 Example Traffic Signal Warrants Worksheet (Page 6 of 6)
TRAFFIC STUDIES MANUAL
Page 25
March 9, 2011
Figure 3-3 Example School Crossing Signal Warrant Sheet
TRAFFIC STUDIES MANUAL
Page 26
March 9, 2011
Figure 3-4 Example Intersection near a Grade Crossing Warrant Sheet
TRAFFIC STUDIES MANUAL
Page 27
March 9, 2011
3.8
WARRANT 1, EIGHT HOUR VEHICULAR VOLUME
The Eight Hour Vehicular Volume signal warrant is broken into three conditions that are detailed in
Section 4C.02 of the MUTCD.
The Minimum Vehicular Volume, Condition A, is intended for application at locations where a large
volume of intersecting traffic is the principal reason to consider installing a traffic control signal.
The Interruption of Continuous Traffic, Condition B, is intended for application at locations where
Condition A is not satisfied and where the traffic volume on a major street is so heavy that traffic on a
minor intersecting street suffers excessive delay or conflict in entering or crossing the major street.
The combination of Conditions A and B is intended for application at locations where Condition A is not
satisfied and Condition B is not satisfied and should be applied only after an adequate trial of other
alternatives that could cause less delay and inconvenience to traffic has failed to solve the traffic
problems.
3.9
WARRANT 2, FOUR-HOUR VEHICULAR VOLUMES
The Four-Hour Vehicular Volume signal warrant is intended to be applied where the volume of
intersecting traffic is the principal reason to consider installing a traffic control signal. The warrant
conditions are detailed in Section 4C.03 of the MUTCD.
3.10 WARRANT 3, PEAK HOUR
The Peak Hour signal warrant is intended for use at a location where traffic conditions are such that for a
minimum of 1 hour of an average day, the minor street traffic suffers undue delay when entering or
crossing the major street. The warrant conditions are detailed in Section 4C.04 of the MUTCD.
This signal warrant shall be applied only in unusual cases, such as office complexes, manufacturing
plants, industrial complexes, or high-occupancy vehicle facilities that attract or discharge large numbers
of vehicles over a short time.
3.11 WARRANT 4, PEDESTRIAN VOLUME
The Pedestrian Volume signal warrant is intended where the traffic volumes on a major street are so
heavy that pedestrians experience excessive delays in crossing the major street. The warrant conditions
are detailed in Section 4C.05 of the MUTCD.
3.12 WARRANT 5, SCHOOL CROSSING
The School Crossing signal warrant is intended for application where the fact that school children cross
the major street is the principal reason to consider installing a traffic control signal. The warrant
conditions are detailed in Section 4C.06 of the MUTCD.
Before a decision is made to install a traffic control signal, consideration shall be given to the
implementation of other remedial measures, such as warning signs and flashers, school speed zones,
school crossing guards, or a grade-separated crossing.
3.13 WARRANT 6, COORDINATED SIGNAL SYSTEM
Progressive movement in a coordinated signal system sometimes necessitates installing traffic signal at
intersections where they would not otherwise be needed in order to maintain proper platooning of
vehicles. The warrant conditions for this warrant are detailed in Section 4C.07 of the MUTCD.
In order for this warrant to apply, there must be a signalized intersection more than 1,000 feet away in
each direction along the coordinated signal corridor.
TRAFFIC STUDIES MANUAL
Page 28
March 9, 2011
3.14 WARRANT 7, CRASH EXPERIENCE
The Crash Experience signal warrant conditions are intended for applications where the severity and
frequency of crashes are the principal reasons to consider installing a traffic control signal. The warrant
conditions for this warrant are detailed in Section 4C.08 of the MUTCD.
3.15 WARRANT 8, ROADWAY NETWORK
Installing a traffic signal at some intersections might be justified to encourage concentration and
organization of traffic flow on a roadway network. The warrant conditions for this warrant are detailed in
Section 4C.09 of the MUTCD.
3.16 WARRANT 9, INTERSECTION NEAR A GRADE CROSSING
The Intersection Near a Grade Crossing signal warrant is intended for use at a location where none of the
conditions described in the other eight traffic signal warrants are met, but the proximity to the intersection
of a grade crossing on an intersection approach controlled by a STOP or YIELD sign is the principal
reason to consider installing a traffic control signal. The warrant conditions for this warrant are detailed
in Section 4C.10 of the MUTCD.
TRAFFIC STUDIES MANUAL
Page 29
March 9, 2011
(This page intentionally left blank)
TRAFFIC STUDIES MANUAL
Page 30
March 9, 2011
CHAPTER 4 – TURNING MOVEMENT COUNT
4.1
PURPOSE
The purpose of a turning movement count (TCM) is to summarize the counts of vehicle movements
through an intersection during certain time periods. This type of volume summary is used in making
decisions regarding the geometric design of the roadway, sign and signal installation, signal timing,
pavement marking, traffic circulation patterns, capacity analysis, parking and loading zones, and vehicle
classification.
4.2
MANUAL TURNING MOVEMENT COUNT
(1)
Manual turning movement counts should be collected using an electronic count board such as a
JAMAR Technologies DB-400, TDC-8 or TDC-12 traffic data collector, and processed through
JAMAR’s PetraPro software.
(2)
The count header on the turning movement count should be filled in completely. Enter the Street
Name of each roadway and orient the intersection by indicating the approach direction of each
approach (i.e., Northbound, Southbound, Eastbound and Westbound).
(3)
For turning movement counts that will be used for signal warrant analysis, the approaches should
be in order of Northbound, Southbound, Eastbound and Westbound from left to right.
(4)
Briefly describe the Weather Conditions and include any Comments that may influence the
results of the data being collected. For example, a stalled vehicle that may temporarily restrict a
vehicle movement during a time period should be noted.
(5)
Figure 4-1 gives an example of a turning movement count that was completed using a TDC-8
count board and processed through the PetraPro software.
4.3
AUTOMATED TURNING MOVEMENT COUNT
Automated turning movement counts are collected using Miovision Technologies Polemount Video
Collection Units (VCUs), and the data is processed and retrieved on Miovision’s Traffic Data Online
(TDO) servers.
TRAFFIC STUDIES MANUAL
Page 31
March 9, 2011
Figure 4-1 Example Turning Movement Count
Wyoming Department of Transportation
Traffic Program
Safety & Studies Section
Cheyenne, WY
Intersection: Main & 5th St
Counted By: AA
Weather: Rainy
Comments:
File Name: N Main & 5th St
Site Code: 00000005
Start Date: 6/5/2008
Page No: 1
Groups Printed- All Vehicles
N Main
5th St
Southbound
Eastbound
N Main
Northbound
Start Time
Left
Thru
Right
Peds
Left
Thru
Right
Peds
Left
Thru
Right
5th St
Westbound
Peds
Left
Thru
Right
Int.
Total
Peds
07:00 AM
07:15 AM
07:30 AM
07:45 AM
Total
12
19
17
21
69
73
48
53
77
251
6
6
11
10
33
0
0
0
0
0
31
31
44
67
173
57
51
76
103
287
4
12
16
18
50
0
1
0
0
1
15
9
13
18
55
37
40
46
74
197
11
24
22
29
86
0
1
1
1
3
10
15
11
12
48
14
27
42
40
123
29
44
19
30
122
0
0
1
1
2
299
328
372
501
1500
08:00 AM
08:15 AM
08:30 AM
08:45 AM
Total
24
14
12
18
68
65
59
43
50
217
13
3
10
10
36
0
0
0
0
0
50
28
39
31
148
78
63
64
57
262
15
9
13
9
46
0
0
0
0
0
11
11
10
9
41
46
38
37
44
165
20
25
19
16
80
1
1
0
0
2
15
9
9
13
46
22
34
13
24
93
25
21
23
32
101
0
0
0
0
0
385
315
292
313
1305
11:00 AM
11:15 AM
11:30 AM
11:45 AM
Total
23
21
23
30
97
67
77
86
82
312
10
7
15
15
47
0
0
0
0
0
39
33
45
42
159
81
69
82
75
307
11
8
10
11
40
0
0
1
0
1
15
13
15
8
51
42
49
45
43
179
19
26
22
31
98
0
0
1
0
1
15
22
12
17
66
31
31
32
46
140
39
32
46
39
156
0
0
0
0
0
392
388
435
439
1654
12:00 PM
12:15 PM
12:30 PM
12:45 PM
Total
26
17
33
31
107
101
95
87
88
371
11
14
14
17
56
0
2
0
1
3
36
30
46
46
158
90
92
84
74
340
15
9
11
13
48
0
1
0
0
1
18
10
25
16
69
60
28
38
46
172
25
14
25
19
83
0
0
0
1
1
20
17
16
17
70
47
38
44
35
164
48
36
27
49
160
3
1
1
1
6
500
404
451
454
1809
03:30 PM
03:45 PM
Total
27
44
71
78
104
182
12
17
29
0
0
0
51
50
101
91
98
189
7
24
31
0
0
0
15
11
26
34
24
58
21
35
56
0
0
0
16
6
22
29
15
44
26
24
50
2
1
3
409
453
862
04:00 PM
04:15 PM
04:30 PM
04:45 PM
Total
29
40
52
44
165
109
79
91
108
387
10
11
5
8
34
0
0
0
0
0
72
59
49
62
242
140
92
97
89
418
14
17
18
21
70
0
3
2
0
5
17
15
19
17
68
57
41
53
41
192
17
25
25
19
86
1
3
4
1
9
22
25
21
21
89
43
35
49
39
166
50
46
45
43
184
0
0
0
0
0
581
491
530
513
2115
05:00 PM
05:15 PM
Grand
Apprch %
Total %
58
48
683
23.5
6.6
131
109
1960
67.4
18.9
11
15
261
9
2.5
0
0
3
0.1
0
54
42
1077
31.9
10.4
93
85
1981
58.6
19.1
15
12
312
9.2
3
0
0
8
0.2
0.1
26
14
350
17.6
3.4
66
58
1087
54.7
10.5
22
21
532
26.8
5.1
0
2
18
0.9
0.2
28
18
387
18.5
3.7
63
39
832
39.7
8
52
42
867
41.3
8.4
TRAFFIC STUDIES MANUAL
Page 32
0
619
0
505
11 10369
0.5
0.1
March 9, 2011
CHAPTER 5 – CONDITION DIAGRAM
5.1
PURPOSE
(1)
The purpose of the condition diagram is to show the intersection and the conditions within the
surrounding area as it exists. The diagram should include the intersection alignment, items such
as buildings, sidewalks, trees, light poles, fire hydrants, stop signs, number of lanes, lane use if
required, approach speed limits, and distance to the next signal in each direction (if applicable),
associated with the streets forming the intersection. The condition diagram should show the
length of all exclusive lanes and associated tapers.
(2)
The condition diagram provides the engineer with details of field conditions and helps investigate
the need for changes to existing traffic control devices. The diagram should also be part of an
intersection crash analysis.
5.2
COMPLETING THE CONDITION DIAGRAM
(1)
The location information should be entered so that the intersection is thoroughly identified. The
state, U.S., or county route numbers and street names for both streets should be included if
applicable, as well as the County, City, Date, and Person(s) preparing the diagram. Orient the
intersection by indicating north with a north arrow.
(2)
All items associated with the streets should be drawn using representative symbols. The diagram
should also include the width and surface type of the streets, the grades (if 5 percent or more), and
traffic control devices. All measurements should be as accurate as possible and indicated on the
diagram. The usual distance measured from the intersection is 80 to 100 feet; however, in those
cases where pertinent signing or pavement markings concerning the intersection (such as ‘Stop
Ahead’) occur in advance of the intersection in question, those conditions should be diagrammed
and distances indicated with a “broken arrow.” Reasonable judgment should be used to decide
the distance away from the intersection to include elements in the condition diagram.
(3)
Show all lanes and the movements allowed/required from each lane. Include lane widths, fullwidth turn bay lengths and turn bay taper lengths.
(4)
Note the posted speed limit on all approaches and the distance to the next traffic signal in each
direction (if applicable).
(5)
Figure 5-1 gives an example of a completed condition diagram.
TRAFFIC STUDIES MANUAL
Page 33
March 9, 2011
Figure 5-1 Example Condition Diagram
TRAFFIC STUDIES MANUAL
Page 34
March 9, 2011
CHAPTER 6 –SIGHT DISTANCE STUDIES
6.1
PURPOSE
(1)
Sight distance is the length of roadway visible to a driver. The three types of sight distance
common in roadway design are intersection sight distance, stopping sight distance, and passing
sight distance. This chapter will discuss intersection sight distance and stopping sight distance.
Information on passing sight distance can be found in Chapter 12 of this manual and in Chapter 3
of the AASHTO A Policy on Geometric Design of Highways and Streets (Green Book).
(2)
A sight distance study at an intersection includes four key steps:
•
Determine the minimum recommended sight distance.
•
Obtain or construct sighting and target rods.
•
Measure current sight distances and record observations.
•
Perform sight distance analysis.
6.2
INTERSECTION SIGHT DISTANCE
(1)
The driver of a vehicle approaching or departing from an intersection should have an
unobstructed view of the intersection, including any traffic control devices, and sufficient lengths
along the intersecting highway to permit the driver to anticipate and avoid potential collisions
(Maze and Plazak 2000). These unobstructed views form triangular areas known as sight
triangles.
(2)
A typical intersection is divided into areas between each leg known as quadrants. Sight triangles
are the specified areas along an intersection’s approach legs and across the included corners (see
Figures 6-1 and 6-2 for an illustration). These areas should be clear of obstructions that might
block a driver’s view of conflicting vehicles or pedestrians. The two types of sight triangles are
approach sight triangles and departure sight triangles (AASHTO, Green Book, 2004).
6.2.1 APPROACH SIGHT TRIANGLES
Approach sight triangles provide the driver of a vehicle approaching an intersection an unobstructed view
of any conflicting vehicles or pedestrians. These triangular areas should be large enough that drivers can
see approaching vehicles and pedestrians in sufficient time to slow or stop and avoid a crash. Approach
sight triangles are illustrated in Figure 6-1.
Figure 6-1 Approach Sight Triangles
(Source: CTRE)
TRAFFIC STUDIES MANUAL
Page 35
March 9, 2011
6.2.2 DEPARTURE SIGHT TRIANGLES
Appropriate departure sight triangles provide adequate sight distance for a stopped driver on a minor
roadway to depart from the intersection and enter or cross the major roadway. These sight triangles
should be provided in each quadrant of a controlled intersection. Departure sight triangles are illustrated
in Figure 6-2.
Figure 6-2 Departure Sight Triangles
(Source: CTRE)
6.2.3 OBSTRUCTIONS WITHIN SIGHT TRIANGLES
(1)
To determine whether an object is a sight obstruction, consider both the horizontal and vertical
alignment of both roadways, as well as the height and position of the object (AASHTO Green
Book). For passenger vehicles, it is assumed that the driver’s eye height is 3.5 feet and the height
of an approaching vehicle is 4.25 feet above the roadway surface, as illustrated in Figure 6-3. At
the decision point, the driver’s eye height is used for the measurement. Sometimes a higher
driver’s eye height should be considered for drivers of trucks to see underneath the tree canopy.
Figure 6-3 Heights Pertaining to Sight Triangles
(Source: CTRE)
TRAFFIC STUDIES MANUAL
Page 36
March 9, 2011
(2)
Any object within the sight triangle that would obstruct the driver’s view of an approaching
vehicle (4.25 feet in height) should be removed or modified or appropriate traffic control devices
should be installed as per the MUTCD. Obstructions within sight triangles could be buildings,
parked vehicles, hedges, trees, bushes, tall crops, walls, fences, etc. Figure 6-4 shows a clear
sight triangle and an obstructed sight triangle.
Figure 6-4 Clear Versus Obstructed Sight Triangles
(Source: CTRE)
6.3
SIGHT DISTANCE STUDY METHODS
(1)
Different types of traffic control require different sight distances. For example, intersections with
no control require adequate distance for the approaching vehicle to identify any conflicts in or
approaching the intersection before entering. An approach sight triangle is used for this analysis.
However, intersections with stop control require drivers to stop at the intersection, check for
approaching vehicles in the intersection, and then depart. A departure sight triangle is used for
this analysis.
(2)
Example sighting and target rods are illustrated in Figure 6-5. The target rod can be constructed
out of normal 1x2 dimensional lumber. The target rod should be 4.25 feet tall to represent the
vehicle height and be painted fluorescent orange on both the top portion and bottom 2 feet of the
rod. The bottom 2-foot portion represents the object height for measuring stopping sight distance
(this will be further explained later in Section 6.3.3). The sighting rod should be 3.5 feet tall to
represent the driver’s eye height. The sighting rod can be constructed out of the same type of
wood but should be painted flat black. The sighting rod and target rod are used in measuring
sight distance.
(3)
The methods to measure and analyze the approach sight distance for uncontrolled intersection,
intersection sight distance for STOP controlled intersections and stopping sight distance are
described below.
TRAFFIC STUDIES MANUAL
Page 37
March 9, 2011
Figure 6-5 Example Sighting Rod (left) and Target Rod (right)
(Source: CTRE)
6.3.1 UNCONTROLLED INTERSECTIONS
(1)
For uncontrolled intersections, the drivers of both approaching vehicles should be able to see
conflicting vehicles in adequate time to stop or slow to avoid a crash. The required sight distance
for safe operation at an uncontrolled intersection is directly related to the vehicle speeds and the
distances traveled during perception, reaction, and braking time. Table 6-1 lists the minimum
recommended sight distances for specific design speeds. For example, for a speed limit of 30
mph, 140 feet is the minimum recommended sight distance along that approach leg.
Table 6-1 Length of Sight Triangle Leg (No Traffic Control)
Posted Speed
(mph)
Length of Leg (X or Y)
(feet)
20
90
25
115
30
140
35
165
40
195
45
220
50
245
55
285
60
325
65
365
(Source: AASHTO Green Book, 2004)
TRAFFIC STUDIES MANUAL
Page 38
March 9, 2011
(2)
Determine the minimum sight distance for the posted speed on each approach to the intersection
per Table 6-1.
(3)
Sight distance measurements should be gathered for all legs of the uncontrolled intersection.
Traffic approaching from both the left and right should be considered for measurements. The
observer records the date and time, posted or operating speed, site location, and weather
conditions on the sight distance diagram. The measuring process is represented in Figure 6-6 and
described below.
Figure 6-6 Sight Distance Measurement at Uncontrolled Intersection
(Source: CTRE)
(4)
The observer holds the sighting rod, and the assistant holds the target rod. They position
themselves on two intersecting approaches at the appropriate stopping sight distances taken from
Table 6-1. These are the X and Y dimensions. The observer represents the approaching vehicle
and is located at the decision point. The observer uses the 3.5-foot sighting rod, which represents
the driver’s eye height. The assistant represents the intersecting vehicle. The assistant uses the
4.25-foot target rod, which represents the height of the approaching vehicle. The observer sights
from the top of the sighting rod to the target rod.
(5)
If the target rod is visible, the approach sight triangle for the intersection is appropriate. If the top
of the target rod is not visible, the assistant holding the target rod should walk toward the
intersection along the centerline of the intersecting lane until the observer can see the target rod.
When the target rod is visible, the position should be marked and the distance to the intersection
should be measured along the centerline of the roadway. This is the X dimension.
(6)
The analysis of intersection sight distance consists of comparing the recommended sight distance
to the measured sight distance. The measured sight distance should be equal to or greater than the
recommended stopping sight distance. If the measured sight distance is less than the
recommended sight distance, some mitigation may be required. Some mitigation measures are as
follows:
(a)
(b)
(c)
Remove/modify obstruction.
Reduce speeds (Note: posting lower speed limits alone is seldom effective).
Install traffic control devices (if warranted by the MUTCD).
TRAFFIC STUDIES MANUAL
Page 39
March 9, 2011
6.3.2 INTERSECTIONS CONTROLLED WITH STOP SIGNS
(1)
Vehicles stopped at an intersection must have sufficient sight distance to permit a safe departure.
At intersections with stop sign control, close attention should be given to departure sight
triangles.
(2)
Three maneuvers can be completed by vehicles stopped at an intersection: crossing maneuver,
left-turn maneuver, and right-turn maneuver.
(3)
When a driver is completing a crossing maneuver, there must be sufficient sight distance in both
directions available to cross the intersecting roadway and avoid approaching traffic. The sight
distance required for this maneuver is based on the distance approaching vehicles will travel on
the major road during the time it takes a stopped vehicle to clear the intersection. Table 6-2 lists
the recommended sight distances for this maneuver based on design speeds.
(4)
The left-turn maneuver requires first clearing the traffic on the left, then entering the traffic
stream from the right. The required sight distance for this maneuver is affected by the amount of
time it takes the stopped vehicle to turn left, clearing traffic from the left and reach average
running speed without affecting the speed of an approaching vehicle from the right. Table 6-2
lists the recommended sight distances for this maneuver based on design speeds.
(5)
The right turn maneuver must have sufficient sight distance to permit entrance onto the
intersecting roadway and then accelerate to the posted speed limit without being overtaken by
approaching vehicles from the left. Table 6-2 lists the recommended sight distances for this
maneuver based on design speeds.
Table 6-2 Intersection Sight Distance (STOP Controlled)
Posted
Speed
(mph)
20
Sight Distance for LeftTurn Maneuver (feet)
Sight Distance for Crossover
and Right-Turn Maneuvers (feet)
225
195
25
280
240
30
335
290
35
390
335
40
445
385
45
500
430
50
555
480
55
610
530
60
665
575
65
720
625
70
775
670
(Source: AASHTO Green Book, 2004)
(6)
To measure the intersection sight distance, first determine the minimum sight distance for each
maneuver and speed (see Table 6-2).
(7)
The observer records the date and time, posted or operating speed, site location, and weather
conditions on the sight distance diagram.
(8)
The sight distance should be measured in each direction from each minor street approach. The
line of sight should be from the driver’s eye position where traffic would normally be expected to
stop and look for gaps in approaching traffic (a typical rule of thumb is 15 feet from the near edge
TRAFFIC STUDIES MANUAL
Page 40
March 9, 2011
of the major street traveled way). Observation of traffic behavior at the intersection should be
used to determine the point at which the majority of drivers stop to look for gaps in traffic without
encroaching on the through lanes. Measure the intersection sight distance from that point.
(9)
The observer with the sighting rod stands at the center of the approaching lane at the point
determined above. The observer’s eyes should be at the top of the sighting rod. The assistant
walks away from the observer along the intersecting roadway toward approaching traffic. The
assistant should stop periodically and place the target rod on the pavement for sighting by the
observer. This process should continue until the top of the target rod can no longer be seen. The
point where the target rod disappears is the maximum sight distance along that leg. The position
should be marked and the distance to the intersection should be measured along the centerline of
the roadway.
(10)
The analysis of intersection sight distance consists of comparing the recommended sight distance
to the measured available sight distance. The comparison of the actual distances should be
performed with consideration to posted speed limit. If the measured sight distance is less than the
recommended sight distance some mitigation may be required. Some mitigation measures are as
follows:
(a)
(b)
(c)
Remove/modify obstruction.
Post a reduced advisory speed.
Install additional traffic control devices (if warranted by the MUTCD).
6.3.3 STOPPING SIGHT DISTANCE
(1)
The available sight distance on a roadway should be sufficiently long to enable a vehicle traveling
at the posted speed to stop before reaching a stationary object in its path. Although greater
lengths of visible roadway are desirable, the sight distance at every point along a roadway should
be at least that needed for a below-average driver or vehicle to stop (AASHTO Green Book).
Stopping sight distance is defined as the sum of two distances:
(a)
Brake reaction distance – the distance traveled by the vehicle from the instant the driver
sees an object necessitating a stop to the instant the brakes are applied; plus
(b)
Braking distance – the distance needed to stop the vehicle from the instant brake
application begins.
(2)
The reaction distance is based on the reaction time of the driver and the speed of the vehicle. The
braking distance is dependent upon the vehicle speed and the coefficient of friction between the
tires and roadway.
(3)
Table 6-3 lists minimum recommended stopping sight distances based on design speed and the
sum of reaction distance and braking distance rounded to the nearest 5 feet for ease of
application. At 55 mph, for example, the recommended stopping sight distance is 495 feet.
(4)
For stopping distance calculations, the height of the driver’s eye is 3.5 feet above the roadway
and the object height is 2 feet above the roadway surface, as illustrated in Figure 6-7. The 2-foot
object height represents an object that the driver of an approaching vehicle would want to avoid.
(5)
One element to consider for stopping sight distance is vertical curvature of the roadway. On
straight roadway sections, the obstruction that blocks the driver’s vision of the roadway ahead is
the vertical curvature of the road surface. As the vertical curvature increases, stopping sight
distance also increases.
(6)
Determine the minimum stopping sight distance for the posted speed limit (see Table 6-3).
(7)
The observer records the date and time, posted or operating speed, site location, and weather
conditions on the sight distance diagram.
TRAFFIC STUDIES MANUAL
Page 41
March 9, 2011
(8)
Standing at a pre-determined location along the road, the observer should sight from the top of
the sighting road while the assistant moves away in the direction of travel. The assistant stops
when the bottom 2-foot portion of the target rod is no longer visible. This is the distance at which
a 2-foot tall object can no longer be seen by an approaching driver. The distance from the
disappearing point to the observer is measured and recorded.
Table 6-3 Stopping Sight Distance
Design Speed
(mph)
Stopping Sight Distance
(feet)
20
115
25
155
30
200
35
250
40
305
45
360
50
425
55
495
60
570
65
645
70
730
75
820
80
910
(Source: AASHTO Green Book, 2004)
Figure 6-7 Heights Pertaining to Stopping Sight Distance
(Source: CTRE)
(9)
The analysis of stopping sight distance consists of comparing the recommended sight distance to
the measured sight distance. The measured stopping sight distance should be greater than the
recommended stopping distance. On a horizontal curved roadway, a sight obstruction may be due
to the curve or to physical features outside of the roadway. On a straight roadway, the sight
obstruction will be due to the vertical curvature of the roadway.
TRAFFIC STUDIES MANUAL
Page 42
March 9, 2011
CHAPTER 7 – CRASH STUDY
7.1
PURPOSE
(1)
The purpose of a Crash Study is to review the crash history associated with the study intersection.
The crash analysis should include the latest five years of available crash data. This data is used to
identify any crash patterns or trends that may be occurring at the intersection.
(2)
WYDOT has several tools for the retrieval and analysis of crash data:
(a)
Individual crash reports are contained on the ReportBeam website. Users must obtain a
username and password from the Highway Safety Program in order to access the online
crash data.
(b)
The Wyoming Electronic Crash Reporting System (WECRS) crash database can be
queried using Crystal Reports to get a list of crashes at a specific intersection or along a
specific corridor.
(c)
The WECRS crash data is periodically (typically quarterly) processed through the
Critical Analysis Reporting Environment (CARE), which can be used to locate and
analyze crash data in a number of ways such as pin maps, hotspot anaylsis, etc.
7.2
COLLISION DIAGRAM
(1)
The collision diagram is used to pictorially represent different types of crashes that have occurred
at a particular intersection. Figure 7-1 is an example of a collision diagram. Collision diagrams
are typically generated by Intersection Magic for the referenced intersection.
(2)
All intersection related crashes should be shown on the diagram with their respective Crash ID
numbers. The primary graphic consideration is to properly show the direction of original travel,
coupled with a curve in the approach line representing the beginning of the path the vehicle
would have followed, if turning. If a pedestrian is struck, the general location by crosswalk and
direction of travel should be diagrammed. Similarly, a fixed object crash should be shown in the
correct quadrant of the intersection.
7.3
CRASH LISTING
(1)
The crash listing is a detailed summary of the crash information represented in the collision
diagram. Figure 7-2 is an example of a crash listing. Crash listings are typically generated by
Intersection Magic for the referenced intersection.
(2)
In reviewing the summary of the crash information, the following factors are important. The day
of the week can be significant because certain parking and turning restrictions may apply only on
weekends. The date is necessary to allow the separation of crashes which may have occurred
before or after a change in control, improvement, or increased traffic volume. The time of
occurrence is important for developing crash rates as a function of traffic volume during certain
time periods, for performing violation or other observance studies, and for possibly limiting
applications of certain regulations during specific hours of the day.
TRAFFIC STUDIES MANUAL
Page 43
March 9, 2011
Figure 7-1 Example Collision Diagram
TRAFFIC STUDIES MANUAL
Page 44
March 9, 2011
Figure 7-2 Example Intersection Magic Crash List
TRAFFIC STUDIES MANUAL
Page 45
March 9, 2011
Figure 7-3 Example Crystal Reports Crash List
TRAFFIC STUDIES MANUAL
Page 46
March 9, 2011
CHAPTER 8 – STOP SIGN DELAY STUDY
8.1
PURPOSE
The stop sign delay study is used to evaluate the performance of stop-controlled intersections in allowing
traffic to enter and pass through, or to enter and turn onto another route. This study will effectively
provide a detailed evaluation of stopped time delay at the intersection. This study is generally used in
conjunction with Warrant 2 (Interruption of Continuous Traffic) and Warrant 3 (Peak Hour Delay).
8.2
STOP SIGN DELAY STUDY
(1)
The stop sign delay study should be collected using an electronic traffic data collector such as a
JAMAR Technologies TDC-8 or TDC-12.
(2)
The stop sign delay study is designed to measure the traffic characteristics at an intersection
controlled by a STOP sign. Although it primarily measures delay, it also provides information
about the queue length and traffic volume on an approach. The study procedure is detailed in the
respective User’s Manual for the TDC-8 or TDC-12. Figure 8-1 is an example of the stop sign
delay study output with 15-minute intervals and hourly summaries.
(3)
A stop sign delay study should be used to measure delays during the highest peak hour of each of
the three peak periods (i.e., AM, Noon and PM). The correct hours to study can be determined by
first completing a turning movement count (Chapter 4) at the intersection.
8.3
FIELD OBSERVATION
(1)
Stop sign delay studies are normally done at one approach to an intersection. Typically, the
approach with the highest volume would be studied, since that approach would likely have the
longest delays and would experience the greatest overall delay. One or two lanes can be
measured at once.
(2)
If the study is interested in knowing the queue lengths or specific details about the length of delay
experienced by individual vehicles, then delays on each lane of the approach must be measured
separately.
(3)
If the study is being used only to determine the average stopped delay for the entire approach (not
necessarily by lane) and the reviewer is not necessarily concerned with vehicle queues, multiple
lanes can be measured simultaneously by using only one set of “stop” and “go” buttons on the
board. This method will not accurately measure queues or individual vehicle delays, but can be
used as a quick check to determine total approach delay and average delay per vehicle for the
entire approach. Using this method allows the data collector to also measure the total stopped
delay and average stopped delay per vehicle on the opposing STOP controlled approach by using
the second set of “stop” and “go” buttons for the opposing approach.
TRAFFIC STUDIES MANUAL
Page 47
March 9, 2011
Figure 8-1 Example Stop Sign Delay Study
TRAFFIC STUDIES MANUAL
Page 48
March 9, 2011
CHAPTER 9 – PEDESTRIAN GAP STUDY
9.1
PURPOSE
(1)
The gap study is used to determine the size and the number of gaps in the vehicular traffic stream
that are of adequate length to permit pedestrians to cross.
(2)
A gap is normally defined as the amount of time, in seconds, between when the end of one
vehicle passes a point on the roadway and when the front of the next vehicle passes the same
point.
(3)
You can measure gaps on the entire road, with several lanes of traffic going in different
directions, or you can measure gaps on individual lanes. It depends on the data that is required.
(4)
A pedestrian gap study consists of measuring the predominant pedestrian group size, determining
the length of minimum adequate gap, measuring the gap sizes in the traffic stream, and
determining the sufficiency of adequate gaps.
(5)
The principal application of the study results is in analyzing roadway crossings by pedestrians to
determine appropriate traffic controls and safety improvements. The results of gap studies are
used in pedestrian and school crossing studies and in traffic signal warrant analyses.
9.2
PEDESTRIAN GAP STUDY FORM
(1)
The Pedestrian Gap Study form (Form TR-12) is used to determine the pedestrian group size,
minimum adequate gap length and to determine the frequency and duration of adequate gaps
available at the crossing location. A blank form can be printed for use in the field to gather the
data, and then the .PDF form can be completed in-house for a clean presentation of the data and
calculations.
(2)
In order to accurately analyze the data, the top portion of the Pedestrian Gap Study form should
be filled in as completely as possible. Enter the location so that the study location is thoroughly
identified. The U.S. route numbers, state route numbers, and county road or street names should
be included if applicable.
(3)
Enter the county, city, date, time of study, and the observer making the study. Identify the street
associated with the crosswalk. Enter the width of the street from edge to edge or from curb to
curb. If the roadway has a raised median, indicate by circling YES; if not, circle NO. If divided,
indicate the width of the median. Also include any remarks that may affect the data being
collected.
9.3
PEDESTRIAN GROUP SIZE SURVEY
(1)
The purpose of the pedestrian group size survey is to determine the 85th-percentile group size of
pedestrians that cross the street at the pedestrian gap study location.
(2)
Pedestrians waiting to cross a roadway will generally arrange themselves in rows one behind the
other. Group size is comprised of row width and number of rows. When the group starts to
cross, they enter the roadway (step off the curb) with approximately 2 seconds of headway
between rows. Since the factor of interest is the amount of time it takes the entire group to enter
the crossing, it is only necessary to determine the predominant number of rows entering the
crossing. The width of the rows and the total number of pedestrians in the group are
inconsequential.
(3)
Distinguishing distinct rows may be somewhat difficult at first. With some training and
experience, however, observers manage easily. A sample of 30 to 50 groups is usually sufficient
to establish the group size (i.e., number of rows per group). This measurement should be made
TRAFFIC STUDIES MANUAL
Page 49
March 9, 2011
during the time and under the conditions of interest for the gap study. The observer should be
positioned unobtrusively perpendicular to the crossing and parallel to the roadway with a clear
view of the crossing point with the heaviest concentration of pedestrians.
(4)
Observe each group as they enter the crossing. Place a tick mark in the tally column
corresponding to the number of rows in the group. Stragglers are not included. Groups will form
naturally when gaps are inadequate to accommodate random arrivals. When the sampling period
is complete, count the tally marks and record the frequency of each corresponding group size in
the total column. The sum of the total column will be the total number of groups sampled.
(5)
The remainder of the pedestrian group size survey portion of the form is completed by
multiplying the total number of groups by 0.85 to obtain the number of groups at or below the
85th-percentile group size. The 85th-percentile group size is the group size that contains that
value.
(6)
Figure 9-1 gives an example of a completed pedestrian group size study.
9.4
MINIMUM ADEQUATE GAP
(1)
Having calculated the 85th-percentile group size, the minimum adequate gap time (G) required
for crossing the street can be found by using the following equation:
Equation 9-1
2
Where:
G
W
S
=
=
=
2(N – 1)
N
2
3
=
=
=
=
1
3
Minimum adequate gap time (seconds)
Width of roadway in feet
Assumed walking speed in feet/second (use 3.5 for students and 4.0 for
normal pedestrian traffic)
Pedestrian clearance time
Number of rows in 85th-percentile group size
Time interval between rows (Headway) in seconds
Perception and reaction (Start-up) time in seconds
(2)
This value is the minimum length in seconds of a gap in traffic which will permit an 85thpercentile group of pedestrians to cross a roadway of specified width from a point of relative
safety on one side to a point of relative safety on the other side without a vehicle crossing their
path.
(3)
To determine the impacts of traffic on the calculated minimum adequate gap time, the vehicle gap
size should be analyzed as shown in the available gap survey portion of the pedestrian gap study
form (see Figure 9-1). The results of both pedestrian group size survey and available gap survey
(see Section 9.5 ) will determine if controls are warranted.
TRAFFIC STUDIES MANUAL
Page 50
March 9, 2011
Figure 9-1 Example of Pedestrian Gap Study Form
TRAFFIC STUDIES MANUAL
Page 51
March 9, 2011
9.5
MEASURING GAP SIZES
(1)
The next part of the field study is to measure the time lengths of the gaps in traffic.
(2)
Gap studies can be broken into two types of studies – multi-direction gap studies or total
(combined direction) gap studies. Multi-direction gap studies (see Section 9.5.1) measure the
gaps in each direction as well as the distribution of gaps across both directions. Typically this is
used at an unsignalized intersection or mid-block crossing location to determine if the addition of
a raised median to provide a pedestrian refuge island will provide adequate crossing opportunities
for pedestrians. The total (combined direction) gap study (see Section 9.5.2) measures the
duration of gaps across both directions of vehicular travel. This is typically used for pedestrian
crossings without median refuge islands.
9.5.1 MULTI-DIRECTION GAP STUDY
(1)
The standard Gap Study procedure provided in the electronic traffic data collectors such as the
JAMAR Technologies TDC-8 or TDC-12 traffic data collectors must be used to perform multidirection Gap Studies. The multi-direction Gap Study procedure is detailed in the respective
User’s Manual for the TDC-8 or TDC-12 electronic traffic data collector.
(2)
Preferably, the study interval should be set to 5 minutes at the beginning of the study to better
facilitate the determination of adequate gaps per 5-minute period (per the WYDOT Pedestrian
and School Crossing Traffic Control Manual, 2003). If the study is performed with shorter
intervals, the final analysis can use longer intervals. On the other hand, the final analysis cannot
be performed on intervals less than those set during the initial study. When printing the study
data, only one direction at a time or the combined direction can be selected in the Gap Print Setup
screen or the results will be added together resulting in numbers that are higher than actuality.
(3)
Figure 9-2 gives an example of the output from a multi-direction gap study, showing the gaps for
each direction as well as the total (combined direction) gaps.
(4)
For divided roadways with sufficient median width for storage to accommodate two separate
crossings, a multi-direction gap study should be performed so the gap size can be determined for
each direction of vehicular travel.
TRAFFIC STUDIES MANUAL
Page 52
March 9, 2011
Figure 9-2 Example Multi-Direction Gap Study Output
Wyoming Department of Transportation
Traffic Program
Safety & Studies Section
Cheyenne, WY
Intersection: 4th & Hamilton
Counted by: LR
Weather: Cool
Comments: Signal Turned Off
File Name: hamiltongap
Site Code: 00021304
Start Date: 4/31/2009
Page No: 1
Direction: NB 4th St
Start Time
Factor
03:00 PM
03:15 PM
03:30 PM
03:45 PM
Total
Volume
1.0
85
92
123
104
404
Grand Total
Total %
404
Start Time
Factor
03:00 PM
03:15 PM
03:30 PM
03:45 PM
Total
Volume
1.0
73
67
103
78
321
Grand Total
Total %
2-3
1.0
7
9
13
6
35
4-5
1.0
7
11
14
10
42
6-7
1.0
7
6
10
6
29
8-9
1.0
5
7
9
0
21
10 - 11
1.0
4
11
5
6
26
12 - 13
1.0
3
2
1
5
11
14 - 15
1.0
6
3
3
5
17
16 - 17
1.0
0
3
3
1
7
18 - 19
1.0
2
3
1
1
7
20 - 21
1.0
3
1
1
1
6
22 - 23
1.0
1
2
0
2
5
24 - 25
1.0
1
0
1
2
4
26 - 27
1.0
0
1
1
1
3
28 - 29
1.0
2
1
0
2
5
>29
1.0
2
2
3
3
10
Int. Total
Average
50
62
65
51
228
8-9
8-9
6-7
10 - 11
8-9
42
18.4
29
12.7
21
9.2
26
11.4
11
4.8
17
7.5
7
3.1
7
3.1
6
2.6
5
2.2
4
1.8
3
1.3
5
2.2
10
4.4
228
8-9
2-3
1.0
1
1
2
3
7
4-5
1.0
7
7
11
6
31
6-7
1.0
9
4
7
7
27
8-9
1.0
6
10
6
5
27
10 - 11
1.0
5
3
3
3
14
12 - 13
1.0
0
4
8
6
18
14 - 15
1.0
3
2
4
5
14
16 - 17
1.0
2
5
3
3
13
18 - 19
1.0
0
4
2
1
7
20 - 21
1.0
2
2
3
1
8
22 - 23
1.0
0
0
0
2
2
24 - 25
1.0
1
1
2
0
4
26 - 27
1.0
0
0
0
1
1
28 - 29
1.0
1
2
0
1
4
>29
1.0
7
3
2
5
17
Int. Total
Average
44
48
53
49
194
8-9
10 - 11
10 - 11
12 - 13
10 - 11
321
7
3.6
31
16.0
27
13.9
27
13.9
14
7.2
18
9.3
14
7.2
13
6.7
7
3.6
8
4.1
2
1.0
4
2.1
1
0.5
4
2.1
17
8.8
194
10 - 11
Start Time
Factor
03:00 PM
03:15 PM
03:30 PM
03:45 PM
Total
Volume
1.0
158
159
226
182
725
2-3
1.0
11
12
22
11
56
4-5
1.0
11
19
22
18
70
6-7
1.0
11
11
10
15
47
8-9
1.0
11
7
6
4
28
10 - 11
1.0
6
10
2
8
26
12 - 13
1.0
4
6
0
3
13
14 - 15
1.0
2
1
3
3
9
16 - 17
1.0
1
3
2
1
7
18 - 19
1.0
1
1
2
1
5
20 - 21
1.0
0
1
0
0
1
22 - 23
1.0
1
1
0
2
4
24 - 25
1.0
1
0
0
2
3
26 - 27
1.0
0
1
0
1
2
28 - 29
1.0
1
0
0
0
1
>29
1.0
0
1
1
1
3
Int. Total
Average
61
74
70
70
275
6-7
6-7
4-5
6-7
6-7
Grand Total
Total %
725
56
20.4
70
25.5
47
17.1
28
10.2
26
9.5
13
4.7
9
3.3
7
2.5
5
1.8
4
1.5
3
1.1
2
0.7
1
0.4
3
1.1
275
6-7
35
15.4
Direction: SB 4th St
Direction: Combined
TRAFFIC STUDIES MANUAL
Page 53
1
0.4
March 9, 2011
9.5.2 TOTAL (COMBINED DIRECTION) GAP STUDY
(1)
A total (combined direction) gap study can be performed with either a conventional stop watch or
with an electronic traffic data collector such as a JAMAR Technologies TDC-8 or TDC-12.
(2)
There are two acceptable ways to measure the length of gaps using JAMAR Technologies TDC-8
or TDC-12 traffic data collectors. They can be used to perform multi-direction gap studies or
total (combined direction) gap studies. If the total gap is the only gap data needed, the traffic data
collector’s standard gap study procedure can be used or the stop sign delay study can be adapted
to measure the available gaps.
(3)
A total (combined direction) gap study can be conducted using the standard gap study procedure
on the electronic traffic data collector by combining the multi-direction data together. This is
accomplished through the PetraPro software analysis program by checking the combined tab
under Combine Groups in the Gap Print Setup window.
(4)
The total number of gaps of each size from the combined groups of the multi-direction study can
then be entered directly into the Total column in the available gap survey portion of the
pedestrian gap study form.
(5)
The stop sign delay study procedure can be adapted to measure and document the length of each
gap over an extended period of time. This is accomplished by marking the beginning of each
gap in traffic by pushing the “Vehicle Stops” button and then pushing the “Vehicle Goes” button
at the end of the gap. This effectively documents the time and duration of each gap measured.
The stop sign delay study procedure is detailed in the respective user’s manual for the TDC-8 or
TDC-12. When the stop sign delay study (used for measuring gaps) is processed through the
PetraPro analysis software, the individual gaps can be displayed, printed and/or exported to a
spreadsheet for transfer to the available gap survey portion of the pedestrian gap study form. To
print the study displaying the individual gaps, make sure the Print Data toggle on the Stop Sign
Delay Print Setup screen is set to Print Data.
TRAFFIC STUDIES MANUAL
Page 54
March 9, 2011
(6)
(7)
Since the software is set up to display information concerning stop delays, the output data from
the stop sign delay study must be reinterpreted for use as a gap study as follows:
(a)
Joined Queue is the time at the beginning of the gap measured
(b)
Released from Queue is the time at the end of the gap measured
(c)
Delay is the length of gap (gap size) in seconds
(d)
Total Vehicle Count and Delayed Vehicle Count should match and is the total number of
gaps measured
(e)
Average Stopped Time is the average gap size
(f)
Maximum Stopped Time is the maximum gap size measured
(g)
Average Queue is a relative indicator of the amount of platooning - the lower the value,
the more platooning (individual gaps are not usually measured between successive
vehicles in platoons)
Figure 9-3gives an example of a gap study that was performed using the stop sign delay study
procedure.
TRAFFIC STUDIES MANUAL
Page 55
March 9, 2011
Figure 9-3 Example of Gap Study Using Stop Sign Delay Procedure
Wyoming Department of Transportation
Traffic Program
Safety & Studies Section
Cheyenne, WY
Intersection: Main St & D St
Counted by: JDT
Weather:
Comments: Gaps on Main St @ D St
L
1
1
1
1
1
1
1
1
1
1
1
1
1
1
1
1
1
1
1
1
1
1
1
1
1
1
1
1
1
1
1
1
1
1
No.
1
2
3
4
5
6
7
8
9
10
11
12
13
14
15
16
17
18
19
20
21
22
23
24
25
26
27
28
29
30
31
32
33
34
(Beginning of Gap)
Joined Queue
3:30:00 PM
3:30:12 PM
3:30:18 PM
3:30:22 PM
3:30:35 PM
3:30:44 PM
3:30:53 PM
3:31:06 PM
3:31:11 PM
3:31:16 PM
3:31:21 PM
3:31:22 PM
3:31:24 PM
3:31:26 PM
3:31:37 PM
3:31:49 PM
3:31:51 PM
3:31:53 PM
3:32:01 PM
3:32:06 PM
3:32:26 PM
3:32:40 PM
3:32:44 PM
3:32:47 PM
3:32:54 PM
3:32:55 PM
3:33:16 PM
3:33:27 PM
3:33:32 PM
3:33:58 PM
3:34:03 PM
3:34:16 PM
3:34:47 PM
3:34:55 PM
(End of Gap)
Released From
Queue
3:30:12 PM
3:30:17 PM
3:30:22 PM
3:30:34 PM
3:30:43 PM
3:30:52 PM
3:31:05 PM
3:31:11 PM
3:31:16 PM
3:31:21 PM
3:31:22 PM
3:31:24 PM
3:31:26 PM
3:31:37 PM
3:31:49 PM
3:31:51 PM
3:31:53 PM
3:32:01 PM
3:32:06 PM
3:32:26 PM
3:32:36 PM
3:32:43 PM
3:32:46 PM
3:32:53 PM
3:32:55 PM
3:33:13 PM
3:33:27 PM
3:33:32 PM
3:33:58 PM
3:34:02 PM
3:34:16 PM
3:34:47 PM
3:34:50 PM
3:35:01 PM
File Name: US26Dstgap
Site Code: 00051000
Start Date: 4/31/2010
Page No: 1
(Gap Size)
Delay
12
5
4
12
8
8
12
5
5
5
1
2
2
11
12
2
2
8
5
20
10
3
2
6
1
18
11
5
26
4
13
31
3
6
Summary Information:
3:30:00 PM - 3:35:00 PM
Total Vehicle Count: (Total Gaps Measured)
Delayed Vehicle Count: (Total Gaps Measured)
Through Vehicle Count:
Average Stopped Time: (Average Gap Size)
Maximum Stopped Time: (Maximum Gap Measured)
Min. Secs. for Delay:
Average Queue: (An indication of amount of platooning)
Queue Density:
Maximum Queue:
Delay in Vehicle Hour:
Total Delay:
Lane 1 Main at D
34
34
0
8.24
31
0
0.93
1.00
1
0.93
280
TRAFFIC STUDIES MANUAL
Page 56
March 9, 2011
9.5.3 AVAILABLE GAP SURVEY
(1)
The number of adequate gaps for pedestrians to cross the roadway can be determined based on
the calculation of the minimum adequate gap (see Section 9.4) and the measurement of actual
gaps available for the crossing location being studied.
(2)
To complete the available gap survey portion of the pedestrian gap study form, note the beginning
and ending times and total duration of the study in minutes.
(3)
Place a tick mark in the tally column corresponding to the length of gap measured. Gaps
measured by a stop watch are entered directly into the form as they are measured. Gaps measured
by an electronic traffic data collector must be downloaded and then transferred to the form.
(4)
Gaps less than the minimum adequate gap do not need to be included on the form; however,
documentation of the availability of gaps that are within a few seconds of the minimum adequate
gap can be used for the consideration of possible roadway geometric changes that would reduce
the crossing distance (e.g., bulb-out curb extensions or narrower lanes) or other measures to
reduce the minimum adequate gap time needed for a pedestrian to cross the roadway.
(5)
Gaps that are more than twice as long as the minimum adequate gap can be counted as two or
more gaps that are longer than the minimum adequate gap. For example, if the minimum
adequate gap is 20 seconds, a gap of 43 seconds can be broken into one 20-second gap and one
23-second gap for purposes of the available gap survey.
(6)
The tally marks are then totaled for each gap size greater than the minimum acceptable gap. The
sum of these totals is the number of gaps of sufficient length to accommodate the crossing of 85%
of the pedestrian groups using the crossing at a day and time and under the conditions similar to
those of the study.
(7)
The total time of all adequate gaps is then determined by multiplying the gap size by the total
number of gaps of that size. The sum of these totals is the total amount of time available (t) for
pedestrians to cross the roadway.
(8)
Pedestrian Delay can be calculated using the following equation:
Equation 9-2
100
Where:
(9)
D
T
t
=
=
=
Pedestrian Delay (expressed as % delayed)
Total time of study, in seconds (Duration x 60)
Total time of all Adequate Gaps, in seconds
The average number of adequate gaps per five-minute period is used in determining the possible
need for various pedestrian and school crossing traffic controls. It can be calculated using the
following equation:
Equation 9-3
⁄5
Where:
(10)
P
Duration
=
=
Number of Adequate Gaps per 5-minute period
Total time of study, in minutes
Figure 9-1gives an example of a completed pedestrian gap study form, showing the completed
available gap survey with the total adequate gaps, percent pedestrian delay and average number
of gaps per 5-minute period.
TRAFFIC STUDIES MANUAL
Page 57
March 9, 2011
(This page intentionally left blank)
TRAFFIC STUDIES MANUAL
Page 58
March 9, 2011
CHAPTER 10 – SIGNAL OPERATIONS STUDIES
10.1 PURPOSE
Once an engineering study has been performed and the installation of a traffic control signal has been
determined to be justified, many decisions must be made for its proper design and operation. The proper
design and operation of a traffic control signal is crucial to the safety and efficiency of the intersection
once it is installed. The operational parameters of the signal should be determined prior to the design of
the signal, and should be included in the Traffic Signal Reconnaissance Report. The primary operational
parameters of an intersection traffic control signal consist of:
• Controller phasing including provisions for pedestrians
• Pretimed versus actuated control
• Local detection alternatives
• Isolated versus system operation (coordination)
• Use of flashing operations
10.2 CONTROLLER PHASING
(1)
The phasing selected for implementation at a given intersection should consider the roadway
volumes, amount of turning traffic, pedestrian activity and geometric conditions. Phase sequence
plans range from relatively simple two-phase to phasing plans utilizing one or more left-turn
and/or right-turn movements to phasing plans utilizing exclusive vehicle and/or pedestrian
phases.
(2)
As a general rule, the number of phases should be held to a minimum.
(3)
When determining the phasing to be used at a traffic control signal, both vehicular and pedestrian
movements must be considered. For pedestrian movements, whether or not to provide pedestrian
indications at the intersection is the first decision. If no pedestrian indications are provided, any
permitted pedestrian movements are controlled by the vehicular signal indications.
(4)
For vehicular movements, whether or not to provide separate left-turn or right-turn phases is the
first decision. If left-turn and/or right-turn phases are to be provided, decisions concerning the
specific operation must follow. These include deciding which approaches will have turn phases,
whether the phases will operate as protected-only mode, protected/permissive mode or variable
mode and whether the turn phases will be operated as leading or lagging.
(5)
The simplest traffic control signal phase operation is commonly called two-phase operation. In
this operation, traffic on one street is assigned the right-of-way during one of the phases and
traffic on the other street is assigned the right-of-way during the second phase. If pedestrian
signal heads are provided at the intersection, Walk and flashing Don’t Walk indications for
pedestrians crossing a street are simultaneously displayed with the adjacent vehicular indications.
Drivers making left turns may do so but must first wait for an adequate gap in oncoming traffic
and also must yield to any pedestrians in the crosswalk which they will be turning across (all left
turns are made in the permissive only mode).
(6)
Two-phase operation may be used where separate turn lanes exist or where turning and through
movements are made from a share-use lane. Two-phase operation functions most effectively
when there are relatively few left turns, where there are sufficient adequate gaps in oncoming
traffic and adjacent pedestrian movements to accommodate the volume of left turns being made,
and where there are minimal conflicts between pedestrians and turning vehicles.
TRAFFIC STUDIES MANUAL
Page 59
March 9, 2011
10.3 LEFT-TURN OPERATION
Left turns at signalized intersections can be operated in one of several modes:
Permissive only.
(1)
When permissive only left-turn mode is used, no left-turn arrows are
provided. Left turns are made during the circular green indication when gaps in opposing traffic
permit.
(2)
Protected only left-turn phasing.
Protected-only left-turn phasing is a left-turn
operation in which a protected (green arrow) interval is provided and left turns may be made only
when the green arrow is displayed. Since no left-turn demand is accommodated during the
through-green interval, protected-only mode left-turn phasing requires longer left turn phases,
thus increasing delays to the left-turning vehicles (there are fewer opportunities to turn left) as
well as the conflicting through phases (through traffic has to wait longer for the left turn
movements to clear), and that drives up the minimum cycle length needed to serve all of the
traffic movements at the intersection. This type of left-turn phasing is the most restrictive and
causes the most over-all delays and should be limited to intersections where geometric conditions
or extremely high opposing volumes do not allow permissive left-turn movements to be made
safely. It is typically reserved for intersections that have opposing dual left-turn lanes without
sufficient positive offset for drivers of left-turning vehicles to see past vehicles in the opposing
left turn lanes, or to locations where there has been a documented high crash rate associated with
left turn crashes involving left turns being made during the permissive mode. Protected-only left
turn phasing should not be used for approaches with a shared-use left-turn and through movement
lane unless the left-turn and through movement operate simultaneously.
(3)
Protected/permissive left-turn phasing.
Protected/permissive left-turn phasing is a
left-turn operation in which both a protected (green arrow) interval and a permissive (circular
green or flashing yellow arrow) interval is provided. This operation is the preferred mode of leftturn phasing when left-turn phasing is warranted.
10.4 LEFT-TURN PHASING CRITERIA
The following criteria should be followed when deciding where separate left-turn phasing should be used:
(1)
(2)
Volumes:
(a)
The volumes considered include the number of vehicles per hour make the left turn
movement and the number of opposing (conflicting) through and right-turn movements
during the same hour. Left-turn phasing may be warranted if:
(b)
(c)
There are at least 100 left turns during the peak hour; and
(d)
There are more than two left-turn vehicles per cycle per approach at the end of the
through movement green during the peak hour.
The number of left turns multiplied by the number of opposing through and right turns
during the peak hour exceeds 100,000 on a 4-lane street, or 50,000 on a 2-lane street; and
Delay:
(a)
Excessive delays experienced by left-turning vehicles may warrant left-turn phasing.
Left-turn phasing may be warranted if:
(b)
There is at least 2.0 vehicle-hours of left-turn delay during the peak hour on the approach;
and
(c)
(d)
There are at least two left turns per cycle during the peak hour; and
The average delay per left-turning vehicle exceeds 35 seconds.
TRAFFIC STUDIES MANUAL
Page 60
March 9, 2011
(3)
Crashes:
(a)
A high frequency of crashes between left-turning vehicles and opposing through or rightturning vehicles may warrant left-turn phasing. Left-turn phasing may be warranted if:
(b)
On one approach there have been 4 left-turn crashes in 1 year or 6 left-turn crashes in 2
years.
(c)
On both (opposing) approaches there have been 6 left-turn crashes in 1 year or 9 left-turn
crashes in 2 years.
10.5 PROTECTED/PERMISSIVE LEFT-TURN PHASE CONTROL
(1)
Left turns that are provided with protected/permissive left-turn phasing can be controlled by
either 5-section (doghouse) left-turn signal faces, or with 4-section all-arrow signal faces.
(2)
All new installations of protected/permissive left turn phasing where separate left turn lanes are
provided will utilize the 4-section all-arrow signal faces.
(3)
All protected/permissive left-turn phasing where the left turns are being made from a shared-use
left-turn and through lane will utilize the 5-section left-turn signal faces.
(4)
All protected/permissive left turn phases controlled with 4-section all-arrow signal faces will be
lagging phases unless the adjacent through phases are coordinated with other signals on the
highway corridor and leading one or both of the left-turn phases improves the two-way
progression of traffic from one signal to the next.
(5)
All protected/permissive left turn phases controlled with 5-section left-turn signal faces will be
leading phases unless there is no opposing left turn movement (e.g., at a T-intersection or at the
intersection with a one-way street) and the adjacent through phases are coordinated with other
signals on the highway corridor and lagging the left-turn phase improves the two-way progression
of traffic from one signal to the next.
10.6 PEDESTRIAN PHASES
For pedestrian phases, the first decision is whether or not to provide pedestrian indications at the
intersection, and which (if any) potential pedestrian crossings will be controlled with pedestrian
indications.
(1)
All traffic signals in central business districts shall be equipped with pedestrian indications.
(2)
Any traffic signal that was installed based on the Pedestrian Volume warrant (Warrant 4) or the
School Crossing warrant (Warrant 5) shall be equipped with pedestrian indications.
(3)
Any traffic signal that is located on a designated school walk route shall be equipped with
pedestrian indications to control the crossing of any approach leg(s) that include the school walk
route.
(4)
Signalized intersections that have pedestrian facilities (sidewalks and ADA ramps) provided on
both sides of the intersection, to allow for the continuation of the pedestrian walkway, should be
equipped with pedestrian indications unless a pedestrian study indicates that there are less than 5
pedestrians using the crossing per hour during the peak hour of pedestrian crossing activity.
(5)
Appropriate pedestrian phase timings and operation are outlined in Chapter VI of the WYDOT
Electrical Traffic Control Manual, 2006.
10.7 PEDESTRIAN CROSSING DISTANCE MEASUREMENT
(1)
The pedestrian clearance time at all traffic signals must be sufficient to clear the pedestrian to the
far side of the traveled way. The measurement of the crossing distance is critical to the proper
TRAFFIC STUDIES MANUAL
Page 61
March 9, 2011
timing of the pedestrian clearance time. The crosswalk distance can vary greatly considering the
many variables that might be present at the intersection, such as turn lanes, parking lanes and
corner radii. There are essentially four conditions that will be encountered when measuring the
crosswalk. They are:
(2)
(a)
There is no parking lane or right turn lane. In this case, measure to the projected parallel
edge line or lip of curb if no edge line.
(b)
There is a dedicated and well used parking lane. In this case, measure to the projected
parallel parking or edge line or to the inside edge of the parked vehicles if no markings
exist.
(c)
There is an area provided for parking, but due to minimal parking activity, that area is
typically used by vehicles as a de facto right turn lane. In this case, measure to the
projected parallel lip of curb
(d)
There is a dedicated right turn lane. Measure to the projected parallel edge line or lip of
curb if no edge line.
Figure 10-1 is an intersection diagram that was developed to help simplify/standardize the
process used to measure the crosswalk length. The diagram shows how to measure the crosswalk
length for each of the above conditions. The measurement should start in the center of the
pedestrian ramp (or anticipated beginning point if no ramp) at the lip of curb and proceed in a
counterclockwise direction to the opposite corner, stopping at the point indicated above.
10.8 PRETIMED VERSUS ACTUATED CONTROL
(1)
There are many factors that influence the decision concerning whether a traffic control signal
should operate on a pretimed, semi-actuated or fully-actuated basis. Those factors include:
(a)
(b)
(c)
(d)
Equipment availability
Traffic patterns
Proximity to other traffic control signals
Availability of funds
(2)
Pretimed signals provide a consistent and regularly repeated sequence of signal indications to
traffic, while actuated signals provide at least some signal intervals that fluctuate with traffic
demands. The duration of some but not all phases of semi-actuated signals will fluctuate with
traffic demands, while the duration of all phases of fully-actuated signals will fluctuate with
traffic demands. Pretimed traffic signals are cheaper to install and maintain, but are relatively
inefficient where traffic volumes fluctuate widely and irregularly. Actuated signals are generally
more expensive to install and maintain, but are more efficient because they can respond to greater
variations in traffic. The reduction in motor-vehicle operating costs and possible reduction in
crashes associated with more efficient traffic signal operations will normally offset the added
installation and maintenance costs associated with maximizing the efficiency of the intersection
controls.
(3)
Overall, there are valid considerations for using each of the various control types.
TRAFFIC STUDIES MANUAL
Page 62
March 9, 2011
Figure 10-1 Measuring Pedestrian Crosswalk Lengths
TRAFFIC STUDIES MANUAL
Page 63
March 9, 2011
10.8.1 PRETIMED CONTROL
Pretimed control is best suited to intersections where traffic patterns are either relatively stable or
predictable such that the variations in traffic that do occur can be accommodated by predetermined timing
plans without contributing to unreasonable delays or congestion. Pretimed control may be justified in the
following conditions:
(1)
Two-phase operation at intersections in the central business district of larger cities
(2)
When intersection spacing and traffic speeds are favorable and pretimed signals will provide for
coordinated traffic flow on the street
(3)
When coordination is needed with adjacent signals on two or more intersecting streets such as on
a grid system
(4)
Where there are large and relatively consistent pedestrian volumes present
10.8.2 SEMI-ACTUATED CONTROL
Semi-actuated control is best suited to signalized intersections along a major roadway with relatively
minor cross streets and where the signals are coordinated throughout the day. Semi-actuated control is
also advantageous when intersections are unfavorably located within a progressive pretimed system or
where interruption of the major street traffic is undesirable and must be held to a minimum in frequency
and duration.
10.8.3 FULLY-ACTUATED CONTROL
Fully-actuated control is best suited to isolated signalized intersections that will operate in a free or
isolated (not coordinated with adjacent signals) mode and where approach speeds are greater than 35
mph. It is also appropriate for complex intersections where one or more movements are sporadic or
subject to variations in volume.
10.9 ISOLATED VERSUS SYSTEM OPERATION
(1)
Whether a traffic signal will be operated as part of a system or isolated depends on whether
coordination with other traffic control signals is needed. An isolated traffic control signal is one
in which the signal intervals and/or timing plans operate independently of any other traffic control
signals. System operation is when there is some form of communications system between groups
of traffic control signals used to coordinate the signal intervals.
(2)
The MUTCD recommends that traffic control signals that are within 0.5 miles of one another
along a major route or in a network of intersecting major routes should be coordinated. Although
the MUTCD references a 0.5 mile separation, effective coordination can occur where signals
exceed a mile apart. Such coordination is especially effective where roadside friction is minimal,
speeds are fairly high and the traffic control signals are visible for some distance in advance of
the intersection.
(3)
Even if it is not possible to identify a platoon at a downstream intersection, it is desirable to
attempt to coordinate signalized intersections whenever possible.
10.10 USE OF FLASHING OPERATION
(1)
There are a number of situations when it may be appropriate to operate a traffic signal in the
flashing mode. Both pretimed and actuated signals may be operated in the flashing mode. A
common use of planned flashing operation is at night or other times during periods of low traffic
volumes. Flashing operation based on low traffic volumes typically occurs on a daily or
repetitive basis. Operating a traffic control signal in the flashing mode when traffic volumes are
low offers a number of potential benefits to the agency and to motorists including:
(a)
Reduced stops and delay to major-street traffic
TRAFFIC STUDIES MANUAL
Page 64
March 9, 2011
(b)
(c)
(d)
Reduced delay to cross-street traffic
Reduction in fuel consumption due to the reduced delay
Reduction in electrical consumption by the traffic control signal equipment
(2)
When operated in flashing mode, flashing yellow indications should be used for the major-street
and flashing red indications should be used for the minor-street, provided that minor-street drivers
have an adequate view of approaching major-street traffic.
(3)
All-red flashing operation may be appropriate at multi-legged intersections, intersections with
low but balanced traffic volumes and intersections in which drivers’ views of approaching traffic
are limited.
(4)
When a traffic control signal is operated in the flashing mode as part of the planned signal
operation, the crash patterns should be monitored. Signal operation should be changed to stopand-go operation if the crash pattern or severity increases. The following criteria can justify
eliminating the flashing operation:
(a)
(b)
(5)
3 or more right-angle crashes in one year that occur during flashing operation
5 or more right-angle crashes in two years that occur during flashing operations
Fully-actuated signals that have protected-only left turn phasing should not be operated in timeof-day flash.
10.11 OPERATIONAL REVIEWS
Whenever a new traffic control signal is installed, or an existing signal is significantly modified, an
operational review should be performed on the signal to verify that it is operating as intended. The
operational review should be conducted by the District Traffic Engineer or Safety and Studies Section
personnel as soon after all work is completed as possible (normally within 30 days).
10.11.1 SIGNALIZED INTERSECTION CHECKLIST
An operational review consists of verifying that the traffic signal controls traffic as intended, that all of
the signal equipment is functioning properly, and that all associated signs and markings are installed
properly. An Operational Review Signalized Intersection Checklist (Form TR-18) has been developed to
assist with the performance of operational reviews on new or significantly modified traffic control
signals. Figure 10-2 gives an example of a completed operational review checklist.
10.11.2 LEFT-TURN PHASE OPERATIONAL REVIEW
Whenever protected/permissive left turn phasing using 4-section all-arrow left turn signal faces is
installed at an intersection, either in a new signal installation or as a retrofit to an existing signal, a left
turn operational review should be conducted to verify the proper operation of the left-turn phases. The
detector settings and phase timings should be set to minimize the unnecessary activation of the left-turn
phases while still adequately serving all left-turning vehicles. A Left-Turn Operational Review form
(Form TR-19) has been developed to assist with the performance of left-turn operational reviews. Figure
10-3gives an example of a completed left turn operational review.
TRAFFIC STUDIES MANUAL
Page 65
March 9, 2011
Figure 10-2 Example of an Operational Review Checklist
TRAFFIC STUDIES MANUAL
Page 66
March 9, 2011
Figure 10-3 Example of a Left Turn Operational Review
TRAFFIC STUDIES MANUAL
Page 67
March 9, 2011
(This page intentionally left blank)
TRAFFIC STUDIES MANUAL
Page 68
March 9, 2011
CHAPTER 11 – CURVE ADVISORY SPEED STUDY
11.1 PURPOSE
(1)
The average crash rate for horizontal curves is about three times the average crash rate for
highway tangents (Glennon et al., 1985). The most prevalent types of crashes that occur on
horizontal curves are lane departure-type crashes including run-off-road, side-swipe meeting and
head-on crashes. The potential for crashes is significantly increased when the safe and
comfortable travel speed along a curve is below the posted speed along a tangent segment of the
highway. This potential tends to increase as the distance upstream of the curve to a previous
curve of equal or lower safe and comfortable travel speed increases.
(2)
The primary strategy used by traffic engineers to minimize crashes on horizontal curves is to
provide advance warning of unexpected changes in horizontal alignment. Motorists are normally
advised of maximum recommended speeds along curves through the use of Horizontal Alignment
signs and Advisory Speed plaques.
(3)
According to the MUTCD, the advisory speed shall be determined by an engineering study.
Therefore, the establishment of advisory speeds on Wyoming state highways must follow the
standard procedures developed and adopted by WYDOT. All field work used for determining the
advisory speeds must be performed under the supervision of an engineer.
(4)
This chapter sets forth the procedures to be used to establish the advisory speed on horizontal
curves in Wyoming. The established advisory speed must be both realistic and safe, meeting
drivers’ expectations for a given set of geometric, operational, and environmental conditions.
The posted advisory speed shall be a multiple of 5 mph.
(5)
There are two acceptable methods for determining the advisory speed on an existing horizontal
curve: use of the design speed equation and the ball-bank indicator method. The most common
method is the ball-bank indicator method, but for newer roadways where the curve radius and
super elevation are known, the design speed equation can be used effectively.
(6)
Table 11-1shows the maximum ball-bank reading and lateral acceleration to be used when
determining the advisory speed on curves. These readings are the usually accepted limits beyond
which riding discomfort will be excessive and loss of vehicle control might occur. The ball-bank
readings are read directly from the ball-bank indicator while traveling the curve at a set speed.
The lateral acceleration is the same value that is used in the design speed equation (see Equation
11-1).
Table 11-1 Recommended Criteria for Curve Advisory Speed Determination
Speeds (mph)
Ball Bank Reading
Lateral Acceleration (g)
≤ 25
12o
0.21
> 25
10o
0.17
(Source: Adapted from Carlson and Mason, 1999)
(7)
It is important to note that the advisory speed criteria are based on driver comfort more than
safety. A sufficiently skillful driver may be able to traverse a curve on dry pavement at a speed
considerably higher than the advisory speed without exceeding the friction capabilities of the
pavement. However, most drivers would choose not to drive at a higher speed because they
would experience uncomfortable levels of lateral acceleration.
TRAFFIC STUDIES MANUAL
Page 69
March 9, 2011
11.2 USE OF THE DESIGN SPEED EQUATION
(1)
The design of highway curves is based on the relationship between design speed, radius of
curvature, superelevation, and side friction (centripetal acceleration). The design speed equation
can be used to calculate the advisory speed for a curve if the curve radius and superelevation are
known. The side friction factor is the same as lateral acceleration (measured in “g’s”), and is
based on driver comfort. For the establishment of advisory speeds on curves, the lateral
acceleration rates contained in Table 11-1should be used. The mathematical relationship between
these variables is given by the equation:
Equation 11-1
15 0.01
Where:
(2)
V
R
e
=
=
=
=
Design speed (mph)
Curve radius (feet)
Superelevation (%)
Side friction factor
The rounded advisory speeds calculated for various combinations of superelevation and curve
radius are shown in Table 11-2.
Table 11-2 Rounded Passenger Car Advisory Speeds (mph)
Superelevation (%)
Radius (ft)
-2
2
4
6
8
100
15
20
20
20
20
200
25
25
25
25
25
400
30
35
35
35
40
600
35
40
45
45
45
800
40
50
50
55
55
1000
45
55
55
60
60
1200
50
60
60
65
65
1400
55
65
65
70
70
Based on Design Speed Equation and Table 11-2 Side Friction Factors
(3)
In some cases, the curve radius and superelevation can be taken from as-built plans for a roadway
that has been constructed fairly recently. However, it must be considered that a roadway that has
been in service for many years may have been resurfaced one or more times since original
construction. As a result of resurfacing, the superelevation of the curve may have changed, and
the original plans may no longer be representative of field conditions. In other cases, the original
plans may no longer be available.
(4)
The WYDOT Highway Features File (HFF) contains horizontal alignment data, as taken from asbuilt plans, for all State Highways in Wyoming. The HFF data includes the reference marker of
the middle of the curve (PI), the curve length and the change in direction or delta of the curve.
The radius of the curve can be calculated from the curve length and delta using the following
equation:
TRAFFIC STUDIES MANUAL
Page 70
March 9, 2011
Equation 11-2
180
∆
Where:
(5)
R
L
∆
=
=
=
=
Curve radius (feet)
Curve length (feet)
Change in direction (degrees)
Pi (approximately 3.14)
WYDOT’s Pavement Management System (PMS) uses Pathways Services, Inc. and Pathview II
software to gather and maintain state of the art pavement condition data and video images of the
State Highway System. The Pathview II data contains multiple sensor readings along the
roadway including the cross slope of the roadway, recorded in decimal degrees, throughout the
roadway system. The superelevation on a given curve can be determined by Equation 11-3.
Equation 11-3
tan
100%
Where:
e
CS
=
=
Superelevation (%)
Cross slope on subject curve from Pathview II
11.3 BALL-BANK INDICATOR METHOD
(1)
The ball-bank indicator method is the most common and practical way of determining advisory
speeds on older existing curves. The ball-bank indicator consists of a curved glass tube which is
filled with a liquid. A weighted ball floats in the glass tube. The ball-bank indicator is mounted
in a vehicle, and as the vehicle travels around a curve the ball floats outward in the curved glass
tube. The movement of the ball is measured in degrees of deflection, and this reading is
indicative of the combined effect of superelevation, lateral (centripetal) acceleration, and vehicle
body roll as shown in Figure 11-1. The amount of body roll varies somewhat for different types
of vehicles, and may affect the ball-bank reading by up to 1o, but generally is insignificant if a
standard passenger car is used for the test. During testing, the device is mounted in a vehicle and
ball-bank readings are taken at different speeds along a curve to determine the comfortable
traveling speed.
Figure 11-1 Factors Affecting Ball Bank Indicator Reading
TRAFFIC STUDIES MANUAL
Page 71
March 9, 2011
(2)
In order to negate any errors caused by vehicle body roll, when using this technique, it is best to
use a typical passenger car rather than a pickup truck, van, or sports utility vehicle.
(3)
The equipment and personnel needed to perform a curve advisory speed study using the ball-bank
indicator method consists of a test vehicle (intermediate size), driver, observer (if necessary), ball
bank indicator (Slope Meter safe curve indicator), Distance Measuring Instrument (DMI), and the
Curve Advisory Speed Study form (Form TR-16) to input data. Figure 11-2 is an example of
how the test vehicle is equipped to perform a curve advisory speed study.
Figure 11-2 Example of Equipment Used for the Ball-bank Indicator Method
(Source: Stephen Ford, MCDOT)
(4)
To ensure proper results, it is critical that the following steps be taken before starting test runs
with the ball-bank indicator:
(a)
(b)
(c)
Inflate all tires to uniform pressure as recommended by the vehicle manufacturer
Calibrate the test vehicle’s DMI
Zero the ball-bank indicator
(5)
The vehicle’s DMI should be calibrated to the manufacture’s recommendations to ensure accurate
test results. If the DMI used cannot display both speed and distance simultaneously, once the
DMI is properly calibrated, the vehicle’s speedometer should be correlated to the DMI speed
readings at each of the test speeds (i.e., every five mph increment over 20 mph). If there are any
discrepancies, note the discrepancies so the driver can drive the vehicle at the correct speeds
when doing the study (e.g., if the speedometer reads 48 mph when the DMI reads 50 mph, then
drive the vehicle at 48 mph according to its speedometer when testing the curve for ride comfort
at 50 mph).
(6)
The ball-bank indicator must be mounted in the vehicle so that it displays a 0o reading when the
vehicle is stopped on a level surface. The positioning of the ball-bank indicator should be
checked before starting any test. This can be done by stopping the car so that its wheels straddle
the centerline of a two-lane highway on a tangent alignment. In this position, the vehicle should
be essentially level, and the ball-bank indicator should give a reading of 0o. It is essential that the
driver and recorder be in the same position in the vehicle when the ball-bank indicator is set to a
0o reading as they will be when the test runs are made because a shift in the load in the vehicle
can affect the ball-bank indicator reading.
TRAFFIC STUDIES MANUAL
Page 72
March 9, 2011
(7)
The ball-bank indicator method is normally a two-person operation, with one person to drive and
the other to record curve data and the ball-bank readings, especially if advisory speeds are being
determined for a series of curves.
(8)
Vehicle movement around a curve causes the ball to swing from the zero position (e.g., vehicle
movement to the left causes the ball to swing to the right). The faster the vehicle moves around
the curve or the sharper the curve, the greater the distance the ball swings away from the zero
degree position. Superelevation, however, tends to bring the ball back to the zero position. The
net result is the indicator reading in degrees of deflection (see Figure 11-3).
Figure 11-3 Example Ball Bank Indicator Readings
(Source: FDOT, Manual on Uniform Traffic Studies)
(9)
Testing should start well in advance of the curve being evaluated so the driver can reach the test
speed at a distance of at least 1/4 mile in advance of the beginning of the curve. The first trial run
should be made at a speed (multiple of 5 mph) somewhat below the anticipated advisory speed.
The driver should enter the curve at the predetermined test speed and should try to maintain the
assumed speed throughout the curve. The path of the car should be maintained as nearly as
possible in the center of the inner-most lane (the lane closest to the inside edge of the curve) in
the direction of travel. If there is more than one lane in the direction of travel, and these lanes
have differing superelevation rates, drive in the lane with the lowest amount of superelevation.
Subsequent trial runs are conducted at 5 mph speed increments.
(10)
On each test run, the driver should maintain the same speed throughout the length of the curve.
Because it is often difficult to drive the exact radius of the curve and keep the vehicle at a
constant speed (cruise-control helps to maintain a constant speed), the curve should be driven a
number of times until at least two matching ball bank readings (i.e., number of degrees) are
obtained for each direction of travel. Testing should be conducted separately for each direction of
travel.
(11)
On each test run, the recorder must carefully observe the position of the ball throughout the
length of the curve and record the deflection reading that occurs when the vehicle is as nearly as
possible driving the exact radius of the curve.
TRAFFIC STUDIES MANUAL
Page 73
March 9, 2011
(12)
If the reading on the ball-bank indicator for a test run does not exceed an acceptable level (as
indicated by the recommended criteria in Table 11-1 then the speed of the vehicle is increased by
5 mph and the test is repeated. The vehicle speed is repeatedly increased in 5 mph increments
until the ball-bank indicator reading exceeds an acceptable level. The curve advisory speed is set
at the nearest 5 mph incremental speed that is closest to where the ball-bank indicator reading
reaches the maximum acceptable level.
11.4 ESTABLISHING CURVE ADVISORY SPEEDS
(1)
Using either of the two methods noted above (design speed equation or ball-bank indicator)
should result in the same advisory speed for a curve. The advisory speed for the curve should be
set at the 5-mph increment nearest to this maximum comfortable speed. The advisory speed to be
posted should not be arbitrarily reduced below the comfortable speed determined using these
methods, because an unrealistically low advisory speed will lose credibility among drivers, and
create inconsistencies that may lead drivers into traveling at too high a speed through other
curves.
(2)
In some cases, there may be other factors that influence the selection of the advisory speed in
addition to the comfortable operating speed on the curve. Available stopping sight distance
through the curve and sight distance from intersections or driveways within the curve (see
Chapter 6) or deceleration distance (on an exit ramp) may, in some cases, require an advisory
speed somewhat lower than the comfortable operating speed for the curve.
(3)
Each direction should be checked independently and may be posted with different speeds.
(4)
Advisory speed plaques should be used in conjunction with curve and turn signs when the
advisory speed is below the posted speed limit on the roadway. Advisory speed plaques are only
used in conjunction with appropriate warning signs, and never alone. Turn, Curve, Reverse Turn,
Reverse Curve, and Winding Road signs are used in locations where it is desirable to warn
drivers of changes in the horizontal alignment of the roadway. The MUTCD indicates that the
use of Turn or Reverse Turn signs should be limited to changes in alignment where the advisory
speed is 30 mph or less. The Curve or Reverse Curve signs are intended for use where the
advisory speed is greater than 30 mph.
(5)
Where a Reverse Curve warning sign or a Winding Road warning sign is used, the advisory speed
should be based on the curve with the lowest comfortable operating speed. However, if one curve
in the series has a dramatically lower comfortable speed, it would be desirable to place a separate
warning sign with the appropriate advisory speed for that individual curve.
(6)
Since warning signs are primarily for the benefit of the driver who is unfamiliar with the road, it
is very important that care be given to the placement of such signs. Warning signs should provide
adequate time for the driver to perceive, identify, decide, and perform any necessary maneuver to
safely negotiate the curve. The advance distance for the placement of warning signs is
determined by the posted speed limit on the section of roadway being studied. Once the type of
warning signs has been selected, the proper sign location can be determined. The advance
warning sign placement shall be in accordance Table 2C-4 in the MUTCD.
(7)
Figure 11-4 is an example of a data collection form that can be used to record the results of curve
advisory speed studies.
(8)
Additional information on sign placement and establishing curve advisory speeds is contained in
the Traffic Control Devices Handbook, Chapter 4 – Regulatory and Warning Signs, Pages 107 110. This handbook is available through the Institute of Transportation Engineers, 1099 14th
Street, NW, Suite 300 West, Washington, D.C. 20005-3438.
TRAFFIC STUDIES MANUAL
Page 74
March 9, 2011
11.5 USE OF CURVE ADVISORY SPEED STUDY FORM
(1)
Enter the location so that the curve study location is thoroughly identified. The highway route
number(s) and/or name, county, and maintenance section number should be included.
(2)
Enter the posted speed limit, pavement condition, date of study, vehicle make model and year,
and the people performing the study (i.e., driver and recorder) in the appropriate spaces. Include
any information that may need to be considered in addition to data being collected in the Remarks
area.
(3)
Enter the travel direction of the study vehicle through the curve and the reference markers for the
start and end of the curve.
(4)
Enter the run speeds in 5 mph increments. The first run should be made at a speed that is slightly
lower than the anticipated maximum comfortable speed. For existing curves with posted advisory
speeds, a good rule of thumb is to make the first run at a speed of 5 mph below the existing
advisory speed.
(5)
Enter the degree of deflection shown on the ball-bank indicator as the vehicle passes through the
curve at the initial run speed. If the reading on the first run is significantly less that the respective
threshold reading in Table 11-1, only one run is necessary at that run speed and you can make the
next run at the next higher speed. Once the readings are relatively close to the threshold values,
drive the curve at each run speed up to three times, or until at least two matching ball bank
readings are obtained for each direction of travel.
(6)
In the example in Figure 11-4, the first test run was made at 30 mph in the northbound direction,
with a ball-bank indicator reading of 5o. This is well below the suggested criteria of 10o for a
speed of 30 mph. Therefore, on the return pass in the southbound direction, the first run was
made at 35 mph and resulted in a reading of 7o. This is still well below the threshold reading of
10o for speeds greater than 25 mph. Therefore the next run in the northbound direction was made
at 40 mph and resulted in a reading of 9o, which is close to the threshold value. The return pass in
the southbound direction was also made at 40 mph and gave a reading of 10o. Test runs at 40
mph were repeated in each direction until there were two readings of 10o in each direction. These
are the highest readings attained without exceeding the suggested criteria of 10o for a speed
greater than 25 mph as shown in Table 11-1. This study would result in an advisory speed of 40
mph for both directions of travel for this curve.
(7)
In the example, since one run in each direction at 40 mph resulted in a reading of 9o, an additional
run in each direction was made at the next higher run speed of 45 mph to see what readings
would be achieved if the advisory speed were 5 mph higher. Those runs were purely optional.
TRAFFIC STUDIES MANUAL
Page 75
March 9, 2011
Figure 11-4 Example of Curve Advisory Speed Study Form
CURVE ADVISORY SPEED STUDY
ROUTE: Wyo 132
COUNTY: Fremont
SECTION: FR 07A
POSTED SPEED (mph): 65
PAVEMENT CONDITION: Dry
DATE:
VEHICLE: 2007 CHEVROLET IMPALA
DRIVER: Auzqui
RECORDER: Persson
REMARKS: (Example Only)
DIRECTION
OF TRAVEL
REFERENCE MARKER
BALL-BANK READING (DEGREES)
SPEED
(mph)
RUN 1
START
CURVE
END
CURVE
NORTH
13.15
13.54
30
5
SOUTH
13.54
13.15
35
7
NORTH
13.15
13.54
40
SOUTH
13.54
13.15
NORTH
13.15
SOUTH
13.54
TRAFFIC STUDIES MANUAL
RUN 2
RUN 3
9
10
10
40
10
9
10
13.54
45
12
13.15
45
13
Page 76
March 9, 2011
11.6 TRUCK ADVISORY SPEEDS
(1)
Large trucks, tank trailers and truck freight trailers have a higher center of gravity and are more
susceptible to rollover crashes on a sharp curve. The loop ramps on freeway interchanges and
direct freeway to freeway connections are sometimes subject to truck rollover problems. The
potential for such crashes may increase because of the radius of horizontal curvature, inadequate
deceleration length or deficient specific signing. The appropriate warning signs for truck rollover
concerns require more than just determination of curve advisory speeds for passenger vehicles as
previously discussed.
(2)
When a truck rollover problem exists, the use of truck rollover signing with a truck advisory
speed should be considered. It is suggested that the engineering study for truck rollover warning
signs address the following considerations:
(a)
Speed data and advisory speed determinations.
(b)
Traffic characteristics.
(c)
Roadway geometrics.
(d)
Recommended traffic control devices.
(3)
Truck rollover theoretically can occur when the lateral acceleration exceeds 0.30g, but no
calculated lateral acceleration less than 0.35g has been determined in any truck rollover crashes.
It is recommended that any posted advisory speed for the truck rollover signing should reflect a
ball-bank reading of 10 degrees (side friction factor of 0.17g) for all advisory speeds in order to
provide a reasonable factor of safety. The use of the 0.17g side friction value is about half the
critical side friction factor and accommodates those occasions where the truck may exceed the
posted truck advisory speed or the truck travels a curve radius that is less than the actual roadway
curvature.
(4)
The MUTCD provides a number of other devices that can be used in conjunction with
Horizontal Alignment signs and Truck Rollover signs to address truck rollover
consideration such as:
Chevron Alignment signs (W1-8)
(a)
(b)
Combination Horizontal Alignment/Advisory Speed sign (W1-1a and W1-2a)
One Direction Large Arrow sign (W1-6)
(c)
(d)
Advisory Exit and/or Advisory Ramp Speed Signs
(5)
Additionally, the warning can be enhanced with enlarged signing, a TRUCK header panel,
flashing beacons and changeable message signs.
TRAFFIC STUDIES MANUAL
Page 77
March 9, 2011
(This page intentionally left blank)
TRAFFIC STUDIES MANUAL
Page 78
March 9, 2011
CHAPTER 12 – NO-PASSING ZONE STUDY
12.1 PURPOSE
(1)
The Department of Transportation is authorized by Wyoming Statute 31-5-207 to determine those
portions of any highway under its jurisdiction where overtaking and passing or driving to the left
of the roadway would be especially hazardous. Those portions of the highway shall be marked
with no-passing zone markings.
(2)
The no-passing areas include vertical and horizontal curves, railroad grade crossings, narrow
bridges, intersections, transitions to and from multi-lane sections of roadway, and other locations
where passing must be prohibited because of inadequate sight distance or other special
conditions.
(3)
The requirements and details for the marking of no passing zones are contained in Chapter III of
the WYDOT Pavement Marking Manual, 2002. No-passing zones that are not governed by
passing sight distance (e.g., railroad grade crossings, narrow bridges, intersections, or transitions
to and from multi-lane sections) shall be established in accordance with that manual. All nopassing zones governed by passing sight distance (i.e., horizontal and vertical curves) shall be
established in accordance with the guidelines provided in this chapter.
(4)
The purpose of a no-passing zone study is to establish locations where it is not safe to pass, and to
mark those locations with no-passing zone markings. Locations that are not striped with nopassing zone markings are not necessarily locations where it is safe to pass, but rather where
motorists may lawfully pass only if they can do so safely.
12.2 NO-PASSING ZONE CRITERIA
(1)
The criteria for checking and establishing no-passing zones in the State of Wyoming shall be the
minimum passing sight distance (see Table 12-1). Minimum passing sight distance represents the
minimum sight distance necessary at the critical position (passing and passed vehicle abreast) to
permit a passing driver to perceive an opposing vehicle at a distance sufficient to allow safe
completion of a passing maneuver.
Table 12-1 Minimum Passing Sight Distance
POSTED SPEED
LIMIT
(mph)
MINIMUM PASSING
SIGHT DISTANCE
(feet)
25
450
30
500
35
550
40
600
45
700
50
800
55
900
60
1000
65
1100
*70
*1200
Use for highways posted 65 mph
TRAFFIC STUDIES MANUAL
Page 79
March 9, 2011
(2)
Passing sight distance on a vertical curve is the distance at which an object 3.5 feet above the
pavement surface can just be seen from a point 3.5 feet above the pavement. Similarly, passing
sight distance on a horizontal curve is the distance measured along the centerline between two
points 3.5 feet above the pavement on a line tangent to the embankment or other obstruction that
cuts off the view on the inside of the curve. Where centerlines are installed and a curve warrants
a no-passing zone, it should be so marked where the sight distance is equal to or less than that
listed in Table 12-1.
(3)
The beginning of a no-passing zone is the point at which the sight distance is less than specified
in Table 12-1. The end of the zone is the point at which the sight distance again becomes greater
than the minimum specified. In no case shall a no-passing zone marking be less than 500 feet in
length. If the actual no-passing distance is less than 500 feet, the additional length of marking
shall be added to the beginning of the zone.
(4)
Where the distance between successive no-passing zones is less than the minimum distance
between no-passing zones as shown in Table 12-1, the appropriate no-passing marking (one
direction or two directions) should connect the zones.
Table 12-2 Minimum Distance between No-passing Zones
POSTED
SPEED LIMIT
(mph)
25
DISTANCE
(feet)
280
30
320
35
370
40
410
45
500
50
550
55
650
60
700
65
800
*70
*850
* Use for highways posted 65 mph
12.3 ESTABLISHING NO-PASSING ZONES
(1)
WYDOT policy for the establishment of no-passing zones on the State highway system is to use
the minimum passing sight distance associated with the posted speed limit on the roadway being
checked, expect on highways that are posted at 65 mph, where the 70 mph sight distance criteria
will be used.
(2)
All permanent no-passing zones on all highways under the jurisdiction of WYDOT shall be
determined by the Department’s Traffic Program using the Department’s Novastar II Range
Track Survey System.
(3)
No-passing zones on all paved highways under County jurisdiction that have been rebuilt using
funds administered by WYDOT shall be determined by the Department’s Traffic Program using
the Department’s range tracking system. The request for range tracking shall be in writing from
the proper County authority.
TRAFFIC STUDIES MANUAL
Page 80
March 9, 2011
(4)
Other paved county highways that have been reconstructed using other funding sources will be
range tracked by the Department’s Traffic Program using the Department’s range tracking system
only upon written request by the proper County authority, and after an Authority for Rendering
Services (ARS) agreement has been established with proper charge numbers for billing the
County for the range tracking crew’s time, travel expenses and mileage.
(5)
The letter of request from the County to range track a county highway shall include the posted
speed limit(s) that apply on the roadway being range tracked. That is the speed that will be used
for the minimum passing sight distance in establishing the length of no-passing zones unless the
letter specifies the County’s desire to establish the no-passing barriers at a speed other than the
posted speed limit.
(6)
The Department prefers that any no-passing zone be established using the range tracking system
prior to any no-passing zone markings being applied. However, emergency situations can arise
that require the installation of some form of reasonable no-passing zone markings before the
roadway can be properly range tracked. The one-vehicle method may be used to establish the
interim no-passing zone markings in those emergency situations.
12.4 RANGE TRACKING
(1)
Range tracking requires two vehicles equipped with drivers, two-way radios, and the Novastar II
Range Track Survey System. The vehicles used shall be intermediate size. The lead vehicle is
equipped with a calibrated DMI, telemetry modem to transmit its road track distance to the
trailing vehicle, and a target for eye height. The trailing vehicle is equipped with a calibrated
DMI, telemetry modem to receive the lead vehicle’s road track distance, the range tracking
computer, printer, and a pressurized paint canister with a spray nozzle and remote actuator.
(2)
The two vehicles are driven over the roadway in question at a pre-determined speed and spaced at
the appropriate minimum passing sight distance apart. The driver of the lead vehicle maintains as
steady of speed as possible so the driver of the trailing vehicle can maintain the proper separation
distance. A complete no-passing zone study requires three passes along the roadway.
(3)
On the first pass, whenever the operator of the range tracking computer observes that the lead
vehicle’s target disappears, the beginning of a no-passing zone is documented on the range
tracking computer. When the lead vehicle’s target reappears, the end of the no-passing zone is
documented on the range tracking computer. The process of documenting the beginning and end
of each no-passing zone location on the range tracking computer is continued throughout the
segment until the end the section of roadway being checked is reached. No marks are placed on
the highway during this run.
(4)
After the first run, the operator of the range tracking computer uses the computer’s printouts to
check the beginning and ending of each no-passing zone. The distance between successive nopassing zones is checked and any locations where successive no-passing zones are separated by
less than the minimum distance between no-passing zones as shown in Table 12-2 are noted. In
those cases, the theoretical end of the first and beginning of the second no-passing zone will not
be marked on the roadway, so the entire section between the closely spaced no-passing zones will
be striped as a continuous no-passing zone.
(5)
The operator of the range tracking computer also checks the length of each no-passing zone
documented in the first run using the computer’s printouts. The length of each no-passing zone
that is less than 500 feet long is checked against the maximum sight distance restriction to allow
omission of no-passing zone shown in Table 12-3. If the no-passing zone length exceeds the
maximum sight distance restriction listed in Table 12-3, the no-passing zone will be marked. Nopassing zones installed under this condition are extended to a length of 500 feet, with the
additional length added to the beginning of the no-passing zone. The DMI reading for the new
TRAFFIC STUDIES MANUAL
Page 81
March 9, 2011
beginning point for the no-passing zone is marked on the printout so the pavement can be marked
in advance of the actual point where the sight restriction begins.
(6)
If the length of no-passing zone is less than the distance shown in Table 12-3, then conditions in
either direction beyond the sight restriction are evaluated to determine whether or not the area
should be marked as a no-passing zone. If the situation causing the brief sight restriction doesn’t
warrant a no-passing zone, the section will not be marked as a no-passing zone. If the conditions
do warrant a no-passing zone, its length will be increased to 500 feet as in the previous paragraph.
Table 12-3
Maximum Sight Distance Restriction to Allow Omission of No-passing Zone
POSTED
SPEED
LIMIT
(mph)
MAXIMUM
SIGHT DISTANCE
RESTRICTION
(feet)
25
30
35
40
45
50
55
60
65
70
75
90
105
120
135
150
165
180
195
210
(7)
The second pass is made with the vehicles traveling at the same pre-determined separation
distance as the first run. During this run, the operator of the range tracking computer documents
the beginning and end of each no-passing zone on the computer as well as on the pavement by
painting a mark on the highway with a short burst of paint from the paint canister’s nozzle using
the remote actuator. The operator also keeps track of the DMI reading and marks the beginning
of the short no-passing zones prior to the actual point where the sight restriction begins. The
DMI reading is also monitored in the areas of closely spaced successive no-passing zones, so the
operator does not mark the end of the first or the beginning of the second no-passing zone.
(8)
The third and final pass repeats the same process as the second pass, but in the opposite direction.
At the completion of the third pass, the roadway is marked in each direction with a paint mark at
the beginning and end of each no-passing zone in each lane.
(9)
The District striping crew then follows-up the range tracking crew by permanently marking the
beginning and end of each no-passing zone with delineator posts, and the respective pavement
markings are applied.
12.5 ONE VEHICLE METHOD
(1)
This method should only be used as a last resort for emergency situations where some type of
reasonable no-passing zone markings must be established prior to the roadway being properly
range tracked by the range tracking crew.
TRAFFIC STUDIES MANUAL
Page 82
March 9, 2011
(2)
This method only requires one employee in a vehicle equipped with a DMI. To mark a curve or
hill for passing sight distance, the driver moves slowly through it. When the driver reaches the
point at which the vista opens up and the driver is sure there is a stretch of road ahead which is
sufficient for safe passing, he or she stops the vehicle and places a paint mark on the right side of
the roadway. Drivers usually sight down the ditch-line as an aid to finding this point when
measuring curves for sight distance. This point is the end of the no-passing zone in the direction
of travel. The point where the vista opens is usually much easier to locate accurately than the
point where the sight distance decreases below the minimum while coming into a curve or hill.
(3)
The driver then resets the DMI to 0.00, travels the required passing sight distance, and stops to
place a paint mark on the left side of the roadway. This marks the beginning of the no-passing
zone in the opposite direction.
(4)
A trip through the site in the opposite direction, following the same procedure, completes the
determination of the location of the no-passing zones for that site in both directions.
(5)
This one vehicle method essentially assumes a zero-height object as there is no practical way to
adjust this object height. The method is therefore more likely to be conservative, especially on
hills where 3.5 feet high objects could be seen some distance further than zero-height objects.
This method can miss some short no-passing zones and may require a second pass in each
direction to close any passing opportunities that are less than the minimum distance between nopassing zones shown in Table 12-2.
TRAFFIC STUDIES MANUAL
Page 83
March 9, 2011
(This page intentionally left blank)
TRAFFIC STUDIES MANUAL
Page 84
March 9, 2011
CHAPTER 13 – SPEED STUDIES
13.1 PURPOSE
(1)
Title 31, Chapter 5 – Article 3 of the Wyoming Statutes establishes the speed regulations for all
public roadways in Wyoming. Effective July 1, 2011 the statutory speed limits are:
(a)
20 mph in school zones
(b)
30 mph in urban districts, as defined by W.S. 31-5-102 (a) (lvii)
(c)
30 mph in any residence district, as defined by W.S. 31-5-102 (a) (xxxviii)
(d)
30 mph in any subdivision, pursuant to W.S. 18-5-304
(e)
75 mph on interstate highways
(f)
65 mph on all other paved roadways
(g)
55 mph on all other unpaved roadways
(2)
The statutes, under W.S. 31-5-302, authorize the director of the department of transportation to
establish specific maximum speed limits on localized geographic areas of the state highway
system based on engineering and traffic investigations. Such speed limits may be greater or less
than the normal statutory speed limits for the roadways being considered.
(3)
The statutes also include a basic speed law [W.S. 31-5-301 (a)], prohibiting drivers from traveling
at a speed greater than what is reasonable and prudent under the conditions and having regard to
the actual and potential hazards that may exist, which recognizes that driving conditions and
speeds may vary widely from time to time. No posted speed limit can adequately serve all
driving conditions. Motorists must constantly adjust their driving behavior to fit the conditions
they encounter.
(4)
Any speed limit, other than a statutory speed limit listed above, that is posted on the Wyoming
state highway system must be based on an engineering study. That study must include an
analysis of free-flow traffic speeds. A Spot Speed Study is used to measure the free-flowing
traffic speed characteristics at a specified location under the traffic and environmental conditions
prevailing at the time of the study. Spot speed data is also used in various other traffic
engineering activities, such as determining traffic signal timings, establishing highway design
elements, analyzing roadway capacity, and evaluating the effectiveness of improvements.
(5)
The purpose of this chapter is to establish the proper study procedures for completing the
engineering and traffic investigation in accordance with the statutes, to provide guidance in
setting appropriate speed limits based on the study data, and to establish the documentation and
notification procedures when establishing new speed limits.
13.2 SPEED STUDY DATA COLLECTION
(1)
The basics of spot speed study data collection, such as site selection, sample size requirements
and the selection of target vehicles are described in the ITE Manual of Transportation
Engineering Studies. For most spot speed studies used by WYDOT, vehicle speeds should be
measured using automated methods such as radar or laser speed detection. The individual vehicle
selection method is the preferred method of obtaining free-flow speeds, with sample sizes of at
least 50 and preferably 100 vehicles per direction being considered representative samples. The
lower sample size can be used on lower volume (i.e., having two-way traffic volumes of less than
1,000 vehicles per day) roadways where the time to collect 100 samples per direction could be
excessive.
(2)
An Excel spreadsheet has been developed to assist with the collection and analysis of spot speed
study data. The spreadsheet includes a Speed Study Data Collection Sheet (Form TR-10), to be
TRAFFIC STUDIES MANUAL
Page 85
March 9, 2011
printed out and used in the field for tabulating the speed samples by hand. It also contains a data
input sheet where the raw data from the data collection sheet can be input into the spreadsheet for
detailed analysis. Speed Study Worksheets (Form TR-11) that provide detailed speed statistics
for each direction and the combination of both directions, as well as a “clean” computer printout
of the data collection sheet are also included.
(3)
The worksheet was designed to where it can only process speed data having a maximum range of
40 mph between the highest recorded speed and the lowest recorded speed. This limitation was
required to allow the data to properly display on the Display sheets. This 40 mph range is
sufficient for almost all free-flow speed conditions. In the rare case where speeds spanning more
than 40 mph may be recorded, the highest and lowest speeds can be disregarded without seriously
affecting the speed study statistics. If that doesn’t reduce the speed range to 40 mph or less, then
the speed statistics for that case will have to be calculated manually.
13.3 SPEED STUDY DATA COLLECTION SHEET
(1)
The Speed Study Data Collection Sheet (Form TR-10) has been developed in conjunction with
the Speed Study Worksheet (Form TR-11) for the collection of speed data in the field. An
example of a blank collection sheet is shown in Figure 13-1. In order to limit the range of speeds
to what is allowed by the worksheet; the lowest anticipated free-flow speed at the study location
must be entered in the red box. The remaining speed values are then automatically updated. To
help determine what value to enter in the red box, Table 13-1 provides some guidance on what
lowest anticipated free-flow speeds might apply based on the posted speed limit and whether the
area of the study is in an urban area, urban/rural fringe or in a rural area.
Table 13-1 Lowest Anticipated Free-flow Speeds
Extent of Roadside Development
Posted Speed
(mph)
Urban
Fringe Area
Rural
≤ 30
10
10
–
35 – 40
10
15
20
45 – 50
15
20
25
55 – 60
25
30
35
≥ 65
–
40
45
(2)
Prior to heading to the field to collect spot speed study data, it is recommended that several Speed
Study Data Collection Sheets having varying lower limits be printed out for use by the data
collection personnel.
(3)
When collecting speed study data, fill out the heading of the Speed Study Data Collection Sheet
completely.
(4)
The observer enters a tally mark (\) in a data block under the appropriate direction for each
observance of a speed. If more than 15 vehicles are observed at any particular speed in one
direction, tally marks slanting in the opposite direction can be entered over the tally mark
previously entered thus forming an “X”, which represents two vehicles observed at that speed.
An example of a completed Speed Study Data Collection Sheet is shown in Figure 13-2.
(5)
If there is no interest in knowing the speed statistics for each direction, but only the combined
directions, then all speed observations for both directions of travel can be entered in one column.
This avoids having to add the number of tally marks from the two directions when entering the
data into the Speed Study Worksheet.
TRAFFIC STUDIES MANUAL
Page 86
March 9, 2011
Figure 13-1 Blank Speed Study Data Collection Sheet
TRAFFIC STUDIES MANUAL
Page 87
March 9, 2011
Figure 13-2 Example of a Completed Speed Study Data Collection Sheet
TRAFFIC STUDIES MANUAL
Page 88
March 9, 2011
(6)
The Speed Study Data Collection Sheet can also be used to document speeds based on vehicle
class, either by direction or for both directions. This is accomplished by utilizing one-letter
classification codes rather than tally marks. Classification codes that may be used include the
following:
P = passenger vehicle (includes cars, pickups, vans and SUVs)
T = truck (includes single units with 6 or more tires, buses, RVs and pickups pulling trailers)
S = semi-truck (tractor-trailer combinations)
M = motorcycle
13.4 SPEED STUDY WORKSHEET
(1)
The Speed Study Worksheet has been developed to simplify and automate the processing of
speed study field data. This helps reduce the chances of errors in the processing as well. The
worksheet is an Excel spreadsheet with an input sheet and display sheets for each direction of
travel as well as the combination of both directions analyzed. All data is entered on the input
sheet, and the results are displayed on the display sheets for printing.
(2)
The location-related data is entered at the top of the Input sheet from the data on the Speed Study
Data Collection Sheet. An example of the data input sheet for the previous field data collection
sheet is shown in Figure 13-3.
(3)
Enter the lowest speed recorded and the highest speed recorded. This will help adjust the display
of output data so that it is relatively centered in the display graph. If the difference between the
highest and lowest recorded speeds exceeds 40 mph, an error message will display.
(4)
The number of observations at each respective speed is then entered under the appropriate
direction column. If no vehicles were observed at a given speed, the respective line can be left
blank or a zero (0) can be entered.
(5)
The Speed Study worksheet is designed to analyze speed statistics for each direction of travel as
well as both directions at once.
(6)
If the speed study is checking speeds by vehicle classification, the Speed Study Worksheet can
only process one vehicle class at a time. The class of vehicle being studied should be noted in the
Comments space of the input sheet.
(7)
Once all of the necessary data is entered on the input sheet, the speed study statistics can be
viewed by selecting one of the display sheets. Figure 13-4 gives an example of the Speed Study
Worksheet output for one direction of travel.
(8)
For a neat computer-generated sheet that duplicates the hand-written data from the data collection
sheet, the cleaned field data sheet uses the same data entered on the input sheet to provide a copy
of the Speed Data Collection Sheet with the heading data and tally marks filled in to match the
form completed by hand. Figure 13-5 gives an example of the cleaned field data collection sheet.
TRAFFIC STUDIES MANUAL
Page 89
March 9, 2011
Figure 13-3 Example Speed Study Worksheet Data Input
TRAFFIC STUDIES MANUAL
Page 90
March 9, 2011
Figure 13-4 Example Speed Study Worksheet Output
TRAFFIC STUDIES MANUAL
Page 91
March 9, 2011
Figure 13-5 Example of Cleaned Speed Study Data Collection Sheet
TRAFFIC STUDIES MANUAL
Page 92
March 9, 2011
13.5 DETERMINATION OF APPROPRIATE SPEED LIMIT
(1)
Speed limits and speed zoning remain one of the more controversial tasks for the traffic
engineering profession. Engineers, public safety officials, and others involved in setting and
enforcing speed limits may disagree on the appropriate balance between safety and road-user
convenience that should prevail on particular road segments, considering conditions of
topography, weather, adjacent activities, and traffic. Motorists, other road users, and roadway
neighbors have their own perspectives on this balance and may or may not abide by the
professionals’ judgments.
(2)
Wyoming speed laws define speed limits as absolute speed limits; traveling at a speed above the
absolute limit is by definition illegal and presumably imprudent and unreasonable. WYDOT is
empowered to lower or raise speed limits on a particular state highway segment if these altered
limits are judged to be reasonable and safe under conditions found to exist at that location.
Engineering and traffic studies typically provide the basis for making such speed-zone judgments.
These studies generally consider such factors as the physical features of the roadway, crash
experience, traffic characteristics and control (for example, signals and other control devices),
and the length of the roadway segment under consideration (speed-limit changes should not be
too frequent or applied to very short road segments).
(3)
If the regulation of speed is to be effective, the posted limit must be generally consistent with
speeds that drivers feel are safe and proper. Enforcement is widely recognized to be crucial to the
success of speed limits as a means for making roads safer. If law enforcement officers and the
courts are confident that speed limits have been developed on a reasonable basis, their
enforcement of the limits will be more effective. Generally, speed limits should be set at levels
that are self-enforcing so that law enforcement officials can concentrate their efforts on the worst
offenders.
(4)
One of the factors considered very important for setting a speed limit is the prevailing vehicle
speed. The MUTCD is quite explicit, stating that “when a speed limit within a speed zone is
posted, it should be within 5 mph of the 85th-percentile speed of free-flowing traffic.” The Speed
Study output sheets show the recommended speed limit based on this criterion.
(5)
The MUTCD indicates other factors may also influence the appropriate speed limit, including
roadway characteristics such as shoulder condition, grade, alignment, and sight distance; the
pace; roadside development and environment; parking practices and pedestrian activity; and
reported crash experience for at least a 12-month period.
(6)
These other factors may be used to justify a speed limit somewhat lower than the 85th-percentile
speed, but in no circumstance should the speed limit be posted below the 50th-percentile speed or
lower limit of the 10-mph pace. The Speed Study output sheet compares the posted speed limit to
these two factors and raises a red flag whenever the posted speed limit is posted too low.
(7)
In cases where the speed limit is posted below the 85th-percentile speed based on the other
factors, the speed limit sign serves to remind motorists that conditions in the area are such that the
speed reduction is reasonable. Proper use of speed limit signs would instill confidence in the
minds of drivers that the information on the speed limit sign is accurate and not simply a desire
on the part of a policy maker to reduce speed arbitrarily for emotional or political reasons.
(8)
For additional guidance on determining appropriate speed limits, a web-based expert system was
developed by the FHWA as part of NCHRP Project 3-67 to help determine the most appropriate
speed limit for a given route. This system can be found at: http://www2.uslimits.org/index.cfm.
This site requires users to establish a user name and password to access the system.
TRAFFIC STUDIES MANUAL
Page 93
March 9, 2011
13.6 DECLARATION OF SPEED LIMIT
Posted speed limits (other than statutory speed limits) on the state highway system that have been
established by engineering and traffic investigation shall be documented by a Declaration of Speed Limit
(Form M-10). An example of a completed M-10 form is shown in Figure 13-6.
When declaring a speed limit, the M-10 form shall be signed by the District Engineer and forwarded to
the State Traffic Engineer, along with the supporting documentation, for concurrence. If the State Traffic
Engineer concurs, the form is then signed and forwarded to the Director for formal declaration of the
speed limit. After the form is signed by the Director or his designee, the form is returned to the district so
the appropriate signing changes can be made. Enforcement of the new speed limit cannot occur until the
appropriate signs giving notice thereof have been erected.
Once the signing changes have been made, the installation date shall be noted on the form and copies of
the completed form shall be distributed to the District Engineer, District Traffic Engineer, State Traffic
Engineer, and Traffic Studies Engineer. It is also recommended that copies be sent to the local Highway
Patrol division captain, and local law enforcement agency(ies) for help with enforcement.
13.7 MINIMUM SPEED LIMITS
WYDOT does not post minimum speed limits.
TRAFFIC STUDIES MANUAL
Page 94
March 9, 2011
Figure 13-6 Example of Completed Declaration of Speed Limit Form
TRAFFIC STUDIES MANUAL
Page 95
March 9, 2011
(This page intentionally left blank)
TRAFFIC STUDIES MANUAL
Page 96
March 9, 2011
CHAPTER 14 – TRAVEL TIME AND DELAY STUDY
14.1 PURPOSE
(1)
The purpose of a travel time and delay study is to evaluate the quality of traffic movement along a
route and determine the locations, types, and extent of traffic delays by using a moving test
vehicle.
(2)
This type of study can be used to compare operational conditions before and after roadway or
intersection improvements have been made or signal coordination has been implemented or
modified. It can also be used as a tool to assist in prioritizing projects by comparing the
magnitude of the operational deficiencies (such as delays and stops) for each project under
consideration.
(3)
The travel time and delay study can also be used for the following purposes:
(4)
(a)
(b)
(c)
By planners to monitor level of service for local government comprehensive plans.
(d)
Evaluation of the effectiveness of traffic engineering improvements using before and
after studies on projects such as signal retiming or the addition of turn lanes.
(e)
Determination of level of service from average travel speed data.
Determination of route operational efficiency or delay.
Identification of congested locations such as driveways, entrances, etc., where a
significant number of turning movements occur.
The methodology presented herein provides the engineer with quantitative information with
which he can develop recommendations for improvements such as traffic signal retiming, safety
improvements, turn lane additions, and channelization enhancements.
14.2 DEFINITIONS
Average Speed
The total distance covered divided by the elapsed time. The average speed for each
section (node to node distance) and a total average speed for the entire route are
calculated separately.
Before and After A way to categorize a group of runs so that two different groups of runs can be
compared. The terms Before and After mean only that the data is summarized into
two separate groups so the statistics of each group can be compared. If all of one set
of runs are made under the same conditions, they may all be defined as before runs.
Later, identical runs made under different conditions (after an arterial has been retimed, for example) may be defined as after runs. The analysis can then compare
statistics for the before runs as a group, the after runs as a group, and changes in the
various statistics from before to after.
Fixed-Route
Data collection along a pre-determined route. When doing fixed-route studies, run
data is collected along the same route several times. One run is rarely sufficient to
find the travel time characteristics of a route. The operator may never hit a red light
during a run, or may hit several. If several runs are collected, the averages of the
individual run data will be a better representation of the true traffic characteristics of
the route. Fixed-route studies usually have segments defined at the time the runs are
made. The route is divided into geographic segments, using easily determined
landmarks to separate the segments. For arterials, the segment boundaries will
typically be signalized intersections, but the segments may be defined any way you
want.
TRAFFIC STUDIES MANUAL
Page 97
March 9, 2011
Node
The boundary between two segments of a run. Every run has a starting node, which
is where you start collecting data on a fixed-route study, an ending node, which is
where you stop collecting data, and several segment nodes in between. If intersections
are used to define the nodes, the landmark used to define the node should be at a point
exiting the intersection (a good rule-of-thumb is the far right traffic signal pole). This
will ensure that any delay associated with stops at the intersection will be reported in
the correct section.
Normal Speed
Ideal speed at which the traffic should travel on an arterial. The Normal Speed is
used to find Total Delay statistics for runs and studies (see Total Delay, below) and is
plotted on the Time/Space Diagrams to show perfect progression. This is set at the
beginning of the study and is usually the posted speed limit on the corridor.
Number of Stops A stop is defined as a one-second interval where the speed is less than X mph for
one second when the speed was greater than X mph in the previous second. X is
normally 5 mph but can be set to any speed you want. This speed is called the Stop
Speed and is set at the beginning of the study. Each time the vehicle slows down and
crosses the Stop Speed boundary, a stop is counted. The vehicle must speed up faster
than the threshold before another stop can be counted.
Primary Run
A run where the user collected segment node data. Most users, when doing a run,
will collect segment node data by noting there location as they pass by the predetermined nodes in the route. The distances measured for a single run are not very
accurate, so collecting segment node data on multiple runs and averaging the node
distances from each of the primary runs in a study will result in more accurate
distances between nodes.
Run
A single collection of travel time data. For example, when data is collected along an
arterial, the user drives to the beginning of the arterial under study, starts data
collection, proceeds along the arterial to the end of the study area, and then stops data
collection. He has just completed one run. If he turns around and collects data in the
other direction, it is another run. All runs are stored as separate entities.
Secondary Run
A run where the user did not collect segment node data.
or
A primary run in which the user decides not to use the segment node data to find the
node distances for the study. You do not have to collect segment node data while
doing a run. You may have done several runs in that direction and know you have
sufficient data to find accurate node distances, or you may have made several mistakes
marking the node on a particular run, or you simply don’t need node by node statistics
for this route. You can define a run as Secondary and any node distance data in the
run will be ignored in the analysis.
Study
A collection of runs. When the user collects data, he is making data runs, and when
he gets back to the office, he collects those runs into studies. The difference is
important because runs can be collected into different studies. For example, a user
may make a number of runs at an arterial during one or two days. Back in the office
he may create a study with just the morning runs. He may also create a study with all
of the runs, which of course use some of the morning runs. There is one critical rule
for studies: All of the runs in a study must start at the same place, end at the same
place, and follow the same route. Only runs in the same direction can be part of the
same study. Since you usually collect runs in two directions (up and back), you will
typically create at least two studies for each data collection session.
TRAFFIC STUDIES MANUAL
Page 98
March 9, 2011
Study Group
A folder where related runs and studies are stored. Since studies must be created
from runs that start in the same place, end in the same place, and go in the same
direction, it makes sense to store all runs that fit those criteria in one place on the
computer, along with any studies that are created from those runs. Since at least two
sets of runs are usually collected, one in one direction and another in the opposite
direction, two Study Groups will usually be created when the data is read from the
traffic data collector.
Time ≤ X mph
Total time the vehicle spent at or below the given speed. There are three speed
categories, which you can set for different purposes. You can measure stopped delay
(time vehicle is stopped) by setting Category 1 to 0 mph. You can measure queue
delay by setting Category 2 to 7 mph. The third category might be set to 30 mph to
show how much time vehicles spent in car following mode rather than free flow
(assuming free flow speed is 40 or 45 mph). Many other uses for these three
categories are possible, limited only by your imagination.
Total Delay
Difference between actual travel time and ideal travel time. Actual travel time is
calculated from the data. The ideal travel time is based on the Normal Speed set at the
beginning of the study.
Travel Time
The elapsed time to travel between two points, in seconds. This is probably the
most fundamental of the reported statistics. It is measured directly in the field.
14.3 STUDY PROCEDURES
(1)
To conduct a travel time and delay study, one must first define the study area by selecting all
control points before beginning the study. The time periods recommended for studies are A.M.
and P.M. peak hours as well as off peak hours in the direction of heaviest traffic movements
(other times may be requested by the District Traffic Engineer).
(2)
These studies should be made during reasonably good weather so that unusual conditions do not
influence the study. Also, since crashes or other unusual delays will produce erroneous results,
any runs made during such an occurrence should be terminated and another run conducted. These
studies should be conducted during average or typical weekday traffic conditions.
(3)
When conducting a travel time and delay study, the floating car technique should be used. In
using the floating car technique, the driver floats with traffic by passing as many vehicles as pass
the test car. The idea is to emulate an average driver for each section of roadway.
(4)
In order to determine the number of runs required for statistical significance, the engineer/analyst
should use the following method:
(5)
(a)
(b)
(c)
(d)
Estimate the number of runs required by using Table 14-1.
(e)
(f)
Make additional runs if required.
Conduct the runs.
Calculate the average range in running speed (R) using the equation below.
Using the average range in running speed as calculated, again use Table 14-1 to
determine the number of runs required.
Engineering judgment should also be used in applying this procedure to fit the purpose of
the study.
To elaborate on (4)(c), after the first group of running speeds has been computed, the absolute
differences between the first and second values, the second and third values, etc., are obtained.
These differences are summed and the total is divided by the number of differences (N-1) to
provide the average range in running speed for the initial data.
TRAFFIC STUDIES MANUAL
Page 99
March 9, 2011
(6)
This procedure is represented by the following equation:
1
Example:
Run #
1
2
3
4
5
RS
38
35
32
33
36
⁄
Where:
RS
R
S
N
=
=
=
=
Absolute Difference
0
3
3
1
3
10 (Total = S)
1
10⁄ 5
1
2.5
Average running speed in mph
Average range in running speed in mph
Sum of absolute differences
Number of completed test runs
(7)
The approximate minimum sample size is selected from Table 14-1 for the calculated average
range in running speed and the desired permitted error. If the required sample size is greater than
the number of runs made, then additional runs must be performed under similar traffic and
environmental conditions to reach the minimum sample size.
(8)
The specified permitted error for traffic operations studies involving efficiency (i.e., timing
studies) should be ± 3.0 mph.
(9)
The permitted error for before and after studies should be ± 3.0 mph for studies predominately
involving efficiency, and ± 2.0 mph for studies predominately concerned with safety.
(10)
Table 14-1 also includes ranges for specified permitted errors of ± 4.0 mph, and ± 5.0 mph.
These data are provided as background information for the traffic engineer. There may be special
projects where the traffic engineer would deem it appropriate to use one of these other specified
permitted errors. Any exceptions to the previously noted standards should be approved by the
State Traffic Engineer on a project by project basis.
Table 14-1
APPROXIMATE MINIMUM SAMPLE SIZE REQUIREMENTS FOR TRAVEL TIME
AND DELAY STUDIES WITH 95 PERCENT CONFIDENCE LEVEL
Minimum Number of Runs
for Specified Permitted Error
Average Range in
Running Speed
(mph)
*R
+/- 1.0
mph
+/- 2.0 mph
+/- 3.0
mph
+/- 4.0
mph
+/- 5.0
mph
2.5
4
2
2
2
2
5.0
8
4
3
2
2
10.0
21
8
5
4
3
15.0
38
14
8
6
5
20.0
59
21
12
8
6
*Interpolation should be used when R is other than the numbers shown in column 1.
TRAFFIC STUDIES MANUAL
Page 100
March 9, 2011
14.4 COLLECTING THE DATA
WYDOT uses PC-Travel for Windows Travel Time and Delay Analysis Software to conduct travel time
and delay studies. This study method requires a test vehicle with a transmission sensor installed, JAMAR
TDC-8 traffic data collector, New Link pushbutton switch connected to the TDC-8, TDC-8 Sensor
Interface Cable, and PC-Travel Field Worksheet (see Figure 14-1).
(1)
Define the starting point, ending point and the intermediate nodes. Normally the starting, ending,
and intermediate nodes are intersections, but they can be other landmarks such as bridge
abutments, mile post markers, or other fixed landmarks. Pick points that can be easily identified
now and when future after runs may be collected. The drawing below shows a simplified
diagram of a typical study route. There is a starting node, which could be an intersection, four
nodes, which could be signalized intersections, and an ending node. Make a rough sketch of the
route, clearly showing the starting and ending points and list the intermediate nodes you want to
use (see step 4). You don’t have to make every intersection a node. It is important to understand
the type of information you want the data to give you before you define the route and nodes.
Don’t use more nodes than you really need; it just needlessly complicates the analysis.
(2)
You should always keep field notes when you do travel time studies. The field notes help you
keep track of the runs when you get back to the office. The PC-Travel Field Worksheet will help
you store all of the information about the runs you make. Figure 14-1 is an example of a
worksheet that has been filled out to give you an idea of how the form is used. Before you start
the data collection, fill in the general information about the session at the top of the sheet. List
the starting point, ending point, and any intermediate nodes.
(3)
Connect the TDC-8 to the vehicle’s transmission sensor using the Sensor Interface Cable and
Plug the pushbutton switch into the jack labeled Bank 1 on the side of the TDC-8. This is
actually connected to the Bank 2 switch in the counter. The labels for the two jacks are reversed
on the side of the TDC-8.
(4)
Calibrate the TDC-8 according to the procedure described in the PC-Travel for Windows
Reference Manual. The calibration constant should be recorded on the PC-Travel Field
Worksheet.
(5)
Prepare the TDC-8 for a travel time (TT) study following the procedure described in the TDC-8
User’s Manual.
(6)
Start a run by driving to the starting point so that when you pass the starting point you are
traveling at the proper speed with the rest of the traffic. Press the DO button on the TDC-8 as
accurately as you can as you pass the starting point; this begins data collection. The display
shows the run number, link number (how many times you have pressed the New Link button this
run), time, distance traveled so far this run, speed, as well as the last delay button pushed (the L
Key = value). As you proceed along the route, press the New Link button as you pass each new
section.
Note: Check the speed reading on the TDC-8 and make sure it is close to the speed on the
speedometer. If they are not reasonably close (within a few miles per hour) it may indicate a
problem with the sensor or an incorrect Calibration Constant. Don’t collect data if the speed isn’t
right; the data almost certainly won’t be correct.
TRAFFIC STUDIES MANUAL
Page 101
March 9, 2011
Note: If you have chosen intersections as your nodes, wait until you exit the intersection to press
the New Link button. This will ensure that any delay associated with stops at the intersection will
be reported in the correct section.
More information about collecting travel time and delay study data is contained in the PC-Travel
for Windows Reference Manual.
(7)
Stop the run by pressing the DO button on the TDC-8 when you have reached the end of the
route. If the end is the last intersection, remember to press the button as you depart the
intersection. This ends the run and the TDC-8 stops collecting data until you press the DO button
again, signifying the start of a new run.
(8)
Turn around and collect data in the other direction using the same nodes for both directions. In
this case you press the DO key when you go by the first intersection (the END node of the
previous run), press the New Link button as you go through each of the nodes, and press the DO
button to end the run when you get to the last node (the START node of the previous run).
Note: Remember that you press the DO button to start and stop a run. You press the New Link
button for nodes in between.
(9)
Repeat steps 6 & 7 until you have completed the recommended number of runs, then just turn off
the TDC-8.
(10)
The TDC-8 is then downloaded to a computer and the data processed following the procedures
outlined in the PC-Travel for Windows Reference Manual.
14.5 ANALYSIS
(1)
From the data collected, the analysis program determines the time spent stopped and the speed at
any time or distance. The program is thus able to calculate average speed, running speed, amount
of delay, number of stops, distance and time between traffic signals, fuel consumption, and miles
per gallon. The data can also be used to produce a speed plot and/or a time space trajectory plot.
(2)
These outputs must then be analyzed, and engineering judgment should be applied to the numbers
and graphs to determine if problem areas exist. If they do, then the appropriate corrective action
must be determined. Engineering judgment should be applied in order to analyze the results and
to determine any actions that can be taken to reduce delay and improve operational efficiency.
(3)
Things to look for include:
(4)
(a)
More than one stop between intersections. This may indicate interference with the traffic
flow from sources other than traffic signals, possibly caused by traffic generators.
(b)
Travel speed (average speed) significantly less than running speed. This could be caused
by delay at the traffic signals or accesses.
(c)
Delay significantly higher during peak versus off-peak periods. This could be caused by
heavy cross street traffic during a peak volume at an intersection exceeding or close to
capacity, lack of left-turn lane storage capacity, etc.
Typical solutions for delays would include turn lanes, traffic signal retiming, and restriction of
certain movements responsible for delay. The engineer must determine the best solution for each
particular situation.
TRAFFIC STUDIES MANUAL
Page 102
March 9, 2011
Figure 14-1 Example PC-Travel Field Worksheet
TRAFFIC STUDIES MANUAL
Page 103
March 9, 2011
(This page intentionally left blank)
TRAFFIC STUDIES MANUAL
Page 104
March 9, 2011
CHAPTER 15 – HIGHWAY LIGHTING STUDIES
15.1 PURPOSE
(1)
The investment of public funds in roadway lighting returns benefits to the public in several ways.
Lighting benefits motorists by improving their ability to see roadway geometry and other vehicles
at extended distances ahead. This results in greater driver confidence and improved safety,
particularly in inclement weather. Lighting may also improve roadway capacity. Other benefits
include improved pedestrian safety, improved public safety and security, convenience, and civic
pride and recognition.
(2)
WYDOT Operating Policy 25-1, Traffic Control and Roadway Lighting Devices, establishes
much of the criteria by which lighting will be installed at many intersections on the state highway
system. It lists rural and urban interstate highways including interchanges, ramp termini, and
crossroads within the interstate right-of-way meeting the interchange lighting criteria of the traffic
program. It also lists rural locations on other state highway intersections meeting the intersection
lighting criteria of the Traffic Program. This chapter includes a summary of the Traffic
Program’s interchange and intersection lighting criteria.
15.2 LIGHTING WARRANTS
(1)
The primary purpose of warrants is to assist administrators and designers in evaluating locations
for lighting needs and selecting locations for installing lighting. Warrants give conditions that
should be satisfied to justify the installation of lighting. Meeting these warrants does not obligate
the state or other agencies to provide lighting or participate in its cost. Conversely, local
information in addition to that reflected by the warrants, such as roadway geometry, ambient
lighting, sight distance, signing, crash rates, or frequent occurrences of fog, ice, or snow, may
influence the decision to install lighting.
(2)
Per WYDOT Operating Policy 25-1, WYDOT is responsible for the design, installation and
maintenance for roadway lighting systems on the state highway system as follows:
(3)
The traffic program has adopted the warrants for freeway lighting that have been established by
the American Association of State Highway and Transportation Officials (AASHTO) in the
Roadway Lighting Design Guide, 2005. The warrants for freeway lighting contained in the
AASHTO Guide are indicated below:
(a)
On existing traffic signal poles when the lighting system is upgraded to WYDOT
standards;
(b)
(c)
(d)
On traffic signal poles at new or reconstructed traffic signal installations;
Rural intersections of US-numbered routes with other US-numbered routes;
Rural intersections with raised channelization.
15.2.1 CONTINUOUS FREEWAY LIGHTING
Case CFL-1 - Continuous freeway lighting is considered to be warranted on those sections in and near
cities where the current ADT (both directions) is 30,000 or more.
Case CFL-2 - Continuous freeway lighting is considered to be warranted on those sections where three
or more successive interchanges are located with an average spacing of 1½ miles or less, and adjacent
areas outside the right-of-way are substantially urban in character.
TRAFFIC STUDIES MANUAL
Page 105
March 9, 2011
Case CFL-3 - Continuous freeway lighting is considered to be warranted where for a length of 2 miles
or more, the freeway passes through a substantially developed suburban or urban area in which one or
more of the following conditions exist:
(a)
Local traffic operates on a complete street grid having some form of street lighting, parts
of which are visible from the freeway;
(b)
The freeway passes through a series of developments such as residential, commercial,
industrial and civic areas, colleges, parks, terminals, etc., which includes roads, streets
and parking areas, yards, etc., that are lighted;
(c)
Separate cross streets, both with and without connecting ramps, occur with an average
spacing of ½ mile or less, some of which are lighted as part of the local street system;
(d)
The freeway cross section elements, such as median and borders, are substantially
reduced in width below desirable sections used in relatively open country.
Case CFL-4 - Continuous freeway lighting is considered to be warranted on those sections where the
ratio of night to day crash rate is at least 2.0 or higher than the statewide average for all unlighted similar
sections, and a study indicates that lighting may be expected to result in a significant reduction in the
night crash rate.
Continuous freeway lighting should be considered for all roadway facilities in urban areas that have
median barriers. In rural areas each location must be individually evaluated as to its need for
illumination.
15.2.2 COMPLETE INTERCHANGE LIGHTING
Case CIL-1 - Complete interchange lighting may be warranted where the total current ADT ramp traffic
entering and leaving the freeway within the interchange exceeds 10,000 for urban conditions, 8,000 for
suburban conditions, or 5,000 for rural conditions.
Case CIL-2 - Complete interchange lighting may be warranted where the current ADT on the crossroad
exceeds 10,000 for urban conditions, 8,000 for suburban conditions, or 5,000 for rural conditions.
Case CIL-3 - Complete interchange lighting may be warranted where existing substantial commercial or
industrial development that is lighted during hours of darkness is located in the immediate vicinity of the
interchange, or where the crossroad approach legs are lighted for 0.5 miles or more on each side of the
interchange.
Case CIL-4 - Complete interchange lighting may be warranted where the ratio of night to day crash rate
within the interchange area is at least 1.5 times the statewide average for all unlighted similar sections,
and a study indicates that lighting may be expected to result in a significant reduction in the night crash
rate.
15.2.3 PARTIAL INTERCHANGE LIGHTING
Case PIL-1 - Partial interchange lighting is considered to be warranted where the total current ADT
ramp traffic entering and leaving the freeway within the interchange areas exceeds 5,000 for urban
conditions, 3,000 for suburban conditions, or 1,000 for rural conditions.
Case PIL-2 - Partial interchange lighting is considered to be warranted where the current ADT on the
freeway through traffic lanes exceeds 25,000 for urban conditions, 20,000 for suburban conditions, or
10,000 for rural conditions.
Case PIL-3 - Partial interchange lighting is considered to be warranted where the ratio of night to day
crash rate within the interchange area is at least 1.25 or higher than the statewide average for all unlighted
similar sections, and a study indicates that lighting may be expected to result in a significant reduction in
the night crash rate.
TRAFFIC STUDIES MANUAL
Page 106
March 9, 2011
15.2.4 NON-FREEWAY LIGHTING
The AASHTO Guide also contains guidelines on special considerations for roadway lighting. The
AASHTO Guide gives no specific warrants for continuous lighting of roadways other than freeways
(roads with fully controlled access, no at-grade intersections), but does suggest some general criteria that
may apply when considering the installation of lighting.
Lighting of rural at-grade intersections is warranted if the geometric conditions mentioned in the
AASHTO Guide exist or if the intersection scores a total of 50 or more points on the Intersection Lighting
Criteria form (see Figure 15-1).
TRAFFIC STUDIES MANUAL
Page 107
March 9, 2011
Figure 15-1 Example Intersection Lighting Criteria
TRAFFIC STUDIES MANUAL
Page 108
March 9, 2011
CHAPTER 16 – TRAFFIC SIGNAL REMOVAL STUDY
16.1 PURPOSE
(1)
No matter what reason was used to justify a traffic signal installation, changes over time may
reduce the need for, and effectiveness of, the traffic signal. When this occurs, problems created
by unwarranted signals, such as excessive delay, increased rerouting of traffic to less-appropriate
roads and intersections, higher crash rates, and disobedience of the traffic signal can often be
addressed by removing the signal if doing so would not create worse problems.
(2)
The MUTCD contains no specific warrants for the removal of traffic signals. The only guidance
relative to signal removal is a statement in Section 4B.02 that states, “If changes in traffic
patterns eliminate the need for a traffic control signal, consideration should be given to removing
it and replacing it with appropriate alternative traffic control devices, if any are needed.” The
first indication that a traffic signal may no longer be justified is if the traffic volumes at the
intersection do not meet any of the MUTCD warrants for signal installation. However, it is
possible that a signalized intersection that does not meet any of the warrants will meet at least one
warrant after the signal is removed (due to increases in crashes, delay, or traffic patterns).
Therefore, the removal of a traffic signal requires thorough engineering study.
(3)
The decision to remove an existing signal can be a difficult one. There is a public perception that
traffic signals are a panacea for all traffic problems at an intersection, and therefore signals enjoy
a high status among many segments of the public, elected officials, and public administrators. If
the removal of an existing traffic signal is to be successful, this perception by the general public is
the greatest hurdle to overcome. Given this popular bias, the practical reality is that signals are
considerably harder to remove than to install. While this can be a very high hurdle, it is possible
to clear if the proper engineering considerations are made and supported.
(4)
This chapter sets forth the procedure required to justify the removal of an existing traffic control
signal. The discussion and analysis process is adapted from the Federal Highway Administration
(FHWA) publication prepared by JHK & Associates and Wagner-McGee Associates entitled
User Guide for Removal of Not Needed Traffic Signals, Implementation package FHWA-IP-8012, November 1980. The procedure is intended to provide documented support for the decision
to remove an unwarranted signal, to determine the appropriate alternative traffic control, and to
make the transition from signalized to unsignalized control as safe and efficient as possible. The
process consists of a series of criteria, all of which must be satisfied, and the various impacts
predicted before signal removal is recommended.
(5)
The decision process has been built into a series of forms and nomographs to aid the traffic
engineer in making the decision to remove or retain an existing. Signal. The use of these forms
and nomographs is explained in detail at the end of this chapter (see Page 121).
16.2 STAGE 1 – PRELIMINARY SCREENING
(1)
The first step in the removal process is to indentify whether or not the intersection is a legitimate
candidate for possible signal removal. There are five areas that need to be considered before
seriously pursuing the removal of an existing signal: sight distance, special site considerations,
warrants, crash experience, and special justifications. The decision to pursue the removal should
only be made after these areas have been thoroughly evaluated.
(2)
This part of the process can be completed fairly quickly based on existing intersection data. The
purpose of this quick screening is to determine if additional analysis of the intersection is
justified. Figure 16-1 gives an example of the preliminary (Stage 1) signal removal decision
process in the form of a flowchart.
TRAFFIC STUDIES MANUAL
Page 109
March 9, 2011
Figure 16-1
Signal Removal Decision Process Stage 1 – Preliminary Screening
TRAFFIC STUDIES MANUAL
Page 110
March 9, 2011
(3)
The intersection data required to perform the signal removal analysis are basic – specifically:
(a)
Side street sight distance
(b)
The traffic volumes entering the intersection in each hour during a representative day
(c)
The crash history at the intersection for at least three, and preferably five or more
preceding years.
(4)
Depending on site-specific conditions, additional data, such as major street speeds, heavy turning
movements, pedestrian counts, etc. may also be necessary.
(5)
After the intersection data is obtained a series of criteria are considered, each of which must be
satisfied in order for the intersection to survive the screening.
16.2.1 SIGHT DISTANCE
(1)
The sight distance available to the side street, particularly if two-way stop control is proposed, is
very important to the removal decision. If the sight distance available for the side street is less
than the stopping sight distance for the mainline approach speed, signal removal should not be
further considered unless the sight restriction can be reasonably mitigated. Removing a traffic
signal at an intersection without adequate sight distance will more than likely double the number
of expected right-angle crashes when compared to intersections with adequate sight distance.
(2)
The sight distance should be measured in each direction from each minor street approach in
accordance with Chapter 6. The line of sight should be from the driver’s eye position where
traffic would normally be expected to stop and look for gaps in approaching traffic if the
intersection were stop-controlled.
(3)
If limited sight distance is caused by an easily removed obstruction (e.g., overgrown foliage), or
all-way stop control or a roundabout is planned after signal removal, consider this criterion
satisfied and proceed to the next step in the screening process.
16.2.2 SPECIAL SITE CONSIDERATIONS
(1)
The intersection should be reviewed to determine if any special site conditions exist that would
make signal removal institutionally infeasible. Two major types of recurring conditions are of
special concern:
(a)
Signals located at major traffic generators (especially employment sites) where sharp
peaks occur during commuting periods and problems in crossing or entering the main
road are perceived for these short periods.
(b)
Signals located near special generators which generate either substantial or special
categories of pedestrian traffic (as perceived by those opposing removal). Examples
would include schools, libraries, homes for the elderly, hospitals, etc.
(2)
At these locations it may be best to first discuss the proposed removal with representatives of the
affected employment site, school or neighborhood association prior to making an in-depth study.
(3)
While the special pedestrian situations are the most common type generating intense, emotional
opposition, it is very possible that the safety of the general pedestrian traffic may also be an issue
that is brought up by signal removal opponents. Regardless of the number of pedestrians that
actually cross the major street, signal removal opponents will often argue that pedestrian safety is
compromised with the removal of a signal. However, this belief has not been substantiated at
previous signal removal locations. Locations having relatively few (typically 15 or less)
pedestrians crossing the major street during the peak hour have shown no increases in pedestrian
crashes after signal removal. While this information may be useful, discussions with signal
removal opponents on the subject of pedestrian safety will still require a very careful and tactful
approach.
TRAFFIC STUDIES MANUAL
Page 111
March 9, 2011
16.2.3 WARRANTS
(1)
The MUTCD contains no specific warrants for the removal of traffic signals. The primary
indicator that a traffic signal may no longer be needed is the intersection’s failure to satisfy any of
the MUTCD signal installation warrants. However, it is possible that a signalized intersection
that does not meet any of the warrants will meet at least one warrant after the signal is removed
(due to increases in crashes, delay, or traffic patterns). Therefore, the removal of a traffic signal
requires additional engineering analysis.
(2)
If current or expected future traffic volumes meet any of the MUTCD warrants, then signal
removal should be deferred.
(3)
Sometimes traffic signals are installed at new intersections or at existing intersections based on
projected volumes based on new development or construction in the area. Unless the engineering
study used the satisfaction of Warrant 8 to justify the signal, a traffic control signal installed
under projected conditions should have an engineering study done within 1 year of putting the
signal into stop-and-go operation to determine if the signal is justified. If not justified, the signal
should be taken out of stop-and-go operation or removed.
(4)
There may be special situations where an existing signal meets one or more of the MUTCD
warrants, but its location (spacing from adjacent signals) is detrimental to the smooth progressive
flow of traffic on the major street, and the reason for considering its removal is to facilitate a new
or relocated traffic signal at a location that provides more acceptable signal spacing. In such a
situation, emphasis should be given to providing traffic that would normally use the existing
signal convenient access to the new or relocated signal via nearby parallel streets or construction
of new street connections. This can dispel most of the concern associated with the side street
traffic needing a traffic signal to gain safe and convenient access to the major street.
16.2.4 SPECIAL JUSTIFICATIONS
(1)
There have been reasons other than the standard warrants that have been used to justify traffic
signal installations. There are undoubtedly cases where unwarranted signals have been installed
as a result of pressure from a small special interest group based on reasons which either are no
longer perceived as problems or can be shown to be invalid. The review should determine if such
a special justification was used and whether or not it is still valid. If still valid, signal removal
will be very difficult unless the special interest group is included in the decision-making process
and they buy into the signal removal concept.
(2)
A review of the original reasons for installing the signal should be done. If all of the original
needs are no longer present, then consideration may continue. A review of the political
implications should also be done to determine if the climate is favorable to proceed.
16.3 STAGE 2 – DETAILED REMOVAL ANALYSIS
(1)
This is a more time consuming analysis process which is pursued only if the candidate
intersection survives the preliminary screening process.
(2)
At this time a preliminary decision should be made concerning the type of intersection control
that will be installed after the signal is removed – namely, two-way stop control, all-way stop
control, or a roundabout. The possible intersection control alternatives are discussed later on in
this chapter (see Section 16.4).
(3)
Figure 16-2 gives an example of the decision process for Stage 2 of the signal removal study
procedure in flowchart form.
TRAFFIC STUDIES MANUAL
Page 112
March 9, 2011
Figure 16-2
Signal Removal Decision Process Stage 2 – Detailed Analysis
(4)
The steps contained in the detailed analysis are designed to allow the traffic engineer to estimate
the expected impacts that will result from the removal of the traffic signal at a particular
intersection. Knowledge of these expected impacts forms the technical basis for the final
decision to remove or not remove the signal.
16.3.1 EXPECTED INFLUENCE ON CRASHES
(1)
Crash experience, both historical and expected, can be a very tough issue when considering a
signal for removal. A thorough review of the crash history should be done to determine what has
been occurring at the intersection. Historically, the removal of unwarranted signals and
conversion to two-way stop control will cause a reduction in rear-end type collisions, but an
increase in right angle crashes might be expected.
(2)
The nature of the crashes that could be expected after the removal of the signal is influenced by
the type of control that will replace the signal. If an all-way stop is to be used then, in general, a
decrease in crashes could be expected. If, however, two-way stop control is planned then the
changes described above can be expected. If a multilane roundabout is to be used, the frequency
of crashes could be expected to decrease slightly, but the severity of crashes would be expected to
be significantly reduced. If a single lane roundabout is to be used, a significant decrease in both
frequency and severity of crashes would be expected.
TRAFFIC STUDIES MANUAL
Page 113
March 9, 2011
(3)
If the signal installation is relatively recent (i.e., five to ten years old), and adequate crash data is
available, and where traffic volumes have not changed substantially during the life of the signal,
the crash records prior to the signal installation should be compared to those after the signal was
installed.
(a)
If the crash frequency or severity improved significantly after signalization, removal
should not be further considered.
(b)
If the crash frequency or severity increased significantly after the signal installation, the
signal removal process should continue to the next stage.
(c)
If crash patterns were unchanged or changed only slightly after signal installation,
alternative safety improvements may be considered in lieu of signal removal. These
alternative improvements include:
• signal display upgrades
• increased signal clearance intervals if right angle crash frequency is high
• signal offset improvements (if possible) to achieve smoother flow and reduce stops
• semi-actuation or full-actuation (if pretimed)
• shortening of average side street green intervals through pedestrian actuation
• installation of advance warning devices
• improved pavement friction
• turn prohibitions
• parking prohibitions
• improved geometric design features
(d)
If such alternatives have not been considered, then their potential and relative costs
should be investigated as possible alternatives to signal removal, as minor and relatively
inexpensive improvements to the signal might improve the safety performance of the
intersection to where removal of the signal may become infeasible.
(e)
If the alternative safety improvements have been considered and they would not be
expected to improve the safety performance of the intersection, then the signal removal
process should proceed to the next stage.
(4)
Regardless of the traffic control that is planned after the signal is removed a detailed before/after
review of crashes must be done after the signals are removed and needs to be well documented.
This is because fear of an increase in crashes will be one of the most significant points of
opposition to the proposal.
(5)
If the signal is to be replaced with two-way stop control, the following equation can be used to
predict the change in the annual crash frequency resulting from signal removal:
Equation 16-1
1.01
Where:
Y
=
X1
=
X2
=
0.139
0.605
Estimate of change in average annual crash frequency resulting from the
removal of a signal and installation of two-way stop control
Volume magnitude as measured by the number of hours per day when
the traffic volumes satisfy at least 60% of the signal installation volume
warrant – MUTCD Warrant 1, Condition A (see Table 16-1)
Average annual crash frequency at the intersection under signal control
TRAFFIC STUDIES MANUAL
Page 114
March 9, 2011
Table 16-1 Volume Magnitude
NUMBER OF HOURS/DAY THAT INTERSECTION VOLUMES
EXCEED THE FOLLOWING VOLUME LEVELS
MINOR STREET
HIGHER VOLUME
APPROACH ONLY
(vph)
MAJOR
MINOR
MAJOR STREET
BOTH APPROACHES
(vph)
1
1
300
90
2+
1
360
90
2+
2+
360
120
1
2+
300
120
LANES/APPROACH
(6)
A nomograph of predicted changes in annual crash frequency for various combinations of X1 and
X2 was developed using Equation 16-1. It is shown in Figure 16-3 and may be used for
estimating the expected changes in crash frequency resulting from signal removal.
(7)
If all-way stop control is planned after removal of the signal, a decrease in crashes of
approximately 60 percent can generally be expected, provided the intersection has the following
characteristics:
(8)
(a)
Low volumes (less than 800 entering vehicles during the peak hour
(b)
Relatively balanced flows (ratio of major street volumes / minor street volumes < 3:1)
If a roundabout is planned after removal of the signal, a reduction in overall crash frequency of
approximately 35 percent, and an approximately 75 percent reduction in injury and fatality
crashes can be expected.
16.3.2 EXPECTED TRAFFIC FLOW RELATED IMPACTS
(1)
Traffic signal removal results in substantial impacts on intersection delays, stops, and the
resulting excess fuel consumption.
(2)
Replacing an unjustified signal with two-way stop control at a four-legged intersection has the
following estimated effects:
(a)
Total delay is reduced by about 10 seconds per vehicle.
(b)
Idling delay is reduced by about 5 to 6 seconds per vehicle.
(c)
Stops are reduced from about 50 percent of the total to about 20 to 25 percent or even less
if side road volumes are low in relation to total intersection volume.
(d)
Excess fuel consumption due to intersection stops and delays is reduced by about 0.002
gallons per vehicle.
(3)
In the case of similar volumes at a T-intersection, the reductions in delays, stops, and fuel
consumption would be slightly greater.
(4)
Replacing an unjustified signal with all-way stop control at four-legged intersections has the
following estimated effects:
(a)
Total delay per vehicle does not change by much.
(b)
Idling delay is reduced by about 5 seconds per vehicle.
(c)
Stops always equal 100 percent of total traffic, approximately double that experienced
under signal control.
(d)
Excess fuel consumption is increased by about 0.0015 gallons per vehicle.
TRAFFIC STUDIES MANUAL
Page 115
March 9, 2011
Figure 16-3 Predicted Changes in Average Annual Crash Frequency
Following Signal Removal (Conversion to Two-Way Stop Control
TRAFFIC STUDIES MANUAL
Page 116
March 9, 2011
(5)
Replacing an unjustified signal with a roundabout at four-legged intersections has the following
estimated effects:
(a)
Total delay is reduced by approximately 62 to 74 percent.
(b)
Idling delay is reduced by approximately 25 percent.
(c)
Stops are reduced by approximately 25 percent.
(d)
Fuel consumption is reduced by approximately 16 percent.
16.3.3 JURISDICTION-RELATED COSTS
(1)
Traffic signal removal is one of those rare activities that actually saves money for the traffic
engineering agency.
(2)
The costs of continued signal operation include the annual costs of maintenance, electricity, and
other operational costs such as signal timing. Additionally, the annualized cost of upgrading the
signal display may also be included if it is below design standards.
(3)
The cost of signal removal includes the one-time costs of removing the signal hardware and
installing STOP signs, and the annual cost of maintaining the signs.
(4)
These costs vary widely between individual intersections and between jurisdictions. When these
various costs are properly accounted for and adequate records are kept, the jurisdiction should use
their own cost data to calculate the cost savings of signal removal. If local “actual” costs are not
available, Tables 16-2 and 16-3 provide ranges of these costs which can be used to estimate the
cost impacts.
Table 16-2 Annual Cost per intersection of continued signal operation
Type of Signal Control
Cost Component
Pretimed
Semi-Actuated
Fully Actuated
Electrical
$180 - $550
$180 - $550
$180 - $550
Maintenance
$600 - $1600
$750 - $3000
$750 - $3500
Signal Timing
$80 - $125
$80 - $125
$80 - $125
Annual Total Cost
$860 - $2275
$1010 - $3675
$1010 - $4175
Table 16-3 Cost Impacts of signal removal
Item
Implementation Cost
Equivalent Uniform Annual Cost *
Remove Signal Hardware
$3,000 - $10,000
$447 - $1490
Install Stop Signs
$120 - $500
$18 - $75
Sign Maintenance
-
$16 - $30
*Note – Analysis period is 15 years and an interest rate of 12%, capital recovery factor = 0.149
16.3.4 CANVAS PUBLIC OPPOSITION
Assess the relative strength of opposition to, or support for, the proposed signal removal. This is a
consideration that begins here and continues even after the decision to remove a signal has been made.
Initially, at this stage of the decision process, the local governing agency representatives, neighborhood
and business leaders, and police can be contacted for their opinions. This initial canvassing provides a
general idea of the opposition or support that may be expected during the interim control period and/or at
council meetings. This item is pursued further during the public notification process which is discussed
in Section 16.5.1.
TRAFFIC STUDIES MANUAL
Page 117
March 9, 2011
16.3.5 SIGNAL REMOVAL DECISION
(1)
All of the above findings are then weighed by the traffic engineer and the decision is made
whether or not to recommend removal of the traffic signal. It is neither possible nor desirable to
avoid a significant amount of professional judgment in this final decision. In most cases, a
number of institutional constraints must also be considered. However, the technical findings
from the detailed analysis should provide a strong factual basis for reaching, supporting, and
defending the final decision or recommendation.
(2)
All of the findings of the decision process should be summarized by the traffic engineer in a
signal removal justification report for use in gaining necessary authorization to proceed.
16.4 INTERSECTION CONTROL ALTERNATIVES
There are three alternatives to signalized intersection control: two-way stop control, all-way stop control,
or roundabout control. Each has its own operational strengths and limitations in comparison with traffic
signal control, and the appropriate alternative control is dependent on the conditions present at the
intersection. Each alternative will be discussed separately.
16.4.1 TWO-WAY STOP CONTROL (TWSC)
(1)
TWSC can accommodate low traffic volumes with much less delay than traffic signals, but this
type of control favors the major street (unstopped) movements at the expense of the minor street
(stopped) movements. When the major street traffic volumes are heavy there can be little or no
opportunity for cross street access. This places a definite limit on the application of TWSC.
Even when TWSC capacity is not exceeded, there is often strong public pressure to keep the
signals rather than convert to TWSC at the intersection. Unless there is an interconnected street
network that will allow traffic on the minor street reasonable access to another signalized access
to the major street, that public pressure can be almost impossible to overcome.
(2)
If the signal being removed is located between existing coordinated signals, TWSC is the only
acceptable form of alternative traffic control. If the spacing to adjacent signalized intersections is
favorable, the time/space and time/flow diagrams associated with each of the time-of-day traffic
signal coordination plans should be carefully analyzed to determine if the adjacent signals will
provide sufficient gaps in major street traffic to permit minor street traffic to enter without
unacceptable delays.
16.4.2 ALL-WAY STOP CONTROL (AWSC)
(1)
AWSC should only be considered if the intersection meets the minimum volume criteria
associated with the multiway stop criteria contained in Section 2B.07 of the MUTCD.
(2)
AWSC treats the cross street movements more favorably, without the wasted time associated with
traffic signals. However, the rate at which vehicles may enter an intersection (i.e., headway)
under all-way stop control is limited.
16.4.3 ROUNDABOUT CONTROL
(1)
The installation of roundabouts in lieu of stop control or even traffic signals has consistently
shown a substantial improvement in intersection safety and efficiency.
(2)
Roundabouts are well suited to more isolated intersections, but can also be effective when used in
a corridor setting, provided they are not used between coordinated signalized intersections.
(3)
One impediment to the construction of roundabouts involves the logistical challenges associated
with converting existing intersections. Temporary traffic control measures, which can be
expensive, must be implemented during the construction process to maintain orderly and safe
traffic flow. However, this problem can be minimized or avoided by constructing roundabouts
when new intersections are first built and when major modifications are proposed for existing
intersections.
TRAFFIC STUDIES MANUAL
Page 118
March 9, 2011
16.5 REMOVAL PROCEDURE
After all of the above areas have been thoroughly considered and if the decision is made to proceed with
the removal, the following steps need to be taken:
16.5.1 PUBLIC NOTIFICATION
(1)
The Traffic Program, District Office, Resident Engineer, and local governing agency should be
advised of the decision and provided with documentation of the above noted areas to support the
decision.
(2)
The public should be given notice of the intention to remove the traffic control signal. Set a firm
date for the turn-off of the signals to occur and notify the public. This can consist of news
releases, public hearings and/or presentations at city council meetings. This is a very important
step and the District must be prepared to fully answer any questions that may arise. How this
phase is handled is critical since incomplete or insincere answers to those opposed to the signal
removal could cause the whole process to fail.
(3)
Distribution of a news release to local newspapers, radio and television stations can potentially
provide the widest coverage when notifying the public of the proposed removal. When city
council approval is required for signal removal, press coverage of the council meeting will often
have the same value as a news release. However, a news release prior to the council meeting is
more likely to present the matter in a positive light, whereas news coverage of the matter in city
council may give more emphasis to any controversy or colorful statements of the opposition. The
major drawback to the release is that there is no guarantee that those residents, commercial
establishments and drivers most affected by the signal removal will receive the information.
(4)
The release should include information such as the intersection location, the date and time that the
signal is to go into the interim control mode, what the new control will be, general reasons that
the signal is being removed (e.g., change in traffic flow patterns, closing of nearby generator) and
a description of the benefits that will be derived by its removal (reduction in delay, fuel
consumption and crashes).
(5)
To ensure that the citizens in the immediate vicinity will be notified of the proposed signal
removal, a letter containing the same information as the press release can be sent directly to the
residents and commercial establishments within the immediate vicinity of the candidate
intersection.
16.5.2 INSTALL INTERIM CONTROL
If the intersection will be stop controlled once the traffic signal is removed, in order to transition the
public to the removal of the traffic signals the following steps should be followed prior to the removal of
the signal:
(1)
The traffic signal should be placed in flashing operation reflecting two-way (yellow/red) or allway (all-red) stop control, as appropriate, and temporary STOP signs installed on the respective
approaches. This operation should be maintained for a day or two (typically no more than one
week) to make sure the intersection will not fail under the proposed stop control.
(2)
If, after the initial flashing operation, the operation and safety is acceptable, the signal should be
turned off and permanent (post mounted) STOP signs should be installed on the appropriate
approaches. The signal heads should be covered or turned away from traffic. Signal related
signing should be removed from the intersection. The signal poles, mast arms, controller cabinet
and all wiring should be left in place at this time.
(3)
If, after approximately 3 months of STOP sign control, intersection operation and safety is
acceptable, the signal heads and mast arms can be removed.
TRAFFIC STUDIES MANUAL
Page 119
March 9, 2011
(4)
After an extended (typically 12 months) period of acceptable sign control operation, the
remaining signal components should be removed. A comprehensive removal should be
completed with all signal poles, controller cabinet and wiring removed and all concrete
foundations and bases removed to at least flush (preferably at least 8 inches below grade in turf
areas) with the ground. All pull boxes should either be removed or filled to prevent them from
collapsing in the future.
(5)
If the intersection will be converted to a roundabout, the intersection modifications will require a
significant construction project to modify the approaches and install the appropriate center island
and splitter islands. This work will more than likely encroach on the existing signal hardware
installations. Therefore the removal of the traffic signal should be coordinated with and occur
during the construction project.
16.5.3 MONITOR CRASHES
(1)
Since crashes at individual intersections cannot be predicted with complete accuracy, it is vital to
closely monitor crashes throughout the interim control period. This may require the development
of a close liaison between the traffic engineer and the local police department’s crash records
division in order to obtain copies of the crash reports shortly after any crashes might occur.
(2)
An increase in crashes (particularly if they are right angle or involve injuries) during the first
critical month is not a sufficient reason to abandon the plans for removing the signal. Although,
if an increase does occur, the signal should remain in the transition control mode for a few more
months. If the crash rate is still higher after a few months, an in-depth crash analysis should be
performed and retention of the signal should be seriously considered.
(3)
Accurate crash records should be kept on the intersections in the jurisdiction where the signal has
been removed for several years following the signal removal. Assuming that there will be a
decrease in crashes at most of these intersections, this kind of “positive” information which is
based on intersections within the jurisdiction itself not only lends credibility to the local signal
removal, but also sets the valuable precedent for additional signal removals.
TRAFFIC STUDIES MANUAL
Page 120
March 9, 2011
INSTRUCTIONS
for the
Wyoming Department of Transportation
SIGNAL REMOVAL ANALYSIS WORKSHEETS
USING THESE INSTRUCTIONS
The purpose of these instructions is to assist WYDOT personnel in completing the Signal Removal
Analysis Worksheet and the Worksheet for Estimating Daily Impacts of Signal Removal and Replacement
by Two-Way Stops. The main purpose of the worksheets is to determine if the removal of an existing
unwarranted traffic signal can be accomplished without an increase in crashes and with improvements to
intersection operations.
This process is only valid for intersections that are being converted from signalized control to two-way
stop control.
The Signal Removal Analysis Worksheet has been developed into a two-page .PDF form. The first page
covers the intersection inventory and preliminary screening, and the second page covers the detailed
analysis. The detailed analysis also requires the completion of the Signal Removal Impacts worksheet
which is also covered in these instructions.
STAGE 1 – INTERSECTION INVENTORY
Fill out the appropriate information as required:
(1)
Identify the intersection and city.
(2)
Indicate which street is the major street and which one is the minor street.
(3)
Indicate the number of lanes per approach for each street.
(4)
The ADT required is the two-way average daily traffic volume.
(5)
Note the posted speed limit on the major street.
(6)
Note the side-street sight distance for all side-street approaches.
STAGE 2 – PRELIMINARY SCREENING
This is a quick screening to determine if additional analysis of the intersection is justified. It is made up
of the following four separate criteria, each involving a go/no-go decision concerning signal removal.
(1)
Minimum required sight distance. Compare the measured sight distance (see Chapter 6) in
each direction from each minor street approach to the suggested departure sight distance at
intersections as shown in Table 16-4. If the measured sight distance is less than those shown in
the table, check YES next to line 1 and defer signal removal unless the sight obstructions can be
easily remedied.
Table 16-4 Suggested Departure Sight Distance at Intersections
Design Speed
-
mph
20
30
40
50
Minimum
Departure Sight
Distance
-
ft
225
335
445
555
Source: AASHTO, A Policy on Geometric Design of Streets and Highways, 2004, Exhibit 9-55
(2)
Special site conditions. Note whether or not any special site conditions exist (per Section
16.2.2). If no special conditions exist, check NO, otherwise check YES and note in the comments
field what those conditions are. If you check YES, initiate communication with representatives
TRAFFIC STUDIES MANUAL
Page 121
March 9, 2011
from the affected facilities to assess the possible strength of opposition to or support for the
possible signal removal before proceeding any further with the signal removal process.
(3)
Existing signal warrants met. This can be estimated by comparing the actual ADT’s with the
approximate ADT volumes above which MUTCD signal warrants are likely to be met (see Table
3-2 on Page 15). If current or projected traffic volumes do not meet MUTCD signal warrants,
check NO. If MUTCD signal warrants are met or projected to be met in the near future check
YES and defer signal removal.
(4)
Special justifications. Note whether or not the signal was installed based on any special
justifications that are still valid. If the signal was installed based on special justification (per
Section 16.2.4) that is still valid, note what the justification is in the comments field and check the
YES box. If the installation was based on a special justification that is no longer valid, note what
the justification was and briefly explain why it is no longer valid in the comments field, then
check the NO box. If there was no special justification, simply check the NO box.
(5)
If you checked YES for any of the above criteria, consider deferring the signal removal unless
there is strong local support for the signal’s removal. Otherwise, proceed with the detailed
analysis. An example of Signal Removal Analysis worksheet is shown in Figure 16-4.
STAGE 3 – DETAILED ANALYSIS, TWO-WAY STOP CONTROL
This analysis is pursued only if the intersection survives the preliminary screening process. It involves
predicting the impacts from signal removal and installation of two-way stop control.
STAGE 3.1 – EXPECTED INFLUENCE ON CRASHES
(1)
From Table 16-1 list the minimum required volume for determining the Volume Magnitude. The
minimum required volume is dependent on the number of lanes per approach. See Section 3.4
about how to determine the number of lanes to use when turn lanes are present.
(2)
List the major street volume (two-way) and higher side-street volume (one approach only) for the
eight peak hours. The major street and side street volumes are listed for the same hour.
However, during the eight hours, the higher volume on the side street may be one approach
during some hours and on the opposite approach during the other hours.
(3)
If both the major street and minor street volumes exceed the minimum values, put a check in the
box to the right. The number of boxes checked is the Volume Magnitude.
(4)
The average annual crash frequency is calculated as follows:
Equation 16-2
12
Where:
(5)
CF
t
N
=
=
=
average annual crash frequency
number of months in the period covered
number of intersection crashes during the period
The predicted change in annual crash frequency is then calculated using Equation 16-1 on page
114. A positive number indicates an expected increase in crashes and a negative number
indicates and expected reduction in crashes.
STAGE 3.2 – EXPECTED TRAFFIC FLOW-RELATED IMPACTS
This step requires the completion of the Signal Removal Impacts worksheet (Form TR-04) using the
appropriate nomographs as described below. The following instructions explain how to use the
nomographs and worksheet for predicting the estimated daily impacts of signal removal and replacement
by two-way stop control. The worksheet is a .PDF form that automatically calculates many of the fields
TRAFFIC STUDIES MANUAL
Page 122
March 9, 2011
once the volumes and four impact variables are input from the respective nomographs. An example
worksheet for a 4-way intersection, 4-lane major and 2-lane minor street is presented in Figure 16-5.
(1)
Enter the intersection type (4-way or T) and the number of lanes (2 or 4) on the major road and
minor road by clicking on the respective check boxes. The number of lanes is defined as the total
number of through lanes in both directions on a given road (e.g., 4 lane means two through lanes
in each direction).
(2)
Enter the traffic volumes for the average of the 2 peak hours of the day. The following volumes
were used for the example in Figure 16-5,:
(a)
For the major road, enter the total volume for the 2 approaches averaged for the 2 peak
hours. For example:
Highest Hour
2 Highest Hour
nd
(b)
Main Road (Spruce Street Example)
Eastbound Appr.
Westbound Appr.
Total
354
356
710
342
347
689
Divide by 2
1399
Total main road volume per hour = 700 vph
For the side road, enter the average volume per approach for the 2 side road approaches
averaged for the same 2 peak hours as above. For example:
Side Road (7th Street Example)
Northbound Appr.
Southbound Appr.
Average
Highest Hour
27
70
49
2nd Highest Hour
18
90
54
Divide by 2
103
Total side road volume per hour per approach = 52 vph
(For a T-intersection, simply average the volumes for the 2 peak hours on the only side
road approach.)
(c)
The total intersection approach volume averaged for the two peak hours is then calculated
automatically. For a 4-way intersection, the sum of the total main road volume (entry 2a)
and 2 times the side road volume per approach (2 times entry 2b) is entered. For
example:
Total main road volume per hour =
700 vph
2 x Average side road volume per approach =
2 x 52 vph
Total =
804 vph
(For a T-intersection, the total main road volume plus the only side road approach
volume is used. The form automatically adjusts the total intersection approach volume
calculation for a T-intersection if the T-Intersection box is checked.)
(3)
For the average of the 2 peak hours, read from the nomographs the per hour estimates of the four
impact variables: idling delay, total delay, total stops and excess fuel consumption. Figure 16-8
is a list of nomographs by intersection type to guide you in the selection of the correct
nomographs).
(a)
Estimate the four impact variables for signal control. On each nomograph:
• Enter the side road volume per approach (from Step 2b, use 52 for the example) on
the bottom horizontal axis.
• Draw a vertical line and locate on it the point equal to the total main road volume
(from Step 2a, use 700 for the example) on the family of lines representing signal
control (the dashed lines). You will need to interpolate between the lines in order to
find the point.
TRAFFIC STUDIES MANUAL
Page 123
March 9, 2011
•
(b)
From this point, draw a horizontal line to the left vertical axis and read the estimated
value of the impact variable (for the example, the results are 1.4, 3.1, 390 and 2.6).
Enter these values in their respective columns on the worksheet on line 3a.
Estimate the four impact variables for two-way stop control. Use the same nomographs
in the same manner as Step 3a, but for total main road volume use the family of lines
representing two-way stop control (the dotted lines). Enter the estimates on the
worksheet on line 3b (for the example, the results are 0.2, 0.7, 110 and 0.6) Nomographs
for the example worksheet are shown in Figures 16-6 and 16-7.
Note: The user should not attempt to estimate values from the nomographs to any closer
precision than 2 significant digits. Graphical interpolation can be no more precise.
(c)
(4)
(5)
For each of the four impact variables, the difference between the signal control and twoway stop control estimates is calculated (i.e., the 3b entries are subtracted from the 3a
entries).
The impacts for the total of the 2 peak hours are then calculated.
(a)
The total intersection approach volume for the total of the 2 peak hours is calculated (i.e.,
the entry on line 2c is multiplied by 2.
(b)
The signal removal impacts for the total of the 2 peak hours is calculated (i.e., each of the
four impact variables entered on line 3c are multiplied by 2).
Enter the traffic volumes for the average of the 22 remaining hours of the day.
(a)
For the main road, calculate the average total main road volume for the remaining 22
hours using the following method:
• Subtract the total of the 2 peak hours of the main road volumes from the major street
ADT (from Form TR-03).
• Divide by 22 to get the average for the remaining 22 hours.
• For the example, use (9350 - 2x700)/22 to get an average of 361 vehicles per hour for
the total main road volume for the remaining 22 hours.
(b)
For the side road, the same basic process used for line 5a is used, except with the
following modifications:
• Multiply the side road volume per approach by 2 to get the total average side road
volume for the peak 2 hours.
• Multiply that by 2 again to get the total peak 2 hour side road volume.
• Subtract that total from the side street ADT (from Form TR-03) and then divide by
22 to get the average total side road volume for the remaining 22 hours.
• Divide that by 2 to get the average side road volume per approach for each of the
remaining 22 hours.
• For the example, use (1220 – 52x2x2)/22/2 to get 23 as the average volume per
approach for each of the remaining 22 hours.
• In some instances, the minor street ADT may not be known. A reasonable estimate
of the side road ADT can be determined by determining what proportion of the major
street ADT is included in the turning movement count used for the analysis, and then
assuming the minor street volume constitutes the same proportion of the minor street
ADT. Using the turning movement count volumes, the following equation can be
used to estimate the minor street ADT to be used in the previous steps:
∑
∑
/
The total intersection approach volume, averaged for the 22 remaining hours, is then
calculated automatically by the form.
(c)
TRAFFIC STUDIES MANUAL
Page 124
March 9, 2011
(6)
(7)
(8)
For the average of the 22 remaining hours, and using the same nomographs as in Step 3, read
from the nomographs the per hour estimates of the four impact variables: idling delay, total
delay, total stops and excess fuel consumption (Follow the same procedures as Steps 3 a and b,
except use the volume data for the 22 remaining hours instead of the 2 peak hours.).
(a)
Estimate the four impact variables for signal control (using the same procedure as Step
3a). For the example, use the side road volume of 23 and the main road volume of 361.
(b)
Estimate the four impact variables for two-way stop control using the same procedure as
Step 3b and the same volumes as the previous step (For the example, use a side road
volume of 23 and main road volume of 361).
(c)
For each of the four impact variables, the difference between signal control and two-way
stop control is calculated (i.e., the 6b entries are subtracted from the 6a entries).
Impacts for the total of the 22 remaining hours are calculated.
(a)
The total intersection approach volume for the total of the 22 hours is calculate (i.e., the
entry on line 5c is multiplied by 22).
(b)
The signal removal impacts for the total of the 22 hours are calculated (i.e., each of the
entries on line 6c are multiplied by 22).
The 24 hour total impacts are calculated.
(a)
The 24 hour total intersection approach volume is calculated (i.e., line 4a and line 7a are
added together).
(b)
The signal removal impacts for the total of 24 hours are calculated (i.e., the 4b entries and
the 7b entries are summed for each of the four impact variables).
(9)
The per vehicle impacts are calculated by dividing the 24 hour total impacts on line 8b by the 24
hour total volume on line 8a. In the case of idling delays, per vehicle delays are converted from
hours to seconds by multiplying by 3600.
(10)
Enter the estimated per vehicle and daily changes in idling delay, total delay, total stops, and
excess fuel consumption (line 8b entries on the impacts worksheet (see Page 129) into the
respective traffic flow-related impacts fields on Form TR-03. Multiplying the daily values by
320 will provide the estimated expected annual change.
STAGE 3.3 – JURISDICTION-RELATED COSTS
(1)
Enter the annual electrical, maintenance and timing costs associated with continued signal
operation. If available, these costs should be the actual costs for the intersection in question. If
the specific costs are not readily available, reasonable estimates should be made using the ranges
of costs contained in Table 16-2. These costs are then totaled automatically by the form.
(2)
Estimate the one-time costs of signal removal and STOP sign installation and enter these costs
into their respective fields (i.e., “Remove Hardware” and “Install Stop Signs” on Form TR-03. If
the specific costs are not readily available, reasonable estimates should be made using the ranges
of costs contained in Table 16-3. These costs are then converted to equivalent annual costs by
multiplying them by 0.149 (the capital recovery factor assuming 15 years at 12% interest).
(3)
Enter the estimated annual sign maintenance costs. The total annualized cost of signal removal is
then computed by the form by adding this and the previous costs.
(4)
The difference between the annual costs of operation and the annual removal costs is the annual
cost savings from signal removal. (Note: If the result for the annual cost savings from signal
removal is negative, that implies that the removal of the signal could actually cost more than its
continued operation. Although possible, that is a very rare occurrence and the estimated costs of
both continued operation and removal should be rechecked to verify that the continued operation
costs are not underestimated and/or the removal costs are not overestimated).
TRAFFIC STUDIES MANUAL
Page 125
March 9, 2011
STAGE 3.4 – ANTICIPATED STRENGTH OF OPPOSITION/SUPPORT FOR
SIGNAL REMOVAL
By this time, the traffic engineer should have been in contact with the local governmental agency
representatives, local police department, affected business leaders and neighborhood associations to
obtain their opinions and possible opposition or support for the signal removal concept. A brief summary
of that opposition or support should be entered in the comments field.
STAGE 3.5 – FINAL DECISION
After thoroughly analyzing the results of the Signal Removal Analysis worksheet and the Signal Removal
Impacts worksheet, decide whether to retain or recommend removal of the signal and place a checkmark
in the respective field. A brief summary explaining the decision can be entered in the comments field.
TRAFFIC STUDIES MANUAL
Page 126
March 9, 2011
Figure 16-4 Example Signal Removal Analysis Worksheet (Page 1 of 2)
TRAFFIC STUDIES MANUAL
Page 127
March 9, 2011
Figure 16-4 Example Signal Removal Analysis Worksheet (Page 2 of 2)
TRAFFIC STUDIES MANUAL
Page 128
March 9, 2011
Figure 16-5 Example of Worksheet for Estimating Daily Impacts of Signal Removal and Replacement by Two-way Stops
TRAFFIC STUDIES MANUAL
Page 129
March 9, 2011
Figure 16-6 Example Idling and Total Delay Estimates
(Four-Way Intersection, Four-Lane Major, Two-Lane Minor)
3.1
1.7
1.4
0.7
0.2
0.1
0.7
0.3
23 52
23 52
TRAFFIC STUDIES MANUAL
Page 130
March 9, 2011
Figure 16-7 Example Stops and Excess Fuel Consumption Estimates
(Four-Way Intersection, Four-Lane Major, Two-Lane Minor)
390
2.6
200
1.2
110
0.6
40
0.2
23 52
TRAFFIC STUDIES MANUAL
23 52
Page 131
March 9, 2011
Figure 16-8 List of Nomographs by Intersection Type
ILLUSTRATION
NOMOGRAPH FIGURE
NUMBERS
INTERSECTION
TYPE
IDLING &
TOTAL DELAY
STOPS &
FUEL
4-WAY INTERSECTION,
2-LANE MAJOR ROAD,
2-LANE MINOR ROAD.
16-9
16-10
T-INTERSECTION,
2-LANE MAJOR ROAD,
2-LANE MINOR ROAD.
16-11
16-12
4-WAY INTERSECTION,
4-LANE MAJOR ROAD,
2-LANE MINOR ROAD.
16-13
16-14
T-INTERSECTION,
4-LANE MAJOR ROAD,
2-LANE MINOR ROAD.
16-15
16-16
4-WAY INTERSECTION,
4-LANE MAJOR ROAD,
4-LANE MINOR ROAD.
16-17
16-18
T-INTERSECTION,
4-LANE MAJOR ROAD,
4-LANE MINOR ROAD.
16-19
16-20
TRAFFIC STUDIES MANUAL
Page 132
March 9, 2011
Figure 16-9 Idling and Total Delay
(Four-way Intersection: Two-lane Major, Two-lane Minor)
TRAFFIC STUDIES MANUAL
Page 133
March 9, 2011
Figure 16-10 Stops and Excess Fuel Consumption
(Four-way Intersection: Two-lane Major, Two-lane Minor)
TRAFFIC STUDIES MANUAL
Page 134
March 9, 2011
Figure 16-11 Idling and Total Delay
(T-Intersection: Two-lane Major, Two-lane Minor)
TRAFFIC STUDIES MANUAL
Page 135
March 9, 2011
Figure 16-12 Stops and Excess Fuel Consumption
(T-Intersection: Two-lane Major, Two-lane Minor)
TRAFFIC STUDIES MANUAL
Page 136
March 9, 2011
Figure 16-13 Idling and Total Delay
(Four-way Intersection: Four-lane Major, Two-lane Minor)
TRAFFIC STUDIES MANUAL
Page 137
March 9, 2011
Figure 16-14 Stops and Excess Fuel Consumption
(Four-way Intersection: Four-lane Major, Two-lane Minor)
TRAFFIC STUDIES MANUAL
Page 138
March 9, 2011
Figure 16-15 Idling and Total Delay
(T-Intersection: Four-lane Major, Two-lane Minor)
TRAFFIC STUDIES MANUAL
Page 139
March 9, 2011
Figure 16-16 Stops and Excess Fuel Consumption
(T- Intersection: Four-lane Major, Two-lane Minor)
TRAFFIC STUDIES MANUAL
Page 140
March 9, 2011
Figure 16-17 Idling and Total Delay
(Four-way Intersection: Four-lane Major, Four-lane Minor)
TRAFFIC STUDIES MANUAL
Page 141
March 9, 2011
Figure 16-18 Stops and Excess Fuel Consumption
(Four-way Intersection: Four-lane Major, Four-lane Minor)
TRAFFIC STUDIES MANUAL
Page 142
March 9, 2011
Figure 16-19 Idling and Total Delay
(T-Intersection: Four-lane Major, Four-lane Minor)
TRAFFIC STUDIES MANUAL
Page 143
March 9, 2011
Figure 16-20 Stops and Excess Fuel Consumption
(T- Intersection: Four-lane Major, Four-lane Minor)
TRAFFIC STUDIES MANUAL
Page 144
March 9, 2011
CHAPTER 17 – PREEMPTION
This chapter is under development
TRAFFIC STUDIES MANUAL
Page 145
March 9, 2011
(This page intentionally left blank)
TRAFFIC STUDIES MANUAL
Page 146
March 9, 2011
CHAPTER 18
AUXILIARY LANE AND TRAFFIC IMPACT STUDIES
18.1 PURPOSE
(1)
In addition to the spacing of accesses, the number of traffic lanes at intersections and accesses
and the configuration of those lanes for use by left, through and right-turning traffic play a vital
role in the overall safety and operation of the transportation system. Dedicated left and right-turn
lanes are helpful in promoting safety and improved traffic flow in situations where traffic
volumes and speeds are relatively high and conflicts are likely to develop between through and
turning traffic at public road intersections and driveways. On rural two-lane highways, the
addition of truck climbing lanes and/or passing lanes can enhance the safety and efficiency of the
highway by increasing opportunities to pass slower moving traffic.
(2)
The AASHTO Green Book contains most of the criteria necessary to justify and design auxiliary
lanes. This chapter establishes WYDOT’s warranting criteria for the construction of the various
auxiliary lanes. A section is also included in this chapter to assist with the review of Traffic
Impact Studies submitted in accordance with the WYDOT Access Manual.
18.2 AUXILIARY LEFT-TURN LANES
(1)
Left-turn lanes, installed in the center of the roadway, are intended to remove left-turning vehicles
from the through traffic flow. This reduces the frequency of rear-end collisions at locations
where there is significant left-turn ingress activity, such as major driveways and public road
intersections. The use and design of auxiliary left-turn lanes should be based on a traffic study.
In general, auxiliary left-turn lanes must be long enough to accommodate a safe deceleration
distance and provide adequate storage for an expected peak hour turning traffic queue.
(2)
The following data are required to determine if an auxiliary left-turn lane is warranted:
(a)
Opposing Volume (vph) - VO - The opposing volume includes only the right-turn and
through movements in the opposite direction of the left-turning vehicle.
(b)
Advancing Volume (vph) - VA - The advancing volume includes the right-turn, left-turn
and through movements in the same direction as the left-turning vehicle.
(c)
Operating Speed (mph) - The anticipated posted speed limit.
(d)
Percentage of left turns in VA.
18.2.1 RURAL GUIDELINES
(1)
WYDOT uses 50% of AASHTO’s advancing volume criteria for left-turn lane warrants on rural
two-lane highways. These criteria are dependent on the volumes of traffic entering the
intersection during the peak hour and the approach speed on the approach opposing the left-turn
movement, and are shown in Figure 18-1. To use the figure, peak hour traffic counts including
directional splits, will be required (see Chapter 4). In addition, the ITE Trip Generation Manual
may be used as an estimate for peak hour traffic counts when new or modified development is
involved. The Planning Program can provide necessary growth rates for design year analysis.
(2)
The appropriate trend line is identified on the basis of the percentage of left turns in the
advancing volume, rounded up to the nearest percentage trend line. If the advancing and
opposing volume combination intersects above or to the right of this trend line, a left-turn lane
can be considered appropriate. Since the construction of auxiliary left-turn lanes requires
pavement marking that effectively eliminate passing opportunities for a substantial distance,
constructing auxiliary left-turn lanes for volumes that do not meet the 50% AASHTO criteria
should be avoided unless a crash problem has been identified at that location.
TRAFFIC STUDIES MANUAL
Page 147
March 9, 2011
(3)
Left-turn lanes are typically not needed for left-turn volumes of less than 10 vph. However,
criteria other than volume, such as crash experience, may be used to justify a left-turn lane.
Figure 18-1 Guide for Left-Turn Lanes on Two-Lane Highways (Speeds ≥ 60 mph)
18.2.2 URBAN AND FRINGE AREA GUIDELINES
(1)
In urban and rural/urban fringe areas, using the 50% AASHTO left-turn lane criteria for lower
speed two-lane highways can be used to justify the construction of left-turn lanes. These criteria
are shown in Figures 18-2 and 18-3. The appropriate figure to use is based on the posted speed
limit on the highway at the study location. The appropriate trend line is identified on the basis of
the percentage of left turns in the advancing volume, rounded up to the nearest percentage trend
line. If the advancing and opposing volume combination intersects above or to the right of this
trend line, a left-turn lane can be considered appropriate.
(2)
Other factors to consider when determining the need for left-turn lanes in urban and fringe areas
include:
(3)
(a)
Traffic volumes below the respective trend line on the appropriate left-turn lane
guidelines figure can be used to justify a left-turn lane if the opposing through volume is
very high, if the presence of left-turning vehicles would not be expected, or if a crash
problem associated with left-turning traffic exists.
(b)
Left-turn lanes should be considered for all approaches to signalized intersections that
have 10 or more left turns per hour.
Left-turn lanes should be considered on the minor leg approaches to signalized intersections in
order to minimize delays to the higher volume major street traffic.
TRAFFIC STUDIES MANUAL
Page 148
March 9, 2011
Figure 18-2 Guide for Left-Turn Lanes on Two-Lane Highways (Speeds of 45 – 55 mph)
Figure 18-3 Guide for Left-Turn Lanes on Two-Lane Highways (Speeds ≤ 40 mph)
TRAFFIC STUDIES MANUAL
Page 149
March 9, 2011
18.3 AUXILIARY RIGHT-TURN LANES
(1)
The use of and design of dedicated right-turn lanes should also be based on a traffic study. In
general, dedicated right-turn lanes should be provided in both rural and urban areas on two-lane
routes as shown in Figure 18-4. Figure 18-5 should be used to determine right-turn lane warrants
on four-lane routes. To use the figures, peak hour traffic counts including directional splits, will
be required (see Chapter 4). In addition, the ITE Trip Generation Manual may be used as an
estimate for peak hour traffic counts when new or modified development is involved. The
Planning Program can provide necessary growth rates for design year analyses.
(2)
The following data are required to determine if an auxiliary right-turn lane is warranted:
(3)
(a)
Advancing Volume (vph) - The advancing volume includes the right-turn, left-turn and
through movements in the same direction as the right-turning vehicle.
(b)
Right Turning Volume (vph) - The right-turning volume is the number of advancing
vehicles turning right.
(c)
Operating Speed (mph) - The anticipated posted speed limit.
If the combination of major road approach volume and right-turn volume intersects above or to
the right of the speed trend line corresponding to the major road operating speed, then a right-turn
lane can be considered appropriate.
Figure 18-4 Right Turn Lane Guidelines for Two-Lane Highways
TRAFFIC STUDIES MANUAL
Page 150
March 9, 2011
Figure 18-5 Right Turn Lane Guidelines for Four-Lane Highways
Note: A right-turn lane is typically not warranted for right-turn volumes of less than 10 vph.
However, criteria other than volume, such as crash experience, may be used to justify a right-turn
lane.
(4)
Dedicated right-turn lanes should also be strongly considered in situations where:
(a)
Poor internal site design and circulation leads to backups onto the mainline. Autooriented businesses with short drive-through lanes or poorly designed parking lots would
be prime examples of this situation.
(b)
The peak hour turning traffic activity is unusually high (e.g., greater than 10 percent of
the daily total).
(c)
Operating speeds on the mainline route are high (greater than 60 miles per hour) and
drivers would generally not expect right turns.
(d)
The driveway or minor public road intersection is difficult for drivers to see.
(e)
The driveway entrance is gated or otherwise must be entered very slowly.
(f)
Right-turning traffic consists of an unusually high number of trailers or other large
vehicles.
TRAFFIC STUDIES MANUAL
Page 151
March 9, 2011
(g)
A parallel railroad track is sufficiently close to the intersection to cause right-turning
traffic to queue back onto the through lane(s) of the highway when trains are using the
crossing.
(h)
The intersection or driveway angle is highly skewed, requiring a turn of more than 110
degrees.
(i)
Rear end collision experience is unusually high at the location.
18.4 OFFSET RIGHT- AND LEFT-TURN LANES
Vehicles in the right-turn lane can tend to obstruct the vision of drivers waiting at the stop bar of the
minor roadway. One way to reduce the obstruction of the minor roadway drivers’ view is to offset the
right-hand turning bay to the right. Offsetting right-turn lanes to the right gives drivers on the minor
approach (at the stop bar) an unobstructed view of oncoming through traffic in the near lanes, which
allows for more effective use of gaps. Similarly, vehicles in the opposing left-turn lane can block the
views of left-turning vehicles from the opposite direction, as shown in Figure 18-6. Offsetting left-turn
lanes to the left as far as practical improves the visibility of opposing traffic. Examples of positively
offset left-turn lanes are shown in Figure 18-7. By improving the visibility of opposing traffic, drivers
can more effectively use available gaps.
Consideration should be given to offset right- and left-turn lanes lane in locations with higher mainline
operating speeds, large percentage of turning trucks, unique sight distance issues or crash experience
where investigation of crash diagrams indicates that a safety benefit may be obtained from an offset turn
lane. When implementing offset auxiliary turn lanes, make sure the horizontal geometry of the roadway
does not negate the line-of-sight improvement.
Figure 18-6 Example of Negative Offset Left-Turn Lane Sight Obstruction
(Source: Missouri DOT)
TRAFFIC STUDIES MANUAL
Page 152
March 9, 2011
Figure 18-7 Examples of Positively Offset Left-Turn Lanes
(Source: AASHTO, 2004)
18.5 AUXILIARY TRUCK CLIMBING LANES
The need for auxiliary truck climbing lanes is typically determined by the Geometrics Engineer in
accordance with the AASHTO Green Book.
18.6 AUXILIARY PASSING LANES
Auxiliary passing lanes can be used to increase passing opportunities on two-lane highways. Passing
lanes are typically applied to a corridor in a systematic approach to provide a passing opportunity at
roughly five-minute intervals. The passing lane system can consist of alternating or offset three-lane
sections, four- or five-lane sections, or a combination of the various sections, depending on the various
features on the corridor.
The addition of auxiliary passing lanes is typically considered whenever traffic volumes exceed 4,000
vehicles per day. Auxiliary passing lanes can also be beneficial on somewhat lower-volume highways
where there are very high peak travel periods or high volumes of tourist traffic during the peak tourism
months.
The decision as to when and where to place auxiliary passing lanes is based on the engineering judgment
of the Geometrics Engineer and/or Studies Engineer with appropriate input from the District personnel
and other programs as needed.
TRAFFIC STUDIES MANUAL
Page 153
March 9, 2011
18.7 AUXILIARY RIGHT-TURN ACCELERATION LANES
Auxiliary right-turn acceleration lanes allow entering vehicles (those that have turned right from a
driveway or minor public road onto the major route) to accelerate before entering the through-traffic flow.
Acceleration lanes should be provided where free-flow right-turn lanes are provided from the minor street
onto the major street. Acceleration lanes may also be appropriate where crash experience indicates a
problem with right-turning, entering vehicles. The right-turn acceleration lane should be sufficiently long
to allow safe and efficient merge maneuvers. The design length, tapers and other features of right-turn
acceleration lanes shall be determined by the Geometrics Engineer.
18.8 REVIEW OF TRAFFIC IMPACT STUDY REPORTS
The WYDOT Access Manual 2005 covers the rules and regulations and policy for accesses to Wyoming
State highways. Chapter V of that manual discusses the basic requirements of a Traffic Impact Study
(TIS) and when WYDOT requires the completion of a TIS. A Traffic Impact Study Review Checklist has
been developed to assist with the review process. Figure 18-8 gives an example of the review checklist.
TRAFFIC STUDIES MANUAL
Page 154
March 9, 2011
Figure 18-8 Example Traffic Impact Study Review Checklist
TRAFFIC STUDIES MANUAL
Page 155
March 9, 2011
(This page intentionally left blank)
TRAFFIC STUDIES MANUAL
Page 156
March 9, 2011