1
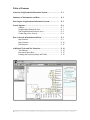
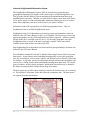
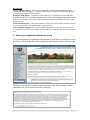
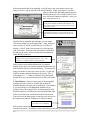
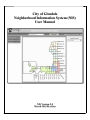
City of Glendale
Neighborhood Information System (NIS)
User Manual
NIS Version 2.0
March 2010 Revision
Table of Contents
About the Neighborhood Information System………………..
P. 3
Summary of Information and Data……………………………
P. 4
Entering the Neighborhood Information System……………..
P. 5
Search Options………………………………………………….
Address…………………………………………………..
Neighborhood Statistical Area……………………………
Sub-Neighborhood Statistical Area……………………….
Conducting a New Search………………………………..
P. 6
P. 7
P. 8
P. 8
P. 8
How to Search Information and Data…………………………
Map Features……………………………………………..
Map Contents……………………………………………
Data Reports……………………………………………..
P. 9
P. 9
P. 10
P. 11
Additional Tools and Site Functions……………………………
Tool Buttons……………………………………………...
Horizontal Menu Bars……………………………………
Printing and Exporting Maps and Tables………………...
P. 14
P. 14
P. 15
P. 15
2 |P a g
e
City of Glendale Neighborhood Information System (NIS)
About the Neighborhood Information System
The Neighborhood Information System (NIS) is an interactive system that puts
geographical mapping (GIS) together with various sources of data throughout the city.
This gives the user the ability to look at and gather different information about your
neighborhood in one place. Whether you want to know where your nearest park, library,
fire or police station is, find out demographic information about your area, or see how
many code compliance cases have been resolved, you can do it all here.
Information in the NIS is grouped by two different geographical areas. They are
Neighborhood Areas, and Sub-Neighborhood Areas.
Neighborhood Area (NA) Boundaries are based on census tract boundaries which are
defined by the US Census Bureau for the City of Glendale. The NA serves as one of the
primary geographic area for which information and data is captured. All data currently
offered on the site is available at the NA level. For the other geographic area (SubNeighborhood Area), not all of the data is currently available. More data will be
available by this area in future versions of the NIS.
Sub-Neighborhood Area boundaries are based on block group boundaries which are also
defined by the US Census Bureau.
The information contained in the NIS is found in Select Map Features, Map Layers and
data reports. A map feature can be something that physically exists in the geographic
area you are looking at, such as parks, schools, and facilities such as libraries, police and
fire stations. A map layer can also be information directly related to that geographic area,
such as City’s zoning classifications and boundaries and general plan areas. For certain
types of features, such as schools and parks, information can interactively be found for
the feature by using the Select Map Features drop down menu.
The data reports are specific reports relating to data for the location area you are looking
at. This includes Census data, crime data, and code compliance data. The data reports
are separate from the map features.
3 |P a g
e
City of Glendale Neighborhood Information System (NIS)
Summary of Information and Data Available
Map Layer Descriptions
Arts and Cultural Centers – Art features and centers throughout the City
Public Facilities – Libraries, city buildings, community centers, pools
Police Stations – Police station and substation locations
Hospitals – Hospital locations
Fire Stations – Fire station locations
Schools – School names and locations
Freeways and Major Streets – Alignments and names for freeways and arterial streets
Minor Streets – Alignments and names for collector and residential streets
Council Districts – City Council District boundaries and names
Bike Routes – Designated bike lanes and routes
Bus Routes – Bus routes
Bus Stops – Bus stop locations
Landbase – Detailed maps with parcel boundaries (only available at neighborhood level)
Zip Codes – City of Glendale zip codes and numbers
Historic Districts – District boundaries
Census Tracts – Census Tract boundaries (same as Neighborhood Statistical Area)
Census Block Groups – Census block group boundaries (same as Sub-NSA)
Parks – Park locations
Neighborhoods – Registered Neighborhood locations
Special Planning Area – Special Planning area boundaries
Zoning – Zoning area boundaries and category names
General Plan 2025 – Planning area boundaries and type of planning area
Annexations – Annexation boundaries
City Boundary – Boundaries for the City of Glendale
Sanitation Day Route – Days that refuse is collected
Nov 2008 Color Aerial Photos – Aerial images (only available at neighborhood level)
Select Map Feature (Map Layers that data is interactively available for)
Active Neighborhoods – Information about active Neighborhood groups and Homeowners
Associations
Arts and Culture – Information about the site name, type of site, and location
Public Facilities – Information about the facility name, address, amenities and a link for further
information
Hospitals – Information about the hospital name, address, and a link to its website
Parks – Information on the park name, address, amenities, and a link for further information
Schools – Information on the school name, school district, address, and a link to the school
website
4 |P a g
e
City of Glendale Neighborhood Information System (NIS)
Data Reports
Census Summary Report – This report is a snapshot of Census Bureau data that has been
summarized into four categories – General Characteristics, Economic Characteristics, Housing
Characteristics, and Social Characteristics.
Detailed Census Report – The Detailed Census Report is a compilation of most of the data
available from the US Census Bureau regarding any census tract (Neighborhood Statistical Area)
in the City of Glendale. This report contains much more detailed information than the Census
Summary report.
Crime Statistics Report – This report contains a rolling 30 day list of traffic accidents, calls for
service and Uniform Crimes (crimes where a report is filed).
Code Compliance Report – The Code Compliance Report has a rolling 30 days list of code
cases that were resolved as well as totals for the various code violations that were resolved in an
area.
A. Entering the Neighborhood Information System
To get started using the Neighborhood Information System (NIS), you will need to enter
the site by clicking on the link to the Neighborhood Information System Welcome page
The link to enter the NIS is found towards the bottom of the Welcome page. Before
entering the site, please read the disclaimer language.
5 |P a g
e
City of Glendale Neighborhood Information System (NIS)
IN ORDER TO BE ABLE TO PROPERLY VIEW THE
NEIGHBORHOOD INFORMATION SYSTEM, COMPUTER MONITOR
SCREEN SETTINGS WILL NEED TO BE SET AT 1024 x 768 PIXELS.
You can do this by minimizing any existing programs that you have open. When you are
in the front screen of your computer which shows the various program icons like MS
Word, right click on your mouse and select the Properties option from the menu. In
Properties, go to the settings tab and move the arrow under screen settings until it says
1024 by 768. Then hit “okay”. The screen will reset and you will be prompted if you
want to save the settings. Select “Yes”.
B. Search Options for Finding Information and Data about your Neighborhood
After you have entered the site, you will be at the NIS home page screen.
Note: Only the Search by Location and Browse City functions are active on the initial
screen. The map is not initially interactive. In order to activate the additional functions
of the site and interact with the map, you need to either choose to Search by Location or
Browse City.
To find information about your neighborhood, you will need to click on the arrow in the
box named “Search by Location” on the right side of the screen with your mouse by
putting the cursor over the arrow and hitting your left mouse button. After clicking on the
arrow, you will be given three different search options. The three options are searching
by Address, Neighborhood Area, and Sub-Neighborhood Area. Just click on the search
option that you want and then the screen will briefly reset to do the search you have
selected.
6 |P a g
e
City of Glendale Neighborhood Information System (NIS)
Note: The Neighborhood Area is the primary search area for which all data and
information is currently available. For the Sub-Neighborhood Area, all map features
(map contents) are available, but not all of the data reports. More data will be available
in future versions of the NIS.
1. Search by Address – By clicking on Address under Search by Location, you will first
need to select a location of interest. This is basically the geographic area you want to
view around your address. The Neighborhood
Statistical Area is set as the default location.
You will need to enter your street number, but
you can select the Direction by using the drop
down arrow. For the street name, if you type the
first letter or number of the name, the drop down
list will go to the entries that start with that same
letter or number. You can also select the street
type by using the drop down arrow next to the
box as well.
Use the drop down menus to quickly enter your
address information in the address fields. Hint: In
the street name field, if you type the first letter of
the name of the street you are searching for, the list
will go to all names that start with that letter so you
don’t have to scroll as much to find the street
After you have entered your address information,
click the “Begin Search” button. The map will
zoom to a new map of the Neighborhood
Statistical Area that the address is located in.
Your approximate address location will be
highlighted with a
icon. You will also now see additional data report options on the
right side of the screen and the map in the middle of the screen will be zoomed to
location of interest you selected. Please go to the section titled “How to Search Map
Features, Map Layers and Data Reports” (p. 8) for your next steps if you do not want to
also review the other search options first.
2. Search By Neighborhood Area - By clicking on
Neighborhood Area under “Search By Location”, you will
need to select a location by either pressing the Select From
Map button and then clicking on that area on the map OR
choosing the NA (Census Tract) by its number from the drop
down menu.
There are two options for selecting
the neighborhood area you want to
view.
7 |P a g
e
City of Glendale Neighborhood Information System (NIS)
Select from Map – First you will need to press the Select from Map button by using your
mouse, then move your cursor over the map of the city. The cursor will look like a
hand that is pointing. By clicking on the left mouse button you will select the area of the
map that the top finger of the hand is over.
Select an Area of Interest – First you will need to press the arrow next to the box that
says “Select an Item” by using your mouse. A drop down menu will appear listing
various numbers, such as 030339. These are the US Census Bureau Census Tract
numbers, which the Neighborhood Area boundaries follow. You would only to be able to
conduct a search like this if you already know what the Census Tract number is for the
NA that you want. You can select the area you want by highlighting it with your mouse
and pressing your left mouse button.
3. Search By Sub-Neighborhood Area – This works the same as searching by a
Neighborhood Statistical Area. Just follow the same steps as listed for the NA.
4. Resetting the Map - Under the Search by Location drop down menu, after one of the
search types has been chosen (Address, Neighborhood Area, sub-Neighborhood Area);
the option to Reset Map will be available in the drop down. This will take you back to
initial map of the city so that you can start a new search.
C. How to Search Select Map Features, Map Layers and Data Reports
After your search by geographic location has been completed, you are ready to look at the
Feature Information, Map Layers, and Data reports for that area.
Note: After you have done your initial search and the map zooms to the area, some
information is already displayed on the map. This information include landbase
mapping, streets, and parks. You can turn these on or off by using the Map Contents tool
described later in this section.
1. Select Map Feature Information – This drop down button is available in the top tool
bar of the screen. Six different types of feature information are available; Arts and
Culture, Active Neighborhoods, Public Facilities, Hospitals, Parks and Schools. Scroll
down over the feature you want to find information for, and then left click your mouse.
The map will refresh and the icons will be visible for the feature you selected. If the
feature type you selected is not in that area, nothing will be shown on the map. Once the
feature type you selected is shown, move your cursor over the feature icon to make a box
appear with information about that feature. You will need to “x” out of the box to
remove it after viewing the information. Once you are done viewing the feature selected,
the option to “Hide” is available on the Select Map Features drop down menu. This will
turn off viewing that feature type.
8 |P a g
e
City of Glendale Neighborhood Information System (NIS)
Select the Feature by using
the drop down arrow
After you have selected the feature,
move your cursor over the feature
icon to get information
2. Map Layers Legend (Features) – This menu is available on the left side of the
screen and is the second horizontal panel shown. To display the full map contents, you
must first move the cursor with your mouse
over the arrow that points down in the menu
bar.
Use your mouse to select the arrow
that points down here
After selecting the arrow, the Map Contents menu bar will
expand and open up. The word “Glendale” with a “+” sign
next to it will also be visible.
The map contents menu bar expands and the
word Glendale appears with a + sign next to it
Note: You can move and re-size the Map Contents and other horizontal menu bars to make them
easier to view. Please go to the chapter titled “Additional Tools and Site Functions” and look on p.
14 to learn more
9 |P a g
e
City of Glendale Neighborhood Information System (NIS)
After the menu bar has been expanded, you will need to use your mouse to move the
cursor over the + sign on the left of the word Glendale. When your cursor is over the +
sign, it will turn into the hand pointing upward,
just like when you select a map location. Press
your left mouse button to expand to + after you
have your cursor over it
After you have pressed the + sign with your cursor, a
listing of the available information will displayed. You
can scroll up or down this list by using the arrows on the
right side of the box
By putting the cursor over the box with your mouse and
left clicking on the mouse, you can check the boxes to
display that information or uncheck the boxes the same
way
From the list of expanded map contents, you can either
click on the empty box to the right of the + sign with your
cursor to place a “check” mark in the box, or if there is
already a “check” mark you can remove by clicking on it
with your cursor. When an item is checked or unchecked,
the map on the screen will reset when that information is
either added or removed.
By pressing the “+” next to each item you have checked off to
display, you can see the legend for that item. The “+” will
change to a “-“while the legend is open for that item.
Once you have selected the information you want to
display on the map, you can also open the legend or key for
each item that you have selected to display. You do this by
using your mouse to move the cursor over the + to the left
of the item name and left clicking on the mouse. The “+”
will change to a “-“. When you want to close the legend
for that item, use your mouse and cursor to left click on the
“-“.
3. Data Reports - Once you have gone to the geographic
location you want to look at, specific data reports are
available based on the area you are looking at. For instance,
if you are looking at a Neighborhood Statistical Area
(Census Tract), the reports will be for that particular NSA.
The data reports are available in a menu at the bottom right
of the screen after your search location has been selected.
You can access the data reports by moving your cursor over
the report name and left clicking on it with your mouse.
Data reports for the location you
are looking at are available here
After you have selected a report, a new screen will open
over the map screen. Depending on the report that you selected, you will have different
10 | P a g e C i t y o f G l e n d a l e N e i g h b o r h o o d I n f o r m a t i o n S y s t e m ( N I S )
options for that report. The four different data reports that may be available are Census
Summary, Detailed Census Report, Crime Statistics Report, and Code Compliance
Report.
Census Summary Report – After selecting the report, a new screen will appear which
will give you four types of data you can choose to look at. Select the type you want to
look at by checking or unchecking the squares next to the name by using your mouse to
place the cursor over the box and left clicking on the mouse. You can check as many of
these at a time as you want to display the information. Once the data is displayed, a print
button is also available to
print the information.
Detailed Census Report –
After selecting this report, a
new screen will appear
which will give you four
types of data you can
choose to look at. Select
the type you want to look at
by clicking on the circles
next to the name by using
your mouse to place the
cursor over the box and left
clicking on the mouse. As
these reports are much longer than the summary reports, you can only select one at a
time. Once the data is displayed, a print
button is also available to print the
information.
Crime Statistics Report - When you select
this report, a screen will appear which will
give you the option of two different types
of crime reports – Traffic Crashes, and
Uniform Crime Report. Select the report
type you want by using your mouse to click
the circle next to the report name.
You can only select one crime report type
(Traffic Crashes or Uniform Crime report)
at a time to view. If you want to change
which report you are looking at, just use
your mouse to select the circle next to the
different report above the map you want to
see for that area.
Code Compliance Report -- When you
select this report, a screen will appear
11 | P a g
e
City of Glendale Neighborhood Information System (NIS)
which will give you the option to either select “Display Data Only” which just gives you
just the code compliance data for the area or “Display Map and Data” which shows you
the data mapped along with the report.
For both the Code and Crime reports, once the report type has been selected, you will be
taken to a screen with a map of the report data. A key for the objects shown on the map
is available below the map by using the scroll bar on the right side of the screen. A print
button is also available at the top right of the map to print the map.
D. Additional Tools and Site Functions
In addition to the information and data available on the NIS, there are tools that you can
use to perform different tasks and functions on the site, which are designed to make it
more usable and assist you as you learn more about your neighborhood and the city.
1. Tool Buttons
On the top left side of the NIS main screen, there are seven tool buttons which perform
different functions.
Measure
Zoom In
Full
and Out Pan Extent
Magnify
Identify
The Tool buttons are found on the top left of the NIS
main screen. The tool button names are described below.
Zoom In and Zoom Out of the Map – This can be done by using your mouse to press
with the Zoom In button (magnifying glass with a + sign) or the Zoom Out (magnifying
glass with a – sign) After pressing either of those buttons, when you move the cursor
back over the map with your mouse, the cursor will change to a cross shape. Place the
hand to the area where you want to zoom in or out and left click your mouse. The map
will briefly reset than appear again with either a closer or further view.
Pan – This is used by pressing the button with the hand then moving the cursor with your
mouse back over the map. By clicking your mouse on the map, you can then “drag” it in
any direction to see other areas of the map. When you drag the map, the new area will be
blank for a few seconds before filling in.
Full Extent – The Full Extent button which has a picture of a globe with a magnifying
glass can be used to return the map to the full city view after you have gone to a search
location. Just press the button and the map will return to the full city view. The data
reports for the location area remain when you use Full Extent. To view the data for
another area, you will need to go to Search by Location.
Identify Tool – By using the identify tool, you can select objects that are displayed from
Map Layers, such as Parks, Schools and Zoning and get more information about them at
one time. First press the identify button using your mouse, and then move the cursor over
12 | P a g e C i t y o f G l e n d a l e N e i g h b o r h o o d I n f o r m a t i o n S y s t e m ( N I S )
the map. The cursor will change to pointing hand. Move the hand over the object, such
as a park or a school symbol, and left click your mouse over the item. When you have
done that a balloon shape with an “I” in it
will appear. In order to view the identify
results, you will need to open the Identify
Results bar on the left side of the screen.
You will need to open the results similar to
how you open the Map Layers legend to view information for each item.
Measurement Tool – By pressing the Measure Tool button with the picture of a ruler in
it, a box will appear over the map which says “Measure” on the top. Move the mouse
cursor back over the map and click on the map and draw a line. Double-click to end the
line. You can also make the lines turn or move at different angles by clicking once to
draw the line, then clicking once again and moving the line a different direction. Double
click to end the line. The Measure box will display the length of the line. You can select
Feet, Kilometer, Meter, or Miles from the drop down menu next to “Total Segment” in
the Measure box.
Magnify – If you have the map area zoomed out very far and are not sure what area you
want to look at, you can use the magnify tool to view it without changing the zoom or
search location area. After pressing the Magnify Tool, which has a picture of a folder
with a magnifying glass over it, a magnifier box will appear over the map area. The box
is set to magnify the area it is over at a scale of 2x. Using the drop down menu at the
bottom of the box, you can increase the magnification up to 10x.
2. Horizontal Panel Bars – On the left side of the screen, there are four horizontal bars
underneath the tool buttons. The bars are Identify Results, Map Contents (Legend),
Navigation and Overview. Map Contents were described on p. 10.
Identify Results – This bar displays the
results when a search is done using the
identify tool, described on page 13 - 14.
The display works similar to Map Contents
lists and allows you to display the available
layers or information about the city.
Navigating Map Contents is described in
detail on pages 10.
Navigation Panel – This bar lets you move the map in any direction. Use your mouse to
click on the arrow button on the right side of the bar. Once you have clicked on the
arrow, a compass will display below the bar. By clicking your mouse around the
compass, you can shift the map in that direction.
Overview Panel – This allows you to see exactly the area you are viewing in relation to
the entire city. Simply use your mouse and click the arrow button on the right side of the
bar. Once you have clicked the arrow, a box will appear with a small map of the city and
a red box around the area that you are currently looking at.
13 | P a g
e
City of Glendale Neighborhood Information System (NIS)
3. Browse City Feature – If you just want to look around the city without having to
select a specific geographic location to look at, you may do so from the main map screen
with the Browse City button. Either when you have just entered the site or when you have
reset the map from Search by Location,
the Browse City button can be used to
activate the tool buttons and tool bars.
You can then use the tool and menu
bars to search around the city and look
at the Map Contents. However, you
will need to use Search by Location if
you want the data for a specific area.
4. Resizing and Moving the
Horizontal Bars – Another feature
regarding the horizontal panels (Identify
Results, Map Contents, Navigation and
Overview) on the left side of the screen
is that you can move and resize them for better viewing.
This is done by left clicking with your mouse on the
double arrows on the right side of the panel bar. You can
do this either before or after you have expanded the box by
clicking on the down arrow. The bar will then move over
the main map. By using your cursor with the mouse, you
move the bar anywhere you want and by clicking on its
borders, resize it to better view the information contained
in it.
5. Printing and Exporting Maps and Tables - After the
main map screen is active, an Export/Print button will be
available. This will allow you to print or to save a jpeg file
of the map screen you are currently viewing,
including any data layers that you may have
open. A legend is not currently available on
the main map screen print. The data reports
also have print options. For the Crime and
Code data reports, you have the option to separately print the tables listing what is
displayed on the map.
14 | P a g
e
City of Glendale Neighborhood Information System (NIS)