1
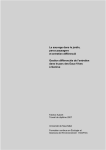
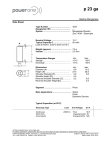
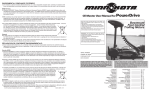
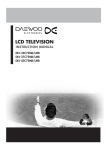
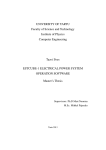
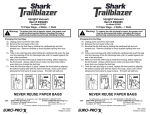
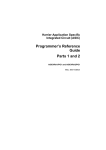
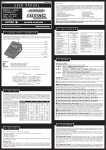
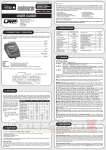
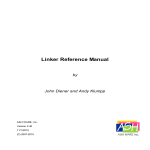
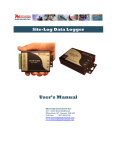
Date : 16/06/2006
Issue : 1
Rev : 0
Page : 1
of 43
Phase A
Electrical Power
System (EPS)
Final report
Prepared by:
Fabien Jordan
Checked by:
Approved by:
y
heig-vd
Yverdon
Switzerland
y
16/06/2006
y
Issue : 1
Rev : 0
Date : 16/06/2006
Page : 2
of 43
RECORD OF REVISIONS
ISS/REV
Date
Modifications
Created/modified by
1/0
14.06.2006
Initial Issue
Fabien Jordan (heig-vd)
Ref.: S3-A-EPS-1-0-EPS.doc
Issue : 1
Rev : 0
Date : 16/06/2006
Page : 3
of 43
RECORD OF REVISIONS .....................................................................................................................................2
FOREWORD ............................................................................................................................................................4
INTRODUCTION ....................................................................................................................................................5
CUBESAT CONCEPT
P-POD INTERFACE
LAUNCH VEHICULE
SCIENCE MISSION OBJECTIVE
ELECTRICAL POWER SYSTEM (EPS) ROLE
1
REFERENCES................................................................................................................................................8
1.1
1.2
2
5
6
6
7
7
NORMATIVE REFERENCES
INFORMATIVE REFERENCES
8
8
TERMS, DEFINITIONS AND ABBREVIATED TERMS .........................................................................9
2.1
ABBREVIATED TERMS
2.1.1
Subsystems abbreviations
2.1.2
Technical abbreviations
2.1.3
Definitions
9
9
9
10
3
SEMESTER PROJECT OBJECTIVES .....................................................................................................11
4
EPS DESIGN REQUIREMENTS ...............................................................................................................12
4.1
4.2
4.3
4.4
4.4.1
4.4.2
4.4.3
5
Space environment assumptions
Power determination assumptions and approach
14
14
DESIGN TRADES / ANALYSES................................................................................................................15
6.1
ENERGY CAPTURED BY PHOTOVOLTAIC CELLS
6.1.1
Triple junctions cells characteristics
6.1.2
Triple junctions cells degradations
6.1.3
Cells layout
6.1.4
Power calculation : Approach optimistic
6.1.5
Power calculation : Approach pessimistic
6.1.6
Albedo's contribution
6.1.7
Total Energy generated by the solar cells
6.2
MAXIMUM POWER POINT TRACKING (MPPT)
EPS ARCHITECTURE
6.2.1
One step-up converter per side
6.2.2
One step-up converter for all sides
6.2.3
Step-up converter
6.2.4
Low-Dropout Linear regulator (LDO)
6.2.5
Common Mode Filters
6.2.6
Batteries
7
12
13
13
13
13
13
13
DESIGN ASSUMPTIONS AND APPROACH ..........................................................................................14
5.1.1
5.1.2
6
PHYSICAL STRUCTURE REQUIREMENTS
ELECTRICAL REQUIREMENTS
DATA FLOW REQUIREMENTS
OTHER SPECIFICATIONS
Remove before flight pin
Thermal requirements
Deployment and Transmission delay
15
15
18
19
20
23
25
25
26
28
28
29
30
32
35
36
CONCLUSIONS ...........................................................................................................................................43
Ref.: S3-A-EPS-1-0-EPS.doc
Issue : 1
Rev : 0
Date : 16/06/2006
Page : 4
of 43
FOREWORD
SwissCube project aims at designing a picosatellite according to the conventional standard provided
by CubeSat. The design and the development of the SwissCube picosatellite will be carried out by
students of Swiss Federal Institute of Technology in Lausanne (EPFL) and other Swiss engineer
schools and universities.
This report was written at the request of the SwissCube project steering committee. Its purpose is to
examine and evaluate the different possibilities and to make recommendations concerning the
SwissCube Electrical Power System (EPS).
The introduction gives a description of the CubeSat concept, the science mission objective and of
course the electrical power system role. Chapter 3 enumerates the semester project objectives. Then,
chapter 4 describes which requirements are imposed to the EPS design. The assumptions and
approach are described in the 5th chapter and finally chapter 6 explains the different trades-off and
gives some analysis recommendations.
Figure 1 : Example : AAUSAT-1 CubeSat
Ref.: S3-A-EPS-1-0-EPS.doc
Issue : 1
Rev : 0
Date : 16/06/2006
Page : 5
of 43
INTRODUCTION
The SwissCube project is directed by the Space Center at the Swiss Federal Institute of Technology
in Lausanne (EPFL). This project is based on the CubeSat program started by Stanford University
and Polytechnic State University (Cal Poly) in 1999.
CubeSat concept
The CubeSat project developed by Cal Poly is an international collaboration of over 40 universities,
high schools, and private firms developing picosatellites containing scientific, private, and
government payloads.
The primary mission of this program is to provide access to space for small payloads.
The CubeSat program gives students the opportunity to work in the space technologies field. This
opportunity is possible by reducing the cost and development time generally associated with satellite
design. To reduce these cost and time constraints it is necessary to drastically reduce the dimensions
of the satellite.
It is the reason why the fundamental defining feature of the CubeSat standard is its dimensions of
10 x 10 x 10 cm and its mass of no more than 1 kg.
Figure 2 : CubeSat standard dimensions [N1]
Ref.: S3-A-EPS-1-0-EPS.doc
Issue : 1
Rev : 0
Date : 16/06/2006
Page : 6
of 43
P-POD Interface
The Poly Picosatellite Orbital Deployer (P-POD) is Cal Poly’s standardized CubeSat deployment
system. It is capable of carrying three standard CubeSats and serves as the interface between the
CubeSats and LV (Launch Vehicule). The P-POD is an aluminum, rectangular box with a door and
a spring mechanism. CubeSats slide along a series of rails during ejection into orbit. CubeSats must
be compatible with the P-POD to ensure safety and success of the mission. [N1]
Figure 3 : Poly Picosatellite Orbital Deployer (P-POD)
Launch Vehicule
The SwissCube will be launched by a Vega LV. More information about the Vega LV is given in the
VEGA launch vehicule User's Manual. [R1]
Figure 4 : Vega LV
Ref.: S3-A-EPS-1-0-EPS.doc
Issue : 1
Rev : 0
Date : 16/06/2006
Page : 7
of 43
Science Mission Objective
The science Payload objective is taking comprehensive measurements of the NightGlow
Phenomenon. This luminous phenomenon appears on the earth atmosphere and can be observed
by satellite during eclipse because it generates a green luminous glow as shown in Figure 5. The
SwissCube will be able to take optical measurements and characterize the Nightglow phenomena
over all latitudes and longitudes for at least a period of 3 months.
Figure 5 : NigthGlow Phenomena
Electrical Power System (EPS) Role
The primary EPS function is capturing solar energy from the sun and albedo with solar cells during
the daylight and then to transmit it to the subsystems. Given the fact that NightGlow phenomenon
can only take measurements during the eclipse SwissCube will have a helios-synchronous orbit in
such a way that it will be in eclipse during about 30% of the orbital period. So a part of the captured
solar energy must be kept in a battery in order to return it to the subsystems during the eclipse
(during this time the solar cells are of course quasi inefficient).
The 3 main SwissCube electrical consumers are :
-
Electrical Power System (converters and linear regulators)
-
Attitude Control and Determination System (magnetotorquers, motors, …)
-
Communication System (RF transmitter, …)
The payload will take photographs during the eclipse but this work doesn't consume a lot of energy.
The secondary EPS function is protecting the different subsystems against a phenomenon called
"Single Event Latch-up" (SEL). This phenomenon happens when a high energy particle hits the
device. If the impact on the device is of a serious nature, the high energy particle can directly cause
damage to the devise. This phenomenon happens very quickly and must be detected and corrected
in hardware.
In case of the power not being turned off at a latch-up, a burn-out can occur and destroy the chip.
Ref.: S3-A-EPS-1-0-EPS.doc
Issue : 1
Rev : 0
Date : 16/06/2006
Page : 8
of 43
1 REFERENCES
1.1 Normative references
[N1]
"CubeSat Design Specification" (CDS), June, 2004.
http://littonlab.atl.calpoly.edu/pages/documents/developers.php
[N2]
RWE Space Solar Power GmbH, Cell Type : RWE3G-ID2/150-8040
1.2 Informative references
[R1]
VEGA launch vehicule User's Manual, March, 2006.
http://www.arianespace.com/site/documents/vega_man_index.html
[R2]
M. Meusel, "Development status of European multi-junction space solar cells with high
radiation hardness", 20th European Photovoltaic Solar Energy Conference, Spain, Barcelona,
June, 2005.
[R3]
G. Strobl, "Advanced GaInP/Ga(In)As/Ge triple junction space solar cells", 3rd World
Conference on Photovoltaic Energy Conversion, Osaka, Japan, May, 2003.
[R4]
ECSS-E-10-04A, "Space environment", January, 2000.
[R5]
M. Correvon, "Alimentations à découpage à inductance simple", cours de systèmes
électroniques, heig-vd, Yverdon, Suisse
http://iai.heig-vd.ch/cours.php
[R6]
VARTA Microbattery, "Sales Program and technical handbook", PoLiFlex, Superior
Polymer Technology.
Ref.: S3-A-EPS-1-0-EPS.doc
Issue : 1
Rev : 0
Date : 16/06/2006
Page : 9
of 43
2 TERMS, DEFINITIONS AND ABBREVIATED TERMS
2.1 Abbreviated terms
2.1.1 Subsystems abbreviations
ADCS
Attitude Determination and Control System
CDMS
Control and Data Management System
COM
Communication System
EPS
Electrical Power System
MECH
Mechanisms
P/L
Payload
2.1.2 Technical abbreviations
BOL
Beginning Of Life
CAN
Controller Area Network
DOD
Depth Of Discharge
DnTnS
Daylight without transmission and without science
DTS
Daylight with Transmission and with science
EOL
End Of Life
EnTnS
Eclipse without Transmission and without science
ETS
Eclipse with Transmission and with science
GaAs
Gallium Arsenide
LDO
Low-Dropout Linear regulator
Li-Ion
Lithium-Ion
Li-Po
Lithium-Polymer
LV
Launch Vehicle
MPPT
Maximum Power Point Tracking
I 2C
Inter-Integrated Circuit
PCB
Printed Circuit Board
PV
Photovoltaic
SEL
Single Event Latch-up
TBD
To be defined
Ref.: S3-A-EPS-1-0-EPS.doc
Issue : 1
Rev : 0
Date : 16/06/2006
Page : 10
of 43
2.1.3 Definitions
Albedo
Albedo is a measure of reflectivity of a surface or body. It is the ratio of total
electromagnetic radiation reflected to the total amount incident upon it. The
average albedo of Earth is about 30%.
Dropout voltage
The dropout voltage is the minimum difference between input and output
voltage that a LDO needs to do the output voltage regulation.
Ref.: S3-A-EPS-1-0-EPS.doc
Issue : 1
Rev : 0
Date : 16/06/2006
Page : 11
of 43
3 SEMESTER PROJECT OBJECTIVES
The mains objectives of this semester project are collecting information about the space power
supply methods and making some preliminary calculations about the power production, the power
needs, the dimensions and the mass of the SwissCube Electrical Power System. Finally, the goal is
giving several design trade-off with a favorite solution.
To fulfill these objectives, the following tasks have to be done :
-
Read the project documentation (specifications, infrastructure,…),
-
Read about EPS (other CubeSat papers,…),
-
Build a Functional Block Diagram of EPS with the other subsystems interfaces,
-
Build a Hardware Block Diagram,
-
Build an Architecture, Design and Technology option trees.
These different tasks have to be used as tools to correctly develop each subsystem. This working
method will help us to think about of a maximum of solutions and configurations.
Ref.: S3-A-EPS-1-0-EPS.doc
Issue : 1
Rev : 0
Date : 16/06/2006
Page : 12
of 43
4 EPS DESIGN REQUIREMENTS
This chapter will enumerate the different design requirements. First, the physical, electrical and data
flow requirements will be listed and then we will speak about some other important specifications.
4.1 Physical structure requirements
The physical structure requirements for the EPS are principally the mass allocation, the PCB surface
and the battery volume. So here are these physical constraints :
-
Mass allocation :
130 g
(given at the Team Meeting 16-03-06)
-
PCB dimensions :
88 x 98 mm
(given by Structure and Configuration subsystem)
-
Battery volume :
45 x 15 x 90 mm (given by Structure and Configuration subsystem)
Batteries (black)
EPS PCB (blue)
Payload
Figure 6 : Batteries and PCB position
Ref.: S3-A-EPS-1-0-EPS.doc
Issue : 1
Rev : 0
Date : 16/06/2006
Page : 13
of 43
4.2 Electrical requirements
No electronics may be active during launch to prevent any electrical of RF interference with the
launch vehicle and primary payloads. CubeSats with rechargeable batteries must be fully deactivated
during launch or launched with discharged batteries.
4.3 Data Flow requirements
ADCS need power information from each side covered by cells. In fact, ADCS will use these power
datas to determine the satellite attitude. This is an important constraint that we have to include in
our design.
4.4 Other Specifications
4.4.1 Remove before flight pin
A remove before flight (RBF) pin is required to deactivate the CubeSats during integration outside
the P-POD. The pin will be removed once the CubeSats are placed inside the P-POD. This pin will
be directly connected to EPS.
4.4.2 Thermal requirements
Operating temperature range is expected to be -40°C to 70°C.
4.4.3 Deployment and Transmission delay
To allow adequate separation of CubeSats, antennas may be deployed 15 minutes after ejection from
the P-POD (as detected by CubeSat deployment switches).
CubeSats may enter low power transmit mode (LPTM) 15 minutes after ejection from the P-POD.
LPTM is defined as short, periodic beacons from the CubeSat.
CubeSats may activate all primary transmitters, or enter high power transmit mode (HPTM) 30
minutes after ejection from the P-POD.
Ref.: S3-A-EPS-1-0-EPS.doc
Issue : 1
Rev : 0
Date : 16/06/2006
Page : 14
of 43
5 DESIGN ASSUMPTIONS AND APPROACH
This chapter will list the different design assumptions and describe the calculation approach. First,
Space environment assumptions will be explained and then the power determination will be
described.
5.1.1 Space environment assumptions
In a first approach we suppose that insolation and albedo are constant when the satellite is in the
sunny area (daylignt). In the shady area (eclipse) we consider that radiations are null.
Solar constant (out of atmosphere) : 1368 W/m2
Albedo :
410 W/m2
Insolation period (worst case) :
56.6 min
Eclipse period :
36 min
Temperature (worst case) :
10 °C
(with an altitude of 400 km)
The last calculation result obtained by thermal subsystem for the ambient temperature was a range
between -23°C and 10°C. When the temperature grows the solar cells efficiency decrease. So the
worst case is 10°C.
5.1.2 Power determination assumptions and approach
The power that is obtained from solar cell is depended on the angle of incident light. So we assume
this generated power is approximated with a cosine of incident light.
To determine the power production, two parameters have to be considered : the limit angle of total
reflection (when the incident light ray is totally reflected by the cell) and the cell efficiency (which
depends on several degradations factors).
First, we can consider the best case :
-
Limit angle of total reflection :
0°
-
Cells efficiency :
26.6 % (@ 28°C)
Then, we can consider the worst case :
-
Limit angle of total reflection :
20°
-
Cells efficiency :
20.1 % (@ 28°C)
Remark : For the moment, all the power simulations have been made with a temperature of 28°C.
In the next step (Phase B) it will be necessary to simulate with the exact temperature range.
If the temperature is low that's not a problem but an advantage because the solar cells efficiency is
better, so the power results obtained will be necessarily better.
Ref.: S3-A-EPS-1-0-EPS.doc
Issue : 1
Rev : 0
Date : 16/06/2006
Page : 15
of 43
6 DESIGN TRADES / ANALYSES
6.1 Energy captured by photovoltaic cells
Due to increasing requirement for power, mass and area traditional silicon solar cells will be more
and more replaced by high efficiency multi-junction solar cells on space solar generators. [R2]
Swisscube will certainly be equipped with high efficiency triple junctions cells like this one :
Figure 7 : High efficiency triple junction cell (scale 1:1)
6.1.1 Triple junctions cells characteristics
GaAs based solar cells have the potential to reach efficiencies greater than 30%. In the meantime
cells with up to 28% efficiency are available. [R3]
Figure 8 : Triple-junction space solar cell grown on a ultra thin Ge substrate
To carry out the electrical power calculation we have initially considered the following cell type :
RWE3G-ID2/150-8040 which have an average efficiency of 26.6 % (begin of life). [N2]
Ref.: S3-A-EPS-1-0-EPS.doc
Issue : 1
Rev : 0
Date : 16/06/2006
Page : 16
of 43
Here are some information about RWE3G-ID2/150-8040 cell type :
Design and mechanical data
Dimensions :
40 x 80 mm
Cell Area :
30.18 cm2
Average Weight :
2.6 g
Electrical Data
unit
BOL* @ 28°C
Average Open Circuit
Voc
[V]
2.554
Average Short Circuit
Isc
[A]
0.498
Voltage at max. Power
Vpmax [V]
2.258
Current at max. Power
I pmax [A]
0.480
Maximal Power
Pmax
[W]
1.083
Average Efficiency
η
[%]
26.6
*BOL = "Begin Of Life"
Temperature Gradients
unit
BOL
dVoc/dT
[mV/°C]
-6.0
dIsc/dT
[mA/°C]
0.272
dVpmax/dT [mV/°C]
dPmax/dT
-6.4
[mW/°C] 2.72
Ref.: S3-A-EPS-1-0-EPS.doc
Issue : 1
Rev : 0
Date : 16/06/2006
Page : 17
of 43
Result of the temperature variations is plotted in Figure 10. The temperature range that we consider
is -23 °C to 10 °C.
BOL
1E14
2E14
4E14
Voc (T) [V]
3.5
3
2.5
2
1.5
-50
-40
-30
-20
-10
0
10
20
30
40
50
60
70
80
90
100
-40
-30
-20
-10
0
10
20
30
40
50
60
70
80
90
100
-40
-30
-20
-10
0
10
20
30
40
50
60
70
80
90
100
-40
-30
-20
-10
0
10
20
30
40
Temperature [°C]
50
60
70
80
90
100
0.54
Isc (T) [A]
0.52
0.5
0.48
0.46
0.44
-50
Vpmax (T) [V]
3
2.5
2
1.5
-50
Pmax (T) [W]
1.4
1.2
1
0.8
-50
Figure 9 : Temperature effect
Ref.: S3-A-EPS-1-0-EPS.doc
Issue : 1
Rev : 0
Date : 16/06/2006
Page : 18
of 43
6.1.2 Triple junctions cells degradations
Packaging and fabrication losses
Mismatch & fabrication
0.98
Wiring & diode loss
0.96
Packing factor
1
Environment issues
Temp. loss factor
1.00
Shadowing losses
0.90
Life factors
Ultraviolet degradation
0.98
Radiation degradation
0.95
Fatigue (thermal cycling)
0.98
Micrometeoroid loss
0.98
Additional margin
1
The product of all these factors gives the degradations factor. If we multiply the BOL cell efficiency
by the degradation factor we obtain the EOL cell efficiency.
Degradation factor
0.757
Cell efficiency BOL
26.6 %
Cell efficiency EOL
20.1 %
Ref.: S3-A-EPS-1-0-EPS.doc
Issue : 1
Rev : 0
Date : 16/06/2006
Page : 19
of 43
6.1.3 Cells layout
As it has been decided with the other subsystems, SwissCube will have five sides covered by triplejunction solar cells. Each of these five sides is covered by two solar cells :
Figure 10 : Two cells per side, on five of the six sides
One side must be free for the hole of the camera's objective and for the antenna's fixings :
Figure 11 : The camera and antenna side
Now, the power generated by the solar cells is calculated with a Matlab Model.
Ref.: S3-A-EPS-1-0-EPS.doc
Issue : 1
Rev : 0
Date : 16/06/2006
Page : 20
of 43
6.1.4
Power calculation : Approach optimistic
To do this calculation, we have supposed that the SwissCube is fixed and a light source is turning
around. For the first step of the calculation we consider the vertical plane with an angle alpha :
α = 90°
α = 0°
D
α = 180°
A
F
B
E
C
α = 270°
4.5
side A
side B
side C
side D
sum
4
3.5
Power [W]
3
2.5
2
1.5
1
0.5
0
0
50
100
150
200
250
300
350
α [°]
Figure 12 : Power generated from the insolation (vertical plane)
Ref.: S3-A-EPS-1-0-EPS.doc
Issue : 1
Rev : 0
Date : 16/06/2006
Page : 21
of 43
Here is the second step (plane of β) :
β = 90°
β = 0°
β = 180°
β = 270°
D
A
F
B
E
C
4.5
side D
side E
side B
side F (camera)
sum
4
3.5
Power [W]
3
2.5
2
1.5
1
0.5
0
0
50
100
150
200
250
300
350
β [°]
Figure 13 : Electrical power generated from the sun (horizontal plane)
Ref.: S3-A-EPS-1-0-EPS.doc
Issue : 1
Rev : 0
Date : 16/06/2006
Page : 22
of 43
We can now calculate the total power generated whichever the angle β or α we choose :
Figure 14 : Total power generated from the sun (best case)
This matrix describe the electrical power that can be produce whatever the satellite's attitude, in the
best case (limit angle = 0° and efficiency = 26.6%).
Maximum value obtained from Matlab is :
Pmax = 3.80 W
This power peak happen when three sides covered by cells are equally exposed to the sun (for α =
45°, 135°, 225°, 315° and β =125° or 235 °).
Average value obtained from Matlab is :
Pav = 2.47 W
This value is valid under the assumption that all sides are equally exposed to the sun during the
mission.
Ref.: S3-A-EPS-1-0-EPS.doc
Issue : 1
Rev : 0
Date : 16/06/2006
Page : 23
of 43
6.1.5 Power calculation : Approach pessimistic
Now, we can do the same calculations for the worst case (limit angle = 20° and efficiency = 20.1%)
3.5
side A
side B
3
side C
side D
sum
Power [W]
2.5
2
1.5
1
0.5
0
0
50
100
150
200
250
300
350
α [°]
Figure 15 : Power generated from the insolation (vertical plane)
3.5
side D
side E
side B
side F (camera)
sum
3
Power [W]
2.5
2
1.5
1
0.5
0
0
50
100
150
200
250
300
350
β [°]
Figure 16 : Power generated from the sun (horizontal plane)
Ref.: S3-A-EPS-1-0-EPS.doc
Issue : 1
Rev : 0
Date : 16/06/2006
Page : 24
of 43
Figure 17 : Total power generated from the sun (worst case)
This matrix describe the electrical power that can be produce whatever the satellite's attitude in the
worst case (limit angle = 20° and efficiency = 20.1%).
Maximum value obtained from Matlab is :
Pmax = 2.86 W
This power peak happen when three sides covered by cells are equally exposed to the sun (for α =
45°, 135°, 225°, 315° and β =125° or 235 °).
Average value obtained from Matlab is :
Pav = 1.75 W
This value is valid under the assumption that all sides are equally exposed to the sun during the
mission.
But the satellite's attitude is quite favourable because the side without cells would hardly never be
exposed. With the two matrix represented at figure 15 and figure 18 we have calculated an average
value with the probable satellite's attitude for the best and worst cases :
Assumption : 107° < β < 119° (Inclination given by P/L subsystem : 17 to 29 °)
- Best case :
Pav = 3.26 [W]
- Worst case : Pav = 2.30 [W]
For the next developments we will consider the worst case : Pav_sun = 2.30 [W].
Ref.: S3-A-EPS-1-0-EPS.doc
Issue : 1
Rev : 0
Date : 16/06/2006
Page : 25
of 43
6.1.6 Albedo's contribution
We have used exactly the same approach to determine the albedo's contribution. In fact, albedo can
be considered like insolation because waves length are approximately the sames :
" A value of 0,3 and the same spectrum as the Sun were specified as standard for the Earth albedo.
On a short time scale, albedo can be very variable and range from about 0,05 to 0,6."
" The albedo spectrum can change, depending on properties of the surface and atmosphere.
Ground vegetation and atmospheric water and dust can lead to absorption in certain wavelength
bands and result in a highly variable albedo spectrum." [R4]
So Albedo is not constant but we can consider that average albedo is about 30 % of insolation :
Albedo = 1368 · 30% = 410 [W/m2].
Assumption : 61° < β < 73° (Inclination given by P/L subsystem : 17 to 29 °)
- Best case :
Pav = 0.72 [W]
- Worst case : Pav = 0.55 [W]
For the next developments we will consider the worst case : Pav_albedo = 0.55 [W].
6.1.7 Total Energy generated by the solar cells
Now, we can easily determine the energy potentially captured by photovoltaic cells during one
revolution :
Insolation period : Tinsolation = 56.6 min
Erevol = (Pav_sun + Pav_albedo) · Tinsolation/60 = 2.69 [Wh]
Ref.: S3-A-EPS-1-0-EPS.doc
Issue : 1
Rev : 0
Date : 16/06/2006
Page : 26
of 43
6.2 Maximum Power Point Tracking (MPPT)
All previous results are valid if we can extract the maximum power of each solar cell. But one
problem in connecting a solar cell to a load or to a battery is that the cell works at maximum
efficiency for only one current and voltage value. In order to use PV cells efficiently we need to
know how they behave when connected to various electrical loads. If a PV cell is connected to a
variable electrical resistance R, together with an ammeter to measure the current (I) in the circuit
and a voltmeter to measure the voltage (V) developed across the cell terminals. When the resistance
is infinite the current in the circuit is at its minimum and the voltage across the cell is at its
maximum, known as the "open circuit voltage" (Voc). At the other extreme, when the resistance is
zero, the cell is in effect "short circuited" and the current in the circuit then reaches its maximum,
known as the "short circuit current" (Isc). If we vary the resistance between zero and infinity, the
current and voltage will be found to vary as shown in Figure 22, which is known as the "I-V
characteristic" of the cell. It can be seen from the graph that the cell will deliver maximum power
(i.e. the maximum product of voltage and current) when the external resistance is adjusted so that its
value corresponds to the maximum power point (MPP) on the I-V curve.
Pmax = V p max ⋅ I p max
Figure 18 : I-V characteristic of a typical solar cell
Ref.: S3-A-EPS-1-0-EPS.doc
Issue : 1
Rev : 0
Date : 16/06/2006
Page : 27
of 43
At lower levels of solar radiation than the maximum the general shape of the I-V characteristic stays
the same, but the area under the curve decreases, and the maximum power point moves to the left.
The short circuit current is directly proportional to the intensity of solar radiation on the cell, while
the open circuit voltage is only weakly dependent on the solar radiation intensity. The open circuit
voltage also decreases linearly as cell temperature increases as shown in Figure 10.
Power can also be tracked on several parallel cells, even if the intensity of solar radiation differs on
each two cells (there are two cells per side) because the MPP of the different cells are approximately
on a straight line as shown on Figure 24. But these different MPP can move if the temperature is
very different between two sides. So the voltage level is the same for each branch and then several
solar cells branches can work together. With this method of global power tracking we can't assure
extracting the maximum power of each solar cell but almost. So we will certainly use this method of
power tracking for the SwissCube.
Figure 19 : Parallel cells with protection diodes
Figure 20 : The different MPP are on a straight line
Ref.: S3-A-EPS-1-0-EPS.doc
Issue : 1
Rev : 0
Date : 16/06/2006
Page : 28
of 43
EPS Architecture
6.2.1 One step-up converter per side
Solar cells
Step up
converter
Floating Power Bus
3.7 – 4.2 V
Batteries
Solar cells
Step up
converter
3 - 3.3 V
Solar cells
Solar cells
Solar cells
Step up
converter
LDO
Filter
ACDS
LDO
Filter
CDMS
LDO
Filter
COM
LDO
Filter
P/L
LDO
Filter
Step up
converter
Step up
converter
EPS
-
Power tracking on each side (duty cycles adjustment)
-
Step-up output current control (duty cycles adjustment)
-
Battery charge control (duty cycles adjustment)
Advantages :
-
we can extract the maximum power of each solar cell.
Disadvantage :
-
too much heavy (converter's inductances)
-
require important calculation power
-
voluminous (converter's inductances)
Ref.: S3-A-EPS-1-0-EPS.doc
Issue : 1
Rev : 0
Date : 16/06/2006
Page : 29
of 43
6.2.2 One step-up converter for all sides
Floating Power Bus
Solar cells
3.6 – 4.2 V
Step up
converter
Batteries
Solar cells
3 - 3.3 V
LDO
Filter
ACDS
LDO
Filter
CDMS
LDO
Filter
COM
LDO
Filter
P/L
LDO
Filter
Solar cells
Solar cells
Solar cells
EPS
-
Global power tracking (duty cycle adjustment)
-
Step-up output current control (duty cycle adjustment)
-
Battery charge control (duty cycle adjustment)
Advantages :
-
less heavy
-
less voluminous
Disadvantage :
-
we can't assure extracting the maximum power of each solar cell (but almost !).
ADCS need power information from each cells covered side. This is an important constraint that we
have to include in our design. The two solutions make it possible.
Ref.: S3-A-EPS-1-0-EPS.doc
Issue : 1
Rev : 0
Date : 16/06/2006
Page : 30
of 43
6.2.3 Step-up converter
The Step-up converter (or Boost converter) uses a parallel static contactor which must be supply by
a current source and to output in a voltage source. The receiver itself consists of a resistance R and
the filtering capacitor C assembled in parallel to its terminals. This receiver has the behaviour of a
voltage source. [R3]
Current source
Voltage source
Figure 21 : Step-up converter
Figure 22 : Q : ON and Q : OFF
Ref.: S3-A-EPS-1-0-EPS.doc
Issue : 1
Rev : 0
Date : 16/06/2006
Page : 31
of 43
Figure 23 : Step-up current and voltage characteristics
Ref.: S3-A-EPS-1-0-EPS.doc
Issue : 1
Rev : 0
Date : 16/06/2006
Page : 32
of 43
6.2.4 Low-Dropout Linear regulator (LDO)
Generally, power supplies give a regulated voltage. It means that the voltage amplitude must vary as
little as possible when the output current and the input energy source vary. The voltage amplitude
should also not be altered by the temperature variations.
The floating Power Bus voltage level is 3.6 to 4.2 Volts. The output voltage level for each subsystem
is 3.3 ± 5 % Volts (standard electronic voltage level). Between these two levels, we need a regulator
to assure the output voltage specifications. The LDO is an ideal component to do this regulation
job.
The LDO can also be use by the EPS microcontroller as a switch to enable or disable the different
subsystems outputs with a logic signal. This function is very important in case of short circuit on
one of the subsystems input.
For the moment, we have principally considered the TEXAS INSTRUMENTS LDO's familiy
TPS 770xx.
This family of LDO offers the benefits of low dropout voltage, ultralow-power operation, and
miniaturized packaging. The TPS 770xx family series devices are ideal for micropower operations
and where board space is limited.
These LDO also have an over current limitation, a thermal protection and an operating junction
temperature range of -40 °C to 125 °C.
Figure 24 : Functional block diagram and DVB Package
The dropout voltage is the minimum voltage that LDO needs to do its regulation between input
voltage and output voltage. The TPS 770xx family series devices need only 35 mV of dropout
voltage at 50 mA.
The regulated output voltage is very accurate.
Each LDO will be chosen according to the different subsystems power needs.
The mass of one TPS 77001 LDO of this family has been estimated at 2 grams and we need
maximum 6 of them. But actually, the architecture is composed of 5 LDO. The 6th may be used to
supply the antenna deployment but this point must be defined. For the moment we assume that the
antenna deployment is supplied without regulator. But anyway we will use an electronic component
to switch on the deployment mechanism.
Ref.: S3-A-EPS-1-0-EPS.doc
Issue : 1
Rev : 0
Date : 16/06/2006
Page : 33
of 43
Remark :
The energy that the antenna deployment requires is very low. It consumes only 2000 mW during 1
second which corresponds to 0.55 mWh only.
Beacon
3.3 V
COM
3.3 V
CDMS
3.3 V
PL
3.3 V
ADCS
3.3 V
(TBD)
Solar Cells
Figure 25 : Electrical block diagram - LDO layout
Here is an output voltage vs output current typical characteristic (TPS 77033) :
Figure 26 : Typical LDO load regulation characteristic
Ref.: S3-A-EPS-1-0-EPS.doc
Issue : 1
Rev : 0
Date : 16/06/2006
Page : 34
of 43
Here is a ripple rejection vs frequency typical characteristic (TPS 77033) :
Figure 27 : Typical LDO ripple rejection characteristic
The ripple frequency on the input voltage will certainly be included between 50 kHz and 100 kHz.
At this frequency the ripple rejection is at worst 27 dB. So if we have an input ripple of 50 mV, the
output ripple will be at worst about 2.5 mV.
LDO power losses calculation method :
LDO power losses depend on the output current and levels difference between input and output
voltage. This voltage difference has been estimated at 0.7 Volt on average. The output current has
been calculated with the average power consummation of each subsystem.
Ploss = Δ V ⋅ I out
Δ V = V in − V out
I out =
Psubsystem
V out
Ref.: S3-A-EPS-1-0-EPS.doc
Issue : 1
Rev : 0
Date : 16/06/2006
Page : 35
of 43
Here are the results for each subsystem :
Subsystems
Psubsystem [mW]
Iout [mA]
Ploss [mW]
ACDS
550
167
117
EPS (+Beacon) CDMS
100
30
21
40
12
9
COM (RF transmit,
receiver and control)
270
82
57
PL
25
8
5
Ploss_tot ≈ 200 mW
Figure 28 : LDO power losses results
6.2.5 Common Mode Filters
The Common Mode Filter is a passive component. In fact it is simply composed by a circular ferrite
and two inductances as shown on figure 36.
Figure 29 : Schema of a Common Mode Filter
When the output current passes through the first inductance it creates a magnetic field. When the
same current come back by the second inductance it generates also a magnetic field but inverse. So
the two fields cancel each other out.
It is important to place Common Mode Filters on each EPS Power output are. This measure obliges
the output current to come back by the same way. This simple device assures that it doesn't have
presence of loop currents between the subsystems.
Ref.: S3-A-EPS-1-0-EPS.doc
Issue : 1
Rev : 0
Date : 16/06/2006
Page : 36
of 43
6.2.6 Batteries
A lot of factors must be considered to find the right battery for the SwissCube. But something is
sure : the technology choice will be either Li-Ion either Li-Po as shown on figure 33.
A : Lithium-Polymer / B : Lithium-Ion / C : Ni-MH / D : Ni-Cd / E : Lead [R6]
Figure 30 : Battery technology choice
Ref.: S3-A-EPS-1-0-EPS.doc
Issue : 1
Rev : 0
Date : 16/06/2006
Page : 37
of 43
1) Nominal Voltage, Vnom and Average Voltage, Vav:
The output nominal voltage of two solar cells in series will be about 3.9 V (with a fall voltage of 0.5
V on the protection diode). The output voltage of LDO is 3.3 V. So we decided to use a battery
with a typical voltage of 3.6 or 3.7 V (depends on technology Li-Ion or Li-Po). With this choice we
don’t unnecessary loose energy to step up the voltage to a higher level like 5 V or more and then to
step it down to 3.3 V with the LDO.
Actually, we are very interested by a Li-Po technology made by VARTA Microbattery which has a
nominal Voltage of 3.7 V. But the average Voltage on the battery terminals will not be 3.7 V
because when we charge the battery its terminals voltage increases to 4.2 V. But for the moment we
suppose that this level of 4.2 V will never be reached and we assume that the Average Voltage on
the battery terminals is 4.0 V.
Assumptions :
Vnom = 3.7 V
Vav = 4.0 V
Ref.: S3-A-EPS-1-0-EPS.doc
Issue : 1
Rev : 0
Date : 16/06/2006
Page : 38
of 43
2) Accumulated Energy, Eacc :
During the daylight the solar cells generate some electrical energy. For the most part, this energy is
directly transmitted to the subsystems. But a smaller part of this power production must be kept in
the battery in order to return it to the subsystems during the eclipse. Of course the energy
accumulated in the batteries must be greater than the amount of energy needed during an eclipse.
So we need to know :
1)
the amount of energy generated by the cells :
Eprod
[Wh]
2)
the amount of energy needed during the daylight :
Eday_needs
[Wh]
3)
the amount of energy needed during an eclipse :
Eecl_needs
[Wh]
Assumptions (for the worst case) :
Eprod = 2.69 Wh
(see chapter 6.1.7)
Eday_needs = 2.02 Wh
(see Power Budget created by System Engineering => DTS)
Eecl_needs = 1.19 Wh
(see Power Budget created by System Engineering => ETS)
Calculation :
Eacc = Eprod - Eday_needs = 2.69 – 2.02 = 0.67 Wh
But Eacc must be greater than Eecl_needs . So at least it is necessary to accumulate an amount of energy
greater than 1.19 Wh. In these conditions the satellite need at least two more daylights with a
minimum consumption (DnTnS and EnTnS) to recharge the batteries.
Ref.: S3-A-EPS-1-0-EPS.doc
Issue : 1
Rev : 0
Date : 16/06/2006
Page : 39
of 43
3) Capacity, Ctot :
The DOD is the percentage of the full capacity of the battery that is used during each
charge/discharge cycle. The satellite lifetime depends on the batteries lifetime and the batteries
lifetime depends on the chosen DOD. So it is necessary to choose a correct DOD. The DOD can
be chosen according to the number of charge/discharge cycles.
As it is required, the mission will last at least 3 months, but we would like to be operational during
one year. On a helio-synchronous orbit, the satellite will turn 15 times around the Earth in one day.
For ones year, it will do 5475 revolutions. According to the literature, we should choose a DOD of
30 % for this number of cycles.
So we need to know :
4)
the Accumulated Energy :
Eacc
[Wh]
5)
the Depth Of Discharge :
DOD [%]
6)
the average Voltage on the battery terminals :
Vav
[V]
7)
the ambient temperature :
Tamb
[°C]
Assumptions (for the worst case) :
Eacc = 0.67 Wh
DOD = 30%
(see the SMAD)
Vav = 4.0 V
Calculation :
C = (Eacc/Vav) · (1/DOD) = (0.67/4.0) · (1/0.30) = 0.56 Ah
If a Li-Po technology is used it is important to consider the ambient temperature. For example, the
KOKAM Li-Po manufacturer declares that we can consider the capacity about half reduced if the
temperature decreases to -30 °C. Given the fact that the temperature can decrease until -23°C we
decide to double the total capacity.
Ctot = 2 · 0.56 = 1.12 Ah
Ref.: S3-A-EPS-1-0-EPS.doc
Issue : 1
Rev : 0
Date : 16/06/2006
Page : 40
of 43
4) Dimensions
The structure and configuration group give us the available battery volume : 45 x 15 x 90 mm. The
batteries have been chosen according to these dimensions and according to the last constraints.
The Li-Po battery technology made by VARTA Microbattery is an interesting solution. They are
specialized in Microbattery and their products dimensions and weight are really appropriated for the
SwissCube constraints. The PoLiFlex product range contains an integrated thermal and over current
protection.
Figure 31 : Typical VARTA Li-Po battery with thermal and over current protection
The most interesting PoLiFlex model for our application is PLF 443450 C :
Nominal Voltage :
3.7 V
Typical Capacity :
800 mAh
Minimum Capacity : 770 mAh
Length (l) :
49.2
mm
Width (w) :
34
mm
Height (h) :
4.4
mm
Pouch (a) :
44.2
mm
Weigth :
14
g
We have also considered some others battery manufacturers like KOKAM (Li-Po), Sanyo (Li-Ion),
Danionics (Li-Ion), etc. But the dimensions were not very appropriate.
Ref.: S3-A-EPS-1-0-EPS.doc
Issue : 1
Rev : 0
Date : 16/06/2006
Page : 41
of 43
5) Redundancy
In order to have a redundancy it is better to take two battery cells than one.
If we use two PLF 443450 C Batteries the total capacity is 1.6 Ah and the total mass is 28 g. This is
a good compromise.
6) Mass, mbattery :
The first EPS mass allocation was 130 g (all inclusive). But we rapidly realized that this allocation
was not enough because the batteries are relatively heavy.
Here is the actual EPS mass budget :
Mass
EPS board
Battery
Step up converter
Common mode filter
LDO
Controller
PCB
Latchup protection
Bus transciever
Beacon switch
Battery temperature sensor
Service connector
Battery current sensor
Battery voltage sensor
Battery smart monitor
Voltage sensors (ADCS, PL, COM, CDMS)
Current sensors (ADCS, PL, COM, CDMS)
S / A Power sensors
connector
14
10
5
2
10
30
1
2
1
1
5
1
1
4
1
1
1
4
Nbr
2
1
5
5
1
1
1
1
1
1
1
1
1
1
4
4
5
1
Total
146
28
10
25
10
10
30
1
2
1
1
5
1
1
4
4
4
5
4
The batteries mass represent about a fifth of the total EPS mass budget.
Ref.: S3-A-EPS-1-0-EPS.doc
Issue : 1
Rev : 0
Date : 16/06/2006
Page : 42
of 43
7) Charging Characteristics
To do a correct charge it is necessary to respect a few parameters :
-
Fast charging can be achieved in a temperature range of 0…+45 °C.
-
Current of charging needs to be limited to the 1C rate max (a 0.8 Ah battery can be charge
with 0.8 A max)
-
The charging voltage has to be limited strictly with 4.2 V per battery cell in a narrow
tolerance of 50 mV.
-
It recommended terminating the charging either after 3 hrs and/or after the charging
current falls below 0.02C.
The charging process is illustrated below showing current and voltage of a VARTA PoLiFlex cell
using the 1C I-V charging :
Figure 32 : Typical PoLiFlex Li-Po Battery Charging Characteristics
Due to their low impedance this batteries are also capable of providing very high levels of current.
Ref.: S3-A-EPS-1-0-EPS.doc
Issue : 1
Rev : 0
Date : 16/06/2006
Page : 43
of 43
7 CONCLUSIONS
A lot of work and not enough time…
But very very interesting !
Ref.: S3-A-EPS-1-0-EPS.doc