1
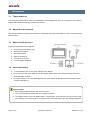
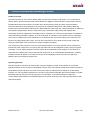
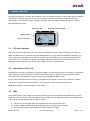
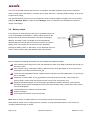
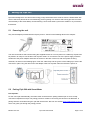
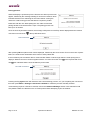
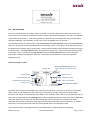
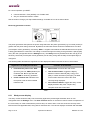
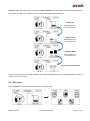
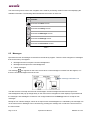
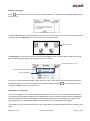
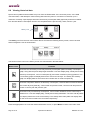
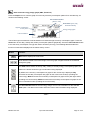
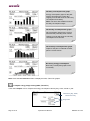
Pipit 500
In-Home-Display
User Manual
BGX501-811-R01
Copyright © 2012-2013, SIHPL. All rights reserved. E&OE.
Pipit 500 ® is a registered trade name of Secure Meters Ltd.
Other product names are trademarks or registered trade names of their respective owners.
As part of Secure Meter’s continuous endeavour to improve product design, specifications mentioned are liable to change.
Page 2 of 32
Pipit 500 User Manual
BGX501-811-R01
Table of Contents
1
Introduction ................................................................................................................................. 4
1.1
Target audience............................................................................................................................................. 4
1.2
About this user manual .................................................................................................................................. 4
1.3
What’s inside the box? .................................................................................................................................. 4
1.4
Care instructions............................................................................................................................................ 4
2
Product overview and operating principle ................................................................................ 5
3
About Pipit 500 ............................................................................................................................ 7
3.1
LCD user interface......................................................................................................................................... 7
3.2
Information on the LCD ................................................................................................................................. 7
3.3
LEDs .............................................................................................................................................................. 7
3.4
Battery switch ................................................................................................................................................ 8
4
Functional features of Pipit 500 ................................................................................................. 8
5
Setting up Pipit 500 ..................................................................................................................... 9
5.1
Powering the unit ........................................................................................................................................... 9
5.2
Pairing Pipit 500 with Smart Meter ................................................................................................................ 9
5.3
Wall mounting Pipit 500 ............................................................................................................................... 11
6
5.3.1
Releasing Pipit from the stand ...................................................................................................... 12
5.3.2
Replacing battery in Pipit .............................................................................................................. 13
Getting started........................................................................................................................... 14
6.1
Display screen ............................................................................................................................................. 14
6.2
Start up screen ............................................................................................................................................ 14
6.3
Home screen ............................................................................................................................................... 15
6.3.1
Sticky screen display .................................................................................................................... 16
6.4
Main menu ................................................................................................................................................... 17
6.5
Messages .................................................................................................................................................... 18
6.6
Viewing historical data ................................................................................................................................. 20
6.7
Changing default settings ............................................................................................................................ 24
6.8
6.7.1
Standard settings .......................................................................................................................... 24
6.7.2
Advanced settings ........................................................................................................................ 26
Supplier and IHD information screen .......................................................................................................... 30
7
Annexe-I: Pipit 500 technical specification ............................................................................. 31
8
Annexe-II: Compliance standards and certification................................................................ 31
BGX501-811-R01
Pipit 500 User Manual
Page 3 of 32
1 Introduction
1.1
Target audience
This document is intended for users of the Pipit 500 in-home display unit, which is a component of the Secure
Meters AMI (advanced metering infrastructure) system.
1.2
About this user manual
The manual describes functions and features of Pipit 500 and provides information on how to commission and
use the device.
1.3
What’s inside the box?
Inside your Pipit 500 pack you will find:
●
Pipit 500 (in-home display unit)
●
Mains power adaptor
●
Quick Start Guide
●
Wall-mount bracket
●
2 x wall mount screws
●
2 x AAA alkaline batteries
1.4
Care instructions
●
To avoid damage, do not use sharp objects on the display.
●
Do not immerse the unit in water or any other liquid. Keep it away from heat-generating sources or
areas with high moisture.
●
Excessive impact or shock may damage the unit. If the display is damaged avoid touching the liquid
crystals contained in it.
Important Note:
●
Before fitting batteries remove the unit from power.
●
Only use the adapter provided with your display to power it.
●
The display will only work with ZigBee SEP 1.x smart meter. If you remove it from your home it will
stop working. You should re-pair your Pipit 500 with new smart meter if you are changing address.
Page 4 of 32
Pipit 500 User Manual
BGX501-811-R01
2 Product overview and operating principle
Product overview:
Pipit 500 is an easy to use in-home display (IHD) unit with touch-sensitive LCD screen. It is a component of
®
Secure Meter’s smart metering solution and is fitted with a ZigBee module that aids communication with the
installed advanced electricity meter to provide near real-time energy usage and other useful information.
Communication takes place wirelessly over the home area network (HAN) via the AMI (Advance Metering
Infrastructure) communication module which is fitted inside the meter. Pipit 500 collects information on electricity
consumption and generation from the smart meter (e.g. i-Credit 500 or Sprint 200) and displays data
numerically as well as graphically on its display screen. Information on net electricity generation is available for
consumers having generation capacity, such as solar panel. The display is monochrome and has a backlight
which can be configured to remain switched on or to switch off after one minute without user interaction and
turned on by lightly tapping the screen. The unit aids consumers to set up alerts for their power usage and
electricity consumption level, as well as on receipt of supplier messages.
The unit has two LEDs at the top. The one on the left-hand side is a tri-colour LED that can be configured to
indicate the power usage level. The LED on the right-hand side can be configured to notify receipt of supplier
messages. The unit mainly operates on mains power via the supplied DC power adapter. In the absence of
mains power the display will work for short periods using a pair of non-rechargeable AAA batteries. A battery
strength indicator will appear in the status bar at the top of the display to alert consumers to replace the
batteries when the remaining charge is low.
Operating principle:
Pipit 500 should be connected to mains power, using the adapter provided, and must then be connected
(paired) wirelessly to the consumer’s Smart Meter using a home area network (HAN) which is built into both the
Smart Meter and the Pipit 500. The network connection status is indicated on the display by a HAN status
indicator icon. Once powered and paired, the unit will communicate periodically with the Smart Meter to update
its display with near real-time energy usage and cost information. The following diagram outlines the
communication paths between the installed HAN devices (smart electricity meter and Pipit 500) and the headend system (HES):
BGX501-811-R01
Pipit 500 User Manual
Page 5 of 32
The AMI communication module fitted inside the electricity meter channels the entire information flow between
HAN devices and the HES. The AMI communication module uses inbuilt ZigBee radio for communicating with
HAN devices and mesh radio / WiMAX for WAN communication through the HES. Information sent from HES is
communicated to the electricity meter and the IHD via the AMI communication module.
Page 6 of 32
Pipit 500 User Manual
BGX501-811-R01
3 About Pipit 500
Pipit 500 is intended for use inside the consumer’s home. It operates primarily on mains power via a DC adapter
and typically consumes less than 0.6 watt. The touch-screen display shows power usage and electricity
consumption in near real-time. When operating on battery power the display will automatically turn off after
approximately 90 seconds.
Electricity LED
Message notification LED
Battery switch
LCD user interface
3.1
LCD user interface
The touch-sensitive LCD screen is the user interface that displays energy usage information from the Smart
Meter and allows users to configure visual and audible alerts for energy usage and message notification. The
icons, buttons and information on the touch-screen will change depending on the operation being performed.
The screen is a 3.4” monochrome display with backlight that illuminates when the unit is powered up. The
backlight can be configured to turn off after one minute if there is no user interaction.
3.2
Information on the LCD
Pipit displays net energy consumption or generation (kWh), near real-time net power consumption or generation
(kW), energy cost per hour ($/hr) and carbon emissions (CO2 kg/hr). In addition, it indicates Pipit’s network
connection status and low-battery charge condition when operated on battery power.
Pipit can store historical data on net energy consumption and generation, cost and CO2 emissions, enabling
consumers to compare their consumption for current and previous day, week, month and year.
Note: Refer Section 6 ‘Getting started’ for more details.
3.3
LEDs
Pipit has two LEDs on its top edge. The tri-colour electricity LED on the left-hand side indicates the net power
being consumed; the colour of the LED changes to red, amber or green depending upon the consumption level.
The colour of the LED indicates power levels as follows:
●
Green for Economy (ECO) when the instantaneous power usage level is low
●
Amber for Medium (MED) when the instantaneous power usage level is moderate
●
Red for High (HI) when the instantaneous power usage level is high
BGX501-811-R01
Pipit 500 User Manual
Page 7 of 32
The colour of the LED changes with the rate of consumption that Pipit calculates using the user configured
values of ‘daily target’ and ‘tariff’ (i.e. electricity price). Refer Section 6.7 ‘Changing default settings’ to know how
to adjust these values.
The right-hand LED is green and can be configured to notify receipt of supplier messages; this can be done by
setting the Message Alarm to ‘Lights’ from the Settings menu. If configured, the LED flashes five times on
receipt of a message.
3.4
Battery switch
In the absence of mains power the IHD can be operated using a pair
of non-rechargeable AAA batteries. A battery switch located on the
left-hand side of the IHD unit activates the unit when operating on
batteries. On battery power, the display turns off automatically
approximately 90 seconds after the last user interaction to preserve
battery power. The display can be turned on when required by
pressing the battery switch. A ‘low battery’ icon is displayed at the top
of the screen to indicate when the batteries need to be replaced.
4 Functional features of Pipit 500
Pipit can display the following information from the installed Smart Electricity Meter:
near real-time power usage level in kW, with indicators for ECO (low), MED (moderate) and HI (high) on
the Home screen
near real-time energy consumption (kWh), predicted cost per hour ($/h) based on the current level of
consumption, and carbon emissions (CO2 kg)
current and next applicable tariff rate, together with the activation time (for flexible tariff), i.e. the cost per
unit in cents/kWh
comparison of values (kWh, $, CO2 kg) between current day and previous day; current week and
previous week; current month and previous month; current year and previous year
graphical and tabular display of net consumption (the difference between electricity consumed and
generated). Hourly values are displayed for the most recent 45 days. Daily, weekly and monthly values
can also be displayed
communication link or network connection status
supplier messages
current date and local time (in 24-hour format)
Note: Refer to Section 6 ‘Getting started’ for more details on features and functionality.
Some features of Pipit can be configured by the consumer, to meet individual preference. See Section 6.7
‘Changing default settings’ for details.
Page 8 of 32
Pipit 500 User Manual
BGX501-811-R01
5 Setting up Pipit 500
Pipit 500 is designed to view and monitor energy usage information that it receives from the Smart Meter with
which it has been paired via the commissioning process (pairing is a one-time self-running process to link the
unit wirelessly to the Smart Meter). Commissioning can be done either by the meter installer or by consumers
themselves.
5.1
Powering the unit
Only use the adapter provided with the Pipit to power it. Check for the following label on the adapter:
The unit can be either wall-mounted using the supplied bracket or it can be placed on a table-top. Pipit should
be placed in an easy-to-view location near a power outlet. To connect the unit to the power supply insert the
small end of the power adapter cable into the socket on the back of the unit, with the symbol ‘B’ facing
outwards, as shown in the following figure. Push the cable firmly into the groove of the cable grip to secure the
connector in place. Plug the other end of the adapter cable into a power outlet and switch the power on.
5.2
Pairing Pipit 500 with Smart Meter
Pre-requisite:
For the unit to pair automatically, the smart meter should have the pairing window open so as to accept
connection requests from Pipit. The pairing process is similar to connecting two devices over Bluetooth. A
pairing wizard is accessible using the ‘pair with smart meter’ tab from our website www.freedomtosave.com.au
which can guide you through the pairing process.
BGX501-811-R01
Pipit 500 User Manual
Page 9 of 32
Pairing process:
When the display is powered up for the first time the start-up screen will
appear, followed by the message ‘Waiting for home area network’ which
indicates that the unit is searching for the local network. Joining the
network is a self-running process that doesn’t require any further
interaction with the unit. While pairing the unit, make sure that the
pairing window of the smart meter is open. The pairing process can
take up to 10 minutes.
Once the unit has joined the network, the message ‘IHD paired successfully’ will be displayed and the network
connection icon will show
in the top left-hand corner.
HAN connected
After pressing OK the splash screen will be displayed, followed by the Home screen. Even in the event of power
failure, the smart meter remembers which units it is been paired with.
If the unit fails to join the network due to communication failure or takes longer than the usual joining time, it
displays ‘Network cannot be located’ together with the ‘no HAN’ connection icon
The
in the top left-hand corner.
icon indicates that the unit has failed to join the HAN.
No HAN connection
Pressing the Try again button will restart the auto-commissioning process, or if you are pairing the unit second
time then press Menu > Settings > Advanced > Network to restart the process manually. Manual
commissioning requires a PIN to be entered; refer to the Advanced Settings section in this manual for PIN
entry details. Make sure that the unit is on mains power before attempting to join the network.
Page 10 of 32
Pipit 500 User Manual
BGX501-811-R01
5.3
Wall mounting Pipit 500
Pipit 500 and wall mounting bracket dimensions:
Fixing Pipit 500 on the wall:
1. Select a suitable position for mounting Pipit.
2. Hold the wall mounting bracket upright against the wall, leaving at least 50 mm space above, 20 mm space
below, and 40 mm space on either side so that the unit can be fitted on to the bracket.
3. Mark the positions of the two key holes of the bracket on the wall, and then remove the bracket.
4. Drill a hole through each of the marks made on the wall.
5. Hold the bracket against the wall so that the two key holes align with the holes. Insert a suitable wall-fixing
in each of the holes and then fix the bracket in place using M3 screws.
6. Prepare the battery cover for fitting Pipit on to the bracket: remove the battery cover from the rear of
Pipit by sliding the cover downward and then break the section along the dotted line shown in the following
figure:
BGX501-811-R01
Pipit 500 User Manual
Page 11 of 32
7. Fit the battery cover back on to Pipit by sliding the grooves on to the two lugs of the bracket.
8. Align Pipit's top two grooves with the top two lugs of the wall bracket and then slide it gently with a downward
push until you hear a click sound.
5.3.1
Releasing Pipit from the stand
To release Pipit from the bracket, push the clip downwards from the front and at the same time hold and lift the
unit up and away from the bracket.
Page 12 of 32
Pipit 500 User Manual
BGX501-811-R01
5.3.2
Replacing battery in Pipit
Replacing the batteries is a three-step process. The battery compartment is located at the rear of the unit.
Step 1: Remove the battery cover.
Step 2: Insert a pair of non-rechargeable AAA batteries,
making sure the polarity is correct.
Step 3: Put the battery cover back on to the Pipit.
BGX501-811-R01
Pipit 500 User Manual
Page 13 of 32
6 Getting started
6.1
Display screen
The display screen is touch-sensitive and is activated by lightly tapping the screen. The screen has a status bar
at the top and a main display area, as shown in the figure below. The status bar shows Pipit’s network
connection status, current time and date, page title and the low battery charge indicator (when applicable). The
main display area shows information on energy consumed or generated along with icons and buttons to
navigate through the available displays. The buttons and functions on the screen will change depending on the
operation being carried out.
Battery charge indicator Display title
Current time
Status bar
Current date
Network icon
Main display area
Significance of the display identifiers shown above:
Status bar:
shows network connection status, current time, date and the page title at all times;
a battery charge indicator will appear when the unit is operating on battery power
and the battery charge is low.
Network icon:
symbol indicates the unit is connected to HAN; slow flashes
(once every
10 seconds) indicates that the unit is attempting to join the network.
symbol indicates no HAN connection; fast flashes
(once per second)
indicates that the unit is searching for a network to join.
Current time:
shows the current time in 24-hour format received from the smart meter.
Current date:
shows the current date received from the smart meter.
Display title:
title of the information being displayed.
Battery charge indicator:
Main display area:
6.2
appears when the Pipit’s batteries need to be replaced.
displays main information as well as navigation icons and buttons.
Start up screen
Once Pipit is commissioned (i.e. joined the network), on every power up the splash screen with the supplier
logo, MAC (Media Access Control) address, the installation code, the manufacturer’s name and the year of
product release is displayed. The splash screen is not displayed if the unit is decommissioned from the HAN.
Page 14 of 32
Pipit 500 User Manual
BGX501-811-R01
6.3
Home screen
The Home screen displays net energy usage information. The power indicator dial in left-hand section of the
Home screen shows either the instantaneous power usage or generation depending on the rate of consumption
or generation of electricity, i.e. if electricity generation is greater than consumption then the power generation
dial will be displayed. The information on the Home screen is updated every 30 seconds.
The right-hand section is a ‘sticky screen’ with Unit selection and View selection buttons. The Unit selection
button can be used to access the instantaneous demand (kW), $/hour or CO2 kg/hour in the left-hand section of
the display and cumulative energy usage (kWh), cost ($) and the resulting carbon dioxide emissions (CO2 kg) in
the sticky screen. The View selection button accesses the compare day, compare week and tariff information
in the sticky screen. The label on the Unit selection button and View selection button shows the type of
information currently being displayed. Electricity consumption and generation scenarios are explained
separately below:
Electricity usage scenario
Display title
Menu button
Unit selection button (press to
cycle between $, kWh and CO2)
Sticky screen
Power indicator dial
Target threshold
Daily consumption
Instantaneous power level
Cost per hour
View selection button
By default, the left-hand section displays the cost being incurred at the current rate of electricity consumption
and the sticky screen displays the cost of electricity consumed so far today, along with the preset target
threshold. The scaling on the dial shows ECO, MED or HI according to the $, kWh or CO2 kg target per day set
by the user (configurable from the Settings menu) and the readings received from the meter; the corresponding
numerical value is shown below the dial. When displaying cost per hour ($/hr) the scaling on the dial is
calibrated based on the configured cost ($) target per day and the tariff price read from the meter. In case the
tariff price is not received from the meter, the preconfigured value in the Pipit will be used.
The $ values shown are calculations based on the default factory-set tariff values in the Pipit 500.
BGX501-811-R01
Pipit 500 User Manual
Page 15 of 32
For correct operation you MUST:
●
Choose between a ‘Flat’ (default) or a ‘Flexible’ tariff
●
Set your actual tariff values in c/kWh
See the section ‘Change your Pipit’s default settings’ for details of how to set these values.
Electricity generation scenario
The power generation dial replaces the power usage dial when the power generated (e.g. from solar panels) is
greater than the power being consumed. By default, the left-hand section shows the instantaneous net value
(consumption minus generation), denoted by ‘GEN’. A negative value below the dial indicates that more power
is being generated than consumed. The scaling on the dial changes according to the generation capacity (kW)
set by the user (configurable from the Settings menu). The Sticky screen by default shows the cost ($) of net
electricity consumed (consumption minus generation) so far today, along with the daily consumption target, if
configured.
The following table describes the significance of the displayed indicators and the function of each button:
Significance of displayed indicators
●
●
Function of each button
Instantaneous power level: ‘ECO’
●
Menu button: accesses the main menu.
(Economy) for low, ‘MED’ (Medium) for
●
Unit selection button: toggles the display
moderate and ‘HI’ for high demand
between real-time demand (kW), energy cost
level; GEN for electricity generation.
($/hr) or carbon emissions (CO2 kg/hr); the label
Power indicator dial: indicative real-
on the button shows the units of the value
time power in kW is shown shaded
currently being displayed.
inside the dial.
●
View selection button: toggles the sticky screen
display between daily total, compare day,
compare week and current tariff.
Table 1
6.3.1
Sticky screen display
The sticky screen shows the daily cost of electricity against the preset target threshold, which is user
configurable from the Settings menu. The View selection button on the home screen accesses comparisons of
the current day’s or week’s data with the previous day’s or week’s data. It can also show the currently active
tariff and the next applicable tariff, along with its activation time. The various displays accessible with the View
Page 16 of 32
Pipit 500 User Manual
BGX501-811-R01
selection button are shown below. Pressing the Unit selection button will display the corresponding $, kWh or
CO2 values. The label on the button shows the type of information being displayed.
Daily Total
Press button to go
to the next view
Compare Day
Press button to go
to the next view
Compare Week
Press button to go
to the next view
Current and next Tariff rate
If there is no user interaction for approximately one minute the display will revert to the default home screen (i.e.
‘$ Daily Total’ sticky screen).
6.4
Main menu
Press the Menu button to access the main menu, as shown below:
BGX501-811-R01
Pipit 500 User Manual
Page 17 of 32
The main menu gives access to the navigation icons used for performing certain functions and displaying the
available information. The following table summarises the function of each icon:
Icon Function
Accesses the Home screen.
Accesses the History screen.
Accesses the Messages screen.
Accesses the Settings screen.
Accesses the Information screen.
Table 2
6.5
Messages
Pipit stores the last 20 messages received from the electricity supplier. There are three categories of messages
that can be sent by the supplier:
●
Messages that do not require user acknowledgement
●
Messages that require user acknowledgement
●
Critical messages
The message
icon appears on the home screen when a new message is received from the supplier, or if
there are unread messages stored in the unit:
Message notification icon
The date and time of receipt are stored for all messages. Critical messages and those that require user
acknowledgement will pop up straight away on the main screen. Navigation to other displays is prevented until
the message is acknowledged. Consumers can configure alerts from the Settings menu for receipt of new
messages.
Receipt of non-critical messages, which do not require user acknowledgement, is indicated by the message icon
on the home screen. Messages can be accessed by pressing the message icon on either the home screen or
the menu screen.
Page 18 of 32
Pipit 500 User Manual
BGX501-811-R01
Reading a message:
Press
icon from the home screen to access unread messages. An example of the message display screen
is shown here:
Pressing OK will close the message window and return to the current main screen. To view all read and unread
messages, press the Message icon from the main menu, as shown below:
Message icon
The Message icon from the main menu accesses the Messages screen, as shown below, which lists all read
and unread messages together with their date and time of receipt:
Unread message count
Unread/critical messages
Read messages
All unread or critical messages appear in bold with a dot in front. The number of unread messages appears in
the top right-hand corner of the main display area, together with the message
icon. Press View to read a
message, or Menu to return to the main menu.
Cancellation of a message:
The electricity supplier can cancel a message which has been sent to the IHD. A cancelled message that has
not yet been acknowledged is displayed with a diagonal line across it. Further messages will not be displayed
until the message has been acknowledged, or the message display times out. Messages not requiring user
acknowledgement are automatically deleted from the inbox if they are cancelled by the supplier.
The supplier can also send messages with an expiry that will be automatically deleted from Pipit’s memory upon
expiry.
BGX501-811-R01
Pipit 500 User Manual
Page 19 of 32
6.6
Viewing historical data
Pipit receives updated historical data every hour from the Smart Meter. If the unit loses power, or the HAN
connection fails, it will attempt to collect missing data when the power or connection is restored, up to a
maximum of 45 days. Pipit displays historical net electricity consumption data graphically as well as in tabular
form and also allows consumption values to be compared with the previous day, week, month or year.
History icon
The History icon from the main menu shown above accesses the following History screen, which has three
further navigation icons as shown below:
The function of the icons on the History screen are summarised in the table below:
Button / Icon
Function
Accesses the current day’s net hourly electricity consumption pattern and daily consumption
graph, along with the preset daily target threshold. It can also display daily, weekly and monthly
electricity consumption, cost of consumption ($) and carbon emissions (CO2 kg) patterns. The
hour and day graph can display data for the most recent 45 days. The weekly and monthly
graph can display data for the most recent 8 weeks and 13 months respectively.
Accesses comparison data for net electricity consumption, cost and carbon emissions between
the current day and yesterday, current week and previous week, current month and previous
month or current year and previous year.
Accesses hourly net electricity consumption, cost or carbon emissions for the current day in
tabular form. It can also display daily, weekly and monthly data tables. The hour and day tables
can display data for the most recent 45 days. The weekly and monthly table can display data
for the most recent 8 weeks and 13 months respectively.
Table 3
Press the appropriate icon to see the desired information screen, or press Menu to return to the main menu.
Page 20 of 32
Pipit 500 User Manual
BGX501-811-R01
- View historical energy usage graph (kWh, $ and CO2)
Press the Graphs icon to view the graph for net hourly electricity consumption pattern for a calendar day, as
shown in the following screen:
Unit selection button
[kWh, $, CO2]
View button [Hour, Day,
Week and Month]
Highest consumption
for the period
Energy usage graph
Left scroll button
The left and right scroll buttons scroll backwards or forwards through the hourly consumption graph. Press the
View button to see daily, weekly and monthly consumption patterns graphically. Press the Unit selection button
to see the hourly consumption cost ($) and carbon emissions (CO2 kg). The following table describes the
function of each button displayed in the above History screen:
Button
Function
Menu button displays the main menu.
Scroll buttons located to the left and right of the bar graph navigate forwards or backwards
through the graph.
The View buttons select net hourly, daily, weekly or monthly energy consumption graphs; the
label on the button shows the type of information being displayed.
By default, the net hourly consumption bar graph for the current day is displayed; Day
accesses the net daily consumption bar graph for the most recent 45 days (including the
current day); Week accesses the net weekly consumption bar graph for the past eight weeks
(including the current week); Month accesses the net monthly consumption bar graph for the
past 13 calendar months (including the current month).
The Unit selection buttons access energy usage, cost or CO2 information for the selected
View option. The label on the button shows the units of the information being displayed.
Table 4
BGX501-811-R01
Pipit 500 User Manual
Page 21 of 32
Net daily consumption bar graph
Energy consumption graph for the past
45 days (including the current day).
Tapping on a bar will show the net hourly
consumption for that day.
Note: The arrow with dotted line shows
the daily consumption target.
Net weekly consumption bar graph
Net consumption graph for the current
week and the preceding seven weeks.
Tapping on a bar will show the net daily
consumption for that week.
Net monthly consumption bar graph
Graph for the past 12 calendar months,
plus the current month.
Net hourly energy consumption
Net hourly consumption graph for the
current day.
Note: Press the Unit selection button to display the kWh, $ and CO2 graphs.
- Compare energy usage history (kWh, $ and CO2)
Touch the Compare icon to compare the energy consumption value by day, week, month or year.
View button [Day, Week,
Month and Year]
Usage data
Page 22 of 32
Pipit 500 User Manual
BGX501-811-R01
Pressing the View button in the above History screen accesses the kWh, $ and CO2 values for the current and
previous day/week/month/year.
- View historical energy usage table (kWh, $ and CO2)
Touch the Table icon to view hourly electricity consumption pattern in tabular form. Use the Unit selection
button to cycle through the units (kWh, $ and CO2). Use the View button to display daily, weekly and monthly
data, as shown below:
View button
Hourly consumption data
table
Hourly energy consumption
values in tabular form. Use
the arrows to scroll through
the day or between days.
Daily consumption data table
Daily energy consumption values for
the past 45 days (including the current
day). Use the up and down arrows to
scroll through the data, a week at a
time.
Weekly consumption data table
Weekly energy consumption values for
the current week and the past seven
weeks. The start date for each week is
displayed.
Monthly consumption data table
Monthly energy consumption values for
the current month and the preceding 12
months.
Note: In this section, the term ‘consumption’ also refers to ‘generation’.
BGX501-811-R01
Pipit 500 User Manual
Page 23 of 32
6.7
Changing default settings
Press the Menu button to access the main menu. Use the Settings icon (shown below) in the main menu to
change certain default settings.
Settings icon
6.7.1
Standard settings
The Settings icon accesses the Settings screen from which the following actions can be performed:
●
set the daily consumption target level
●
configure the target alarm to light, sound, backlight flash, or
off
●
configure message alarm to light, sound, backlight flash, or
off
●
turn the daylight saving one-hour offset on or off
●
set the display backlight to turn off after one minute or to
stay on constantly
●
adjust the touch-screen display contrast
●
turn the indicator lights on or off
The following table describes the function of the configurable items displayed in the Settings screen:
Button / Icon
Function
For configuring the daily electricity consumption target in kWh, $ or
Target:
CO2. The target value is displayed in the energy consumption Home
screen and also in the daily consumption graph.
For setting the consumption target alarm to one of the following four
options: Sound (a short series of beeps). Flash (backlight flashes on
Target Alarm:
and off five times rapidly. Light (left-hand LED flashes on and off five
times rapidly). Off (no alarm). The alarm is triggered if consumption
exceeds the configured target.
For setting the critical message alarm to one of the following four
options: Sound (a short series of beeps). Flash (backlight flashes on
Message Alarm:
and off five times rapidly. Light (left-hand LED flashes on and off five
times rapidly). Off (no alarm). The alarm is triggered when a critical
message is received.
Page 24 of 32
Pipit 500 User Manual
BGX501-811-R01
For turning the DST (daylight saving time) one-hour offset on or off.
When turned on, the DST one-hour offset will be applied to the local
time displayed in the status bar.
Daylight saving:
Note: Pipit will hide this option if it receives DST information from the
meter.
For setting the backlight to turn off after one minute or to remain on.
Backlight:
For setting the touch-screen display contrast to minimum, low,
medium or maximum brightness levels. It is set to ‘Min’ at
Contrast:
manufacture.
For setting the two indicator lights on or off. When set to ‘On’ the lefthand indicator light will illuminate green (for ECO), yellow (for MED)
or red (for HIGH) to indicate the current power usage level, whereas
Lights:
the right-hand indicator light will flash green to notify the receipt of a
message. If set to ‘Off’ both the indicator lights are disabled.
Table 5
Note: With the exception of the Target button, the above described are toggle buttons. Tapping a toggle button
will select the alternate option and the label on the button will show the selected option.
6.7.1.1
Setting consumption target
The Target button
from the standard Settings menu allows the daily consumption target to be set. The
threshold can be set from the following screen:
The Unit selection button is
used to select the unit.
Press this button to cycle
between kWh, $, CO2 units.
To change the target value tap the number button, labelled with the
current target value (99 in the example above) to access a keypad
on the screen:
Note that the current value is displayed on the right-hand side of
the keypad. Enter the new value and then press OK to set the new
target, or press Cancel to retain the old value and return to the
previous screen.
BGX501-811-R01
Pipit 500 User Manual
Page 25 of 32
6.7.2
Advanced settings
In addition to standard settings, several advanced settings can be configured from a screen accessed by
tapping the Advance button in the top right-hand corner of the Settings screen:
●
Electricity consumption (import) tariff
●
Electricity generation (export) tariff
●
Electricity generation capacity
●
CO2 factor
●
Erase data
●
Manual disconnection or reconnection of Pipit with Smart
Meter
The advanced settings configurations are protected with a PIN code. The existing configuration can be viewed
without using the PIN, but changing them requires the correct PIN code to be entered. This protection is
provided to prevent accidental changes to certain critical settings that can cause loss of data or
decommissioning of the unit from the network. The following table describes the advanced settings:
Button / Icon
Function
Toggles between two types of indicative tariff rate for electricity consumption: ‘Flat’
Tariff:
and ‘Flexible’. The flexible tariff supports up to four tiers.
Gen. Tariff:
Gen. Capacity:
CO2 Factor:
Erase Data:
For configuring the indicative tariff rate for electricity generation (export).
For setting the daily generation capacity. In the Home screen the instantaneous data
is calculated as per the defined capacity.
For setting the CO2 avoidance factor. The factory default setting is 1.36 kg for each
kWh produced from a carbon source.
Erases all the historical data stored in the Pipit. This should be used with caution as
it will not be possible to retrieve erased data.
For manually disconnecting or reconnecting the Pipit with the Smart Meter. If
Network:
disconnected manually, the Pipit will automatically attempt to reconnect to the Smart
Meter.
Table 6
6.7.2.1
Configuring tariff rates for consumption
Pipit supports indicative Flat and Flexible tariffs that compute cost based on consumption values collected from
the Smart Meter. The Flexible tariff can be set up with up to four time-of-use slabs, with weekdays and
weekends treated separately. If Flat tariff is configured, the consumption cost for any missing period is derived
by applying the flat rate to the interval data. If a Flexible tariff is configured, the consumption cost for any
missing period is derived from the current applicable price for that period.
Page 26 of 32
Pipit 500 User Manual
BGX501-811-R01
The Tariff button
from the advance Settings menu allows the indicative tariff rate for electricity
consumption to be configured. The following screen allows the tariff type to be selected (the currently selected
tariff mode is shown in reverse type, flat in this example):
Flat tariff configuration:
Press the flat button from the above tariff type selection screen and
then enter the rate in c/kWh via the keypad, as shown in the example.
Pressing OK causes a prompt for the PIN code to be displayed. The
new setting is saved only if the correct PIN is entered. Press Cancel to
return to the advance Settings menu without making any changes.
Flexible tariff configuration:
Weekdays can be treated separately from weekends in a Flexible
tariff.
To set up the tariff, press the flexible button from the tariff type
selection screen, which will give access to the weekday tariff setup
screen. An example screen is shown on the right.
Two time periods, peak and off-peak, with default values, are set at
the factory. Press the start time button to change the start time of the
peak rate and press the number button to change the rate. The start
time of the each rate is set automatically to follow on from the end
time of the preceding rate.
Once the weekday rates are configured, press OK to access the
weekend tariff set-up screen, as shown on the right, and configure
weekend rates in the same way as for weekdays. Pressing OK
causes a prompt for the PIN code to be displayed. The new setting is
saved only if the correct PIN is entered. Press Cancel to return to the
advance Settings menu without making any changes.
BGX501-811-R01
Pipit 500 User Manual
Page 27 of 32
6.7.2.2
Configuring tariff rate for electricity generation
The Gen Tariff button
from the advance Settings menu
allows the indicative tariff rate for electricity generation to be set.
Press the button and then enter the rate, in c/kWh, via the keypad,
as shown in the example. Pressing OK causes a prompt for the PIN
code to be displayed. The new setting is saved only if the correct
PIN is entered. Press Cancel to return to the advance Settings
menu without making any changes.
6.7.2.3
Configuring the generation capacity target
The Gen Capacity button
from the advance Settings
menu allows the daily generation capacity value to be set. Press
the button and then enter the required value, in kW, via the
keypad, as shown in the example. Pressing OK causes a prompt
for the PIN code to be displayed. The new setting is saved only if
the correct PIN is entered. Press Cancel to return to the advance
Settings menu without making any changes.
6.7.2.4
Configuring the CO2 factor
The CO2 Factor button
from the advance Settings menu
allows the CO2 avoidance factor to be set; the factory setting is
1.36 kg for each kWh produced from a carbon source.
Press the button and then enter the value, in kgCO2 per kWh, via
the keypad, as shown in the example; Pressing OK causes a
prompt for the PIN code to be displayed. The new setting is saved
only if the correct PIN is entered. Press Cancel to return to the
advance Settings menu without making any changes.
6.7.2.5
Erasing IHD data
The Erase data button
from the advance Settings menu
allows deleting all historical data from Pipit’s memory.
Pressing the button causes a prompt for the PIN code to be
displayed. If the correct PIN is entered the following warning
message will appear before deleting the data. Press Confirm to
delete all the data, or press Cancel to return to the advance
Settings menu without erasing the data.
Note: Pipit will not collect erased historical energy data.
Page 28 of 32
Pipit 500 User Manual
BGX501-811-R01
6.7.2.6
Manually joining/leaving the network
The Network button
from the advance Settings menu allows
Pipit to be manually joined to or removed from the HAN. The
automatic HAN joining process supersedes any manual HAN
connection and will start only after the unit is manually removed
from a HAN. Pressing the button causes a prompt for the PIN code
to be displayed. If the correct PIN is entered the following warning
message will appear before the manual process starts.
Press OK to join or leave the network, or press Cancel to return to the advance Settings menu without
affecting the network connection.
6.7.2.7
PIN code entry
Making any changes to advanced settings will require a PIN code to be entered, as shown here:
PIN code
The above PIN code entry screen appears whenever an attempt is made to change any of the advanced
settings. The PIN is a four-digit number, as shown in the above screen. Enter the PIN ‘1793’ using the keypad
on the screen and then press OK. Entering the correct PIN will enable the requested change to be made. An
incorrectly entered PIN will cause the following warning message to be displayed:
Wrong PIN warning:
Press OK to re-enter
the PIN code.
BGX501-811-R01
Pipit 500 User Manual
Page 29 of 32
Note: There is no limit to the number of PIN entry attempts.
6.8
Supplier and IHD information screen
The Info icon from the main menu displays the Info screen, which is similar to the splash screen. It shows the
supplier’s URL and an ‘i’ button. Pressing the ‘i’ button causes information on signal strength to be displayed,
together with the application version and radio firmware version as shown below:
Page 30 of 32
Pipit 500 User Manual
BGX501-811-R01
7 Annexe-I: Pipit 500 technical specification
Dimension:
115 x 80 x 40 mm
Weight:
0.2 kg
Power consumption:
< 0.6 W
Display area:
76 x 40 mm
Display resolution:
240 x 128 pixels
Touch screen:
Resistive type
Material:
ABS (Acrylonitrile Butadiene Styrene) / PC FR ( Polycarbonate Flame Retardant)
Colour:
White (with glossy finish)
Replaceable battery:
2 x AAA-size alkaline non-rechargeable batteries
Memory size:
2 MB
Operating temperature:
-10 C to +50 C
Storage temperature:
-20 C to +70 C
Relative humidity:
0 to 95%
Ingress protection:
IP40
Operating life:
5 years
°
°
°
°
8 Annexe-II: Compliance standards and certification
Specification
Applicable standard
Compliance mark to be applied for Labelling
C-tick
ZigBee® compliance
ZigBee Smart Energy In-Premise Display
Safety Standard
AS NZS 60950-1
Power supply compliance
AS NZS 4665
Conducted emission
CISPR 22
Radiated emission
CISPR 22
Compliance
Pipit 500 conforms to all the essential requirements of EU Directive 1999/5/EC, WEEE 2002/96/EC and complies
with RoHS.
Follow the local safety norms to dispose off the batteries and the product safely at the end of their life.
BGX501-811-R01
Pipit 500 User Manual
Page 31 of 32
Secure Australasia Pty Ltd
258 Darebin Rd, Fairfield, Victoria 3078
Australia
t: +61 3 9485 6000
f: +61 3 9485 6099
Website: www.freedomtosave.com.au