1
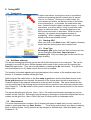
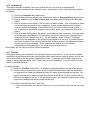
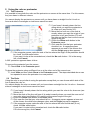
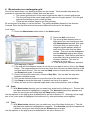
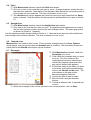
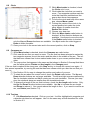
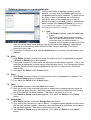
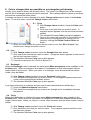
Version 5.2 October 2014 Dr Hazel Shute This software is provided on an as is basis. No liability for any problems encountered can be accepted. Table of Contents 1 Introduction to version 5..................................................................................................................5 1.1What is the Assisted dRawing toOl?..........................................................................................5 1.2Who can use ARO?...................................................................................................................5 1.3Further development..................................................................................................................5 1.4Installation and running..............................................................................................................6 2 Using ARO.......................................................................................................................................7 2.1Terminology................................................................................................................................7 2.2Starting ARO..............................................................................................................................7 2.3Chart Type..................................................................................................................................7 2.4Grid lines and snap....................................................................................................................7 2.5Chart element.............................................................................................................................7 2.6Action.........................................................................................................................................8 2.7Protractor and Ruler...................................................................................................................8 2.8Message boxes..........................................................................................................................8 2.9Element changes and Pop-up boxes.........................................................................................8 2.10File...........................................................................................................................................8 3 Chart types......................................................................................................................................9 3.1Rectangular grid.........................................................................................................................9 3.2Pie chart ....................................................................................................................................9 3.3Import picture.............................................................................................................................9 3.4Isometric grid..............................................................................................................................9 4 Drawing on a rectangular grid.......................................................................................................10 4.1Drawing shape.........................................................................................................................10 4.2Axis..........................................................................................................................................10 4.2.1What can go wrong?.........................................................................................................10 4.3Scale........................................................................................................................................10 4.4Title...........................................................................................................................................11 4.5Point.........................................................................................................................................11 4.6Straight line..............................................................................................................................11 4.7Smooth curve...........................................................................................................................12 4.7.1To alter your curve.............................................................................................................12 4.7.1.1If you need to draw more points.............................................................................................12 4.7.1.2Choosing a point on a curve...................................................................................................12 4.7.1.3Move a point........................................................................................................................... 12 4.7.1.4Remove a point...................................................................................................................... 12 4.7.1.5Add a point............................................................................................................................. 13 4.8Rectangle.................................................................................................................................13 4.9Circle........................................................................................................................................13 4.10Compass arc..........................................................................................................................14 4.11Text box..................................................................................................................................14 5 Using the ruler or protractor...........................................................................................................15 5.1The Protractor..........................................................................................................................15 5.2The Ruler.................................................................................................................................15 6 Move/resize on a rectangular grid ................................................................................................17 6.1Axis..........................................................................................................................................17 6.2Scale........................................................................................................................................17 6.3Titles.........................................................................................................................................17 6.4Point.........................................................................................................................................18 6.5Straight Line.............................................................................................................................18 6.6 Smooth curve..........................................................................................................................18 6.7Rectangle.................................................................................................................................18 6.8Circle........................................................................................................................................19 6.9Compass arc............................................................................................................................19 6.10Text box..................................................................................................................................19 7 Deleting elements on a rectangular grid........................................................................................20 7.1Axis..........................................................................................................................................20 7.2Scale........................................................................................................................................20 7.3Titles.........................................................................................................................................20 7.4Point.........................................................................................................................................20 7.5Straight line..............................................................................................................................20 7.6Smooth curve...........................................................................................................................21 7.7Rectangle.................................................................................................................................21 7.8Circle........................................................................................................................................21 7.9Compass arc............................................................................................................................21 7.10Text box..................................................................................................................................21 8 Colour changes that are possible on a rectangular grid drawing..................................................22 8.1Point.........................................................................................................................................22 8.2Line..........................................................................................................................................22 8.3Rectangle.................................................................................................................................22 8.4Circle........................................................................................................................................22 9 Editing titles, scales and text boxes..............................................................................................23 9.1Scales......................................................................................................................................23 9.2Titles.........................................................................................................................................23 9.3Text boxes................................................................................................................................23 10 Changing the style of a point.......................................................................................................23 11 Drawing a pie chart......................................................................................................................24 11.1Introduction.............................................................................................................................24 11.2Defining the sectors of a pie chart.........................................................................................24 11.3Labelling a pie chart...............................................................................................................25 11.4Title.........................................................................................................................................25 11.5Labels.....................................................................................................................................25 11.6 Change colour or Make transparent.....................................................................................25 11.7 Legend..................................................................................................................................26 11.8 Add a text box........................................................................................................................26 12 Importing a background picture...................................................................................................27 12.1Importing a drawing ..............................................................................................................27 12.2Using the ruler or protractor...................................................................................................27 12.3Adding to a pie chart..............................................................................................................27 13 Drawing on an isometric grid.......................................................................................................27 14 File operations.............................................................................................................................28 14.1Saving a drawing...................................................................................................................28 14.2Printing a drawing..................................................................................................................28 14.3Closing a drawing..................................................................................................................28 14.4Re-opening a drawing............................................................................................................29 14.5Starting a new drawing when another drawing has been completed....................................29 14.6Auto-saved drawings.............................................................................................................29 14.7File sizes................................................................................................................................29 Assisted dRawing toOl 1 Introduction to version 5. 1.1 What is the Assisted dRawing toOl? The Assisted dRawing toOl (ARO) is being developed to help students create mathematical drawings. It is intended for use up to Key Stage 4, particulary for those students who lack manual dexterity. The techniques needed to create drawings in ARO mimic those taught for manual drawings. No advantage is intended in using ARO. ARO has been designed for students who cannot hold mathematical drawing tools sufficiently well or keep a sheet of paper still while they are drawing. Other software is available for mathematical drawing but some students lack the manual dexterity to position a cursor accurately on a screen and click a mouse button without moving the mouse. FX Draw 41 has been developed mindful of disability but it still requires the user to be able to coordinate actions with both hands. This problem is addressed in ARO by providing assisted input onto either a course or a fine grid, whereby the position of the cursor that is recorded is that of the nearest intersection of the visible grid to its position when the left mouse button was clicked. Once a chart element has been drawn in a crude position, it can be moved to the correct position using buttons that appear on screen. If deemed necessary, the assisted input can be disabled. Currently, the user has control of this. A drawing can be printed, saved as a picture or as a text file so that it can be re-opened and edited. A drawing that is printed is scaled so that the drawing area is 14 cm x 14 cm, with the option to add a description, such as the question number, the student’s name and the date. A saved picture has no scaling as it can be stretched or squashed when it is imported into other software packages. If a drawing (created in ARO or not) is imported as a picture, it can be drawn upon but elements that existed when the picture was imported cannot be changed in any way. This option can be used to print a saved drawing to scale from ARO. An ARO drawing that has been saved can be edited by using the Open option in the usual Microsoft File drop-down menu. 1.2 Who can use ARO? In order to use ARO, you need to be able to move a mouse and press the left mouse button. The other mouse buttons are not used. As long as the user can activate the on-screen radio buttons, he or she will be able to create accurate mathematical drawings. The keyboard is only used to enter text such as titles and scale values. Exercises, with step by step instructions, are provided in the separate document, Introductory Exercises v4, to demonstrate how ARO can be used to draw some common mathematical charts. Anyone wishing to use ARO should follow the most similar example before attempting to draw his/her own chart. 1.3 Further development Suggestions from teachers, students and examination boards are welcome. These could be incorporated into a later version. Any suggestions should be directed to Dr Hazel Shute [email protected] 1 http://www.efofex.com/fxdraw4.php accessed December 2012 1.4 Installation and running The Assisted dRawing toOl is a Windows application. It cannot be installed on an Apple device. It is known to be suitable for Windows XP and 7 but the additional files Microsoft Report Viewer 2010 Redistributable www.microsoft.com(en-us)download/details.aspx?id=6442 and Microsoft Visual Basic Powerpacks http://go.microsoft.com/fwlink/?LinkID=145727&clcid0x804 are required if they are not already installed. If these or any other Microsoft programmes that are needed are absent from your computer, you will need to have internet access during the installation and they will be downloaded and installed automatically. Nothing but standard Microsoft redistributable materials from reputable Microsoft sites will be downloaded. To install ARO version 5, Some antivirus programmes may prevent installation. To overcome this problem, temporarily disable your antivirus. Click on setup. You may receive a Security Warning. This software is virus free. Installing it carries no risk. It has been independently tested for viruses and malware by Softpedia http://www.softpedia.com/progClean/Assisted-dRawing-toOl-Clean-234581.html and been awarded their 100% clean award. Click on Install. Follow any instructions that are given on screen. ARO opens when the installation is complete. Enable your antivirus. To restart ARO, ARO will automatically install a shortcut on the desktop. Click on the icon to start ARO. Should the shortcut have been removed, you can also access ARO if you click on the Windows Start button (at the bottom left hand corner of the screen). ARO should be listed there. If not, click on All Programs. ARO is listed inside the Plymouth University (H Shute) folder. Click on Assisted dRawing toOl. 2 Using ARO 2.1 Terminology In these instructions, moving the cursor to a particular position and pressing the left mouse button is termed ‘click on’ or ‘clicking’. Clicking on a radio button, the round ones such as this, causes the centre of the button to be coloured blue. In this state, the radio button has been ‘checked’ and this option has been chosen. In these instructions, you will be told to ‘check’ a particular radio button, to select its option. Words that appear on the ARO screen are shown in bold here. When an item is selected, it is marked using magenta squares or highlighting. While a shape is being drawn, the parts already entered are marked in blue. 2.2 Starting ARO When you click on the Start button, ARO opens a drawing screen with the options panel that is shown here. 2.3 Chart Type Rectangular grid is the chart type that is chosen but this can be changed to Pie chart, Import picture or Isometric grid. Only one chart type can be used for any single drawing. 2.4 Grid lines and snap The square rectangular drawing grid on the left of the initial screen is a course grid. This can be changed to one with 25 more, smaller squares within each of the course ones by checking the Fine (10) radio button. They can also be hidden by checking the No radio button. The grid lines can be switched on or off, made course, fine or finer as needed. The number in brackets against each grid description is the number of the smallest steps (see Section 6.1) between smallest visible grid lines. While both the Yes radio button in the Use snap to grid panel and the Yes Radio button in the Show grid lines panel are checked, the position of the mouse when the left mouse button is clicked is shifted to the nearest intersection of the grid that is visible. This option should aid the correct positioning of the drawing elements which can be moved to more accurate positions later (see Chapter 6). If the No radio in either panel is checked, the true mouse position on the screen will be used. The square drawing grid will print 14cm x 14cm. Pie charts and isometric drawings can only be created on this size grid. Rectangular grid drawings or drawings on imported backgrounds can be created on this grid or an 18cm x 28cm (A4) one in either portrait or landscape mode. 2.5 Chart element The chart elements panel contains a list of shapes and types of labels that you may need for a graph or rectangular chart eg. Axes, Scales, … . The x and y radio buttons only apply to drawing axes or adding scales. Every element can be changed or deleted after it has been drawn (see Chapters 6 - 9). 2.6 Action The Action panel contains a list of the things that you can do to a chart element. The item in the list that can be used varies with the chart element that you have selected. At the start, the Draw/type radio button is checked. To draw a particular element, check the radio button beside its name and follow the instructions in Chapter 5. 2.7 Protractor and Ruler Once you have drawn a straight line, you will be able to place a ruler and/or a protractor on it, by checking either/both of the Show radio buttons. The ruler has the extra option that you can place it on the other side of the line that it starts on by clicking the Swap side button (see Chapter 5). 2.8 Message boxes If you try to do something that is impossible at that time, a message may be displayed on screen to tell you why you cannot do it. Click on the OK button to close the box. 2.9 Element changes and Pop-up boxes Once a chart element has been added, it can be changed as required. The range of changes that are possible depends on the element selected. In most cases, a pop-up box showing the options that are available appears on screen. A pop-up box can be dragged to a convenient place by placing the cursor on it, depressing the left mouse button and dragging the mouse in the direction that you want the pop-up box to move. Once it is in a convenient position, release the mouse button. In most cases, it is not necessary to use the cross in the top right hand corner of a pop-up box to close it. If this method of closing the box is used, changes made until the box is closed will be kept. One definite exception to this this is pop-up box that allows you to choose which titles to add (see Section 4.3). 2.10 File The File drop-down menu at the top of the screen, near the middle, offers some of the usual Windows functions. New, Open, Save, Save As, Print and Exit are currently available. The Print option allows the user to add a suitable heading, say the homework name and question number, their name and the date. It scales the printed drawing so that it is 14cm x 14cm to correspond with the on-screen ruler. 3 Chart types Before you start drawing you must choose the type of chart that you want to draw. The most frequently used type is likely to be on a rectangular grid. Once you have chosen you chart type, you can start to draw your chart. 3.1 Rectangular grid This option is the default option set when ARO opens. It is suitable for drawing simple shapes scatter graphs line graphs curves bar charts histograms ruler and compass constructions. 3.2 Pie chart This option should only be chosen to draw a single pie chart. 3.3 Import picture This option allows the user to import a background picture onto which to draw. It also allows a saved drawing to be printed to scale. No grid will be shown when a background has been imported but if Yes in both the Show grid lines and the Snap to grid panels 3.4 Isometric grid This option is only for isometric grid drawings which can be used to draw 3D shapes. The snap to grid lengths are longer in the horizontal direction than vertically. 4 Drawing on a rectangular grid The Rectangular grid radio button must be checked. Check the Draw/type radio button if it is not already checked. 4.1 Drawing shape The default drawing grid is the 14x14 square one. Full size A4 graph paper drawings can be created by checking either the A4 portrait or the A4 landscape radio button. Once selected, the drawing shape cannot be changed. This It is recommended that you enable the Microsoft Magnifier when creating an A4 drawing. can be found in the Control Panel \ Ease of Use section of Windows. 4.2 Axis Check either the x (for a horizontal axis) or the y (for a vertical axis) radio button. Only one of each type can be drawn. Check the Axis radio button. Decide which grid size will be most helpful and check its Show grid lines radio button. Make sure that the Yes radio in the Use snap to grid panel is checked. Click on the drawing panel, at or close to one end of your axis. A blue square marks the recorded position of the cursor, at the nearest intersection of two grid lines. Click at or near to the position of the other end of the axis. You should see an arrow that is slightly longer than the distance between your mouse clicks. This is to allow for the arrowhead which is included to distinguish axes from other straight lines. 4.2.1 What can go wrong? If you have tried to draw an x axis when the y radio button is checked or vice versa, either you will obtain a line with an arrow head in the wrong position or you will receive a message that the axis has been deleted. A badly positioned axis can be moved to the correct position (see Section 6.1). An x axis cannot be converted into a y one or vice versa; the angles of their arrowheads are fixed. If you try to draw a second axis of the same sort you will receive a message to tell you that this axis has already been drawn. You can draw another if the first one has been deleted (see Section 7.1). 4.3 Scale A scale can only be added after the corresponding axis has been drawn. This allows the initial text boxes for the scale labels to be placed in roughly the right places with a sensible number of boxes for the y scale. Check either the x (for a horizontal axis scale) or the y (for a vertical axis scale) radio button. Only one of each type can be drawn. Do this before choosing Scale. You can delete a scale box that has been added in error (see Section 7.2). Check the Scale radio button. If the x scale has been added, a text box containing “Enter x axis scale or labels here” appears below the x axis. Use the BACKSPACE (sometimes marked ) key on your keyboard to delete this invitation and enter your scale or labels. Be careful to get their positions correct by means of spaces. If the y scale has been added, a series of text boxes will appear beside the y axis. There is one box centred on every course grid line along the length of the y axis. Type your scale values into these boxes. As soon as you enter a value into a box, its border disappears. Boxes that are not required can be deleted (see Section 7.2). 4.4 Title Only one of each type of title can be added to a drawing. Check the Title radio button. The Add titles pop-up options box appears offering main title, x axis title and y axis title. Check the box beside as many as you require. Any that have not been chosen already can be added at any time. The main title box appears at the top of the drawing panel. Use the BACKSPACE key to delete the invitation “Type main title here” and enter your own title. While you are typing it will be outlined in black to show its position. The x axis title box appears near the bottom of the screen. Use the BACKSPACE () key to delete the invitation “Type x axis title here” and enter your own title. It behaves in the same way as the main title box. The y axis title box appears below the main title one. While you type in this box, your drawing will not be visible. Don’t worry it will reappear when your title is complete. Use the BACKSPACE key to delete the invitation “Type y axis title here” and enter your own title. Click off this box and your y axis title will rotate and be placed close to the left-hand edge of the drawing panel. Each of the title boxes can be moved to their correct position (see Section 6.3) or deleted (see Section 7.3). The titles that you have entered can also be changed (see Section 9.2). 4.5 Point This option allows you to plot individual points as crosses. For a scatter graph, draw the axes and scales first. Points can be moved or deleted after they have been drawn (see Sections 6.4 or 7.4). Points are also used to define smooth curves (see Section 4.6). Check the Point radio button. Select the mark style (cross, circle or dot) that you want to use. Decide which grid size will be most helpful and check its Show grid lines radio button. Decide whether or not to Use snap to grid and check either the Yes or the No radio button. Click at or near to the point that you want to plot. A cross appears that is shifted onto the nearest intersection of the visible grid if you have chosen to snap to grid. If not, it appears at the position that the cursor was in when you clicked the left mouse button. 4.6 Straight line This option allows you to draw simple straight lines. They can be moved or deleted later. They can also have their colour changed if required (see Sections 6.5, 7.5 or 8.1). Check the Straight line radio button. Decide which grid size will be most helpful and check its Show grid lines radio button. Decide whether or not to Use snap to grid and check either the Yes or the No radio button. Click at or near to one end of the line that you want to draw. A blue square appears that is shifted onto the nearest intersection of the visible grid if you have chosen to snap to grid. If not, it appears at the position that the cursor was in when you clicked the left mouse button. Click at or near to the other end of the line that you want to draw. A black line appears. It is drawn between the cursor locations when you clicked the mouse button, shifted onto the nearest intersections of the visible grid if you have chosen to snap to grid. 4.7 Smooth curve This option allows you to draw a smooth curve that passes through a set of points that you have plotted. It is not available until at least two points have been marked with crosses (see Section 4.4). Points can be moved, removed or added to improve your curve. The curve updates as the set of points changes. A single point can be chosen for more than one curve. With you initial set of points drawn, check the Smooth radio button. The Curve Options pop-up box appears. Click the Start button. The points that your curve passes through must be chosen in the order that they will occur on the curve. The direction in which you travel along the curve does not matter, except if you want to add more, later. So it is a good idea to use a consistent approach. Click on the first point which will be marked with a blue square. Continue to choose points which will all be marked with blue squares until all of the points have been chosen. Click on the Stop button on the Curve Options pop-up box; the curve through your points appears and the Make changes options, shown here, appear in the pop-up box. 4.7.1 To alter your curve You need to tell ARO which point you want to move, or remove or choose the point that is closest to one that you want to add. Only points that have already been drawn can be added. 4.7.1.1 If you need to draw more points click on Draw a new point or Finish and draw the extra points as in Section 4.4. Then click the Smooth radio button so that the Curve Options pop-up box re-appears and follow the instructions below. With the Curve Options box visible 4.7.1.2 Choosing a point on a curve Click Choose a point. Click close to the point on the curve that you want to choose. If the chosen point is on more than one curve, the points on the chosen curve are marked with solid magenta squares and a decision box appears. Click Yes if the correct curve is marked or No to be offered another that also passes through the chosen point. If each point is on only one curve or once the correct one has been chosen, the chosen point is marked by a solid magenta square while all of the others on the same curve are marked by outlines of magenta squares. If the wrong point or curve has been chosen, repeat this process until the correct point on the correct curve is marked by squares. 4.7.1.3 Move a point Having chosen a point on the curve as above click Move. The direction pop-up box appears which allows the point to be moved as in Section 6.4. The curve will update as the point moves. 4.7.1.4 Remove a point Having chosen a point on the curve as above click Remove. The Cancel or Delete pop-up box appears. Click either the Delete or the Cancel button. The curve updates if the point is removed. 4.7.1.5 Add a point In order to add a point to the curve, ARO needs to know where to add it. So a point that is on the curve that will be next to the new one along the curve must be chosen. Having chosen the point on the curve as above and remembering the order in which you originally chose the points for your curve, click either the before or the after button. Click near the cross that marks the point tha you want to add. The curve updates. If you have made a mistake, remove the new point and try again. When you are satisfied with your curve click on Draw a new point or Finish. More smooth curves can be added in the same way. 4.8 Rectangle Rectangle should be used to draw rectangles or squares. Drawing a rectangle rather than using four straight lines ensures that the sides meet at each corner and rectangles can be coloured if required. Only two cursor positions are needed to draw a rectangle. They can be moved, resized or deleted later. Check the Rectangle radio button. Decide which grid size will be most helpful and check its Show grid lines radio button. Decide whether or not to Use snap to grid and check either the Yes or the No radio button. Click at or near to one corner of the rectangle that you want to draw. A blue square appears that is shifted onto the nearest intersection of the visible grid if you have chosen to snap to grid. If not, it appears at the position that the cursor was in when you clicked the left mouse button. Click at or near to the corner of the rectangle that is diagonally opposite to your first one (that is marked by a blue square). The black outline of the rectangle appears. It is drawn between the cursor locations when you clicked the mouse button, shifted onto the nearest intersections of the visible grid if you have chosen to snap to grid. If your second point is either on the same horizontal or the same verical line as the first, you will be warned that you have tried to draw a line not a rectangle and that it has been deleted. 4.9 Circle This option is provided for drawing a general circle. In general, it is easier to draw a pie chart using the Pie chart drawing option; the special commands offered there make drawing a pie chart easier and allow individual sectors to be coloured if required. Circles can be moved, resized, deleted or coloured later. Check the Circle radio button. Decide which grid size will be most helpful and check its Show grid lines radio button. Decide whether or not to Use snap to grid and check either the Yes or the No radio button. Click at or near to the centre of the circle that you want to draw. A blue square appears that is shifted onto the nearest intersection of the visible grid if you have chosen to snap to grid. If not, it appears at the position that the cursor was in when you clicked the left mouse button. Click at or near any point on the circle’s circumference. The black outline of the circle appears. It is drawn around the location of the cursor when you clicked the mouse button the first time, with a radius that is the difference between the two cursor locations. Each location is shifted onto the nearest intersections of the visible grid if you have chosen to snap to grid. 4.10 Compass arc This option should be chosen if you want to draw an arc of a circle in a mathematical construction where compasses are normally used. Once drawn, an arc can be moved, resized or deleted. Check the Compass arc radio button. Decide which grid size will be most helpful and check its Show grid lines radio button. Decide whether or not to Use snap to grid and check either the Yes or the No radio button. Click at or near to the centre of the arc that you want to draw. This is the point at which you would place the point of the compasses. A blue square appears that is shifted onto the nearest intersection of the visible grid if you have chosen to snap to grid. If not, it appears at the position that the cursor was in when you clicked the left mouse button. Click at or near to the part of the circle’s circumference that is required. You may need to use the ruler (see Section 5.2) to measure the correct radius if so, a straight line is needed to sit it on (see Section 4.5). The arc appears, drawn in black. The initial length of the arc depends on the radius and the position of the arc. It is drawn around the cursor location of the first mouse click with a radius equal to the difference between the two mouse click locations. These locations are shifted onto the nearest intersections of the visible grid if you have chosen to snap to grid. Once drawn, the arc can be moved, resized or deleted. 4.11 Text box This option allows you to add extra text (writing) wherever you need to. It can be used to add a description or perhaps draw a stem and leaf plot which would require two text boxes, one for the stems and the other for the leaves, separated by a line. It could be used to add a legend to a graph or add a particular scale value. These are just a few examples. You can add up to 6 text boxes to a single drawing. To add a text box, check the Text Box radio button. A square box appears near the top left of the screen. Use the mouse to place the cursor in the text box which will resize with the words that you type and the border will disappear when you have typed anything into the box. Be careful not to type just spaces or new lines by hitting the Enter ( ) key; the box will be difficult to find again if you do. It will be easier to see if you show fine grid lines as it has a solid white background which covers up the grid. If you cannot see the first line of your text, click on the text box and use the up-arrow () key to move the cursor to the top of the box. 5 Using the ruler or protractor 5.1 The Protractor It is possible to have both the ruler and the protractor on screen at the same time. For this reason, they are drawn in different colours. You cannot display the protractor on screen until you have drawn a straight line for it to sit on. Axes and sides of rectangles or text boxes cannot be used. If you haven’t already drawn the line along which you want the protractor to lie, draw one (see Section 4.5). Move the line until one of its ends is exactly where you want the origin of your protractor to be (see Section 6.5) and the other so that the line is at the correct angle to the grid. Check the Show radio button in the Protractor panel. Click near the line that your protractor should sit on. A magenta square appears at one end of the chosen line and the Origin pop-up box appears. If the magenta square marks the end of the line where the origin of the protractor should be, check the Yes radio button. If you want it to be at the unmarked end, check the No radio button. If it is the wrong line, click Cancel. A 360 protractor appears drawn in blue. To remove the protractor from the screen, Check Hide in the Protractor panel. To place the protractor along a different line or at the other end of the current one, check Hide and then check Show in the Protractor panel. The steps described above can be repeated to move the protractor to a new position. 5.2 The Ruler Using the ruler is very similar to using the protractor except that you can choose which side of the line to place the ruler on. You cannot display the ruler on screen until you have drawn a straight line for it to sit on. Axes and sides of rectangles or text boxes cannot be used. If you haven’t already drawn the line along which you want the ruler to lie, draw one (see Section 4.5). Move the ends of the line until one of its ends is exactly where you want the zero end of your ruler to be (see Section 6.5) and it is at the correct angle to the grid. Check the Show radio button in the Ruler panel. Click near the line that your ruler should sit on. A magenta square appears at one end of the chosen line which also changes colour and the Origin pop-up box appears. If the magenta square marks the end of the line where the ruler should start (0 cm), check the Yes radio button. If you want it to start at the unmarked end, check the No radio button. If it is the wrong line, click Cancel. The ruler appears drawn in brown. The marked scale is in centimetres and relates to the size of the drawing when it is printed. The drawing on the screen is bigger than that which will be printed. If the ruler would be better placed on the other side of the line, click the Swap side button. Remove the ruler by checking the Hide radio button in the Ruler panel. To place the ruler along a different line or at the other end of the current one, check Hide and then check Show. The steps described above can be repeated to move the ruler to a new position. 6 Move/resize on a rectangular grid Once it has been drawn, any drawing element can be moved. Three possible step sizes are provided to minimise the number of steps that must be used. The course grid step size is the same length as the side of a course grid square. The fine grid step is the same length as the side of a fine grid square. Five fine grid steps are equivalent to one course grid step. There are ten smallest steps to one fine grid step. By moving part of a shape, it can be resized. The options available depend on the element involved; those for the titles and text boxes are different from those for the shapes. In all cases, Check the Move/resize radio button in the Action panel. 6.1 Axis Check the Axis radio button. The x and y radio buttons have no effect when you are choosing an axis. With Move/resize checked, click near to the axis that you want to alter. A magenta square appears briefly at each end of the axis that has been chosen. Then one square disappears and the direction pop-up box shown here appears. Note that an axis that is surrounded by a blue dotted box has not been selected. This form of selection is not in use. If the wrong axis has been selected, click Stop and try again. If the end with the magenta square is not the one you want to move, click on the Swap button. The magenta square moves to the other end of the axis to show that this is the end that will be moved. You can use the Swap button to check which axis is selected and Swap back again, if necessary. Once you have the correct axis, choose a Step Size. You can alter the step size between individual moves. Click on the direction buttons to move the end of the axis to the desired position. Use Swap to move the other end, if needed, and move it as above. When the axis is of the required length and in the correct position, click on Stop. 6.2 Scale With Move/resize checked, you can select any scale box by clicking on it. The box that has been selected is highlighted in magenta. The direction pop-up box appears as it does for moving an axis except that the Swap button is absent. Use the options on the pop-up box as described for an axis in Section 6.1. Although only a single box of the y axis scale is highlighted, the entire set of y axis scale boxes move together. 6.3 Titles With Move/resize checked, you can select any one of the titles clicking on it. The title that has been selected is highlighted in magenta. The direction pop-up box appears as it does for moving an axis except that the Swap button is absent. Use the options on the pop-up box as described for an axis in Section 6.1. 6.4 Point With Move/resize checked, check the Point radio button. Click on or near to the cross that you want to move. A magenta square marks the point that has been selected. Note that a cross that has a blue dotted box surrounding one of its lines has not been selected. This form of selection is not in use. The direction pop-up box appears as it does for moving an axis except that the Swap button is absent. Use the options on the pop-up box as described for an axis in Section 6.1. 6.5 Straight Line With Move/resize checked, check the Straight line radio button. Click near to the line that you want to move. A magenta square appears at one end of the line that has been chosen and the line itself changes colour. The same pop-up box as shown in Section 6.1 appears. Use the options provided as described in Section 6.1. Note that a line that has a blue dotted box surrounding it has not been selected. This form of selection is not in use. 6.6 Smooth curve Move/resize is not used to alter curves. These must be changed using the Curve Options which appear as a pop-up box when the Smooth radio is checked. You must draw at least two points before the Smooth radio button can be checked. 6.7 Rectangle With Move/resize checked, check the Rectangle radio button. Click inside the rectangle that you want to move. The four corners of the rectangle that has been selected are marked by magenta squares and the pop-up box shown here appears. First select which of the sides you want to move by clicking the corresponding side on the Choose a side panel. The side chosen on the pop-up box becomes magenta coloured. Choose the size of step to make. Move the side using the direction buttons. Choose a different side, if required and move it. When the rectangle is the correct size and in the correct position, click on Stop. 6.8 Circle While Move/resize is checked, check the Circle radio button. Click inside the circle that you want to move. Four magenta squares mark the circle that has been selected and the pop-up box shown here appears. To move the circle and keep it the same size, choose Move centre. To keep the centre of the circle in its current position but make the circle either bigger of smaller check the Radius radio button. Choose your step size. While the Move centre radio button is checked, all four direction buttons are available. Use these to move the circle. If the Radius radio button is checked, only the Up and Down directions are available. Use Up to make the circle bigger or Down to make it smaller. Once your circle is the correct size and in the correct position, click on Stop. 6.9 Compass arc While Move/resize is checked, check the Compass arc radio button. Click near the arc that you want to move. The arc that has been selected is marked by two magenta squares, one at the centre and the other in the middle of the arc. The arc that has been chosen has its two marked ends closer to your mouse position than any other. The pop-up box that appears is the same as that shown in Section 6.8 except that there are two extra options, Rotate and Arc length in the Changes panel. If the arc that is marked is the wrong one, click Stop and try to choose the correct one again. If this seems impossible, try moving the one that has been chosen while you alter the one that you want to. See Section 6.8 for ways to change the position and radius of your arc. To rotate the arc about its current centre, check the Rotate radio button. The Up and Down direction buttons are no longer available. The left and right ones are replaced by Yes for clockwise rotation and No to rotate your arc anti-clockwise. Choose your step size; the rotational steps are smaller than the translational ones. To change the length of the arc that is shown, check the Arc length radio button. Only the Up and Down direction buttons are available. Use Up to increase the arc length and Down to reduce it. You cannot reduce the length to zero. If you want to remove an arc, use Delete (see Section 7.9). 6.10 Text box With Move/resize checked. Click on your text. It will be highlighted in magenta and a direction decision box will appear. Use it in the same way as that described for a title in Section 6.3. 7 Deleting elements on a rectangular grid Once a chart element has been drawn it can be deleted. In every case, the Delete radio button in the Action panel must be checked. To delete all but the titles, scales or text boxes, the radio button beside the name of the shape that you want to delete must also be checked. Once an element has been selected, this Cancel or Delete pop-up box (or a very similar one) appears. So you can change your decision before the item is deleted. 7.1 Axis With Delete checked, check the Axis radio button. The x and y radio buttons have no effect when you are choosing an axis. Click near to the axis that you want to delete. A magenta square appears at each end of the axis, once it has been found, and the pop-up box shown here appears. Note that an axis that is surrounded by a blue dotted box has not been selected. This form of selection is not in use. To continue to delete the axis, click the Delete button or to leave it on the drawing, click Cancel. 7.2 Scale With Delete checked, clicking on a scale box selects it and it is highlighted in magenta. A Cancel or Delete pop-up box appears. If you have chosen the x axis scale, the pop-up box shown above appears. If the y axis scale box is highlighted, the pop-up box offers another choice. You can choose whether to delete just the one box that is highlighted or all of the y scales boxes. Check the correct one. Click either the Delete or the Cancel button. 7.3 Titles With Delete checked, clicking on a title selects it and it is highlighted in magenta. The Cancel or Delete pop-up box appears. Click either the Delete or the Cancel button. 7.4 Point With Delete checked, check the Point radio button. Click on or near to the cross that you want to delete until a magenta square marks the point that has been selected. Note that a cross that has a blue dotted box surrounding one of its lines has not been selected. This form of selection is not in use. The Cancel or Delete pop-up box appears. Click either the Delete or the Cancel button. 7.5 Straight line With Delete checked, check the Straight line radio button. Click near to the line that you want to delete. A magenta square appears at each end of the line that has been chosen. Note that a line that has a blue dotted box surrounding it has not been selected. This form of selection is not in use. The Cancel or Delete pop-up box appears. Click either the Delete or the Cancel button. 7.6 Smooth curve The Delete radio button cannot be used to delete curves. Check the Smooth curve radio button and the Curve Options pop-up box appears. Click Choose a point. Click near to a point on the curve that you want to delete. A magenta square appears at the point that has been chosen. Click on Remove. Click on Delete on the Cancel or Delete pop-up box that appears. Continue to delete individual points on the curve. When only one point remains, the curve has been deleted. Note that the crosses themselves remain. These must be deleted as detailed in Section 7.4. 7.7 Rectangle With Delete checked, check the Rectangle radio button. Click inside the rectangle that you want to delete. Four magenta squares mark each corner of the rectangle that has been chosen. The Cancel or Delete pop-up box appears. Click either the Delete or the Cancel button. 7.8 Circle With Delete checked, check the Circle radio button. Click inside the circle that you want to delete. Four magenta squares mark the circle that has been chosen. The Cancel or Delete pop-up box appears. Click either the Delete or the Cancel button 7.9 Compass arc With Delete checked, check the Compass arc radio button. Click near the arc that you want to delete. Two magenta squares, one at the centre and one in the middle of the arc, mark the arc that has been chosen. As suggested in Section 6.9, moving another arc while you select the one you want to delete may be necessary. The Cancel or Delete pop-up box appears. Click either the Delete or the Cancel button 7.10 Text box With Delete checked, clicking on a text box selects it so that it is highlighted in magenta. The Cancel or Delete pop-up box appears. Click either the Delete or the Cancel button. 8 Colour changes that are possible on a rectangular grid drawing Initially, every shape is drawn with a black outline. The colour of a straight line can be changed and the fills of rectangles and circles can be coloured. Text is always shown in black as are axes, arcs and the crosses that mark points. If a shape can have its colour changed, the option Change colour can be seen in the Actions panel. To use this option, check the Change colour radio button. 8.1 Point With Change colour checked, check the Point radio button. Click near to the point that you want to colour. A magenta square appears over the point that has been chosen. The standard Windows Color pop-up box appears. Click on the colour that you want to use either from the ones show on this pop-up box or create your our colour by clicking the Define Custom Colors >> button. When you have chosen the colour that you want to use, click OK or Cancel if you decide not to change this point’s colour. 8.2 Line With Change colour checked, check the Straight Line radio button. Click near to the line that you want to colour. A magenta square appears at each end of the line that has been chosen. The standard Windows Color pop-up box appears. Follow the instructions for a Point in Section 8.1. 8.3 Rectangle When the Rectangle radio is checked, the extra option Make transparent is also available in the Actions panel. When a rectangle is first drawn it is transparent so that other shapes that are drawn inside it can be seen. When you colour in a rectangle, some elements that are drawn inside it may be hidden. With Change colour checked, check the Rectangle radio button. Click inside the rectangle that you want to colour. Four magenta squares mark each corner of the rectangle that has been chosen. The standard Windows Color pop-up box appears. If you have coloured in a rectangle and you need to see elements that are hidden by it, Check the Make transparent radio button. Click inside the rectangle that you want to see through and it immediately becomes transparent. 8.4 Circle When the Circle radio is checked, the extra option Make transparent is also available in the Actions panel. When a circle is first drawn it is transparent so that other shapes that are drawn inside it can be seen. When you colour in a circle, some elements that are drawn inside it may be hidden. With Change colour checked, check the Circle radio button. Click inside the circle that you want to colour. Four magenta squares mark the circle that has been chosen. The standard Windows Color pop-up box appears. Follow the instructions for a Point in Section 8.1. If you have coloured in a circle and you need to see elements that are hidden by it, Check the Make transparent radio button. Click inside the circle that you want to see through and it immediately becomes transparent. 9 Editing titles, scales and text boxes The shapes of the letters cannot be changed but you can change the words that you have used. Use the DEL or BACKSPACE () keys on your keyboard to remove unwanted letters. Click on the title, scale or text that you want to alter. The arrow keys on the keyboard can be used to move the cursor to the exact position where you want to make a change. 9.1 Scales The value or label in any scale box can be changed at any time by checking the Draw/type action and clicking close to the scale value that you want to change. If you remove all of the numbers or letters in a scale box, its black outline appears so that you know where it is. If you do not want a scale value in this position, delete this scale box (see Section 7.2). 9.2 Titles The main title and the x axis title that you have entered can be changed at any time by checking the Draw/type action and clicking on the title that you want to change. To change your y axis title The extra option, Edit y title in the Actions panel becomes selectable as soon as a y axis title is added. Check the Edit y title radio button. A horizontal copy of the existing title appears close to the position that it was originally created in. Change the title to the one you want. When you have finished, click off this horizontal box. The rotated, new y axis title will be displayed in the place of the previous one. If you have deleted all of a title, its title box can still be seen as a white rectangle if grid lines are visible (the Yes radio button in the Show grid lines panel is checked). 9.3 Text boxes The text box entries can be changed at any time by checking the Draw/type radio button, then clicking on the box that contains the text that you want to change. The text box will change size to fit what you have typed. If you delete all of the text in one box, it may be difficult to see but it is still there. Show fine grid lines to help locate it. If you want to delete a text box use Delete (see Section 7.10). 10 Changing the style of a point The style of an individual symbol marking a point can be changed. The Change point style option becomes available once at least one point has been plotted. Check the Change point style radio button. This also selects the Point one and clears all of the point style options. Click close to the point that you want to alter. The selected point is marked by a magenta square. You are prompted to choose the new style. Click OK to remove the message. Check the radio button beside the point style that you want ie. cross, circle or large dot. The replacement symbol will be black. 11 Drawing a pie chart 11.1 Introduction A pie chart can be constructed by defining the centre and radius of a circle. The individual radii that mark the boundaries between the consecutive sectors are drawn as straight lines from the centre of the circle to points near the circle boundary. When all of the angles between the sector boundaries have been defined by radial lines and are in the correct positions, they are used to create a neat pie chart which can be annotated and coloured if required. The sectors of the neat pie cannot be altered. Pie charts can only be drawn on the 14x14 square grid. 11.2 Defining the sectors of a pie chart When ARO starts, or you start a new one, Check the Pie chart option. The list of elements that can be drawn changes from that shown when Rectangular grid is checked. The Rectangular grid and Import picture options are no longer available. If you have made the wrong choice, choose New from the File menu and Discard the current drawing. Check the Circle radio button and follow the instruction in Section 4.8 to draw the outer boundary of the pie chart. Your initial circle can be moved or resized using Move/resize as described in Section 6.8. This can be done at any time, even after the pie structure has been completed but then Select pie/Sector must be checked as Circle cannot be checked at this stage. Check one of the two radio buttons in the Clockwise direction? panel. Each radius that forms the boundary of a sector must be added in succession in the clockwise direction from the last if you choose the left-hand one (Yes) or in the anti-clockwise direction if you choose the right-hand one (No). An instruction box appears to remind you of the direction that you have chosen. Warning If you make a mistake and add a radius in the wrong order or direction so that the total of the angles between the radii add up to more than 360 , it will not be detected until you finalise the pie by checking the Create pie radio button. Then it will be deleted and you will have to start again. Check the Radius radio button. * A long radial line is easier to see when the protractor is on screen so click well outside the edge of the circle where the starting line should be drawn. A black line appears. Note that the centre of the circle is automatically chosen as the other end of the radial line. It can be moved using the Move/resize option or deleted as for a straight line (see Section 6.5). Click close to the radial line from which you want to draw the sector. Its ends will be marked by magenta squares and a decision box appears to check that you have chosen the correct line. Don’t worry about its length, this line is only used to define the angle between the last sector boundary and the current one. Once the correct line is marked, Show the Protractor (see Section 5.1). Click close to the mark on the protractor for the angle that you require. A black radial line is drawn which can be moved to the position of the sector boundary at the exact angle required by clicking on Move/Resize and clicking near to the radial line that you want to move. Move it in the same way as you would a straight line (see Section 6.2) until it is aligned with the required angle on the protractor. Hide the protractor. Repeat from * until all of the sector boundaries have been defined. The final sector will end at the start line automatically. Do not repeat the startline. A sector line that has been drawn but is not required can be deleted using Delete as for a straight line (see Section 7.5). When all of the sector boundaries have been drawn and positioned correctly, click on Create pie, which is only available when two or more radial lines have been drawn. A popup box appears to check that you have defined all of the sectors. If you have, click Yes and you will not be able to change or add to the sectors of your pie. If you have not defined all of the sectors, click No and return to * (above) or use Move/resize to change a sector that you have already defined. If your radial lines have been drawn so that the total of the angles between them exceeds 360, you will receive a message that your pie is wrong and that it will be deleted. You must start again. Once, Create pie has been activated, the circle and the radial lines used to draw the crude pie chart disappear and the Label, Legend, Change colour and Make transparent options become available. Move/resize with Select pie/sector checked can be used to move, expand or shrink your pie (see Section 6.8). 11.3 Labelling a pie chart You can add a title, labels, a legend or text boxes to describe the data that you have plotted on your pie chart. You can also colour the sectors if required. 11.4 Title Click on Title to add a title as for a rectangular grid drawing. A text box appears at the top of the screen with the instruction “Add main title here”. Use the BACKSPACE () key to delete this message and type in your title. The title box can be moved or deleted (see Sections 6.3 and 7.3) 11.5 Labels You may want to label each sector. The Labels option allows you to do this. The labels will always appear as black text on a white background. Click on Labels and a text box for each sector appears. These are only roughly placed and must be moved to better positions. See below. Click on one of the label boxes and type the label that you want to appear. This may be the name of the item represented by the sector or the number or percentage. You can have one or two (created using the ENTER ( ) key) lines of text. The outer border of the box will disappear when you have typed into the box and it resizes automatically. Remember that if you want two lines of text, you must use the ENTER ( )key to tell ARO where to start the new line. Use the directions on the decision box that appears when you choose Move/resize to move your labels into their correct positions. Labels can be deleted, one by one, if required, by checking the Label and Delete radio buttons and clicking on the label that you want to delete. The one that has been chosen is highlighted in magenta and a decision box appears for you to confirm that it is the one you want to delete. The deleted labels can be only be recreated if they have all been removed. If Label is already checked, you will need to check Line (which will have no effect) and then re-check Label. 11.6 Change colour or Make transparent If you want coloured sectors, check Select pie/sector then the Change colour radio button, click inside the sector that you want to colour. The chosen sector is outlined in magenta and the Color pop-up box appears, click on the colour that you want and OK. The sector changes colour. You can make a sector transparent again, by checking Select pie/sector and then the Make transparent radio button and clicking inside the coloured sector that needs to be clear. 11.7 Legend You may want a legend (or key) either instead of or as well as you labels. This option will only be of use if you have coloured your sectors (see the previous section) as pattern fills are not currently available and the sectors must have different fills for a legend to have any meaning. Check the Legend radio button. A template to create your legend appears. It has a small box on the left and a text box on the right for every sector in your pie. You must match the colours of your sectors to those of the small boxes in your legend. With the Legend radio button checked, Check the Change Colour radio button. Click on the small legend box that you want to colour in. The chosen one will have a magenta square at each corner and the Color pop-up box appears. Select the correct colour and click OK. Repeat for each small legend box. The Make transparent radio button can be used to erase the colour of a legend. Now add the description of each sector in the right-hand text boxes. Currently, these have a fixed length so you are limited to about 22 characters. The legend is probably not where you would like it. The pie chart may overlap the legend, in which case, check Select pie/sector and use Move/resize to change the pie to improve the appearance. You can also move the whole legend by checking Move/resize. Check Legend or if it is already selected check Line and then Legend. When it can be moved, a red border will appear around the entire legend and the direction pop-up box appears. Follow the instructions for moving a point (Section 6.4) to move the legend to the correct position 11.8 Add a text box You can add up to six extra text boxes as you can on a rectangular grid (see Section 6.10). 12 Importing a background picture This option is provided so that saved drawings can be printed to scale and so that drawings can be created on backgrounds provided as bitmaps or jpeg files. No part of the imported picture can be changed but it is possible to draw onto the imported picture. There is no way to overlay a grid onto an imported picture although all of the grid settings are available. If the grid is included in a picture created in ARO, that grid will be accurate for drawing onto the imported picture but it will no be possible to remove it. Only bitmaps (.bmp) and jpeg files (.jpg) can be imported. Any picture that is imported is scaled to fit the drawing panel and will be scaled again for printing. So the original size is not maintained. This is a feature of bitmaps. Initially the drawing will be imported into a 14x14 square which will print that size in cm. You can choose to use an A4 size either in portrait or in landscape mode. If a y axis scale is required on an imported background, one or more text boxes must be used as the grid drawing set of boxes aligns with that grid only. 12.1 Importing a drawing When ARO opens or when you start a New drawing. check the Import Picture radio button. The standard Windows Open pop-up box appears. Use this dialogue box to find the file that you have saved. Only .bmp or .jpg files are shown. Click either OK when you have found your file or Cancel. You will be prompted to choose a grid shape before continuing. To change to either A4 portrait or A4 landscape, check the corresponding radial button of the Grid shape options. If you regret your choice, you will have to restart your drawing by clicking on File and then on New. In the Save this file? Options box click on Discard. Reimport the background. Continue to draw on this picture (see Chapter 4) or print it in the usual Windows way (see 2.10). 12.2 Using the ruler or protractor If you need to use a ruler or protractor to measure items on the imported picture, you will have to draw lines over those on the picture for either the ruler or the protractor to be placed on. 12.3 Adding to a pie chart Pie charts are created using the information about the whole chart. So if a pie chart must be completed, you will have to draw another exactly over the parts of the one that is already there. 13 Drawing on an isometric grid This works in exactly the same way as drawing on a rectangular grid (see Chapter 4) except that the snap to grid step sizes in the horizontal direction are longer than the vertical ones. The options available are more limited too. There is only one grid size available; scales, smooth curves, circles and compass arcs cannot be drawn. The drawing elements on an isometric grid drawing can be moved, resized or deleted in the same way as those on a rectangular grid (see Chapters 6 and 7). 14 File operations ARO drawings can be discarded, saved, re-opened or printed from the standard Windows File menu. Whenever a drawing is saved, two files are stored. One is the picture that has been drawn which is saved as a bitmap (.bmp file). The other is the information that ARO needs to recreate the drawing so that it can be changed by opening it in ARO; this is a text file (.txt). The first part of the name of both is the same and must be supplied by the user. The ‘.bmp’ and the ‘.txt’ are added by ARO. 14.1 Saving a drawing You should save your drawings regularly. Click on File and the drop down menu appear. If this is the first time that you have saved this drawing, click on Save As. You may be prompted to wait (and all other functions in ARO are unavailable) while your computer’s file system is accessed. Choose a suitable place to store your drawings as you would for any other file that you create and give your drawing a memorable name. Click the Save button. Although it only appears that you have saved a bitmap, the text file has been stored for you. Once a drawing has been saved for the first time, to save updates click on Save in the File menu. Save As can also be used to save a new copy of your drawing. Any Save from then onwards will save your changes to the new file. 14.2 Printing a drawing With a printer connected to the computer either physically or via a network, click on File and the drop down menu appears. Click on Print and the Names pop-up box appears which has two boxes that you can type into. Click on the top box and type your name. Click on the lower box and add the name of the question paper or homework and the question number. The date is added automatically in a third box (not accessible by the user). Click OK and the Window’s Print options appear and the drawing appears behind it, smaller than during drawing. Choose the correct printer and Print. 14.3 Closing a drawing When you have finished your drawing or need to stop working on it, you must use Exit on the File menu. If you have not saved your drawing recently or since you made a change to it, you will be prompted to do so. Usually, you will want to click on the Save button but if you have made a mistake since you last saved it or simply don’t want to keep it click on the Discard button. 14.4 Re-opening a drawing If you have previously saved a drawing you can open it and make changes to it. Either when ARO starts or when you have finished a different drawing click on Open in the File menu. Again you may be asked to wait. If you have a drawing already on screen, even if it appears to be a blank screen, you will be prompted to either Save or Discard it if you have not saved it recently. This should only happen if you waited at least five minutes before attempting open the other drawing. When the current drawing has closed, you will be prompted to choose the drawing that you want to open. Choose the correct one as you would for any other file that you have created on your computer and click on Open. Provided that the text file associated with the bitmap map has not been moved or deleted, your drawing will appear and you will be able to make changes to it. Note that if you Cancel instead of Open the file, the previous drawing has already closed. ARO automatically looks for .bmp files but should the one that you want have been deleted, you can open the associated .txt file. In the Open pop-up box, click on the down arrow at the right hand end of the box containing the label Bitmap (*.bmp). The other option is Text (*.txt). Click on this option and any text files will be offered. Note that ARO cannot open text files produced with any other software. 14.5 Starting a new drawing when another drawing has been completed You can start a new drawing when you have completed your current one without closing ARO. Click on New on the File menu. As with opening a drawing, you will be prompted to Save or Discard the current one if you have not saved it recently or not since making a change to it. When you have made your decision, the drawing screen will clear ready for a new drawing which does not have to be of the same type as the previous one. 14.6 Auto-saved drawings ARO automatically saves your drawing approximately every five minutes. If you save your drawing before closing ARO, only the file that you have saved is stored. But if your computer or ARO shuts down unexpectedly, the file that has been saved automatically will remain on your computer until you next start ARO. Immediately, you will be prompted to either Open the drawing that was saved automatically or to Discard it. If you discard it, it will be lost for ever. Remember that you can Open and Save it, before continuing to start a new one or open a different one. If the automatically saved file is an updated version of one that you had saved, you can save this newer drawing to the file that contains the earlier one, so overwriting it, if you want to. 14.7 File sizes The bitmaps saved by ARO are quite large files. If you need to save space on your computer, you can delete the .bmp files as long as you keep the .txt ones as the drawing can be recreated by ARO (see Section 12.3). Only ARO can do this.