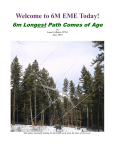
1
USER MANUAL
Analog Stimulus and Measurement Module
TS-PSAM
User Manual
for ROHDE & SCHWARZ Analog Stimulus and Measurement Module
TS-PSAM
6th Issue / 11.05 / GB 1142.9878.12
All rights, also translation into foreign languages, are reserved. No part of this manual is permitted
to be reproduced in any form (print, photocopy or any other method), also not for the preparation
of lectures, or processed, reproduced or made available using electronic systems without written
permission from ROHDE & SCHWARZ.
© The passing on to third parties and the reproduction of this documentation, utilisation and communication of its contents is not permitted unless specifically approved. Infringements will incur
claims for damages. All rights reserved in the case of the award of a patent or registration of a
design.
We draw to your attention that the names of software and hardware used in the Service Manual,
and the brand names of the respective companies are, in general, the subject of protection as
trademarks, or under proprietary rights, or patent law.
ROHDE & SCHWARZ GmbH & Co. KG
Corporate Headquarters
Mühldorfstr. 15
D-81671 München
Telephone:
Fax:
...49 (0)89/4129-13774
...49 (0)89/4129-13777
Printed in the Federal Republic of Germany. Errors excepted, subject to technical change without notice.
Safety Instructions
Attention!
Electrostatic
sensitive devices require
special care
Support Center
Telephone Europe:
+49 180 512 42 42
Telephone worldwide: +49 89 4129 13774
Fax:
+49 89 4129 13777
e-mail: [email protected]
If you have any technical queries about this Rohde &
Schwarz equipment, our Hotline at the Support Center of
Rohde & Schwarz Sales-GmbH will be glad to help.
Our team will discuss your queries and look for solutions to
your problems.
The Hotline is open Mondays to Fridays from 08.00 to 17.00
hrs.
For queries outside office hours, you can leave a message
or send a note via fax or email. We will then get back to you
as soon as possible.
Analog Stimulus and Measurement Module TS-PSAM
Content
Content
1
Usage
1-1
1.1
General
1-1
1.2
Features of the TS-PSAM
1-2
1.2.1
Hardware Components
1-2
1.2.2
1.2.2.1
1.2.2.2
Applications
Examples of use
Expanded applications
1-3
1-4
1-6
1.2.3
Features of the TS-PDC module
1-8
2
View
2-1
3
Block diagrams
3-1
4
Layout
4-1
4.1
Mechanical construction of the TS-PSAM
4-1
4.2
Display elements on the TS-PSAM module
4-3
4.3
Mechanical construction of the TS-PDC
4-4
4.4
Display elements of the TS-PDC module
4-5
5
Function Description
5-1
5.1
Function description of the TS-PSAM module
5-1
5.1.1
Primary matrix and analog measuring bus
5-1
5.1.2
Discharge unit DCH
5-3
5.1.3
Trigger logic
5-4
5.2
6
6th Issue 11.05
7
8
Function Description of the TS-PDC Module
5-7
Commissioning
6-1
6.1
Installing the TS-PSAM Module
6-1
6.2
Installing the TS-PDC Module
6-2
Software
7-1
7.1
Driver Software
7-1
7.2
Soft Panel
7-2
7.3
TS-PSAM Programming Example
7-3
Self-Test
8-1
8.1
8-1
LED Test:
3
Content
9
Analog Stimulus and Measurement Module TS-PSAM
8.2
Power-on test
8-2
8.3
TSVP Self-Test
8-2
Interface description
9-1
9.1
Interface description for TS-PSAM
9-1
9.1.1
Connector X10 (Front Connector)
9-1
9.1.2
Connector X20 (Extension Connector)
9-3
9.1.3
Connector X30 (Analog Bus Connector)
9-4
9.1.4
Connector X1 (cPCI Bus Connector)
9-5
9.2
Interface description for TS-PDC
9-6
9.2.1
9-6
Connector X20 (Extension Connector)
10 Specifications
10.1
Technical Specifications for the TS-PSAM Module
10-1
10.1.1
10.1.1.1
10.1.1.2
DC voltage source
Voltage adjustment
Current limiting
10-1
10-1
10-1
10.1.2
10.1.2.1
10.1.2.2
10.1.2.3
10.1.2.4
Measurement unit
Voltage
Current
RMS value measurement
Resistance measurement
10-2
10-2
10-3
10-4
10-8
10.1.3
Discharge circuit
10-9
10.1.4
Analog bus and relay multiplexer
10-9
10.1.5
General Data
10-9
Technical Specifications for the TS-PDC Module
10-10
10.2.1
Electrical Specifications
10-10
10.2.2
General Data
10-10
6th Issue 11.05
10.2
10-1
4
Analog Stimulus and Measurement Module TS-PSAM
Figures
6th Issue 11.05
Figures
Figure 1-1
Cross-connection for 2-wire resistance measuring
in Mode C............................................................................................1-4
Figure 1-2
Cross-connection for 4-wire resistance measuring
in Mode C............................................................................................1-4
Figure 1-3
Cross-connection for 2-wire resistance measuring
in Mode V............................................................................................1-5
Figure 1-4
Cross-connection for 4-wire resistance measuring
in Mode V............................................................................................1-5
Figure 1-5
Cross-connection in a guarded resistance measurement
(6-wire) ................................................................................................1-6
Figure 1-6
Cross-connection in a guarded impedance measurement
(6-wire) ................................................................................................1-7
Figure 2-1
View of the TS-PSAM module...........................................................2-1
Figure 2-2
View of the TS-PDC rear I/O module. ...............................................2-2
Figure 3-1
Block Diagram of TS-PSAM ..............................................................3-1
Figure 3-2
Block Diagram of TS-PDC.................................................................3-2
Figure 3-3
Functional block diagram of TS-PSAM with TS-PDC in the
CompactTSVP ....................................................................................3-2
Figure 4-1
Arrangement of connectors and LEDs on the TS-PSAM module .4-1
Figure 4-2
Arrangement of LEDs on the TS-PSAM module .............................4-3
Figure 4-3
Arrangement of the connector and LEDs on the TS-PDC module 4-4
Figure 4-4
Arrangement of LEDs on the TS-PDC module................................4-5
Figure 5-1
Block Diagram of TS-PSAM ..............................................................5-5
Figure 5-2
Block Diagram of the Trigger Hardware ..........................................5-6
Figure 5-3
Block Diagram of TS-PDC.................................................................5-7
Figure 7-1
Soft PanelTS-PSAM ...........................................................................7-2
Figure 9-1
Connector X10 (mating side) ............................................................9-1
Figure 9-2
Connector X20 (mating side) ............................................................9-3
Figure 9-3
Connector X30 (mating side) ............................................................9-4
Figure 9-4
Connector X1 (mating side) ..............................................................9-5
Figure 9-5
Connector X20 (TS-PDC mating side)..............................................9-6
5
Analog Stimulus and Measurement Module TS-PSAM
6th Issue 11.05
Figures
6
Analog Stimulus and Measurement Module TS-PSAM
Tables
Tables
Connectors on the TS-PSAM module ..............................................4-2
Table 4-2
LEDs on the TS-PSAM module.........................................................4-3
Table 4-3
Connector for the TS-PDC module ..................................................4-4
Table 4-4
Display elements on the TS-PDC module .......................................4-5
Table 7-1
Driver InstallationTS-PSAM ..............................................................7-1
Table 8-1
Statements about the LED Test........................................................8-1
Table 8-2
Statements about the power-on test................................................8-2
Table 9-1
Pin assignment for connector X10...................................................9-1
Table 9-2
Pin assignment for connector X20...................................................9-3
Table 9-3
Pin assignment for connector X30...................................................9-4
Table 9-4
Pin assignment for connector X1.....................................................9-5
Table 9-5
Pin assignment for connector X20 (TS-PDC)..................................9-7
6th Issue 11.05
Table 4-1
7
Analog Stimulus and Measurement Module TS-PSAM
6th Issue 11.05
Tables
8
Analog Stimulus and Measurement Module TS-PSAM
Usage
1 Usage
1.1 General
The TS-PSAM Analog Stimulus and Measurement Module is a measurement module for the CompactTSVP (Test System Versatile Platform) universal test platform. The module is used to perform analog
measuring tasks, in-circuit measurements, and the CompactTSVP selftest. The module's floating DC supply voltage is provided via the associated TS-PDC rear I/O module. This is inserted in the appropriate rear
I/O slot in the back of the device (same slot number as TS-PSAM).
The TS-PSAM module is inserted in the front of the CompactTSVP
chassis. It is based on the cPCI/PXI standard.
The front connector ends flush with the front panel of the CompactTSVP chassis and is used for contacting the test products or measurement sensors. At the back, the TS-PSAM module is connected to
the cPCI control bus and the PXI trigger bus. Instead of using the front
connector, analog measurement signals can be captured via the CompactTSVP's analog measuring bus.
6th Issue 11.05
A LabWindows IVI DMM driver is provided for the DMM functions on
the card. All other hardware functions are controlled using specific extensions of the driver. As is typical for a LabWindows CVI driver, Function Panels and Online Help are available.
1-1
Usage
Analog Stimulus and Measurement Module TS-PSAM
1.2 Features of the TS-PSAM
1.2.1 Hardware Components
The TS-PSAM modules includes a ground-connected discharge circuit,
an floating programmable voltage source, and an floating measurement unit. These components can be switched into the CompactTSVP's analog bus via a relay matrix. Measuring tasks can be synchronized using triggered measurements across the PXI bus and the
trigger inputs on the front connector. Two relay multiplexers with four
channels each are also provided. The major features of these three
function blocks will be explained in detail in the following section:
–
floating DC voltage source (DCS)
•
adjustable voltage and current limiting
•
•
•
• ±5 V, 100 mA max.
fast settling time
four-quadrant operation
sense wires
floating measurement unit (MU)
•
•
•
•
•
•
–
• 10 mV - 125 V
• 1 µA - 1 A
Measurement range AC rms
• 20 mV - 125 V
• 100 µA - 1 A
triggered measurements across the PXI Triggerbus
2 triggers derived from the measurement signal with programmable threshold
4 filters
16-bit converter
• Sampling rate 200 kHz (max. )
• Single or „multipoint“ measurement with storage depth up
to 8 k samples
Discharge circuit (DCH)
•
•
1-2
Measurement range DC
Discharge current 400 mA (max. )
Discharge voltage 125V (max. )
6th Issue 11.05
–
Analog Stimulus and Measurement Module TS-PSAM
Usage
1.2.2 Applications
On this topic see also Figure 1-1to Figure 1-6
The module is used to perform analog measuring tasks, in-circuit
measurements, and the CompactTSVP self-test. In these tests, the
module functions as a measuring device with adjustable sampling rate
for voltage, current and resistance measurements. The measurement
unit and the adjustable DC voltage source are cross-connected with
each other in a suitable manner for measuring resistance. If necessary,
the source can also be connected with GND. The measurement unit
and the DC voltage source can also be operated independently of one
another. In the in-circuit test (ICT), the TS-PSAM module performs the
following measuring tasks:
Discharging capacitors
–
2- and 4-wire resistance measurements
( Figure 1-1 to Figure 1-4 )
–
Contact test
–
Short circuit test
–
Connection test
6th Issue 11.05
–
1-3
Usage
Analog Stimulus and Measurement Module TS-PSAM
1.2.2.1 Examples of use
On this topic see also Figure 1-1 to Figure 1-4
Resistance measurements are taken with the aid of the DC voltage
source and the measurement unit. 2- and 4-wire measurements are
possible. Two different procedures may be followed depending on the
resistance value to be measured. If necessary, the source can be connected to GND.
•
Mode C for small resistances
In this method, a constant current is applied and the voltage is
measured. (see Figure 1-1 and Figure 1-2)
HI
DCS =
Rx
V MU
LO
Figure 1-1 Cross-connection for 2-wire resistance measuring
in Mode C
HI
RS
SHI
=
Rx
V MU
SLO
LO
RM
Figure 1-2 Cross-connection for 4-wire resistance measuring
in Mode C
1-4
6th Issue 11.05
DCS
Analog Stimulus and Measurement Module TS-PSAM
•
Usage
Mode V for large resistances
In this method, the voltage is applied and the current is measured.
(see Figure 1-3 and Figure 1-4 )
HI
DCS =
Rx
MU
A
LO
Figure 1-3 Cross-connection for 2-wire resistance measuring
in Mode V
RS
HI
SHI
DCS =
Rx
MU
A
SLO
6th Issue 11.05
LO
RM
Figure 1-4 Cross-connection for 4-wire resistance measuring
in Mode V
1-5
Usage
Analog Stimulus and Measurement Module TS-PSAM
1.2.2.2 Expanded applications
On this topic, see also Figure 1-5 and Figure 1-6
Further in-circuit measurements can be made in conjunction with the
TS-PICT module (ICT expansion module). These are:
–
Diode and transistor test
–
Guarded resistance measurements (3, 4 and 6 wires)
–
Impedance measurements (3, 4 and 6 wires)
For this purpose, the TS-PICT module provides a special AC voltage
source (AOS) and current measurement unit (CMU).
The UUT is connected for the in-circuit test (ICT) via the TS-PMB module (matrix module B).
1.2.2.2.1 Examples of use
On this topic, see also Figure 1-5 and Figure 1-6
The following section presents some examples of cross-connection for
guarded measurements.
A1
A2
DCS =
R1
C
Rx
D
B2
R2
B1
Figure 1-5 Cross-connection in a guarded resistance measurement
(6-wire)
1-6
6th Issue 11.05
CMU A
Analog Stimulus and Measurement Module TS-PSAM
Usage
6th Issue 11.05
Figure 1-6 Cross-connection in a guarded impedance measurement
(6-wire)
1-7
Usage
Analog Stimulus and Measurement Module TS-PSAM
1.2.3 Features of the TS-PDC module
The TS-PDC module is used as an floating DC voltage source for the
TS-PSAM module. It is configured with two identical DC/DC converters.
The following floating direct voltages are obtained from an input voltage
of 5 VDC:
+15 VDC ±5%, 0.5A (2x)
–
-15 VDC ±5%, 0.5A (2x)
–
+5 VDC ±5%, 0.5A (2x)
–
+3.3 VDC ±5%, 0.25A (2x)
6th Issue 11.05
–
1-8
Analog Stimulus and Measurement Module TS-PSAM
View
2 View
Figure 2-2 shows the TS-PSAM module without the associated
TS-PDC rear I/O module. The TS-PDC rear I/O module is shown in
Figure 2-2.
6th Issue 11.05
Figure 2-1 View of the TS-PSAM module
2-1
View
Analog Stimulus and Measurement Module TS-PSAM
6th Issue 11.05
Figure 2-2 View of the TS-PDC rear I/O module.
2-2
Analog Stimulus and Measurement Module TS-PSAM
Block diagram
3 Block diagrams
Analog Bus Connector X30
Figure 3-1 shows the block diagram of the TS-PSAM module and Figure 3-2 shows the block diagram of the TS-PDC module. Figure 3-3 is
a simplified functional block diagram of both modules in the CompactTSVP.
a1
Analog Bus (AB)
DCH
a2
b1
b2
c1
c2
d1
d2
DCH_HI
DCS_HI
DCS
DCS_SHI
DCS_SLO
SENSE
DCS_LO
MU_SHI
MU_SLO
MU_LO
Local
Analog Bus
(LAB)
Isolation
PXI_TRIG0..
PXI_TRIG7
XTA1, XTA2
a1
a2
b1
b2
c1
c2
d1
Front Connector X10
MU_HI
MU
MU
d2
XTO1, XTO2
Trigger
XTI1, XTI2
Extension Connector X20
AUX1, AUX2
RACH1
RACH2
RACH3
GA0..GA4
G e og ra p h ic
A d dre s sin g
RACH4
S P I In te rfa c e
RBCH1
RACOM
CPCI Bus Connector X1
6th Issue 11.05
RBCH2
C PCI
Inte rf ac e
RBCH3
RBCH4
RBCOM
GND
GND
CHA-GND
~
=
~
=
Figure 3-1 Block Diagram of TS-PSAM
3-1
Analog Stimulus and Measurement Module TS-PSAM
+5 V
GND
Regulator
1
+15 V
+5 V
+3.3 V
COM
-15 V
Regulator
2
+15 V
+5 V
+3.3 V
COM
-15 V
primary
DC-Transducer
ON/OFF
X 20
Block diagram
INHIBIT
Figure 3-3 Functional block diagram of TS-PSAM with TS-PDC in the CompactTSVP
3-2
6th Issue 11.05
Figure 3-2 Block Diagram of TS-PDC
Analog Stimulus and Measurement Module TS-PSAM
Layout
4 Layout
4.1 Mechanical construction of the TS-PSAM
On this topic, see also Figure 4-1
The TS-PSAM module is designed as a long cPCI plug-in module for
mounting in the front of the CompactTSVP. The board height of the
module is 3 HU (134 mm). In order to ensure that it is inserted correctly
into the Compact TSVP, the front panel is furnished with a locating pin.
The module is secured in place with the two retaining screws on the
front panel. Front connector X10 is used for connecting the UUTs. Connector X30 connects the TS-PSAM module to the analog bus backplane in the CompactTSVP. Connectors X20/X1 connect the TS-PSAM
module to the cPCI backplane/PXI control backplane.
6th Issue 11.05
Figure 4-1 Arrangement of connectors and LEDs on the TS-PSAM module
4-1
Layout
Analog Stimulus and Measurement Module TS-PSAM
Symbol
Use
X1
cPCI Bus
X10
UUT
X20
Extension (PXI), Rear I/O
X30
Analog Bus
6th Issue 11.05
Table 4-1 Connectors on the TS-PSAM module
4-2
Analog Stimulus and Measurement Module TS-PSAM
Layout
4.2 Display elements on the TS-PSAM module
On this topic, see also Figure 4-2
Three light-emitting diodes (LEDs) are located on the front of the TSPSAM module to show the current status of the module. These LEDs
have the following meanings:
Figure 4-2 Arrangement of LEDs on the TS-PSAM module
LED
Description
red
Fault condition (ERR):
Lights up when a fault is detected on the TS-PSAM
module during the power-on test after the supply
voltage is switched on. This means that there is a
hardware problem on the module.
(see also Section 8 “Self-test“)
yellow
Communication (COM):
Lights up when data is exchanged across the interface.
green
Supply voltage OK (PWR):
Lights up when all necessary supply voltages are
present (inc. the TS-PDC voltages).
6th Issue 11.05
Table 4-2 LEDs on the TS-PSAM module
4-3
Layout
Analog Stimulus and Measurement Module TS-PSAM
4.3 Mechanical construction of the TS-PDC
On this topic, see also Figure 4-3
The TS-PDC module is a rear I/O module for mounting in the back of
the CompactTSVP. The board height of the module is 3 HU (134 mm).
The module is secured in place with the two retaining screws on the
front panel. Connector X20 connects the TS-PDC module to the extension backplane in the CompactTSVP. The TS-PDC module must always use the corresponding rear I/O slot for the main module (e.g. TSPSAM module).
WARNING!
The TS-PDC module must always be inserted in the corresponding rear I/O slot (same slot code) of the TS-PSAM module.
If modules are inserted incorrectly (e.g. cPCI/PXI standard modules in the front), both modules may be damaged irreparably.
Figure 4-3 Arrangement of the connector and LEDs on the TS-PDC
module
X20
Use
Extension (Rear I/O)
Table 4-3 Connector for the TS-PDC module
4-4
6th Issue 11.05
Symbol
Analog Stimulus and Measurement Module TS-PSAM
Layout
4.4 Display elements of the TS-PDC module
On this topic, see also Figure 4-4
Eight light-emitting diodes (LEDs) are located on the front of the TSPDC module to show the current status of the generated supply voltages. The individual LEDs have the following meanings:
Figure 4-4 Arrangement of LEDs on the TS-PDC module
LED
Description
1, lights up
+15 VDC (DCS), present
2, lights up
+5 VDC (DCS), present
3, lights up
+3.3 VDC (DCS), present
4, lights up
-15 VDC (DCS), present
5, lights up
+15 VDC (MU), present
6, lights up
+5 VDC (MU), present
7, lights up
+3.3 VDC (MU), present
8, lights up
-15 VDC (MU), present
6th Issue 11.05
Table 4-4 Display elements on the TS-PDC module
4-5
Analog Stimulus and Measurement Module TS-PSAM
6th Issue 11.05
Layout
4-6
Analog Stimulus and Measurement Module TS-PSAM
Function description
5 Function Description
5.1 Function description of the TS-PSAM module
On this topic, see also Figure 5-1 and Figure 5-2
5.1.1 Primary matrix and analog measuring bus
On this topic, see also Figure 5-1
The stimulus and measurements can be cross-connected in any permutation through a full matrix to a local analog bus (8-wires LABx). The
discharge circuit can only be connected to wires a1 and a2. Cross-connection to the TSVP's analog measuring bus is possible via separate
bus coupling relays.
Configuration relays
The following relays are used for internal configuration:
•
Ground relays
•
MU and DCS configuration relays
Voltage and current measurement unit (MU)
(MU = Measurement Unit)
AC and DC voltages and currents are measured with the MU. Both MU
inputs can be switched into the local 8-wire analog bus via the full matrix.
DC voltage measurement
6th Issue 11.05
The DC voltage measurement unit (MU) is a floating measuring device
with programmable pre-filtering and adjustable input voltage ranges.
Analog/Digital conversion is performed with a serial A/D converter
whose output data are stored in a FIFO memory.
Low Pass Filter (-3 dB): (MU
Filter)
4 ranges, 400 Hz, 4 kHz, 40 kHz,
100 kHz (the same applied for current measurements)
Voltage ranges:
see specifications
Overvoltage protection:
200 V max.
Analog bandwidth (-3 dB):
>500 kHz
5-1
Function description
Analog Stimulus and Measurement Module TS-PSAM
A/D converter:
Resolution: 16-bit sampling rate:
200 kHz max.
FIFO:
8k
AC voltage measurement
AC voltage is measured using an RMS-to-DC converter. AC voltage
that is present at the inputs is converted to a DC output voltage that is
proportional to the real RMS value of the input signal. The converted
DC output voltage is processed by the A/D converter.
DC current measurement
The measurement unit for current is capable of taking readings in a
range from a few hundred nanoamperes to a 1 A. It can be switched
into the 8-wire analog bus without limitation through a full matrix. Currents larger than 100 mA are measured using a shunt resistor. On the
other hand, currents smaller than 100 mA are measured actively using
a current-voltage converter (I/U converter).
AC current measurement
The AC current is converted to an AC voltage using a shunt or I/U converter; the AC voltage is converted to a DC voltage with an RMS-to-DC
converter, and the DC voltage is processed by the A/D converter.
DC stimulus source (DCS)
(DCS = DC Source)
The DCS is a potentialless, programmable DC voltage source with adjustable current limiting and sense wires for compensating voltage
drops in circuits to the load. Depending on the test requirements, it can
function either in voltage mode or in current limiting mode.
DC stimulus source specification
Voltage range:
0 ... ±5 V
Current:
0 ... ±100 mA max.
Current limiting mode
5-2
Voltage range:
±0.1 V ... ±5 V max.
Current limit ranges:
±100 mA, 10 mA, 1 mA, 0.1 mA
6th Issue 11.05
Voltage mode
Analog Stimulus and Measurement Module TS-PSAM
Function description
Resistance measurement
With the DC Stimulus (DCS) and current measurement unit (MU), resistances can be measured in the following ways:
•
A known DC voltage Vs is applied to the resistor that is to be measured and the resulting current Ix is measured with the MU.
•
A known DC current Is is applied to the resistor via the DCS and
the resulting drop in voltage Vx at the resistor is measured with the
MU.
5.1.2 Discharge unit DCH
(DCH = Discharge Unit)
The discharge unit is provided to enable the controlled discharge of capacitors on the UUT, to prevent the circuit relays in the test system from
being irreparably damaged or the UUT from becoming charged as a result of the test procedure. For this purpose, a constant discharge current is generated with an active current limiter. The circuit is protected
against overload by an integrated heat cutout. The residual voltage after discharge is typically less than 100 mV. The DCH can be connected
to the local analog bus via relays.
In order to minimize loading on the circuit relays, the circuit path should
be set first, before the DCH is activated.
6th Issue 11.05
Specifications
Discharge current ranges:
(typical)
400 mA, 275 mA, 150 mA and 10 mA
Discharge mode:
Constant current
Maximum voltage:
±125 VDC
Discharge residual voltage:
<100 mVDC
Discharge power: (average)
2 W max.
Overvoltage protection:
200 VDC max.
Overload protection:
Thermal sensor
5-3
Function description
Analog Stimulus and Measurement Module TS-PSAM
5.1.3 Trigger logic
On this topic, see also Figure 5-2
The TS-PSAM module can be synchronized with other system components by trigger signals from the PXI trigger bus, or by local trigger
events or “software triggers“ . In all such events, the TS-PSAM module
can function as a “trigger master“ or “ a trigger slave“.
Trigger inputs
The internal FPGA Hardware uses the global trigger input signals from
the PXI trigger bus (PXI_TRIG0 ... PXI_TRIG7) and the local TTL trigger inputs on the front connector (XTI1, XTI2). In addition, the trigger
signals (XTA1, XTA2) derived from the analog input signal and the four
internal feedback trigger circuits of the trigger logic blocks (IT01 ...
IT04) are all used to detect a trigger event. The signals to be considered and their levels (high/low) are selected in configuration registers.
Trigger logic blocks
The FPGA contains four independently functioning trigger logic blocks
for generating complex trigger sequences:
1.
Multiple trigger pulses with various delay periods and the same
time reference
2.
Cascade triggers
3.
Multiple trigger pulses with adjustable duty factor
4.
Trigger logic blocks 3 and 4 are reserved for internal use (DCS,
ADC), blocks1 and 2 are available to the user
Trigger outputs
6th Issue 11.05
The outputs from the trigger logic blocks can be switched to the trigger
outputs on the front connector (XTOx) and to the PXI trigger bus
(PXI_TRIGx). The polarity of the trigger signal is programmable. The
trigger output signals are TTL compatible and are buffered using driver
circuits.
5-4
Analog Bus Connector X30
Analog Stimulus and Measurement Module TS-PSAM
a1
Analog Bus (AB)
DCH
DCS
a2
Function description
b1
b2
c1
c2
d1
d2
DCH_HI
DCS_HI
DCS_SHI
DCS_SLO
SENSE
DCS_LO
MU_HI
MU_SHI
MU_SLO
MU_LO
Local
Analog Bus
(LAB)
Isolation
PXI_TRIG0..
PXI_TRIG7
XTA1, XTA2
a1
a2
b1
b2
c1
c2
d1
Front Connector X10
MU
MU
d2
XTO1, XTO2
Trigger
XTI1, XTI2
Extension Connector X20
AUX1, AUX2
RACH1
RACH2
RACH3
GA0..GA4
G e og rap h ic
A d dres sin g
RACH4
SP I In te rfa ce
RBCH1
RACOM
CPCI Bus Connector X1
6th Issue 11.05
RBCH2
CPCI
Inte rface
RBCH3
RBCH4
RBCOM
GND
GND
CHA-GND
~
=
~
=
Figure 5-1 Block Diagram of TS-PSAM
5-5
Analog Stimulus and Measurement Module TS-PSAM
6th Issue 11.05
Function description
Figure 5-2 Block Diagram of the Trigger Hardware
5-6
Analog Stimulus and Measurement Module TS-PSAM
Function description
5.2 Function Description of the TS-PDC Module
On this topic, see also Figure 5-3
The DC/DC converter is configured as a primary reference DC/DC converter. The input voltage (5 VDC) is transfered to two secondary potentials and rectified to the nominal voltage by line controllers. The status
of the output voltage is displayed in each case by an LED.
–
+15 VDC, 0.5A (2x)
–
-15 VDC, 0.5A (2x)
–
+5 VDC, 0.5A (2x)
–
+3.3 VDC, 0.25A (2x)
+5 V
GND
Regulator
1
+15 V
+5 V
+3.3 V
COM
-15 V
Regulator
2
+15 V
+5 V
+3.3 V
COM
-15 V
primary
DC-Transducer
ON/OFF
X 20
The following DC voltages are generated:
INHIBIT
6th Issue 11.05
Figure 5-3 Block Diagram of TS-PDC
5-7
Analog Stimulus and Measurement Module TS-PSAM
6th Issue 11.05
Function description
5-8
Analog Stimulus and Measurement Module TS-PSAM
Commissioning
6 Commissioning
6.1 Installing the TS-PSAM Module
To install the plug-in module, proceed as follows:
•
Power down and switch off the CompactTSVP
•
Select a suitable front slot (slots 5-15 possible, preferably slot 8).
TS-PSAM should be connected to slot 8 and TS-PICT to slot 9 for
an in-circuit test configuration.
•
Remove the corresponding front panel portion from the TSVP
chassis by loosening the two screws
WARNING!
Check the backplane connectors for bent pins! Any bent pins
must be straightened!
Failure to do this may permanently damage the backplane!
•
Apply moderate pressure to insert the plug-in module (use locating
pin to attach)
WARNING!
To insert the plug-in module, use both hands to guide carefully
into the backplane connectors.
•
The module is correctly located when a distinct 'stop' can be felt.
•
Tighten the two retaining screws on the front panel of the module.
WARNING!
6th Issue 11.05
Install the associated TS-PDC rear I/O module as described in
Section 6.2.
6-1
Commissioning
Analog Stimulus and Measurement Module TS-PSAM
6.2 Installing the TS-PDC Module
To install the plug-in module, proceed as follows:
•
The TS-PSAM module must have been installed beforehand
•
Select the corresponding rear I/O slot for the TS-PSAM module
•
Remove the corresponding rear panel portion from the CompactTSVP chassis by loosening the two screws
WARNING!
Check the backplane connectors for bent pins! Any bent pins
must be straightened!
Failure to do this may permanently damage the backplane!
•
Push in the plug-in module using moderate pressure
WARNING!
To insert the plug-in module, use both hands to guide carefully
into the backplane connectors.
The module is correctly located when a distinct 'stop' can be felt.
•
Tighten the two retaining screws on the front panel of the module.
6th Issue 11.05
•
6-2
Analog Stimulus and Measurement Module TS-PSAM
Software
7 Software
7.1 Driver Software
A LabWindows IVI DMM driver is provided for the DMM functions on
the card. All other hardware functions are controlled using specific extensions of the driver. The driver is part of the ROHDE & SCHWARZ
GTSL software. All the functions of the driver are described fully in the
on-line help and in the LabWindows CVI Function Panels.
The following software modules are installed during driver installation:
Module
Path
Remarks
rspsam.dll
<GTSL Directory>\Bin
Driver
rspsam.hlp
<GTSL Directory>\Bin
Help file
rspsam.fp
<GTSL Directory>\Bin
LabWindows CVI Function Panel File,
Function Panels for CVI Development Environment
rspsam.sub
<GTSL Directory>\Bin
LabWindows CVI Attribute File. This file is
needed by some „Function Panels“.
rspsam.lib
<GTSL Directory>\Bin
Import Library
rspsam.h
<GTSL Directory>\Include
Header File for the Driver
Table 7-1 Driver InstallationTS-PSAM
NOTE:
6th Issue 11.05
The IVI and VISA libraries produced by National Instruments are
needed to run the driver.
7-1
Software
Analog Stimulus and Measurement Module TS-PSAM
7.2 Soft Panel
On this topic, see also Figure 7-1
A soft panel TS-PSAM is provided for the module. The soft panel is
based on the LabWindows CVI driver. It enables the measurement
module to be operated interactively. The measurement values are output in digital or graphical format (Multipoint Measurements).
6th Issue 11.05
Figure 7-1 Soft PanelTS-PSAM
7-2
Analog Stimulus and Measurement Module TS-PSAM
Software
7.3 TS-PSAM Programming Example
/*
Simple voltage measurement with TS-PSAM
*/
#include "rspsam.h"
main()
{
ViSession handle;
ViReal64 result;
rspsam_InitWithOptions ("PXI1::14::0::INSTR", VI_TRUE, VI_TRUE, "",
& handle);
rspsam_Connect (handle, "DMM_HI", "ABa1");
rspsam_Connect (handle, "DMM_LO", "ABc1");
rspsam_ConfigureMeasurement(handle,RSPSAM_VAL_DC_VOLTS,
RSPSAM_VAL_AUTO_RANGE_ON, 0.0001);
rspsam_Read (handle, 5000, & result);
rspsam_close (handle);
6th Issue 11.05
}
7-3
Analog Stimulus and Measurement Module TS-PSAM
6th Issue 11.05
Software
7-4
Analog Stimulus and Measurement Module TS-PSAM
Self-Test
8 Self-Test
The Analog Stimulus and Measurement Module TS-PSAM has integrated self-test capability. The following tests are possible:
•
LED Test:
•
Power-on test
•
TSVP self-test
8.1 LED Test:
When the device is switched on, all three LEDs are lit for about one second. This indicates that the 5 V supply voltage is present and all LEDs
are working, also that the power-on test was successful. The following
statements can be made about the different LED statuses in this power-on phase:
LED
Description
One LED
does not light
up
Hardware problem on the module
LED faulty
No LED's
light up
No +5V supply
Table 8-1 Statements about the LED Test
NOTE:
6th Issue 11.05
If diagnostics suggest a problem with the supply voltage, the
LEDs for the associated rear I/O module, TS-PDC, must be inspected visually. If a supply voltage failure is confirmed, the TSPDC module must be replaced.
8-1
Self-Test
Analog Stimulus and Measurement Module TS-PSAM
8.2 Power-on test
The power-on test runs at the same time as the LED test. In this test,
the result of the FPGA loading process is calculated. The following
statements can be made about the different statuses of the red and
green LEDs:
LED
Description
Green LED
on
all supply voltages present
green LED
off
at least one supply voltage from TS-PSAM module
or the TS-PDC module is not present
red LED off
no errors were detected
red LED on
The FPGA/µP was not successfully loaded
Table 8-2 Statements about the power-on test
NOTE:
If diagnostics suggest a problem with the supply voltage, the
LEDs for the associated rear I/O module, TS-PDC, must be inspected visually. If a supply voltage failure is confirmed, the TSPDC module must be replaced.
8.3 TSVP Self-Test
The TSVP self-test runs an in-depth test on the module and generates
a detailed log. This is done with the “Self-Test Support Library“.
The TS-PSAM module is used as a measurement unit of R&S modules
in the TSVP. The correct operation of the modules is ensured by measurements on the analog bus.
You will find information about starting the self-test and on the
sequence of necessary steps in the GTSL soft ware description
or the GTSL on-line help.
8-2
6th Issue 11.05
NOTE:
Analog Stimulus and Measurement Module TS-PSAM
Interface description
9 Interface description
Below the interface description for the TS-PSAM module and the TSPDC module is shown.
9.1 Interface description for TS-PSAM
9.1.1 Connector X10 (Front Connector)
Figure 9-1 Connector X10 (mating side)
6th Issue 11.05
Pin
A
B
C
1
LABA1
GND
LABA2
2
LABB1
GND
LABB2
3
LABC1
GND
LABC2
4
LABD1
GND
LABD2
5
GND
GND
GND
Table 9-1 Pin assignment for connector X10
9-1
Interface description
Analog Stimulus and Measurement Module TS-PSAM
Pin
A
B
C
6
IL1
GND
IL2
7
GND
GND
GND
8
9
RACH1
RBCH1
10
RACH2
RBCH2
11
RACH3
RBCH3
12
RACH4
RBCH4
13
RACOM
RBCOM
14
15
16
17
18
19
20
21
22
23
GND
25
GND
GND
GND
26
GND
GND
GND
27
AUX1
GND
AUX2
28
GND
GND
GND
29
XTO1
GND
XTO2
30
XTI1
GND
XTI2
31
GND
GND
GND
32
GND
GND
CHA-GND
Table 9-1 Pin assignment for connector X10
The CHA-GND signal is connected to the front panel of the TS-PSAM.
The front panel is capacitively coupled to GND.
9-2
6th Issue 11.05
24
Analog Stimulus and Measurement Module TS-PSAM
Interface description
9.1.2 Connector X20 (Extension Connector)
6th Issue 11.05
Figure 9-2 Connector X20 (mating side)
Table 9-2 Pin assignment for connector X20
9-3
Interface description
Analog Stimulus and Measurement Module TS-PSAM
9.1.3 Connector X30 (Analog Bus Connector)
Figure 9-3 Connector X30 (mating side)
E
7
D
IL2
6
5
A
IL1
ABC1
ABA1
ABB1
ABC2
2
1
B
GND
4
3
C
ABB2
ABA2
ABD2
ABD1
6th Issue 11.05
Table 9-3 Pin assignment for connector X30
9-4
Analog Stimulus and Measurement Module TS-PSAM
Interface description
9.1.4 Connector X1 (cPCI Bus Connector)
6th Issue 11.05
Figure 9-4 Connector X1 (mating side)
Pin F
25 GND
24 GND
23 GND
22 GND
21 GND
20 GND
19 GND
18 GND
17 GND
16 GND
15 GND
12..14
11 GND
10 GND
9 GND
8 GND
7 GND
6 GND
5 GND
4 GND
3 GND
2 GND
1 GND
E
5V
D
3.3V
C
ENUM#
B
REQ64#
A
5V
ACK64#
AD[0]
V(I/O)
5V
AD[2]
5V
AD[3]
AD[4]
3.3V
AD[5]
AD[6]
3.3V
GND
AD[7]
C/BE[0]#
M66EN
AD[8]
AD[9]
3.3V
AD[10]
AD[11]
V(I/O)
GND
AD[12]
AD[13]
GND
AD[14]
AD[15]
3.3V
C/BE[1]#
PAR
3.3V
GND
SERR#
PERR#
GND
IPMB_SDA
IPMB_SCL
3.3V
LOCK#
STOP#
V(I/O)
GND
DEVSEL#
TRDY#
BD_SEL#
IRDY#
FRAME#
3.3V
AD[18]
AD[1]
Key Area
C/BE[2]#
GND
AD[16]
AD[17]
AD[19]
AD[20]
3.3V
GND
AD[21]
AD[22]
GND
AD[23]
IDSEL
C/BE[3]#
AD[24]
AD[25]
V(I/O)
GND
AD[26]
AD[27]
GND
AD[28]
AD[29]
AD[30]
AD[31]
CLK
3.3V
GND
REQ#
GNT#
GND
RST#
BSRSV
BSRSV
INTS
INTP
V(I/O)
HEALTHY#
IPMB_PWR
INTD#
5V
INTC#
INTB#
INTA#
TDI
TDO
TMS
5V
TCK
5V
+12V
TRST#
-12V
5V
Z
GND
GND
GND
GND
GND
GND X1
GND
GND
GND C
GND O
GND N
N
GND E
GND C
GND T
GND O
GND R
GND
GND
GND
GND
GND
GND
Table 9-4 Pin assignment for connector X1
9-5
Interface description
Analog Stimulus and Measurement Module TS-PSAM
9.2 Interface description for TS-PDC
9.2.1 Connector X20 (Extension Connector)
6th Issue 11.05
Figure 9-5 Connector X20 (TS-PDC mating side)
9-6
Analog Stimulus and Measurement Module TS-PSAM
Pin
22
21
20
19
18
17
16
15
14
13
12
11
10
9
8
7
6
5
4
3
2
1
Pin
Z
GND
GND
GND
GND
GND
GND
GND
GND
A
B
C
Interface description
D
E
GND or NC *3)
+5V
*1)
GND
+5V
*1)
GND
+5V *2)
GND
+5V *2)
GND
+5V
*1)
GND
+5V *2)
+5V *2)
GND
+5V
*1)
F
GND
GND
GND
GND
GND
GND
GND
GND
NC
NC
NC
NC
NP
+15V_1
-15V_1
+5V_1
+3.3V_1
COM_1
NP
+15V_2
-15V_2
+5V_2
+3.3V_2
COM_2
NC
COM_1
COM_1
COM_1
COM_1
COM_1
COM_2
COM_2
COM_2
COM_2
COM_2
NP
NC
NP
NC
NC
NC
NC
NC
NC
NC
*1)
*2)
*3)
NC
C
O
N
N
E
C
T
O
R
NC
NC
GND
GND
GND
Z
NC
J20
NC
GND
RRST#
RSCLK
RSDI
RCS#
GND
A
B
+5V
C
D
E
*1)
GND
GND
GND
F
TS-PDC V1.0 is supplied via these pins from +5V, for backplanes up to V3.x
TS-PDC V1.1 is supplied via these pins or pins from *1) , for backplanes V1.x to V4.x
TS-PDC V1.1 and V1.2: GND, for version V1.3: NC (Not Connected)
6th Issue 11.05
Table 9-5 Pin assignment for connector X20 (TS-PDC)
9-7
Analog Stimulus and Measurement Module TS-PSAM
6th Issue 11.05
Interface description
9-8
Analog Stimulus and Measurement Module TS-PSAM
Specifications
10 Specifications
NOTE:
In the event of any discrepancies between data in this manual
and the technical data in the data sheet, the data sheet takes
precedence.
10.1 Technical Specifications for the TS-PSAM
Module
10.1.1 DC voltage source
10.1.1.1 Voltage adjustment
Output voltage:
-5V to +5 V
Resolution:
approx. 200 µV
Accuracy [1]:
0.2 + 5 mV
Maximum output current:
100 mA
Source impedance:
see Current limiting
[1]
Accuracy: ±(% of adjustment value + absolute value)
Temperature coefficient: ±(0.1 * accuracy) / °C
10.1.1.2 Current limiting
6th Issue 11.05
Range
Resolution
Accuracy
[1]
Output characteristics
(Sense wires not crossconnected)
3 µA ... 100 µA
2 nA
0.25 + 1 µA
max. 10 kΩ
30 µA ... 1 mA
20 nA
0.25 + 5 µA
max. 1 kΩ
300 µA ... 10 mA
200 nA
0.25 + 50 µA
max. 100 Ω
3 mA ... 100 mA
2 µA
0.25 + 100 µA
10 Ω
[1]
Accuracy in ±(% of adjustment value + absolute value)
Temperature coefficient: ±(0.1 * accuracy) / °C
10-1
Specifications
Analog Stimulus and Measurement Module TS-PSAM
10.1.2 Measurement unit
Signal sampling rate:
200 kHz max.
Memory:
8 k sampling points
Triggers:
PXI bus, signal with programmable threshold
10.1.2.1 Voltage
10-2
Resolution
Input
characteristics
Accuracy
averaged, [1] [2]
Accuracy
unaveraged, [1] [3]
10 mV [4]
0.4 µV
>100 MΩ
0.02 + 80 µV
0.02 + 150 µV
20 mV [4]
0.8 µV
>100 MΩ
0.02 + 80 µV
0.02 + 150 µV
50 mV [4]
2 µV
>100 MΩ
0.02 + 80 µV
0.02 + 150 µV
100 mV
4 µV
>100 MΩ
0.02 + 100 µV
0.02 + 200 µV
200 mV
8 µV
>100 MΩ
0.02 + 100 µV
0.02 + 200 µV
500 mV
20 µV
>100 MΩ
0.02 + 100 µV
0.02 + 250 µV
1 V
40 µV
>100 MΩ
0.02 + 160 µV
0.02 + 400 µV
2 V
80 µV
>100 MΩ
0.02 + 320 µV
0.02 + 800 µV
5 V
0.2 mV
>100 MΩ
0.02 + 0.8 mV
0.02 + 1.6 mV
10 V
0.4 mV
>100 MΩ
0.02 + 1.6 mV
0.02 + 3.2 mV
20 V
0.8 mV
10 MΩ
0.02 + 3.2 mV
0.02 + 6.4 mV
50 V
2 mV
10 MΩ
0.02 + 8 mV
0.02 + 16 mV
100 V
4 mV
10 MΩ
0.02 + 16 mV
0.02 + 32 mV
200 V [5]
8 mV
10 MΩ
0.02 + 64 mV
0.02 + 128 mV
[1]
Accuracy: ±(% of read value + absolute value)
Temperature coefficient: ±(0.1 * accuracy) / °C
[2]
averaged over 100 sampling points, measuring time: 20 ms, 400 Hz filter
[3]
Signal recording: 1 ... 8 k sampling points, unaveraged, 40 kHz filter
[4]
ground-connected
[5]
max. input voltage 125 V rms
6th Issue 11.05
Range
Analog Stimulus and Measurement Module TS-PSAM
Specifications
10.1.2.2 Current
6th Issue 11.05
Range
Resolution
Input
characteristics
Accuracy
averaged, [1] [4]
Accuracy
unaveraged, [1] [5]
1 µA
0.04 nA
[2]
0.2 + 2 nA
0.2 + 100 nA
2 µA
0.08 nA
[2]
0.2 + 4 nA
0.2 + 100 nA
5 µA
0.2 nA
[2]
0.2 + 10 nA
0.2 + 100 nA
10 µA
0.4 nA
[2]
0.1 + 10 nA
0.1 + 300 nA
20 µA
0.8nA
[2]
0.1 + 20 nA
0.1 + 300 nA
50 µA
2 nA
[2]
0.1 + 50 nA
0.1 + 300 nA
100 µA
4 nA
[2]
0.1 + 100 nA
0,1 + 500 nA
200 µA
8 nA
[2]
0.1 + 200 nA
0,1 + 500 nA
500 µA
20 nA
[2]
0,1 + 500 nA
0.1 + 1000 nA
1 mA
40 nA
[2]
0.1 + 1000 nA
0.1 + 2000 nA
2 mA
80 nA
[2]
0.1 + 2000 nA
0.1 + 4000 nA
5 mA
0.2 µA
[2]
0.1 + 5 µA
0.1 + 10 µA
10 mA
0.4 µA
[2]
0.1 + 10 µA
0.1 + 20 µA
20 mA
0.8 µA
[2]
0.1 + 20 µA
0.1 + 40 µA
50 mA
2 µA
[2]
0.1 + 50 µA
0.1 + 100 µA
100 mA
4 µA
[2]
0.1 + 100 µA
0.1 + 200 µA
200 mA
8 µA
[3]
0.5 + 200 µA
0.5 + 400 µA
500 mA
20 µA
[3]
0.5 + 500 µA
0.5 + 1000 µA
1A
40 µA
[3]
0.5 + 1000 µA
0.5 + 2000 µA
[1]
Accuracy: ±(% of read value + absolute value)
Temperature coefficient: ±(0.1 * accuracy) / °C
[2]
active current measurement with a current / voltage amplifier
[3]
0.5 Ω Shunt
[4]
averaged over 100 sampling points, measuring time: 20 ms, 400 Hz filter
[5]
Signal recording: 1 ... 8 k sampling points, unaveraged, 40 kHz filter
10-3
Specifications
Analog Stimulus and Measurement Module TS-PSAM
10.1.2.3 RMS value measurement
The accuracy measurements apply only for sinus signals in the frequency range from 20 Hz to 50 kHz. This accuracy is only achieved if
the input level is at least 10% of the measurement range final value.
10.1.2.3.1 AC voltage
20 mV
50 mV
100 mV
200 mV
500 mV
1V
10-4
Frequency range
Accuracy [1]
20 Hz ... 50 Hz
2.5 + 100 µV
50 Hz ... 10 kHz
1.0 + 100 µV
10 kHz ... 20 kHz
1.5 + 100 µV
20 kHz ... 50 kHz
2.5 + 100 µV
20 Hz ... 50 Hz
2.5 + 150 µV
50 Hz ... 10 kHz
1.0 + 150 µV
10 kHz ... 20 kHz
1.5 + 150 µV
20 kHz ... 50 kHz
2.5 + 150 µV
20 Hz ... 50 Hz
2.5 + 200 µV
50 Hz ... 10 kHz
1.0 + 200 µV
10 kHz ... 20 kHz
1.5 + 200 µV
20 kHz ... 50 kHz
2.5 + 200 µV
20 Hz ... 50 Hz
2.5 + 500 µV
50 Hz ... 10 kHz
1.0 + 500 µV
10 kHz ... 20 kHz
1.5 + 500 µV
20 kHz ... 50 kHz
2.5 + 500 µV
20 Hz ... 50 Hz
2.5 + 500 µV
50 Hz ... 10 kHz
1.0 + 500 µV
10 kHz ... 20 kHz
1.5 + 500 µV
20 kHz ... 50 kHz
2.5 + 500 µV
20 Hz ... 50 Hz
2.5 + 1 mV
6th Issue 11.05
Range
Analog Stimulus and Measurement Module TS-PSAM
Range
2V
5V
10 V
20 V
50 V
6th Issue 11.05
100 V
200 V
Frequency range
Specifications
Accuracy [1]
50 Hz ... 10 kHz
1.0 + 1 mV
10 kHz ... 20 kHz
1.5 + 1 mV
20 kHz ... 50 kHz
2.5 + 1 mV
20 Hz ... 50 Hz
2.5 + 2,5 mV
50 Hz ... 10 kHz
1.0 + 2,5 mV
10 kHz ... 20 kHz
1.5 + 2,5 mV
20 kHz ... 50 kHz
2.5 + 2,5 mV
20 Hz ... 50 Hz
2.5 + 5 mV
50 Hz ... 10 kHz
1.0 + 5 mV
10 kHz ... 20 kHz
1.5 + 5 mV
20 kHz ... 50 kHz
2.5 + 5 mV
20 Hz ... 50 Hz
2.5 + 10 mV
50 Hz ... 10 kHz
1.0 + 10 mV
10 kHz ... 20 kHz
1.5 + 10 mV
20 kHz ... 50 kHz
2.5 + 10 mV
20 Hz ... 50 Hz
2.5 + 25 mV
50 Hz ... 10 kHz
1.0 + 25 mV
10 kHz ... 20 kHz
1.5 + 25 mV
20 kHz ... 50 kHz
2.5 + 25 mV
20 Hz ... 50 Hz
2.5 + 50 mV
50 Hz ... 10 kHz
1.0 + 50 mV
10 kHz ... 20 kHz
1.5 + 50 mV
20 kHz ... 50 kHz
2.5 + 50 mV
20 Hz ... 50 Hz
2.5 + 100 mV
50 Hz ... 10 kHz
1.0 + 100 mV
10 kHz ... 20 kHz
1.5 + 100 mV
20 kHz ... 50 kHz
2.5 + 100 mV
20 Hz ... 50 Hz
2.5 + 200 mV
50 Hz ... 10 kHz
1.0 + 200 mV
10 kHz ... 20 kHz
1.5 + 200 mV
10-5
Specifications
Range
Analog Stimulus and Measurement Module TS-PSAM
Frequency range
20 kHz ... 50 kHz
[1]
Accuracy [1]
2.5 + 200 mV
Accuracy: ±(% of the read value + absolute value)
Temperature coefficient: ±(0.1 * Accuracy) / °C
averaged over 100 sampling points, measuring time: 20 ms, 40 kHz filter
10.1.2.3.2 AC current
100 µA
200 µA
500 µA
1 mA
2 mA
5 mA
10-6
Frequency range
Accuracy
[1]
20 Hz ... 50 Hz
2.5 + 500 nA
50 Hz ... 10 kHz
1.0 + 500 nA
10 kHz ... 20 kHz
1.5 + 500 nA
20 kHz ... 50 kHz
2.5 + 500 nA
20 Hz ... 50 Hz
2.5 + 1.25 µA
50 Hz ... 10 kHz
1.0 + 1.25 µA
10 kHz ... 20 kHz
1.5 + 1.25 µA
20 kHz ... 50 kHz
2.5 + 1.25 µA
20 Hz ... 50 Hz
2.5 + 2.50 µA
50 Hz ... 10 kHz
1.0 + 2.50 µA
10 kHz ... 20 kHz
1.5 + 2.50 µA
20 kHz ... 50 kHz
2.5 + 2.50 µA
20 Hz ... 50 Hz
2.5 + 5 µA
50 Hz ... 10 kHz
1.0 + 5 µA
10 kHz ... 20 kHz
1.5 + 5 µA
20 kHz ... 50 kHz
2.5 + 5 µA
20 Hz ... 50 Hz
2.5 + 12.5 µA
50 Hz ... 10 kHz
1.0 + 12.5 µA
10 kHz ... 20 kHz
1.5 + 12.5 µA
20 kHz ... 50 kHz
2.5 + 12.5 µA
20 Hz ... 50 Hz
2.5 + 25.0 µA
6th Issue 11.05
Range
Analog Stimulus and Measurement Module TS-PSAM
Range
10 mA
20 mA
50 mA
100 mA
200 mA
6th Issue 11.05
500 mA
1A
Frequency range
Specifications
Accuracy
[1]
50 Hz ... 10 kHz
1.0 + 25.0 µA
10 kHz ... 20 kHz
1.5 + 25.0 µA
20 kHz ... 50 kHz
2.5 + 25.0 µA
20 Hz ... 50 Hz
2.5 + 50 µA
50 Hz ... 10 kHz
1.0 + 50 µA
10 kHz ... 20 kHz
1.5 + 50 µA
20 kHz ... 50 kHz
2.5 + 50 µA
20 Hz ... 50 Hz
2.5 + 125 µA
50 Hz ... 10 kHz
1.0 + 125 µA
10 kHz ... 20 kHz
1.5 + 125 µA
20 kHz ... 50 kHz
2.5 + 125 µA
20 Hz ... 50 Hz
2.5 + 250 µA
50 Hz ... 10 kHz
1.0 + 250 µA
10 kHz ... 20 kHz
1.5 + 250 µA
20 kHz ... 50 kHz
2.5 + 250 µA
20 Hz ... 50 Hz
2.5 + 500 µA
50 Hz ... 10 kHz
1.0 + 500 µA
10 kHz ... 20 kHz
1.5 + 500 µA
20 kHz ... 50 kHz
2.5 + 500 µA
20 Hz ... 50 Hz
2.5 + 1.25 mA
50 Hz ... 10 kHz
1.0 + 1.25 mA
10 kHz ... 20 kHz
1.5 + 1.25 mA
20 kHz ... 50 kHz
2.5 + 1.25 mA
20 Hz ... 50 Hz
2.5 + 2.50 mA
50 Hz ... 10 kHz
1.0 + 2.50 mA
10 kHz ... 20 kHz
1.5 + 2.50 mA
20 kHz ... 50 kHz
2.5 + 2.50 mA
20 Hz ... 50 Hz
2.5 + 5 mA
50 Hz ... 10 kHz
1.0 + 5 mA
10 kHz ... 20 kHz
1.5 + 5 mA
10-7
Specifications
Analog Stimulus and Measurement Module TS-PSAM
Range
Frequency range
Accuracy
[1]
20 kHz ... 50 kHz
[1]
2.5 + 5 mA
Accuracy: ±(% of the read value + absolute value)
Temperature coefficient: ±(0.1 * Accuracy) / °C
averaged over 100 sampling points, measuring time: 20 ms, 40 kHz filter
10.1.2.4 Resistance measurement
Resistance measurements are taken with the aid of the DC voltage
source and the measurement unit. 2- and 4-wire measurements are
possible. Either of two different methods may be used depending n the
range.
Accuracy
0.1 Ω ... 1 Ω
1 + 5 mΩ [2]
CS
0.5 V max.
100 mA
1 Ω... 10 Ω
0.5 [1]
CS
0.2 V max.
10 mA
10 Ω... 100 Ω
0.5 [1]
VS
0.2 V
25 mA max.
100 Ω... 1 kΩ
0.5 [1]
VS
0.2 V
2.5 mA max.
1 kΩ... 10 kΩ
0.5 [1]
V
0.2 V
1 mA max.
10 kΩ... 100 kΩ
1 [1]
V
0.2 V
0.1 mA max.
100 kΩ... 1 MΩ
1 [1]
V
1V
0.1 mA max.
1 MΩ... 10 MΩ
1 [1]
V
5V
0.1 mA max.
[1]
Accuracy: ±(% of read value)
Temperature coefficient: ±(0.1 * accuracy) / °C
[2]
Accuracy: ±(% of read value + absolute value)
Temperature coefficient: ±(0.1 * accuracy) / °C
[3]
10-8
Operating
mode
[3]
CS
V
VS
Voltage source
4-wire, current applied, voltage measured
2-wire, voltage applied, current measured
4-wire, voltage applied, current measured
Current source
6th Issue 11.05
Range
Analog Stimulus and Measurement Module TS-PSAM
Specifications
10.1.3 Discharge circuit
max. input voltage:
125 V
Overvoltage protection up to:
200 V DC
max. discharge current:
400 mA typ.
10.1.4 Analog bus and relay multiplexer
Analog bus access:
8 buses
Relay scanner:
2 x 4- to-1 multiplexers
max. DC/AC voltage:
125 V / 125 V rms
max. current:
1 A / 1 A rms
Max. switching capacity
10 W / 10 VA
10.1.5 General Data
Power consumption:
+5 V / 5.8 A
+3.3 V / 0.2 A, 30 W max. inc.
TS-PDC
EMC:
according to EMC Directive
89/336/EEC and Standard
EN61326
Safety:
CE, EN61010 Part 1
Mechanical strength
•
Vibration test sinusoidal
Sinus 5 Hz ... 55 Hz:
Sinus 55 Hz ... 150 Hz:
2 g, MIL-T-28800D, class 5
0.5 g, MIL-T-28800D, class 5
6th Issue 11.05
•
Vibration test random
10 Hz ... 300 Hz:
Shock test:
1.2 g
40 g, MIL-STD-810.
Classes 3 and 5
10-9
Specifications
Analog Stimulus and Measurement Module TS-PSAM
Heat resistance
•
Nominal temperature range:
•
Operating temperature range:
•
Storage temperature range:
•
Humidity:
+5 ... +40°C
+0 ... +50°C
-40 ... +70°C
+40°C, 95% rel. humidity
Dimensions in mm:
316 x 174 x 20
Weight:
0.45 kg
Calibration interval
(recommended):
1 year
10.2 Technical Specifications for the TS-PDC Module
10.2.1 Electrical Specifications
Input voltage:
5 VDC
Output voltages:
(2x output voltages)
+15 VDC, 0.5 A -15 VDC, 0.5 A
+5 VDC, 0.5 A +3.3 VDC,
0.25 A
Clock frequency:
200 kHz
EMC:
according to EMC Directive
89/336/EEC and Standard
EN61326
Safety:
CE, EN61010 Part 1
Mechanical strength
•
Vibration test sinusoidal
Sinus 5 Hz ... 55 Hz:
Sinus 55 Hz ... 150 Hz:
2 g, MIL-T-28800D, class 5
0.5 g, MIL-T-28800D, class 5
•
Vibration test random
10 Hz ... 300 Hz:
Shock test:
10-10
1.2 g
40 g, MIL-STD-810. Classes 3
and 5
6th Issue 11.05
10.2.2 General Data
Analog Stimulus and Measurement Module TS-PSAM
Specifications
+5 ... +40°C
+0 ... +50°C
-40 ... +70°C
+40°C, 95% rel. humidity
Dimensions in mm:
120 x 95 x 20
Weight:
0.3 kg
6th Issue 11.05
Heat resistance
•
Nominal temperature range:
•
Operating temperature range:
•
Storage temperature range:
•
Humidity:
10-11