1
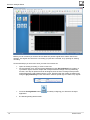
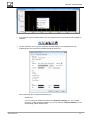
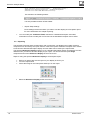
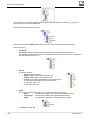
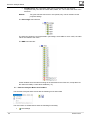
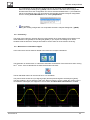
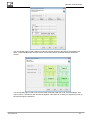
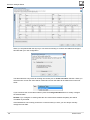
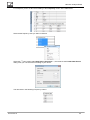
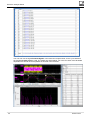
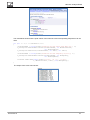
Harmonic Analysis Sheet In the picture above you can see that there are three results of three traces called i_1, i_2 and i_3 Next to this you can see the Active tree. All these trees have the same structure. Each sub tree has a TraceName field; this is the name of the trace used for the calculations. The sub trees are: Frequency F01 to F05 are the harmonic frequencies, where F01 is the fundamental frequency The number of frequencies depends on the selected number of harmonics to be calculated, in this example this was set to 5 Period The period contains: o DC is the DC component o Mean the mean value of the selected cycle o RMS the RMS value of the selected cycle o THD the Total Harmonic Distortion of the selected cycle o σ is the standard deviation of the selected cycle o t1 the begin of the cycle o t2 the end of the cycle Value This section contains information on the various harmonic coefficients: o Peak: The values are related to the signal Peak amplitude value, o Percentage: The values are related to the fundamental frequency o RMS: The values are related to the RMS value of the signal The Peak tree looks like: 20 A4192-2.0 en