1
Simple Performance
Optimization Tool (SPOT) 2.0
User's Guide
Beta
Sun Microsystems, Inc.
4150 Network Circle
Santa Clara, CA 95054
U.S.A.
Part No: 820–5372
June 2008
Copyright 2008 Sun Microsystems, Inc.
4150 Network Circle, Santa Clara, CA 95054 U.S.A.
All rights reserved.
Sun Microsystems, Inc. has intellectual property rights relating to technology embodied in the product that is described in this document. In particular, and without
limitation, these intellectual property rights may include one or more U.S. patents or pending patent applications in the U.S. and in other countries.
U.S. Government Rights – Commercial software. Government users are subject to the Sun Microsystems, Inc. standard license agreement and applicable provisions
of the FAR and its supplements.
This distribution may include materials developed by third parties.
Parts of the product may be derived from Berkeley BSD systems, licensed from the University of California. UNIX is a registered trademark in the U.S. and other
countries, exclusively licensed through X/Open Company, Ltd.
Sun, Sun Microsystems, the Sun logo, the Solaris logo, the Java Coffee Cup logo, docs.sun.com, Java, and Solaris are trademarks or registered trademarks of Sun
Microsystems, Inc. or its subsidiaries in the U.S. and other countries. All SPARC trademarks are used under license and are trademarks or registered trademarks of
SPARC International, Inc. in the U.S. and other countries. Products bearing SPARC trademarks are based upon an architecture developed by Sun Microsystems, Inc.
The OPEN LOOK and SunTM Graphical User Interface was developed by Sun Microsystems, Inc. for its users and licensees. Sun acknowledges the pioneering efforts
of Xerox in researching and developing the concept of visual or graphical user interfaces for the computer industry. Sun holds a non-exclusive license from Xerox to
the Xerox Graphical User Interface, which license also covers Sun's licensees who implement OPEN LOOK GUIs and otherwise comply with Sun's written license
agreements.
Products covered by and information contained in this publication are controlled by U.S. Export Control laws and may be subject to the export or import laws in
other countries. Nuclear, missile, chemical or biological weapons or nuclear maritime end uses or end users, whether direct or indirect, are strictly prohibited. Export
or reexport to countries subject to U.S. embargo or to entities identified on U.S. export exclusion lists, including, but not limited to, the denied persons and specially
designated nationals lists is strictly prohibited.
DOCUMENTATION IS PROVIDED “AS IS” AND ALL EXPRESS OR IMPLIED CONDITIONS, REPRESENTATIONS AND WARRANTIES, INCLUDING ANY
IMPLIED WARRANTY OF MERCHANTABILITY, FITNESS FOR A PARTICULAR PURPOSE OR NON-INFRINGEMENT, ARE DISCLAIMED, EXCEPT TO
THE EXTENT THAT SUCH DISCLAIMERS ARE HELD TO BE LEGALLY INVALID.
080619@20490
Contents
1
Introduction and Installation ..............................................................................................................5
Introduction ............................................................................................................................................5
Supported Platforms ..............................................................................................................................6
Downloading and Installing the Software ...........................................................................................6
Uninstalling the Software ......................................................................................................................8
Support ....................................................................................................................................................9
2
Using the SPOT Software .................................................................................................................... 11
Using the spot Command .................................................................................................................. 11
Example of Compiling and Running an Application Under SPOT .............................................. 12
Running an Application Under spot ................................................................................................. 14
3
Understanding SPOT Reports ............................................................................................................15
The Architecture of the SPOT Software ........................................................................................... 15
Runtime System and Build Information ........................................................................................... 17
Processor Events .................................................................................................................................. 19
Instruction Frequency Data ............................................................................................................... 24
System-Wide Bandwidth .................................................................................................................... 25
System-Wide Trap Information ........................................................................................................ 28
Profiling Where the Processor Events Occur ................................................................................... 31
Time Based Profile of the Application .............................................................................................. 33
The spot_diff Report ........................................................................................................................... 38
Notes on the SPOT report .................................................................................................................. 43
3
4
1
C H A P T E R
1
Introduction and Installation
This chapter introduces the features of the Simple Performance Optimization Tool (SPOT),
and contains the following sections:
■
■
■
■
“Introduction” on page 5
“Downloading and Installing the Software” on page 6
“Uninstalling the Software” on page 8
“Support” on page 9
Introduction
SPOT was written to help diagnose performance problems that can limit the speed of an
application. The role of SPOT is complementary to running the application under the SunTM
Studio Performance Analyzer, and looking at the resulting experiment. The profile generated by
Analyzer will tell you where the time was spent in running your application. In certain
situations, however, you may not be able to diagnose your application’s problems just by
examining its profile.
For example, some problems that cannot easily be solved by inspecting the application profile
include:
■
Is the time spent in the routine high because the routine itself is slow, or because the routine
is called a large number of times?
■
Is a line of code taking time because it misses cache or because it misses the translation
lookaside buffer (TLB)?
■
Are traps slowing down the application?
■
Is the application reaching a memory bandwidth limit?
While you may be able to identify the cause of these issues by looking at the application’s profile
and running additional tools, you may not know what tools are available or which specific tool
to use.
5
Supported Platforms
SPOT simplifies the entire process of performance analysis by running an application under a
common set of tools and producing an HTML report of its findings. This provides the following
benefits:
■
By creating HTML reports, SPOT enables the reports to be placed on a server that can be
accessed by an entire development team. For example, a SPOT report can be examined by
remote colleagues, or referred to during a meeting. You could even email a URL of a
particular line of source code, or disassembly, to a colleague for further review.
■
The SPOT report archives the compiler build commands as well as the profile for the active
parts of the application. By comparing the current application profile with an older profile,
you can easily check for either changed code or changed compiler build flags.
■
SPOT can also profile the application according to the most frequently occuring hardware
events; this indicates which routines are encountering which problems.
Supported Platforms
SPOT is available for both SPARC and x86 platforms. The specific details included in the report
are platform dependent. Not all the tools used by SPOT are available for all platforms:
instruction count data, bandwidth data, and trap data are not available on the x86 platform.
Downloading and Installing the Software
You can download the Simple Performance Optimization Tool software packages from the
Cool Tools web site (http://cooltools.sunsource.net/) or from the Sun Download Center
(http://www.sun.com/download/). In the Sun Download Center, the software can be found in
the Development Tools section of the Application Development category.
The SPOT software is distributed as part of the CMT Developer Tools. The download is a single
tar file that contains two packages SPROprfns and SPROcool. Both of these software packages
should be installed into the same directory as the Sun Studio 12 compiler, which must be
installed prior to installing the CMT Developer Tool software. (By default, the Sun Studio 12
compiler software is usually installed in the /opt/SUNWspro/ directory.)
The following commands assume that the tar file containing the CMT Developer Tools has
been downloaded into the /tmp directory. Installing a package requires root privileges
# cd /tmp
# tar xvf SPROcmt.SPARCV9.tar
x SPROcool, 0 bytes, 0 tape blocks
x SPROcool/pkgmap, 4339 bytes, 9 tape blocks
x SPROcool/pkginfo, 463 bytes, 1 tape blocks
x SPROcool/reloc, 0 bytes, 0 tape blocks
...
6
Simple Performance Optimization Tool (SPOT) 2.0 User's Guide • June 2008 (Beta)
Downloading and Installing the Software
x SPROprfns/install/i.none, 2053 bytes, 5 tape blocks
x SPROprfns/archive, 0 bytes, 0 tape blocks
x SPROprfns/archive/none, 19960117 bytes, 38985 tape blocks
Refer to the pkgadd(1M) man page for additional information about installing software
packages. The command ”pkgadd -d . SPROprfns SPROcool” should be used to install the
packages. Answer ”y’ to the prompts from pkgadd. The pkgadd command requires root
permissions. The order that the packages are installed is important.
% pkgadd -d . SPROprfns SPROcool
Processing package instance <SPROprfns> from </tmp>
Sun Studio 12 Non-ship commands for Performance Analyzer
(sparc) 12.0,REV=2007.05.29
Copyright 2007 Sun Microsystems, Inc. All rights reserved.
Using </opt> as the package base directory.
## Processing package information.
## Processing system information.
22 package pathnames are already properly installed.
## Verifying package dependencies.
## Verifying disk space requirements.
## Checking for conflicts with packages already installed.
## Checking for setuid/setgid programs.
This package contains scripts which will be executed with super-user
permission during the process of installing this package.
Do you want to continue with the installation of <SPROprfns> [y,n,?] y
Installing Sun Studio 12 Non-ship commands for Performance Analyzer as <SPROprfns>
## Installing part 1 of 1.
## Executing postinstall script.
Installation of <SPROprfns> was successful.
Processing package instance <SPROcool> from </tmp>
Cool Tools
(sparc) 12.0,REV=2007.06.19
Copyright 2007 Sun Microsystems, Inc. All rights reserved.
Using </opt> as the package base directory.
## Processing package information.
## Processing system information.
30 package pathnames are already properly installed.
## Verifying package dependencies.
## Verifying disk space requirements.
Chapter 1 • Introduction and Installation
7
Uninstalling the Software
## Checking for conflicts with packages already installed.
## Checking for setuid/setgid programs.
This package contains scripts which will be executed with super-user
permission during the process of installing this package.
Do you want to continue with the installation of <SPROcool> [y,n,?] y
Installing Cool Tools as <SPROcool>
## Installing part 1 of 1.
## Executing postinstall script.
Installation of <SPROcool> was successful.
The following commands will be installed into the /opt/SUNWspro/extra/bin directory:
spot, er_html, bit, bw, traps, ripc, spot_diff
Note – Several SPOT tools will generate graphs if they find gnuplot in the current path.
However, the gnuplot software is not included with the SPOT software and must be installed
separately.
The current version of SPOT is 2.0, which is designed to work with Sun Studio 12. The previous
version of SPOT was 1.0, which was designed to work with Sun Studio 11.
Uninstalling the Software
To remove the SPOT software packages, type the following command as superuser:
# sudo pkgrm SPROcool SPROprfns
The following package is currently installed:
SPROcool
Cool Tools
(sparc) 12.0,REV=2007.06.19
Do you want to remove this package? [y,n,?,q] y
## Removing installed package instance <SPROcool>
This package contains scripts which will be executed with super-user
permission during the process of removing this package.
Do you want to continue with the removal of this package [y,n,?,q] y
## Verifying package dependencies.
8
Simple Performance Optimization Tool (SPOT) 2.0 User's Guide • June 2008 (Beta)
Support
## Processing package information.
## Executing preremove script.
## Removing pathnames in class <none>
....
The following package is currently installed:
SPROprfns
Sun Studio 12 Non-ship commands for Performance Analyzer
(sparc) 12.0,REV=2007.05.29
Do you want to remove this package? [y,n,?,q] y
## Removing installed package instance <SPROprfns>
This package contains scripts which will be executed with super-user
permission during the process of removing this package.
Do
##
##
##
##
you want to continue with the removal of this package [y,n,?,q] y
Verifying package dependencies.
Processing package information.
Executing preremove script.
Removing pathnames in class <none>
...
Removal of <SPROprfns> was successful.
Refer to the pkgrm(1M) man page for more information about uninstalling software packages.
Since the SPOT software is installed on top of the Sun Studio 12 compiler, uninstall the SPOT
software before uninstalling the Sun Studio 12 compiler software.
Note – Installing or uninstalling the SPOT software will not affect or interfere with any Sun
Studio 12 compiler software files.
Support
The SPOT software is not a supported Sun product, so there are no formal support
mechanisms. However, at the OpenSPARC forums, you can ask the user community questions
about the tools or intepreting the results of the tools, or provide suggestions for improvement.
The Cool Tools forum is located at:
http://forum.sun.com/forum.jspa?forumID=283
Because the OpenSPARC forums are user supported, there is no guarantee that every question
will be answered.
Chapter 1 • Introduction and Installation
9
10
2
C H A P T E R
2
Using the SPOT Software
This chapter covers how to compile a program to get the most information from the spot
command, and how to run the resulting application under the SPOT software.
Using the spot Command
You can run the spot command from either the directory where it is installed, or by adding the
installation directory (by default, /opt/SUNWspro/extra/bin) to your system’s $PATH
environmental variable.
There are two ways you can run the spot command:
■
spot can be given a command and arguments and will then gather data by executing that
command multiple times
■
spot can attach to an existing process and generate a report on that process.
The two command lines are:
■
To run the application multiple times and produce the report:
EXAMPLE 2–1
Command line to run application under spot
$ spot application parameters
Where application is the name of the application being investigated and parameters is the
application arguments.
■
To attach to a running process and produce the report for that process.
11
Example of Compiling and Running an Application Under SPOT
EXAMPLE 2–2
Command line to attach spot to a running process
$ spot -P pid
Where pid is the process ID number of the running application.
There are a number of command-line options:
■
The flag -X requests extended statistics. The SPOT report will include system wide
bandwidth consumption data and system wide trap statistics (if the user has the root
permission necessary to gather the information). It is recommended that a dedicated system
is used when gathering this data. The report will also profile the application on the top four
processor events, indicating where these events happen in the application.
■
The flag -d specifies a directory where the SPOT report should be placed. By default the spot
report is placed in the current directory.
■
The flag -o specifies the name that should be used for the sub-directory containing the
SPOT report. By default the directory is called spot_run followed by a unique number. The
-o and -d flags work together to specify the location and name of the subdirectory that
contains the SPOT report.
■
The flag -T is appropriate only when spot is attaching to a process. In this case it specifies
how long each tool should attach to the process. The default duration is 60 seconds of
sampling for each set of results.
■
The flag -h will print help information listing all the flags.
Each of the tools called by spot can be invoked stand-alone. If invoked stand-alone, the data
collected by these tools will not be in HTML format.
Example of Compiling and Running an Application Under
SPOT
The code shown in “Using the spot Command” on page 11 is a program which has three
routines, each of which targets a different kind of events:
12
■
The routine fp_routine does floating point computation on three 80MB arrays. The
routine will have floating point operations, and also (because of the size of the array)
significant amounts of memory traffic, which appears as read and write memory bandwidth
consumption.
■
The routine cache_miss is a test of memory latency. Each pointer chase in the key loop
brings in another cacheline. This results in lots of cache misses, and also a significant
amount of memory read bandwidth.
Simple Performance Optimization Tool (SPOT) 2.0 User's Guide • June 2008 (Beta)
Example of Compiling and Running an Application Under SPOT
■
The routine tlb_miss is identical to the routine cache_miss. The only difference is how the
routine is called. The reason for duplicating the code is to clearly show the location in the
code where the events are happening. This routine brings in a new TLB page on every
pointer chase in the key loop. So the routine encounters both cache and TLB misses.
EXAMPLE 2–3
Example Test Code
#include <stdio.h>
#include <stdlib.h>
void fp_routine(double *out, double *in1, double *in2,int n)
{
for (int i=0; i<n; i++) {out[i]=in1[i]+in2[i];}
}
int** cache_miss(int **array, int size, int step)
{
for (int i=0; i<size-step; i++){array[i]=(int*)&array[i+step];}
for (int i=size-step; i<size; i++)
{array[i]=(int*)&array[i-size+step];}
int ** cp=(int**)array[0];
for (int i=0; i<size*16; i++) {cp= (int**)*cp;}
return cp;
}
int** tlb_miss(int **array, int size, int step)
{
for (int i=0; i<size-step; i++){array[i]=(int*)&array[i+step];}
for (int i=size-step; i<size; i++)
{array[i]=(int*)&array[i-size+step];}
int ** cp=(int**)array[0];
for (int i=0; i<size*16; i++) {cp= (int**)*cp;}
return cp;
}
void main()
{
double * out, *in1, *in2;
int **array;
out=(double*) calloc(sizeof(double),10*1024*1024);
in1=(double*) calloc(sizeof(double),10*1024*1024);
in2=(double*) calloc(sizeof(double),10*1024*1024);
for (int rpt=0; rpt <100; rpt++)
fp_routine(out,in1,in2,10*1024*1024);
free(out);
free(in1);
free(in2);
Chapter 2 • Using the SPOT Software
13
Running an Application Under spot
EXAMPLE 2–3
Example Test Code
(Continued)
array=(int**)calloc(sizeof(int*),10*1024*1024);
cache_miss(array,10*1024*1024,64/sizeof(int*));
tlb_miss(array,10*1024*1024,8192/sizeof(int*));
free (array);
}
The program is compiled, using Sun Studio 12, in the following way:
$ cc -g -O -xbinopt=prepare -o test test.c
The key compiler flags are:
■
The flag -g generates debug information. This flag is recommended so that the tools are able
to attribute time and processor events back to the lines of source that cause them. For C++
programs, the flag -g will disable inlining of some routines. This can have significant
performance impact so it is better to use the flag -g0 which generates the debug information
without disabling this optimization.
■
The flag -xbinopt=prepare builds the applications with compiler annotations such that it
can later be instrumented to generate the counts of number of calls to routines and number
of times that each individual instruction was executed. This flag requires some level of
optimization to be enabled, hence the flag -O has been added in this example.
Running an Application Under spot
To get the most information from the spot run with the -X option. The downside of using this
option is that it takes longer to gather the data. If spot is run with root privileges, as well as the
-X option, it will also gather bandwidth utilization and trap data. The command line to run the
example application under spot is:.
$ spot -X test
SPOT will produce a subdirectory spot_run1 and several files in the current directory. One of
the files is spot_summary.html. To start examining SPOT’s output, view the content of
spot_summary.html in a browser. Subsequent spot runs in the current directory will produce
spot_run2, spot_run3, etc. and will add content to spot_summary.html.
14
Simple Performance Optimization Tool (SPOT) 2.0 User's Guide • June 2008 (Beta)
3
C H A P T E R
3
Understanding SPOT Reports
This chapter discusses the information that is reported by the SPOT software. This chapter
contains the following sections:
■
■
■
■
■
■
■
■
“The Architecture of the SPOT Software” on page 15
“Runtime System and Build Information” on page 17
“Processor Events” on page 19
“Instruction Frequency Data” on page 24
“System-Wide Bandwidth” on page 25
“System-Wide Trap Information” on page 28
“Profiling Where the Processor Events Occur” on page 31
“Time Based Profile of the Application” on page 33
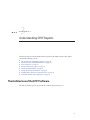
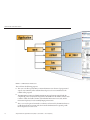
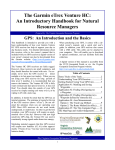
The Architecture of the SPOT Software
The major tools that spot uses to generate the results are shown in Figure 3–1.
15
The Architecture of the SPOT Software
FIGURE 3–1
SPOT Software Architecture
The tools have the following purposes:
16
■
The ripc tool collects performance counter information over the run of a program and
outputs a text summary of the stall time that each processor event contributed to the
runtime of the program.
■
The Binary Improvement Tool (BIT) instruments any application compiled with the
compiler flag -xbinopt=prepare and generates information on the number of times each
routine is called, the number of times each individual instruction is executed, and the
instruction frequency for each assembly language instruction.
■
The collect tool is part of Sun Studio 12 software, and it is used by the SPOT software to
profile the application over time and, when extended information is requested, profile
where the processor events occur.
Simple Performance Optimization Tool (SPOT) 2.0 User's Guide • June 2008 (Beta)
Runtime System and Build Information
■
The bw tool collects system-wide bandwidth utilization data, if it is possible for the target
platform, and under the current privileges.
■
The tool traps is a wrapper for trapstat (which is shipped as part of Solaris) which will
also only be able to collect data with sufficient privileges.
■
The tool er_html is a wrapper for the Sun Studio 12 tool er_print. er_html takes Sun
Studio Performance Analyzer experiments and generates a set of hyperlinked web pages
from them.
■
The tool spot_diff produces a report comparing multiple SPOT reports.
As mentioned previously, each of the tools invoked by SPOT can be invoked stand-alone. With
the exception of er_html amd spot_diff, the tools will not produce data in HTML format
when invoked stand-alone.
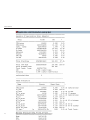
Runtime System and Build Information
The first thing that the spot command does is to record details of the system that was used to
run the code and also of how the code was compiled. This can help to reproduce the same
results at a later date.
Chapter 3 • Understanding SPOT Reports
17
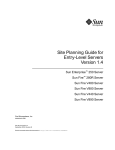
Runtime System and Build Information
FIGURE 3–2
SPOT System and Build Information Report
The results in Figure 3–2 came from a Sun FireTM V880 server with eight 900-MHz UltraSPARC®
III+ processors running the Solaris 9 Operating System.
The build information reports that the code was compiled with the flags -g -O and
-xbinopt=prepare.
18
Simple Performance Optimization Tool (SPOT) 2.0 User's Guide • June 2008 (Beta)
Processor Events
Processor Events
The ripc tool gathers information about what processor events were encountered during the
run of the application. The processor has event counters which are incremented either each
time an event occurs or each cycle during the duration of an event. Using these counters it is
possible to determine values for the cache miss rate, or the number of cycles lost due to cache
misses.
Chapter 3 • Understanding SPOT Reports
19
Processor Events
20
Simple Performance Optimization Tool (SPOT) 2.0 User's Guide • June 2008 (Beta)
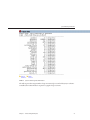
Processor Events
The output from ripc is a text table. However, it will also generate a graph file if it locates the
gnuplot software in the system’s path.
The output from the ripc tool contains several sections. The first section shows the percentage
of the total number of cycles lost to each type of processor event. The names of the processor
events are those that are used in the User’s Manual for the processor that spot software is
running on (these are available from
http://www.sun.com/processors/documentation.html). The events are different on
different processors. For example an UltraSPARC-III will share some processor events with an
UltraSPARC IV+, but other processor events will be different. An obvious example of this is
where the UltraSPARC IV+ has a third level of cache which is not present on previous
generations.
In this report for the example code shown in Figure 3–3, the time is lost due to Data Cache
misses, External Cache misses and Data TLB misses. Together these three types of events
account for nearly 98% of the execution count of the benchmark. The Data Cache miss time
represents time spent by load instructions which found their data in the External Cache. The
External Cache miss time is accumulated by load instructions where the data was not resident
in either the Data Cache or the External Cache, and had to be fetched from memory. The Data
TLB miss time is caused by memory accesses where the TLB mapping is not resident in the
on-chip TLB, and has to be fetched using a trap to the operating system.
Immediately following the reports of percent time spent in the various stall events is a section
which summarizes the efficiency of the entire run. The IPC is the number of instructions
executed per cycle. The Grouping IPC is an estimate of what the IPC would be if the processor
did not encounter any stall events.
After this section, there is a single line reporting the number of unfinished floating point traps.
These traps can occur in some exceptional circumstances on most UltraSPARC processors.
They can take a significant time to complete, and are also hard to observe in the profiles. Most of
the time this count should be zero, but if there are a large number of such events, it is definitely
worth investigating what is causing them.
Next, there is a section which reports the number of events that occurred as a proportion of the
total number of opportunities for the events to occur. For example, the number of cache misses
as a proportion of cache references.
The final numeric section is a report on the memory utilization for the application, and the user
and system time.
A final part of the report is a note which the SPOT software uses to select the performance
counters that should be profiled if more detail is required.
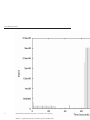
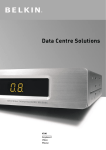
As mentioned earlier, the ripc tool will also produce a report of how the events occurred over
the entire runtime. In Figure 3–4, the number of TLB misses is shown over the run of the
application.
Chapter 3 • Understanding SPOT Reports
21
Processor Events
The tool ripc can also be invoked stand-alone, outside of spot. Type ripc -h to get a list of the
options, and consult the ripc man page for more details.
22
Simple Performance Optimization Tool (SPOT) 2.0 User's Guide • June 2008 (Beta)
Processor Events
Chapter 3 • Understanding SPOT Reports
23
Instruction Frequency Data
The three phases of the test application are clearly shown. There are few TLB misses in either of
the first two phases, but large numbers are shown during the execution of the final tlb_misses
routine.
Instruction Frequency Data
The Binary Improvement Tool (BIT) generates a report on the frequency with which different
assembly language instructions are used during the run of the application. This provides a more
detailed kind of instruction count.
The BIT software does not give information about the performance of the application, but it
does give information about what the application is doing. For example, the BIT software will
show how many floating point instructions are executed. There are a couple of terms used in the
BIT software’s output which are worth elaborating on.
■
Every branch instruction has a delay slot, which is the next instruction immediately
following the branch. This instruction gets executed together with the branch. The original
idea of having delay slots was to give the processor something to do whilst it was waiting for
new instructions from the target address of the branch.
■
It is possible for the branch to annul the instruction in the delay slot. This means that the
instruction is only performed if the branch is taken.
The report from the BIT software includes information on the number of instructions executed,
and of these instructions how many were located in delay slot and how many instructions were
annulled (not executed).
24
Simple Performance Optimization Tool (SPOT) 2.0 User's Guide • June 2008 (Beta)
System-Wide Bandwidth
FIGURE 3–5
Report from BIT Showing the Frequency of use of Assembly Language Instructions
Note – The BIT software works by running a modified version of the application. The modified
version contains instrumentation code which gathers counts data over the course of the run of
the application. For this to work, it is necessary for the application be compiled with the
compiler flag -xbinopt=prepare, and an optimisation level of -xO1 or higher.
Note – In this release the BIT software will not gather data on shared library calls made by the
application. More information on this topic can be found in the BIT User’s Guide and man page.
The tool BIT can also be invoked stand-alone, outside of spot. Type bit -h to get a list of the
options, and consult the BIT man page and the BIT User’s Guide for more details.
System-Wide Bandwidth
It is not possible to measure the bandwidth consumption of a single process, since one process
can read memory that is attached to processors running other processes. Hence the bandwidth
reported here is system wide. A consequence of this is that it is not possible to attribute the
Chapter 3 • Understanding SPOT Reports
25
System-Wide Bandwidth
memory activity to a single process if there are multiple processes running on the system.
Bandwidth data will be collected by SPOT if the -X flag is specified, and if SPOT has root
privileges.
The tool bw can be also be invoked stand-alone, outside of spot. Type bw -h to get a list of the
options, and consult the bw man page for more details.
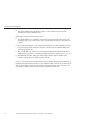
The average bandwidth consumption over the entire run of the test program is reported as
shown in the figure below:
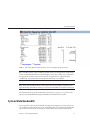
FIGURE 3–6
Average System-Wide Bandwidth Consumption
If the gnuplot software is installed, then this data will also plotted as a graph, as shown in
Figure 3–7.
26
Simple Performance Optimization Tool (SPOT) 2.0 User's Guide • June 2008 (Beta)
System-Wide Bandwidth
Chapter 3 • Understanding SPOT Reports
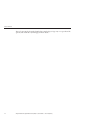
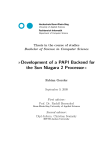
FIGURE 3–7
Graphic Showing the Read Memory Bandwidth Consumed Over an Application Run
27
System-Wide Trap Information
Figure 3–7 shows the read memory bandwidth consumed over the entire run of the application.
The routine fp_routine consumes the most bandwidth because it is three streams of data being
used by the processor. The other two routines use less bandwidth because they are pointer
chasing, and, therefore, more tests of memory latency.
System-Wide Trap Information
Trap data is provided by running the trapstat software for the duration of the run of the
application. However, trapstat is invoked to count system wide traps, not just the traps that
are due to this process, so it is not possible to distinguish traps generated by the target process
from those generated by other processes running on the machine.
SPOT will gather trap data when passed the -X flag. Trap data is only available if the user has
root privileges.
The tool traps is also available stand-alone, outside of spot. Type traps -h to get a list of the
options, and consult the traps man page for more details.
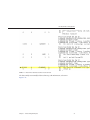
Figure 3–8 shows that the trap data is reported as a text summary.
28
Simple Performance Optimization Tool (SPOT) 2.0 User's Guide • June 2008 (Beta)
System-Wide Trap Information
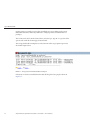
FIGURE 3–8
System-Wide Trap Data Information
The table reports the average number of traps encountered per second. If the gnuplot software
is installed, the results will also be reported as a graph of traps over time.
Chapter 3 • Understanding SPOT Reports
29
System-Wide Trap Information
30
Simple Performance Optimization Tool (SPOT) 2.0 User's Guide • June 2008 (Beta)
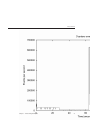
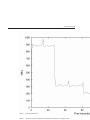
FIGURE 3–9
Graph Showing the System-Wide Traps Recorded Over Time
Profiling Where the Processor Events Occur
In the graph shown in Figure 3–9, the number of TLB traps is reported over the entire run of the
test application. As expected, the traps reported by trapstat correspond to the traps reported
by the performance counter on the processor.
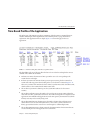
Profiling Where the Processor Events Occur
If extended information is requested by specifying the -X flag, then the SPOT software will
profile the application using the performance counters that contribute most stall time to the run
of the application. This generates several profiles of the application which indicate exactly
where in the code the events are occurring. Figure 3–10 shows the summary that is presented on
the SPOT report.
Chapter 3 • Understanding SPOT Reports
31
Profiling Where the Processor Events Occur
FIGURE 3–10
Application Hardware Counter Profile
Following the More hyperlinks on this page will take you to a more detailed display of source
code (if the application was compiled with -g and the source code is accessible) and disassembly
code.
From the results shown in Figure 3–10 it is apparent that the External Cache (EC) misses are
mainly attributed to the cache_miss and tlb_miss routines.
32
Simple Performance Optimization Tool (SPOT) 2.0 User's Guide • June 2008 (Beta)
Time Based Profile of the Application
Time Based Profile of the Application
The index page of the SPOT report shows a summary of which routines consumed the most
runtime. Following the More hyperlink below the summary leads to a page which allows
exploration of the application in more depth. Figure 3–11 shows this page for the test
application.
FIGURE 3–11
Profile Providing Data and Links to Specific Routines
The hyperlinks at the top of the page allow the data to be reordered according the the various
columns. The columns are as follows:
■
Exclusive user time is the amount of time spent in the user code corresponding to the
routine shown on the right.
■
Inclusive user time is the amount of time spent in a given routine, plus the routines that
routine calls. This is apparent when looking at the row for the main routine in Figure 3–11.
There is no exclusive time attributed to that routine, but it has 120 seconds of inclusive time,
which is all due to the routines that the main routine calls.
■
The exclusive system time column reports the system time attributed to the various
routines.
■
The exclusive wall time reports the number of seconds spent in a given routine. This is the
sum of the user time, system time, and various other wait and sleep times for single threaded
applications. For multithreaded applications it is the time spent by the master thread, which
in many cases may not be actively doing work.
■
The exclusive BIT function column reports the number of times that each function gets
called. This does not extend to library functions, so the routine _memset, which is in a
library, gets attributed with a count of zero even through it is called multiple times.
■
The exclusive BIT instruction column counts the dynamic number of instructions that are
executed during the run of the application for each routine.
Chapter 3 • Understanding SPOT Reports
33
Time Based Profile of the Application
■
The exclusive BIT instruction annulled count is a count of the instructions that were
annulled (not executed) during the run.
On the right of the page are links to the routines:
■
The trimmed link goes to a trimmed-down version of the disassembly of the routine. The
trimming is done so as to remove parts of the code which have no time or events attributed
to them.
■
The routine name link goes to the complete disassembly for the routine. This file can be very
large since many routines often share the same source file, hence the trimmed link is more
often the appropriate one.
■
The src link will lead to the source code for that particular function. This link will only be
available if the program was compiled with debug information (compiler options -g or -g0).
■
The final link is the caller-callee page which indicates which routines call which other
routines, and how the time is attributed between them.
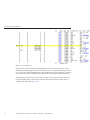
Figure 3–12 shows how time is attributed at the source code level. The line starting with ## and
highlighted in yellow indicates the line of source which has a high count for one of the events. In
this case it has a high count for user time and also dynamic instruction count. The source code
also includes compiler commentary about the two loops shown in the code.
34
Simple Performance Optimization Tool (SPOT) 2.0 User's Guide • June 2008 (Beta)
Time Based Profile of the Application
FIGURE 3–12
How Time is Attributed at the Source Code Level
The disassembly view normally holds much more specific information, as shown in
Figure 3–13.
Chapter 3 • Understanding SPOT Reports
35
Time Based Profile of the Application
FIGURE 3–13
Disassembly View
Again a hot line of disassembly is shown highlighted in yellow. The execution counts for the
individual assembly language instructions are also shown, so it is visible that the loop is entered
once, and iterated nearly 170 million times. The hyperlinks enable rapid navigation to either the
line of source that generated the disassembly instruction or the target of a branch instruction.
The final page generated is a page of the callers and callees of the various functions. Callers are
the functions that call a given routine, the callees are the functions that the routine calls. An
example of this is shown in Figure 3–14.
36
Simple Performance Optimization Tool (SPOT) 2.0 User's Guide • June 2008 (Beta)
Time Based Profile of the Application
FIGURE 3–14
Page Showing the Callers and Callees of Functions
The caller-callee information is quite complex to read. The routine of focus is indicated by an
asterisk. For example take the second section which is for the routine main. The routine main
has an asterisk on the left of it, meaning that it is the selected routine. There are two routines
above it _start and <Total>. <Total> is a synthetic metric representing the runtime of the
entire code. This information is interpreted as “the routine main gets called by the routine
_start”. Below the routine main there are four other routines; these routines are routines that
get called by main.
The first column is the attributed user time, which is the amount of time that can be attributed
to the selected routine. This is best explained by examining the main routine again. For the
routine _start there is about 120 seconds of user time attributed to the routine; this time is the
time that _start spends calling the routine of interest, in this case main. The attributed time for
the routine main is zero– which indicates that no time is actually spent in that routine. The
attributed time for the four routines below main will sum up to the 120 seconds.
The routine fp_routine shows a second example. In this case 27 seconds are spent by the
routine main calling fp_routine. However, all those 27 seconds are directly spent in the routine
fp_routine.
The hyperlinks in the caller-callee page allow navigation up and down the call graph, and also to
the disassembly code for the actual routines.
The profile data discussed in this section was collected with collect. The tool collect can also
be invoked stand-alone, outside of spot. The experiment data collected by collect can also be
examined by using analyzer or er_print. Experiment data collected by collect can also be
Chapter 3 • Understanding SPOT Reports
37
The spot_diff Report
converted to HTML format by using er_html as a stand-alone tool, outside of spot. See the man
pages for collect, analyzer, and er_print for more details on these tools. Also, type er_html
-h and consult the er_html man page for more information on using er_html.
The spot_diff Report
The script spot_diff is automatically run by SPOT after each new set of SPOT data is gathered.
This tool compares each new run with the preceding ones. The output from the spot_diff
script is the spot_diff.html file that is found in the directory where the experiments are being
recorded. The spot_diff.html file contains several tables that compare SPOT experiment data
in a tabular HTML format. Large differences are highlighted to alert the user to possible
performance problems.
It is also possible to call spot_diff from the command line for situations where greater control
over the particular experiments is required. An example of such a commandline is:
spot_diff -e <experiment1> -e <experiment2> -o <output_file>
The spot_diff man page, included in the CMT Developer Tools distribution, contains
complete usage information.
To explain spot_diff output, in this section we will examine a spot_diff.html file which was
automatically generated after running two Spot experiments based on the code in Example 2-3.
The first run was compiled with the Sun Studio 12 compiler with -xO2 optimization and the
second run used -fast. The output from the run with -xO2 optimisation was recorded in the
directory -O2_1, the output from the run with -fast optimisation was recorded in the directory
fast_1.
38
Simple Performance Optimization Tool (SPOT) 2.0 User's Guide • June 2008 (Beta)
The spot_diff Report
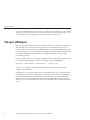
FIGURE 3–15
Summary of Key Experiment Metrics
The Summary of Key Metrics section compares several top-level metrics for the two
experiments. We see that by enabling higher compiler optimization both the runtime and
number of executed instructions decrease. It is also apparent that the total number of bytes read
and written to the bus are similar, but because the "-fast" experiment ran more quickly its bus
bandwidth is correspondingly higher.
Chapter 3 • Understanding SPOT Reports
39
The spot_diff Report
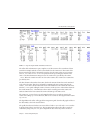
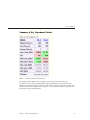
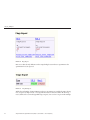
FIGURE 3–16
Summary of Top Stalls
The top causes for stalls are printed in two tables, one by percent execution time and the other
in absolute seconds. Depending on the application under observation or user preference, one or
the other may be more useful in identifying a performance problem. In the example used here it
may be more useful to look at the top stalls printed in seconds because the two runs are doing
the same work.
The table shows that the optimizations enabled by -fast significantly reduce the cache related
stalls but have little effect on the Data TLB stall time. We also see that Floating Point Use stalls
were nearly eliminated in the -fast run. By clicking on the column heading hyperlinks to go to
the individual SPOT experiments’ profiles it can be learned that:
1. Prefetch instructions are responsible for reducing the cache stalls
2. Better code scheduling eliminated back-to-back floating point operations which reduced
the Floating Point Use stalls
40
Simple Performance Optimization Tool (SPOT) 2.0 User's Guide • June 2008 (Beta)
The spot_diff Report
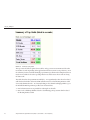
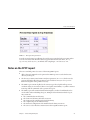
FIGURE 3–17
Bit Instruction Counts Report
The binary was compiled with -xbinopt=prepare, so SPOT was able to gather instruction
count data. The difference in instruction count between the binary compiled at -xO2 and at
-fast is mostly due to unrolling (and to a much lesser extent, inlining) done by the compiler at
-fast which greatly reduces the amount of branches and loop-related calculations. The
prefetch instructions that appear only with -fast optimization also appear in this table, and are
largely responsible for the better cache performance in the -fast experiment. Only instructions
that show both high variance between experiments and a high total count are printed in this
table. For example, both experiments have a large number of floating point loads which are not
listed in this table because the counts were largely the same in the two experiments. Detailed Bit
data can be seen by clicking down into the individual Spot experiments.
Chapter 3 • Understanding SPOT Reports
41
The spot_diff Report
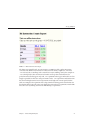
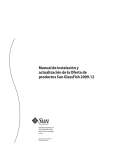
FIGURE 3–18
Flags Report
Here we see that the only difference in the compiler flags between the two experiments is the
optimization level, as expected.
FIGURE 3–19
Trap Rate Report
While the total number of Data TLB traps in the two experiments are roughly the same, the trap
rate, as reported, is higher in the -fast experiment because it runs in less time. All other trap
rates (which can be seen in the hyperlinked Spot reports) were too low to report in this example.
42
Simple Performance Optimization Tool (SPOT) 2.0 User's Guide • June 2008 (Beta)
Notes on the SPOT report
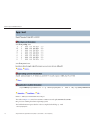
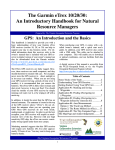
FIGURE 3–20
Time Spent in Top Functions
As in the section showing top Stall Data, these tables are presented in both percent time and in
seconds of execution time. In either table it is apparent that the functions cache_miss(),
fp_routine() and tlb_miss() are inlined when compiling at -fast but not at -xO2.
Notes on the SPOT report
There are some final points to be aware of when using SPOT reports.
■
All the data and commands used to generate the SPOT report are recorded in the same
directory as the report.
■
The directory contains a Performance Analyzer experiment (test.1.er) which is used to
generate the html profile. This experiment can be loaded into analyzer or er_print if
further investigation of the profile is necessary.
■
The SPOT report contains log files for the various stages. These log files will report error
conditions if they are encountered. There is one log file, named debug.log, which contains a
transcript of all the commands used to generate the report.
■
The SPOT report will contain information that might be considered confidential, and so
care should be taken in handling the report. Examples of the information that the report
may contain are:
■
■
■
■
■
■
The commands that ran the binary.
The location of the binary and where it was run.
The location of the compiler used to build the binary.
The compiler flags used to build the binary.
The name and configuration of the machine that the binary was run on.
The source code to files that contain routines where significant time is spent.
Chapter 3 • Understanding SPOT Reports
43
44