1
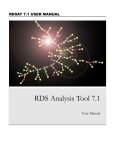
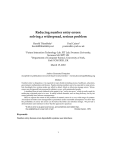
7
Statecharts
The last chapter drew diagrams for state machines, but as they got bigger they
quickly got messy. The more states and arrows there are, the worse it gets. A better
method, using statecharts, helps draw complicated state machines more easily and
more clearly.
⇤
A typical device will have an ⇥Off button and every state will need a transition
for that button to go to the off state. That requires as many arrows as there are
states, including the arrow to go from the off state to itself, as the off button usually
⇤
keeps a device off when it is already off. Yet ⇥Off is a simple enough idea. Can’t we
avoid all the visual clutter?
In contrast to a transition diagram, which shows every transition as an arrow, a
⇤
statechart is much easier to draw and visually much less cluttered. An ⇥Off button
would only need one or two arrows, depending on how the statechart is drawn,
regardless of how many states the device has. That’s a huge saving.
Statecharts have many other useful features too. Typical interactive devices become much easier to draw and to understand—as the diagrams are much simpler,
and they show many important properties of a design much more clearly.
Statecharts are quite complicated things in their full glory, so we shall only introduce the basic ideas here. Statecharts are a part of the Unified Modeling Language
(UML) which is widely used for program development.
7.1
Modes and state clusters
Our basic flashlight example has ways to be off—it might be switched off, it might
be missing its battery, or it might be missing its bulb—and lots of ways to be on but
not necessarily alight. We often want to collect a lot of states together and ignore
the details, like exactly how something can be on or off. Clusters do this simply
by drawing a single “state,” or cluster of states, as a rectangle.
On
On
Off
Off
201
Chapter 7 Statecharts
In this book, I’ve drawn most rectangles with rounded corners, because I think
they look nicer—though some people use square and rounded corners to mean
different things.
We can define modes in terms of statecharts. If we can (correctly!) draw an arrow for an action from a cluster of states, then those states represent a single mode
for that action. In the diagram above, whatever happens inside the state cluster
⇤
called “on” represents a single mode for the ⇥Off action, because the statechart is
⇤
saying that whatever state inside On the device is in, ⇥Off always does the same
thing—in this case, it takes the device to the Off state from any state inside the
cluster called On.
This is why modes are a useful concept: they allow us to talk about a cluster
of states—possibly a huge cluster of states—ignoring every detail of what goes on
inside that cluster. What’s important for a mode is that an action (here, “off”) has
a consistent effect for all the states.
7.2
Statechart features
Statecharts use drawing conventions like clusters and are a very powerful way to
represent real interactive devices. Since statecharts are “just a drawing notation”
many versions of statecharts have evolved, not all compatible—and you need to
be careful if you are doing a rigorous design in case the statechart notation you are
using has conventions that are not made clear. We’ll only use the most basic, core
features of statecharts, which are universally recognized.
7.2.1
Clusters
Let’s consider details in the flashlight’s On state cluster. Inside this rectangle we
probably want to show how the bulb can go dud and how we are able to replace
the bulb:
On
On
Off
On
OK
On
dud
Off
But this diagram breaks one of our original diagramming rules: the inside of the
cluster is a state machine diagram, but we have not marked the default state. So,
⇤
from this diagram we do not know what happens when we try the action ⇥On when
the flashlight is off. It could go to On/OK or to On/dud, but we have not shown
which.
⇤
There are two ways to solve the problem. We either make the ⇥On arrow point
directly to the On/OK state, or we use a default arrow inside the cluster.
202
7.2. Statechart features
Next, we can use clustering to provide further information, making a multilevel
statechart. Here we provide the default arrow and we indicate that the flashlight
can be on or with a nonworking bulb in several different ways. For example, the
bulb may be a dud or it may be missing.
On
On
Off
On
OK
On
dud
Off
7.2.2
And-states
Actually, for our flashlight, the inside of the Off cluster is going to be exactly the
same as the inside of the On cluster. The bulb can be OK or dud, whether the
flashlight is switched on or off, and we can replace the bulb regardless of whether
it’s on or off. In fact, we can try to switch it on or off regardless of the state of the
bulb. Statecharts can represent this “repetition” much better by using and-states.
In all the state diagrams we have drawn so far, the machine (like the flashlight)
is in exactly one state on the diagram, and this is represented by it being in exactly one circle (or cluster). This is rather like having a single coin that follows
arrows around the diagram—as the user performs actions. Where the coin is at
any moment indicates what state (or state cluster) the device is in.
A state cluster divided by a dotted line means that the actions on both sides of
the line can happen independently. It is in the states on one side of the line and in
the states on the other side; hence the name.
We can now use more than one coin, and each coin will be in different states on
different sides of the line. In theory, the machine will only be in one state since
we are just using the two or more coins as a convenient way to keep track of the
“real” single coin that we would have used if we had drawn all the states explicitly
without and-states. In reality, it will be easier to program the device with as many
“coins” as are necessary, and the program will be closer to a statechart than to a
conventional state diagram.
The flashlight can be switched on and be OK, on with a dud bulb, off and OK,
or off with a dud. That’s why we need and-states. If we kept track of each combination in the usual way, we would need four states and one coin to be in any
one of them. Using and-states, we represent the components separately, each as
independent state machines. One state diagram therefore represents on or off; the
other, dud or OK. If we keep track of the overall state using coins in states, now
we would need two coins, one for each statechart on each side of the dashed line.
The statechart in figure 7.1 (p. 204) doesn’t really need the default arrow at the
top: there is, after all, only one cluster of states the device could possibly start in,
namely, the one the default arrow points to. I put the default arrow in just to make
the point that if there is only one default state, it does not need pointing out: the
203
Chapter 7 Statecharts
On
OK
Off
Dud
Figure 7.1: And-states for a flashlight. The flashlight can be in four states: on and
OK, off and OK, on and dud, and off and dud. Its initial state is on and OK.
point of statechart conventions is to represent state machines as simply and clearly
as possible without loss of meaning. Even so, the diagram is still simplified: selfarrows are missing, the arrows that go from a state to itself, representing user
actions that don’t change the state.
Notice that we eliminated four arrows (although we’ve drawn two default arrows). Unfortunately, for persuading how effective and-states are in simplifying
statechart diagrams, we don’t seem to have achieved much: there are still four
states, and now there is a dashed line. It hasn’t achieved much is because, coincidentally, 2 ⇥ 2 = 4 and 2 + 2 = 4.
Represented normally, as an ordinary state transition diagram, we need another
circle in the state diagram for every state. But when it is represented as and-states
in a statechart, the drawing multiplies up to the required number of states, and
we don’t need to draw so much. As the number of states in the device goes up,
the difference between sums and products gets more significant and statecharts
become more and more convenient. For example, whereas 2 + 2 = 2 ⇥ 2, if we
needed three pairs of and-states rather than two, then 2 + 2 + 2 = 6, which is
smaller than 2 ⇥ 2 ⇥ 2 = 8. For three pairs, the statechart would be a clearer
drawing.
Furthermore, and-states make sense and are easy to use. If we wanted to draw a
diagram of a flashlight that could also buzz, we would need twice as many states
(every original state becomes two states, what it used to do without buzzing, and
what it used to do and buzzing); but with and-states, rather than doubling the size
of the diagram to cope with this extra feature, we need only add two more states
to the statechart drawing (to buzz or not to buzz).
Let’s add another feature to see how things get better and better as the device
gets more complex. What if the flashlight could be blinking or not? With andstates, we need only add two more circles to the statechart diagram: to represent
blinking and not blinking. With a conventional approach, without and-states, we
204
7.2. Statechart features
would need to double the size of the diagram again. The comparison now is between 2 + 2 + 2 + 2 = 8 for statecharts versus 2 ⇥ 2 ⇥ 2 ⇥ 2 = 16 for conventional
diagrams. The advantage is even better when there are more states in each of the
and-states. In our example, we’ve only had two states in each component. If we’d
had three states (say, for off/dim/on rather than off/on, and so on), then the sums
would work out as 3 + 3 + 3 + 3 = 12 versus 3 ⇥ 3 ⇥ 3 ⇥ 3 = 81.
In summary, and-states allow us to draw simpler diagrams, and the benefits of
using and-states get better and better as the devices get more complex. The only
problem is—for this book—that when we draw simple devices that we can easily
understand, the advantages don’t look very impressive.
7.2.3
History connectors
In the and-state diagram for the flashlight, we used default arrows to indicate
which states the device starts off in. To be pedantic, the flashlight won’t always
start off with an OK bulb. For instance, if we blew the bulb last time we used it
and it is now a dud, the next time we use the flashlight it should default to being
dud, not being OK, as the last statechart diagram suggests it would do.
Often, then, we want to say “be in the same state as last time” rather than to
identify some state as being always the default. To do this, we use history entrances:
H
H
On
OK
Off
Dud
The history arrows, rather like the default arrows but with little H annotations,
mean that next time the machine comes to these clusters of states (there are two
clusters in this diagram, one on each side of the dotted line), go to the last state in
each cluster the machine was in. In general, the history entrance is a very powerful
and common feature of statecharts.
Playing with coins allows us to explain history entrances another way. When
there is an action taking the machine out of a cluster of states, we might have
to pick some coins up. If a cluster of states has a history entrance, we need to
remember what state it was in when we came out of it. Simple: just leave the
coins where they were, so that next time we know what state it was in. Somehow,
though, we need to note that these coins are inactive: that is, they represent not the
state now but the state the system will be in when it returns to this cluster. Perhaps
we could indicate this by showing the coins as either heads or tails. The current
state of the machine can be shown by a coin showing heads (more than one coin
in and-states), and the historical states can be shown by coins showing tails.
205
Chapter 7 Statecharts
Here is a statechart for simple TV with four channels and an operate button:
H
Channel
1
Channel
2
Channel
4
Channel
3
Off
The statechart seems to show a TV with two buttons: one button switches it on
and off, and the other button changes the channel. The history connector tells us
that the TV will remember which channel it was on when it is switched off; when
it is switched on again, it returns to the last channel the that was watched.
7.2.4
Deep history connectors
Sometimes we do not want to show all the details of a set of states, so we use a
cluster. If we do this, then the history connector may not say the “right thing.”
Here’s an example:
H
Off
Change channels
The problem is that although the history arrow correctly enters the cluster of states
“change channels” it doesn’t say which channel inside the cluster should be selected. The problem could be fixed by the change channels cluster having its own
history arrow, but that would mean we end up saying history twice. What we
want to do, rather, is say clearly that the history arrow reaches deeply into the
nested cluster.
206
7.2. Statechart features
A history arrow is just an H, but a deep history arrow is an H with a star on it:
H*
Change channels
Off
7.2.5
Leaving clusters
Whatever channel the TV is showing, we can always switch it off, for there is an
arrow from the cluster to Off, which is a statechart shortcut to save us drawing
individual arrows from all of the cluster’s states.
Suppose we have an idiosyncratic TV that for some reason can only be switched
off when we are watching Channel 4. This would be represented by an arrow
directly from the relevant state inside the cluster. The statechart clearly shows the
special treatment of the Channel 4 state.
H
Channel
1
Channel
2
Channel
4
Channel
3
Off
7.2.6
Delays and timeouts
Sometimes actions have no effect until after a delay, and sometimes actions can
happen “all by themselves” after a delay. In a statechart, it is usually best to write
out delays in full so there is no confusion.
207
Chapter 7 Statecharts
Box 7.1 Computer demonstrations at exhibitions A common wooden printing press, several
hundred years old, and a bookbinder’s workshop are part of a permanent exhibition in the
British Library. They are used for working demonstrations of the old arts of printing and
book making. The working book press is of a type more-or-less unchanged since Gutenberg’s
time. In the corner of the room, for the last year or so, sit some sad large computer screens.
A notice apologizes for the “temporary inconvenience” of the computers being out of order.
I don’t know what the computers would contribute to the exhibition, because I’ve never seen
them working. Isn’t this a good example of inappropriate technology, which is (particularly
now that it has broken down in some way) completely beyond the abilities of its users
to operate? Somebody installed the computers at great expense and forgot about their
unreliability and the need for ongoing support, which the British Library is evidently unable
or perhaps unwilling to provide.
When I checked up for writing this box, there were two notices: “This interactive [sic]
is temporarily out of order,” and “The printer is temporarily out of order.” So things have
become worse!
For example, if an action occurs after doing nothing inside a cluster for 10 seconds, we might write this:
Interesting
cluster
10 second timeout
When space is at a premium, I sometimes use my own convention. A scribble on
an arrow reminds me an arrow is special, rather than one representing an ordinary
user action. It takes up less space:
Timeouts should be thought through carefully as they can be confusing for the
user. You, as designer, may like a device to be “always” in a standby state ready
for the user, even if the user was recently partway through some sequence before getting distracted from finishing. Timeouts are one way to do this: if a user
does nothing, the system can reset itself somehow. Unfortunately, the user may be
doing something—the device can’t know.
Perhaps the user is reading the user manual, trying hard to understand what is
going on. Now, after a timeout, the user is even worse off, as the device isn’t even
doing what they thought it was doing! Or if it is a walk-up-and-use ticket machine,
maybe the user has selected their ticket, and is fumbling for suitable coins to pay.
Perhaps they have dropped a coin on the ground. Returning to the ticket machine
to buy the ticket, the user finds that it has reset—its designer has made it ready for
the next customer—the machine has lost all knowledge of the ticket the user was
about to buy. In most cases, a device ought to use a motion or proximity sensor,
rather than a timeout.
208
7.2. Statechart features
7.2.7
Conditions
Sometimes actions can only occur when certain conditions hold true, for example,
if our flashlight had two batteries, perhaps we can only remove the second after
removing the first. As drawn below, the and-states give the impression that we
can do actions on either side of the dotted line, but we’ve noticed that we cannot
remove battery 2 unless battery 1 is already out.
Remove 1
Remove 2
(Battery 1 out)
Of course, this particular state machine, with the battery removal order conditions, could also have been drawn more directly as follows:
Remove 1
Remove 2
In this last diagram, we don’t need the condition to be explicit: the Remove 2 action is only possible if we have already reached the state after removing battery 1.
In fact we can always get rid of conditions by adding more states explicitly, as in
this last diagram. Usually, conditions represent some far more complex arrangement of states and it is not so easy to do.
A basic alarm clock was introduced in section 6.5 (p. 191), and we saw how
messy its ordinary state transition diagram became.
Here is one way to represent some of the important states of an alarm clock
without showing millions of states:
.
H*
Time!
Silent
Snooze
Wait 5 ticks
Ringing
Tick
This deceptively simple statechart conceals a lot of sophistication—in fact, we’ll
shortly see that it isn’t quite right.
Three user actions are shown in the middle of the statechart. If the alarm is set,
and the time becomes equal to the alarm time, the clock changes to ringing. If the
209
Chapter 7 Statecharts
alarm is in any ringing state, the user can press the snooze button to silence it, or
after five ticks the alarm silences itself.
The alarm clock has tick actions. The statechart does not say that the ticks occur every minute, but we can see that nothing inside the clock can ignore ticks:
whatever the clock is doing, when a tick happens, the tick action occurs and we
go back inside the cluster. Because we’ve used an H* arrow, this means that after
every tick the alarm goes back to the last state. But we want ticks to take us to the
next state—otherwise the clock won’t work. Oops.
It would be clearer not to show the tick action at all. Given that the statechart
represents millions of states and all their transitions hidden inside the two clusters,
it is not surprising that it cannot describe the alarm clock’s behavior completely
accurately. Nevertheless, the simple statechart does show some important features
of the alarm clock visually. It could be used as part of the design process of an
alarm clock. Certainly the diagram allows us to talk about what we want more
easily than almost any other visual representation. As we talk about the design, we
see ways to improve the design—or we see ways to make the statechart diagram
reflect more accurately what we thought we wanted.
7.2.8
Joining, merging, and splitting connectors
Joining and merging arrows is occasionally needed, generally with and-states.
Joints and merges don’t change the meaning of anything, as and-states and history connectors do, they just make statecharts look less cluttered.
It may be necessary to show that different and-states are entered after a single
action. If so, the action arrow splits and goes to each state separately.
Arrows can merge as well. The main use of this feature is to get rid of clutter
from statechart diagrams—sometimes a single state with lots of arrows going to it
looks very messy.
7.3
A worked example: a Sony TV
A TV and its remote control are a good example of a device with two ways of
controlling it. The buttons on a TV and the buttons on its remote control together
form a single interactive device, even though they are physically independent. A
statechart can represent such a combined system very easily using and-states.
210
7.3. A worked example: a Sony TV
H
Off
8
1
3
7
Standby
2
6
5
Sound
Timeout
4
Vision
Figure 7.2: An outline statechart for the Sony KV-M1421U TV.
And-states directly represent the combined systems, TV and remote control,
which the user can operate independently.
TV
Remote
control
Strictly speaking, we should use some further features of statecharts to synchronize the two sides of this statechart, because states in different parts of the statechart are the same. Using the remote control affects the TV, just as using the TV
affects the remote control: for example, changing the channel on either changes
the exact meaning of “increase channel” on the other. In this book, we haven’t
worried about the advanced features of statecharts that can handle this interaction. Instead, if such a (simplified) statechart is drawn with the details of the two
clusters filled in, the natural question to ask would be: “why aren’t the two parts
of the statechart the same?” They needn’t be exactly the same—for instance, the
remote won’t be able to physically switch the device off—but major differences
need careful justification.
We now return to the Sony television we first saw in figure 3.2 (p. 64). The Sony
TV and remote control are different, and their two statecharts are very different,
although the page size for this books makes them too awkward to draw as a single
statechart. (Figure 3.2 was too small to see much detail.)
The television itself has very few buttons, and has a simple statechart, shown
readably in figure 7.2 (p. 211). This statechart still does not show all the details;
TVs, in any case, are familiar devices, and I don’t need to clutter the diagram with
211
Chapter 7 Statecharts
H
Off
8
1
3
7
Standby
6
2
5
4
Sound
Watch
Vision
Figure 7.3: A more faithful statechart for the Sony KV-M1421U TV, using and-states.
obvious issues, like the button names, details of changing sound levels (which, at
this level of detail, would just be self-arrows around the sound state), and so on.
The TV can be off, in standby, or switched on. There is a single button,
, that
switches the TV on or off, depending on whether it is off or on; thus arrows that
we might have been tempted to label simply On or Off, are more correctly labeled
On/Off, since they are associated with a single button.
When the TV is on, you can watch a TV channel, adjust the volume, or adjust
the vision properties (contrast, brightness, color). Although the TV can evidently
be put in standby, it isn’t possible to get it into this state without using the remote
control. However, if the TV is in standby, pressing a channel-change button makes
it on, whether you use the TV or remote control to change channel.
The numbers 1 to 8 in the statechart mean the TV channel selected. The TV
shows the numbers on the screen for a few seconds: it would be distracting if 8,
say, was shown indefinitely. We could add an and-state with a timeout to say
when the TV channel number is actually showing.
An interesting user problem can be seen in the statechart: the TV has a class of
states shown in the cluster at the right of the statechart that are exited by doing
nothing until the timeout takes effect. If the user tries to get out—by pressing
buttons—this would reset the timer. So if you think you must press a button to get
back to the normal watching-TV mode, you will be stuck until you give up!
The statechart in figure 7.2 is not quite correct. When we use the TV, we find
that we can still watch a program while adjusting either the sound or vision settings. In other words, watching a TV channel and adjusting are not mutually
exclusive states, as the statechart indicates. In fact, we should be using and-states,
because you can watch a channel and adjust settings, as shown more accurately in
figure 7.3.
Notice the mixed use of default arrows and history arrows. When we switch
the TV on or take it from standby, it will return to the last TV channel we were
watching—that’s the history arrow in the top part of the cluster doing its work; but
212
7.3. A worked example: a Sony TV
H*
Standby
Channel
selected
Normal
teletext
Display
nn
Large
top
Display
n
Large
bottom
Teletext
only
Teletext on
programme
Teletext
showing
One digit
showing
Searching
Two
digits
Normal
viewing
Off
30 minute
timer
60 minute
timer
90 minute
timer
H*
Sound
off
Sound
on
Channels
1–8
Channels
9–59
Clock
off
H*
Clock
on
Figure 7.4: A statechart for the RM-694 control of the Sony KV-M1421U TV.
when we switch it on, it will always be in the watching mode, not adjusting sound
or screen properties—that’s the default arrow in the bottom part of the cluster
doing its work.
The remote control for the Sony TV has a more complicated statechart, which
is shown in figure 7.4 (p. 213). The statechart is much more complex than the TV
itself—this was the main point made in section 3.2 (p. 63)—but let’s now consider
a few details from it.
From the statechart, we can see the TV as controlled by the remote can be off,
in standby, watching a TV channel, or using teletext. Because of the deep history
on the standby state, we can see that switching the TV on will take it to whichever
was its last mode before it was switched off.
The clock is a simple subsystem we can look at first, with two state clusters,
⇤
as shown in figure 7.5 (p. 214). The clock begins by being off, and the same ⇥Clock
button is used to switch it on or off. We haven’t shown the 1, 440 states inside the
clock needed when it is on!
The details of the rest of the remote control statechart aren’t too interesting, un213
Chapter 7 Statecharts
Clock
off
Clock
Clock
Clock
on
Figure 7.5: The simple clock subsystem, extracted from the remote control statechart.
Channel
selected
Display
nn
Display
n
Figure 7.6: Selecting channels by pressing digits. Another extract from the remote
control statechart, but rotated from figure 7.4 so that it takes up less space.
less you like comparing details of TVs. I have to admit I’ve lost my remote control,
but it allowed me to press digits to select a channel numerically—I wish I could
double-check the details. This is represented in another part of the statechart, as
redrawn in figure 7.6 (p. 214).
This is a different subsystem from the channels 1–8 and 9–59 cluster (shown
⇤
⇤
in the bottom right): because that cluster uses ⇥+ and ⇥ to change the range of
channels, something that digits alone can’t do.
7.4
Statecharts for discussion
It is great fun to retrospectively work out the statechart of a simple gadget you
own, such as a table lamp or an electric kettle. When you’ve done one or two,
try something more sophisticated, like a DVD player. It’s much harder than you
think, even if you work carefully from the user manual. The user manual and
the gadget rarely correspond exactly! In fact one thing you learn is that criticizing
user interfaces would be a lot easier if the manufacturers told us exactly what
they had made. I guess they don’t write accurate manuals because even they do
not know—probably because they do not use statecharts or any other formalized
design process.
It is interesting to work out a clear statechart for the remote control of a gadget
and compare it with the gadget itself. Your car radio or sound system, especially
214
7.5. There is no right statechart
if it has a remote control, would be a good case study. How are you supposed to
use the remote control under pressure while driving?
7.5
There is no right statechart
There is no one right way to draw a statechart. The same functionality can be represented in many ways, and you may even want to have several different statecharts for the same device, each emphasizing a different aspect of the design. The
best use of a statechart is to help you think about design, to help you develop the
design that you, the users, or other people in the process really want. Sketch out
a statechart that you know is not quite right, and people can easily contribute to
improving it. Go to a design meeting with a “perfect” statechart, however, and
you won’t want to revise your hard work, and probably nobody will really understand what it already says in its refined, detailed way. They’ll be less interested in
talking about what it ought to say.
Here’s a very simple system that has no correct statechart. Imagine a device
with two buttons, one switches on and off a green light, the other switches on and
off a red light. That’s easy to represent as a statechart. Now consider that there
is a third light, yellow, which comes on when both red and green are on. This is
now a device that is hard to represent with a statechart, because the red, green,
and yellow conditions overlap in ways that statecharts do not allow to be drawn.
You have to decide which two colors to represent or not to use any statechart
clustering to show all the colors clearly. If such a simple, albeit artificial, system
has problems, imagine how bigger systems with more complexity become harder
to represent faithfully.
To illustrate how effective “incorrect” statecharts can be, we’ll discuss an erroneous statechart and see what sort of design questions get clarified. Let’s imagine
that we’re starting a meeting and a complete statechart has been displayed, say by
using a digital projector to show it on the wall. Everyone is sitting in the room,
apart from you who is near the screen; and you are trying to explain the new operation of a planned small TV. Here’s your first slide:
Up
Off
Channel
1
Channel
2
Channel
4
Channel
3
Volume
Standby
Down
215
Chapter 7 Statecharts
I’m sure somebody will comment positively that it is nice how all the arrows go
round clockwise. In fact, the state names and arrows were chosen to go clockwise
when they are increasing things—this is a nice consistency.
Since there isn’t a history connection, we can’t see from this statechart that when
the TV is switched from standby or off back to being on (that is, in any state in the
large cluster), that the TV remembers its last sound level setting. Likewise, we’ve
forgotten to have an initial state for the channel—the statechart does not specify
what channel the TV is going to be on ever.
Somebody will point out that surely if the TV is in standby, you ought to be
able to switch it off directly. As it is drawn at the moment, if the TV is in standby,
to turn it off, you would have to switch it on first! There is no arrow going from
standby to off.
How many volume levels are there? The statechart doesn’t tell us. Can we
mute the sound? Well, not yet anyway. Surely we ought to be able to change from
channel 2 to channel 1? As the statechart is now, we can only cycle through the TV
channels, 1, 2, 3, 4 and back to 1. A user overshooting to 4 would have to go all the
way around again, rather than going back directly from 4.
Here’s an improved statechart. All the changes we’ve discussed can be drawn
into the original statechart with minimal alterations.
H
Up
Off
H*
Channel
1
Channel
2
Channel
4
Channel
3
Volume
Standby
Down
Other features
like mute, etc
We’ve cheated a bit by not giving details of the mute feature, but at least the
statechart now mentions it. We’ve fixed the default TV channel—now when the
TV is switched on (whether from off or from standby), it will continue with the
last channel used, thanks to the history arrow. We’ve added a new arrow from
standby to off, so now that the TV can be switched off in one step—say by pressing
⇤
the ⇥On/off button.
It’s misleading that the off state has two arrows going to it when they are both
the same user action. We should redraw the statechart so that only one arrow is
required for each action. This will make the statechart clearer but won’t alter its
meaning. The default entry for the on cluster ensures switching the TV on from off
216
7.6. Where did statecharts come from?
still works the same way as before—when you switch the TV on it always comes
on, rather than going into standby.
H
Up
Off
Standby
H*
Channel
1
Channel
2
Channel
4
Channel
3
Volume
Down
Other features
like mute, etc
You can always make statecharts easier to read by removing detail from clusters. Of course, you can draw the detail of the clusters somewhere else, on another page, so the detail can still be seen, without the distraction of the rest of
the diagram. In the last statechart, above, we’re probably assuming that there is a
separate statechart giving more details for features like mute.
7.6
Where did statecharts come from?
David Harel, who invented statecharts, wanted a better visual representation for
reactive systems. Reactive systems are systems that react to their environment;
finite state machines are one of the simplest sorts of reactive system. As we know,
reactive systems often get so large that representing them in the obvious way as
transition diagrams gets completely out of hand for all but the simplest cases.
Most interactive systems are therefore designed in ways that avoid the mess
of transition diagrams by using general purpose programming languages such
as Java. In safety-critical areas, just programming is too risky; instead, formal
languages are used (such as CSP or SMV), and then the designers can prove that
their programs, and ultimately the devices they build, perform as required.
Unfortunately, if you use programming languages of any sort, you lose the opportunity to visualize what the system is doing. Statecharts let designers visualize
much more than the transition diagram can show, without getting unwieldy. They
combine several visual formalizations into one effective whole:
Ordinary transition diagrams have arrows that connect single states; the states
in a transition diagram have no other relation with one another than the
217
Chapter 7 Statecharts
WWW.PDRONLINE.CO.UK
Figure 7.7: Prototyping a TV remote control. This prototype is fully functional, but is
made of dense foam with buttons that can be pushed in anywhere as different designs
are tested—the photograph shows a button being placed by the designer. Electrical
connections inside the foam provide power for the buttons, which enable RFID tags
when pushed. The remote control then behaves like an ordinary Bluetooth keyboard
to control the simulator program, which displays the image shown in the background.
No external wires are needed, which would otherwise hamper evaluation studies.
arrows that connect them. Yet many states are conceptually related into sets,
such as the set of “all states that are on.” Statecharts add sets to the notation.
Like hypergraphs, statecharts can have arrows between sets of states.
Like Venn diagrams, statecharts allow drawing sets of states inside each other
to show set inclusion. The set of all states that are on includes two sets: the set
of states where the device is on and, say, the CD is in, and the set of states
where the device is on and there is no CD in it. Venn diagrams allow these
relationships to be drawn naturally. Statecharts are tree structured, so unlike
full Venn diagrams, they do not allow overlapping sets of states—that’s why
the red/yellow/green light example given earlier was a problem.
Many reactive systems have independent subsystems; if these are represented
as finite state machines, you need a big machine that has as many states as the
product of the two subsystems. (In fact, the system is the cross-product of the
subsystems.) This can get out of hand very quickly! For example, three on/off
light switches require a finite state machine of 2 ⇥ 2 ⇥ 2 = 8 states. Statecharts
use dashed lines to separate independent subsystems and thus avoid the
multiplication of states. Three on/off light switches thus only take
2 + 2 + 2 = 6 states to visualize.
Statecharts have a variety of conventions to reduce the clutter of arrows.
Default arrows, for instance, mean that you don’t need long arrows reaching
long distances inside sets of states.
218
7.7. XML and the future of statecharts
In summary, graphs and hypergraphs show relations (visualized by arrows)
among states and sets of states; Venn diagrams show structural relations between
collections of sets (visualized by overlap and containment of shapes, usually circles, overlapping or inside other shapes); and statecharts combine both representations.
Full statecharts add a few more features that we have not used in this book,
such as broadcast communication. In our use of statecharts, each action has been
written on an arrow, and it causes a transition along that arrow. We didn’t mention
it, but if the same action is on several arrows, all of them work. This is obvious;
for example the off transition might leave many sets of states in a cluster simultaneously. Generalizing this “broadcast” nature of actions, Harel allows any action
to trigger more actions. In effect, arrows are labeled like x/y
! which means, “do
this transition when x occurs and behave as if the action y occurs immediately
afterward, that is, broadcast y to the rest of the statechart.”
The actions in full statecharts can also have arbitrary conditions. For example,
y[in X ] means only do transition y when some other part of the statechart is in the
set of states X.
.
7.7
It’s interesting that statecharts combine graphs and Venn diagrams, for both of
these ideas go back to one man, Leonhard Euler, the hero of the opening
stories of chapter 8, “Graphs.”
XML and the future of statecharts
This chapter has introduced statecharts as a visual notation, one that is better than
transition diagrams alone. But statecharts are also a conceptual notation; they structure state machines in a way that makes them easier to conceptualize. There is no
need for a statechart to be a drawing. Indeed the World Wide Web Consortium
(W3C) is currently defining a statechart XML notation, which will be entirely textual.
HTML is perhaps more familiar than XML. HTML, hypertext markup language,
is based on using matched pairs of tags to control formatting documents. For
example, <b> to </b> will put the enclosed text into bold. XML works the same
way, except that the tag names can be chosen freely and used for any purpose, not
just for textual formatting. Thus XML has become a very popular form of data
representation: it is flexible, easy to read, and has many tools that support its use
(and it is cross-platform, and has lots of other benefits too, not least that it, despite
all its shortcomings, is a very widely accepted standard).
An advantage of using XML is that there are many systems that can process it,
and one can therefore define an interactive device and expect to be able to get it to
work or be analyzed fairly easily.
VoiceXML and Voice Browser Call Control (CCXML) are variations on XML
that allow voice-based interactive systems to be specified. You can thus define a
statechart and get it to run a telephone voice menu system, for example.
219
Chapter 7 Statecharts
SCXML is a statechart version of XML. In SCXML, state is defined using <state
id=name > tags. For example,
<state id="1">
<!-- this is a comment in XML -->
<!-- state 1 has a transition to state 2, defined on the next line -->
<transition next="2">
</state>
defines a state with a single transition to another state. Note how comments can be
used to help you keep track of what you intend an XML specification to be doing.
A cluster of states can be defined naturally, simply by defining them inside a
state:
<state id="1">
<initial transition target="A"/>
<state id="A"> ... </state>
<state id="B"> ... </state>
</state>
makes state 1 a cluster containing two states, A and B, with A being the initial
default state. And-states are defined by putting them between <parallel> and
</parallel> tags in much the same way.
Obviously there are many more details to SCXML than we need to cover here.
For instance, to get it to work, the SCXML needs wrapping up in the usual XML
name spaces and other tags.
In the future, then, statecharts will be used for drawing and thinking about parts
of interactive systems, but the full details probably won’t be shown, or certainly
they won’t be shown all the time. Actually seeing all of a device’s specification,
even using statecharts, can be overwhelming: given a written statechart (probably
in SCXML), we can extract simpler statecharts to visualize whatever bits of a design we are interested in and want to think about, but we won’t have to see all of
the design at once, unless we want to. We can still use statecharts for conceptualizing, building, and designing—but with XML and other tools, we will be able to
build, analyze and run interactive devices, and document them, all from exactly
the same XML text. Being able to do so much from one document will help improve quality—because different people will be able to work from exactly the same
material. Any faults will be corrected—and will correct things for everybody. (In
contrast, in a conventional design process, each aspect of design is independent
and has its own life, so fixing problems, say in the user manual, rarely helps fix
problems in the interactive device itself.)
.
7.8
You can get more details of SCXML and other variants of XML from
www.w3.org.
Conclusions
Most systems that we are interested in have many states. Unless we draw their diagrams carefully we get in a mess very quickly! Statecharts provide a clearer way
220
7.8. Conclusions
to draw state transition diagrams. They are a widely recognized way of drawing
interactive devices. For the most part, the ways statecharts simplify diagrams actually helps us do what we want—they bring out many interaction programming
issues and make them easier to see. It would be unfortunate indeed if the gadget
designs we wanted were still nasty to draw, but by-and-large statechart features
correspond to useful features for designing interactive systems.
Statecharts are not perfect. For example, while they show states very well, they
⇤
do not show actions very clearly. If a device has a button ⇥X , a statechart gives
⇤
no visual insight into how ⇥X is used, and whether, for instance, it has been used
everywhere it should have been. For many properties, we will have to rely on
automatic analysis to find out whether a design does the things we want it to, but
statecharts are very good for starting a “bigger picture” discussion about design
with designers.
.
See chapter 9, “A framework for design,” for many ideas of checks and
properties about designs that can be worked out automatically—so we don’t
need to draw diagrams to see their properties.
Sadly, few systems are designed using statecharts, let alone state diagrams.
Statecharts aren’t used because not enough people know about them, and ordinary state diagrams aren’t used because they get too complicated too quickly. So
most devices are programmed without any careful analysis of the state and transitions, and all of the details that we took so much care to draw are never visualized
by the designers. That’s a shame, because then we end up with quirky designs. If
we were designing for safety-critical applications, say, a gadget to monitor a hospital patient, then we must use a technique at least as good as statecharts to help
make the design safe.
7.8.1
Further reading
Degani, A., Taming HAL: Designing Human Interfaces Beyond 2001, Palgrave
Macmillan, 2004. Taming HAL (an allusion to the HAL computer in Arthur C.
Clarke’s 2001: A Space Odyssey), is an excellent introduction to the issues
discussed throughout Press On—and it makes good use of statecharts. Taming
HAL goes from the design of handheld devices to aircraft cockpits, and shows
how bad design causes human error. Taming HAL covers much of the same
ground, with the expertise of a NASA scientist. It discusses some nasty
accidents and explores the design issues behind them, but it does not get into
any programming behind the user interface.
Fowler, M. with Scott, K., UML Distilled, Addison-Wesley, 2003. UML, the
popular unified modeling language, uses statecharts and several other
notations to help in design. There are many books on UML; Fowler and Scott’s
has the advantage of being very clear and one of the shortest!
Harel, D. and Politi, M., Modeling Reactive Systems with Statecharts,
McGraw-Hill Education, 1998. This is the book on statecharts, but David Harel
221
Chapter 7 Statecharts
has written several definitive papers: Harel, D., “Statecharts: A Visual
Formalism for Complex Systems,” Science of Computer Programming, 8
pp231–274, 1987, introduced statecharts; and Harel, D. and Gery, E.
“Executable Object Modeling with Statecharts,” IEEE Computer, 30(7), pp31–42,
1997, also published in Proceedings of the 18th. International Conference on
Software Engineering, IEEE Press, pp246–257, 1996.
Harel, D., “On Visual Formalisms,” Communications of the ACM, 31(5),
pp514–530, 1988. A very clear and concise introduction to statecharts, as well
as hypergraphs and Venn diagrams, written by their inventor.
Horrocks, I., Constructing the User Interface with Statecharts, Addison-Wesley,
1999. A much more practical, programming book on statecharts.
Paternò, F., Model-based design and evaluation of interactive applications, Springer
Verlag, 2000. Statecharts are not the only approach to designing interactive
devices. A completely different approach uses Petri nets, invented by Carl
Petri, which are basically transition diagrams with tokens that can be moved
around. A Petri net can be in more than one state at a time, or put the other
way around, a standard transition diagram has only one token to move
around, to show the current state. This book discusses Petri nets from a user
interface perspective.
Samek, M., Practical Statecharts in C/C++, CMP Books, 2002. Although Samek is
keen on his so-called quantum programming, don’t let this put you off! His
book is a very practical introduction to programming statecharts in
conventional programming languages. This book should be read by anyone
wanting to build interactive embedded systems.
Wieringa, R. J., Design Methods for Reactive Systems, Morgan Kauffman, 2003.
An excellent and easier to read text book than Harel and Politi’s book, and one
that covers more than just statecharts.
222
Notes . . .
www.mitpress.edu/presson