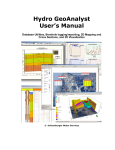
1
HydroGeo Analyst
Demo Tutorial Guide
Database Utilities, Borehole logging/reporting, 2D Mapping and
Cross-Sections, and 3D Visualization
Copyright 2004, Waterloo Hydrogeologic, Inc.
License Agreement
Waterloo Hydrogeologic Inc. retains the ownership of this copy of the software. This copy is licensed to you for use under the following conditions:
I. Copyright Notice
This software is protected by both Canadian copyright law and international treaty provisions. Therefore, you must treat this software JUST LIKE A BOOK, with the following single exception. Waterloo Hydrogeologic Inc. authorizes you to make archive
copies of the software for the sole purpose of backing-up our software and protecting your investment from loss.
By saying "JUST LIKE A BOOK", Waterloo Hydrogeologic Inc. means, for example, that this software may be used by any number of people and may be freely moved from one computer location to another, so long as there is NO POSSIBILITY of it being
used at one location while it is being used at another. Just like a book can't be read by two different people in two different places
at the same time.
Specifically, you may not distribute, rent, sub-license, or lease the software or documentation; alter, modify, or adapt the software
or documentation, including, but not limited to, translating, decompiling, disassembling, or creating derivative works without the
prior written consent of Waterloo Hydrogeologic Inc. The provided software and documentation contain trade secrets and it is
agreed by the licensee that these trade secrets will not be disclosed to non-licensed persons without written consent of Waterloo
Hydrogeologic Inc.
II. Warranty
Waterloo Hydrogeologic Inc. warrants that, under normal use, the material on the CD-ROM and the documentation will be free of
defects in materials and workmanship for a period of 30 days from the date of purchase. In the event of notification of defects in
material or workmanship, Waterloo Hydrogeologic Inc. will replace the CD-ROM or documentation.
The remedy for breach of this warranty shall be limited to replacement and shall not encompass any other damages, including but
not limited to loss of profit, and special, incidental, consequential, or other similar claims.
III. Disclaimer
Except as specifically provided above, neither the developer(s) of this software nor any person or organization acting on behalf of
him (them) makes any warranty, express or implied, with respect to this software. In no event will Waterloo Hydrogeologic Inc.
assume any liabilities with respect to the use, or misuse, of this software, or the interpretation, or misinterpretation, of any results
obtained from this software, or for direct, indirect, special, incidental, or consequential damages resulting from the use of this software.
Specifically, Waterloo Hydrogeologic Inc. is not responsible for any costs including, but not limited to, those incurred as a result
of lost profits or revenue, loss of use of the computer program, loss of data, the costs of recovering such programs or data, the cost
of any substitute program, claims by third parties, or for other similar costs. In no case shall Waterloo Hydrogeologic Inc.'s liability exceed the amount of the license fee.
IV. Infringement Protection
Waterloo Hydrogeologic Inc. is the sole owner of this software. Waterloo Hydrogeologic Inc. warrants that neither the software
and documentation nor any component, including elements provided by others and incorporated into the software and documentation, infringes upon or violates any patent, trademark, copyright, trade secret, or other proprietary right.
Royalties or other charges for any patent, trademark, copyright, trade secret or other proprietary information to be used in the software and documentation shall be considered as included in the contract price.
V. Governing Law
This license agreement shall be construed, interpreted, and governed by the laws of the Province of Ontario, Canada, and the
United States. Any terms or conditions of this agreement found to be unenforceable, illegal, or contrary to public policy in any
jurisdiction will be deleted, but will not affect the remaining terms and conditions of the agreement.
VI. Entire Agreement
This agreement constitutes the entire agreement between you and Waterloo Hydrogeologic, Inc.
Copyright 2004, Waterloo Hydrogeologic, Inc.
Table of Contents
1. Introduction to HydroGeo Analyst. . . . . . . . . . . . . . . . . . . . . . . . . . . . . . . . . 1
Key Features in HydroGeo Analyst 1.0 . . . . . . . . . . . . . . . . . . . . . . . . . . . . . . . . . . . . 2
Data Acquisition . . . . . . . . . . . . . . . . . . . . . . . . . . . . . . . . . . . . . . . . . . . . . . . . . . . . . . . . . . . . . . . .
Data Management. . . . . . . . . . . . . . . . . . . . . . . . . . . . . . . . . . . . . . . . . . . . . . . . . . . . . . . . . . . . . . .
Data Visualization . . . . . . . . . . . . . . . . . . . . . . . . . . . . . . . . . . . . . . . . . . . . . . . . . . . . . . . . . . . . . .
Reporting and Printing . . . . . . . . . . . . . . . . . . . . . . . . . . . . . . . . . . . . . . . . . . . . . . . . . . . . . . . . . . .
Interface to Visual MODFLOW and other WHI Software . . . . . . . . . . . . . . . . . . . . . . . . . . . . . . .
2
3
4
5
6
Installing HydroGeo Analyst . . . . . . . . . . . . . . . . . . . . . . . . . . . . . . . . . . . . . . . . . . . . 7
System Requirements . . . . . . . . . . . . . . . . . . . . . . . . . . . . . . . . . . . . . . . . . . . . . . . . . . . . . . . . . . . .
Installation . . . . . . . . . . . . . . . . . . . . . . . . . . . . . . . . . . . . . . . . . . . . . . . . . . . . . . . . . . . . . . . . . . . .
Uninstalling HydroGeo Analyst . . . . . . . . . . . . . . . . . . . . . . . . . . . . . . . . . . . . . . . . . . . . . . . . . . . .
Starting HydroGeo Analyst . . . . . . . . . . . . . . . . . . . . . . . . . . . . . . . . . . . . . . . . . . . . . . . . . . . . . . .
7
7
8
8
Learning HydroGeo Analyst. . . . . . . . . . . . . . . . . . . . . . . . . . . . . . . . . . . . . . . . . . . . . 8
HydroGeo Analyst On-Line Help . . . . . . . . . . . . . . . . . . . . . . . . . . . . . . . . . . . . . . . . . . . . . . . . . . 8
About the Interface . . . . . . . . . . . . . . . . . . . . . . . . . . . . . . . . . . . . . . . . . . . . . . . . . . . . 9
Data Tabs . . . . . . . . . . . . . . . . . . . . . . . . . . . . . . . . . . . . . . . . . . . . . . . . . . . . . . . . . . . . . . . . . . . .
Main Menu Bar . . . . . . . . . . . . . . . . . . . . . . . . . . . . . . . . . . . . . . . . . . . . . . . . . . . . . . . . . . . . . . .
Toolbar . . . . . . . . . . . . . . . . . . . . . . . . . . . . . . . . . . . . . . . . . . . . . . . . . . . . . . . . . . . . . . . . . . . . .
Project Browser . . . . . . . . . . . . . . . . . . . . . . . . . . . . . . . . . . . . . . . . . . . . . . . . . . . . . . . . . . . . . . .
11
12
12
15
2. Demonstration Exercise . . . . . . . . . . . . . . . . . . . . . . . . . . . . . . . . . . . . . . . .17
Viewing the Demo Project . . . . . . . . . . . . . . . . . . . . . . . . . . . . . . . . . . . . . . . . . . . . . 18
Station Groups . . . . . . . . . . . . . . . . . . . . . . . . . . . . . . . . . . . . . . . . . . . . . . . . . . . . . . . . . . . . . . . . 19
Viewing Station Data . . . . . . . . . . . . . . . . . . . . . . . . . . . . . . . . . . . . . . . . . . . . . . . . . . . . . . . . . . 20
Querying the Database . . . . . . . . . . . . . . . . . . . . . . . . . . . . . . . . . . . . . . . . . . . . . . . . 24
Creating a Data Query . . . . . . . . . . . . . . . . . . . . . . . . . . . . . . . . . . . . . . . . . . . . . . . . . . . . . . . . . . 24
Plotting Stations on a Map Project . . . . . . . . . . . . . . . . . . . . . . . . . . . . . . . . . . . . . . 30
Creating a New Map Layer with a Data Query . . . . . . . . . . . . . . . . . . . . . . . . . . . . . . . . . . . . . . . 31
Creating a Thematic Map . . . . . . . . . . . . . . . . . . . . . . . . . . . . . . . . . . . . . . . . . . . . . . . . . . . . . . . 32
Saving and Printing . . . . . . . . . . . . . . . . . . . . . . . . . . . . . . . . . . . . . . . . . . . . . . . . . . . . . . . . . . . . 34
Viewing Geological Cross Sections . . . . . . . . . . . . . . . . . . . . . . . . . . . . . . . . . . . . . 35
Visualizing Cross Sections and Maps in 3D . . . . . . . . . . . . . . . . . . . . . . . . . . . . . . . 39
Navigation Tools . . . . . . . . . . . . . . . . . . . . . . . . . . . . . . . . . . . . . . . . . . . . . . . . . . . . . . . . . . . . . . 41
Creating Borehole Log Reports . . . . . . . . . . . . . . . . . . . . . . . . . . . . . . . . . . . . . . . . . 44
Creating Data Summary Reports . . . . . . . . . . . . . . . . . . . . . . . . . . . . . . . . . . . . . . . . 46
Contacting WHI . . . . . . . . . . . . . . . . . . . . . . . . . . . . . . . . . . . . . . . . . . . . . . . . . . . . . 50
Copyright 2004, Waterloo Hydrogeologic, Inc.
Copyright 2004, Waterloo Hydrogeologic, Inc.
1
Introduction to HydroGeo Analyst
Thank you for evaluating the demo version of HydroGeo Analyst v.1.0!
HydroGeo Analyst is the newest software solution from Waterloo Hydrogeologic Inc.!
It is the most comprehensive and yet easy-to-use environmental data management
system, providing data validation, analysis, and visualization. The HydroGeo Analyst
package integrates a list of flexible and customizable database structures used around
the world, complimented by state-of-the-art tools for data interpretation, statistical
analysis, GIS mapping, data charting, and two- and three-dimensional visualizations.
For most environment related projects, whether they are contaminated sites or
municipal water supply projects, there is often an abundance of data that has been
collected over the years. How many times have you had to sift through several paper
reports for that one piece of information when compiling monthly summaries on a
project? Can you be sure that you have not misplaced a report or failed to mention an
important piece of data?
The HydroGeo Analyst package addresses these and many other needs in the industry.
The system enables you to create a project specific database, or enhance and build upon
your existing database. HydroGeo Analyst can take all of those previous data and
reports and consolidate them into a powerful relational database system that can be
queried and referenced with ease.
HydroGeo Analyst (HGA) operates as a desktop application based on Microsoft SQL
Server technology. The package supports multi user levels for controlled data
management, with structured access privileges for setting up project data structures,
checking out data to working sub-projects, and submitting new or modified data.
HydroGeo Analyst Sample Applications
The following are some sample applications for HydroGeo Analyst:
• Regional water well management
• Contaminant site inventory
• Regulatory compliance
1
•
•
•
•
•
•
•
Geologic cross-sections
Public access to information
Environmental site assessment
Monitored natural attenuation
Regional aquifer characterization and management
Cross-boundary data sharing
Aquifer vulnerability mapping
1.1 Key Features in HydroGeo Analyst 1.0
HydroGeo Analyst is implemented through a number of modules, each performing a
specific task. This approach allows HydroGeo Analyst to be memory efficient, flexible,
and extendible. In addition, with most of its data and settings implemented in the
Extensible Markup Language (XML), there are unparalleled and unlimited possibilities
to develop third-party components to work with the software.
Some of the modules that come with HydroGeo Analyst include:
•
•
•
•
•
•
•
•
Data Transfer System
Template (Database Schema) Designer and Manager
Query Builder
GIS Map Manager
Cross-Section Editor
Borehole Log Plotter
Report Designer, and
3D Visualization
A brief description for each of the above modules is provided in the following sections,
while a more detailed discussion is presented in later chapters.
1.1.1 Data Acquisition
Data Entry
Most environmental data is inherently spatial as observations are taken at specific map
coordinates, over time. In HydroGeo Analyst, these sampling locations are referred to
as Stations. HydroGeo Analyst comes with standard, easy-to-use data entry grids
equipped with drop-down combo boxes and many other features that facilitate data
entry and validation for virtually any type of Station data.
Importing and Exporting Data
The Data Transfer System (DTS) is designed to assist in the process of importing/
exporting data to/from the database. Using the DTS, station data can be imported from
2
Chapter 1: Introduction to HydroGeo Analyst
practically any source including delimited text files, MS Excel, MS Access Databases,
SQL Server Databases and others.
1.1.2 Data Management
HydroGeo Analyst supports virtually any database structure including those with
multiple levels of relationships among two or more entities. This provides an
unparalleled flexibility for projects that may have variable needs. For instance, the
project database structure may need to satisfy requirements by the United States
Environmental Protection Agency (USEPA) or Ontario’s Ministry of the Environment
(MOE).
For these and many other needs, HydroGeo Analyst comes with a number of
customizable templates implementing various commonly used database structures. The
database structure included with the demo project is “Environmental”. These templates
also include commonly used and customizable data queries and report templates that
will be installed with the desired database structure.
Template Manager (Database Schema Designer)
If your database needs cannot be satisfied through one of the database templates that are
provided with the system, you may use the Template Designer to create and customize
your own database structure. The Template (Database Schema) Designer is provided to
handle such tasks as creating, editing, and importing database schemas for your project
databases. It provides a set of categories that allows organizing your database tables.
Existing Database structures can also be imported using the Template Designer.
Customizable Lists and Standards
HydroGeo Analyst comes with a List Editor tool that affords users the ability to create
and customize lists for any field - allowing for rapid data entry. Common examples of
lists include:
•
•
•
•
•
•
List of over 150 standard Soil Classifications with descriptions and patterns
List of common chemical names with their CAS Registry numbers
Lab analysis test methods
Well drilling methods, construction, and casing materials
County and State Codes
Applicable standards for various purposes, regions, and agencies
A “List” in HydroGeo Analyst is equivalent to either a physical or virtual look-up table.
Data Querying and Filtering with the Query Builder
Data querying is an important feature for any environmental database. It provides the
ability to easily locate desired information, with only a few mouse clicks.
Key Features in HydroGeo Analyst 1.0
3
HydroGeo Analyst provides multiple levels of querying data out of your database
through the Query Builder. The Query Builder combines a set of tools for creating a
range of simple to the most advanced queries for your projects. All queries created can
be saved for later use, used to define Station Groups, or used to filter data for reporting,
plotting charts and creating GIS maps.
1.1.3 Data Visualization
Interpretation of geologic and hydrogeologic data is made easy with the visualization
modules that are provided in HydroGeo Analyst. Using these tools, raw data can be
transformed into meaningful spatial data sets. HydroGeo Analyst offers a collection of
standard and custom modules for interpreting vast amounts of spatial data. Some of
these modules are briefly described in the following sections.
Map Manager
The Map Manager, built on ESRI’s MapObjects technology, provides a spatial view of
any set of selected data. Basemaps of the site can be quickly imported, allowing for
meaningful interpretation of borehole and well data. The Map Manager is designed in
such a way that most files required for a desired map view are generated automatically.
The true power of GIS is harnessed when it is used for spatial analysis of multiple data
sets. These spatial data sets can be combined to provide:
•
•
•
•
•
•
Groundwater recharge flux maps
Aquifer yield capacity
Aquifer vulnerability
Contamination risk assessment
Geologic cross-sections
Completion diagrams
Contour Mapping
In addition to creating and displaying selected data on the Map, the Map Manager also
allows you to create contour maps and other thematic maps for any selected data from
your database. For example you can create and run a query that returns the maximum
concentration of a given chemical over a certain period of time and transfer the result to
the Map Manager. Once the map with this data is created, you can create and view
contour maps depicting the distribution of the selected chemical concentration over the
site area.
Thematic Mapping
Additionally, a Thematic Map of any type of data may be created and displayed on the
map view. Thematic maps include Pie and Bar charts, with options to customize their
appearance and style.
4
Chapter 1: Introduction to HydroGeo Analyst
Geologic Cross-Sections with the Cross-Section Editor
Most geologic and/or hydrogeologic site investigations often require a detailed analysis
of the available lithological data. A crucial effort in such investigations involves the
drafting of cross sections. The Cross-Section editor can be used to achieve these tasks.
The Cross-Section editor provides a set of easy-to-use tools to interpret subsurface data.
Geological and hydrogeological interpretations, as well as interpretations geared
towards creating model layers, can be created using the cross section module. All
model interpretations can be exported for use as modeling layers in groundwater
modeling software packages, including Waterloo Hydrogeologic’s Visual MODFLOW.
The Cross-Section editor is seamlessly integrated with the HydroGeo Analyst 3D
Explorer, a tool that combines and displays one or more cross-sections in a 3D fence
diagram view.
3D Subsurface Visualization with 3D Explorer
Once cross-sectional views of the data are created and preliminary interpretations are
made, the 3D Explorer can be used to create fence diagrams containing one or more of
those cross-sections. The 3D Explorer provides a unique perspective of the entire site,
through its ability to display multiple cross-sections simultaneously; this perspective is
not possible when viewing individual 2D cross sections.
The 3D Explorer, in addition to displaying fence diagrams, can also be used to display
surfaces for each layer involved in the interpretation. For instance, a surface depicting
static groundwater elevations over the site can be created and displayed in the 3D
Explorer. Use the 3D Explorer to import basemaps, or shape files containing any type
of data, and relate this to the cross-section interpretations. For example, a contour map
or DXF site map may be draped or overlaid on top of multiple fence diagrams. Finally,
use the AVI recording tools to record the auto-rotation of the 3D fence diagrams for
presentation purposes.
1.1.4 Reporting and Printing
Report Designer
HydroGeo Analyst features a state-of-the-art report generation tool that is equipped
with a robust and easy to use runtime designer. A Report Wizard provides steps to
simplify the report creation process; the results are high-quality and professional
reports, containing company headers/footers, and company logos. Reports can contain
images and data from any of the other modules (Map views, cross-section views, 3D
views, data grids, query results, charts, etc.) The final reports can be printed or saved in
a number of formats including PDF, HTML, RTF, XLS, TIF, or TXT, as well as in a
binary format.
Key Features in HydroGeo Analyst 1.0
5
Report Templates
The Report Designer includes several pre-defined Report Templates, providing
professional results quickly, and seamlessly.
Borehole Log Plotting
Borehole log reports can be prepared utilizing the Report Designer. A report for
multiple boreholes can be generated at once by selecting one or more boreholes in the
database and calling the borehole log report generator.
Borehole log reports may display information such as depth, lithology, water level,
screen locations, sample results both as values and in charts, geophysical data and
more.
Chart Generator
HydroGeo Analyst comes with a powerful and easy-to-use charting interface that is
closely linked to the reporting component. Unlimited number of charts can be placed on
the reporting component’s runtime designer. The charting control can then be linked to
specific parts of the database to retrieve the source data. HydroGeo Analyst generates
an unlimited number of pages with one or more charts with a single click of the mouse.
The charting module allows charts to include regulatory limits. As such, it allows users
to define a range of values referred to as the “Alarm Zone” that may be used to indicate
a range of values in exceedance of selected regulatory limits or intervals.
1.1.5 Interface to Visual MODFLOW and other WHI Software
ESRI GIS (*.SHP) files and databases have become two of the main sources of data for
groundwater models, and HydroGeo Analyst makes it easier to incorporate these data
formats directly into your model. HydroGeo Analyst allows you to export pumping
well and observation well data directly to your model by mapping the data required by
the model to the fields stored in the GIS shape files or the database. In addition,
HydroGeo Analyst, through the use of the cross-section editor, enables you to create
and export layers resulting from 3D Model interpretations of your geological data in the
database.
Also, you can use the Data Transfer System (DTS) to export station data and chemical
analyses, then import it into AquaChem, for water quality analysis, geochemical
plotting, and modeling with PHREEQC.
6
Chapter 1: Introduction to HydroGeo Analyst
1.2 Installing HydroGeo Analyst
1.2.1 System Requirements
To run HydroGeo Analyst, the following minimum system configuration is necessary:
•
•
•
•
•
•
•
•
•
•
•
•
Pentium II, 300 MHz (or equivalent)
128 MB of RAM (256 MB recommended)
A CD-ROM drive for software installation
100 MB free disk space
Windows 2000/XP/NT 4.0 (Service Pack 4.0 or later)
A local or network printer installation
A Microsoft compatible mouse
A minimum screen resolution of 1024 X 768
A SQL Server connection or installation of WHI MSDE instance (included)
MSAccess
MSExcel
Internet connection (recommended)
If you have any problems with your particular system configuration, please make sure
that you followed the installation instructions precisely. If the problem is still
unresolved, contact your hardware experts. Finally, if you are still having trouble, see
the section in Preface on How to Contact Waterloo Hydrogeologic.
1.2.2 Installation
HydroGeo Analyst must be installed on your hard disk before you can start to use the
software. Please read the section on hardware requirements at the beginning of this
section to ensure that your system meets the requirements before you start installing the
software. The Setup32.EXE executable file is used to install HydroGeo Analyst on
computers running on Windows 2000/XP/NT 4.0 operating systems.
Although the HydroGeo Analyst Software needs to be installed on local hard drives,
this may not necessarily be the case for the databases to be managed by the software.
The location of the database will depend on:
• the expected size of the data,
• the number of anticipated users, and
• data and system security
The SQL Server 2000 Desktop Engine commonly known as the Microsoft SQL Server
Database Engine (MSDE) will be installed on your hard drive as part of the installation
process and will be setup as the default database server. The MSDE 2000 is a database
engine built and based on core SQL Server technology.
Installing HydroGeo Analyst
7
1.2.3 Uninstalling HydroGeo Analyst
There may be instances where you will need to uninstall (remove) HydroGeo Analyst
from your system (i.e. if the software is to be transferred to another computer, or if you
need to reinstall it on the current computer).
Before un-installing the HydroGeo Analyst software package from your system, we
strongly recommend you to make backup copies of all your HydroGeo Analyst projects
and databases. These include your entire HGA project folder and all its contents. If you
are also uninstalling MSDE component, make sure to also back up the SQL Server
databases. This file has the extension .MDF, and can be found in the MSDE installation
folder.
(e.g. C:\Program Files\Microsoft SQL Server\MSSQL$WHI\Data\Name.MDF)
To uninstall HydroGeo Analyst:
•
•
•
•
Locate the Add/Remove Programs option in your Windows’ Control Panel.
Select HydroGeo Analyst as the program to be removed
Follow the on-screen instructions.
Once you are finished, re-boot your system to ensure all system files are
updated.
1.2.4 Starting HydroGeo Analyst
To launch HydroGeo Analyst, double-click on the desktop icon (as shown on
the left-hand side), or by accessing WHI Software/HydroGeo Analyst from
your Start > Programs Windows menu.
1.3 Learning HydroGeo Analyst
There are several ways of getting acquainted with HydroGeo Analyst, including using
the Getting Started section in Chapter 2 of the User’s Manual, a Demo Tutorial which is
provided with this document, and the On-Line Help.
Please contact Waterloo Hydrogeologic if you require further training on this as well as
any other software developed and distributed by Waterloo Hydrogeologic.
1.3.1 HydroGeo Analyst On-Line Help
The User’s Manual is supplied to you in two forms: as a printed book, and as an online
help file. To view the online help version of the manual, select Help > Contents. Some
HydroGeo Analyst windows and dialogues contain
buttons, which allow for
loading the help section for the current active component.
A HydroGeo Analyst Help window is divided into three main areas:
8
Chapter 1: Introduction to HydroGeo Analyst
• A Navigation Frame on the left displays the Contents, Index, Search, and
Favorites tabs.
• A Toolbar across the top displays a set of buttons to move around in the
HydroGeo Analyst Help system.
• A Topic Frame on the right displays the actual Help topics included in the OnLine Help.
The tabs in the Navigation Frame provide the core navigational features as described
below.
Contents
The Contents tab displays the headings in the “Table of Contents” in the form of an
expandable/collapsible tree view. Closed book icons represent Table of Contents
headings that have subheadings.
Index
The Index tab displays all Help topics. You can scroll to find the index entry you want,
or you can type in the first few letters of the keyword in the text box, and the index will
scroll automatically as you type. Double-click an index entry to display the
corresponding Help topic. Alternatively, you may select an index entry and then click
the Display button to open the Help topic.
Search
The Search tab is used to search the On-Line Help documents for a word or phrase of
interest. Simply type the search word(s) or phrase(s), then press <Enter> or click the
Display button.
Favorites
You can add frequently accessed Help topics to a personal list of favorites, which is
displayed on the Favorites tab. Once you have added a topic to your list of favorites,
you can access the topic by double-clicking it. Click Add to add the currently displayed
topic to your favorites list. Select a favorite and then click Remove to delete a topic
from your favorites list.
1.4 About the Interface
When HydroGeo Analyst is first loaded, a blank window will appear indicating no
project is loaded. To create a new project, select Project / New; to open an existing
project, select Project / Open. A sample dataset is shown below along with the well
profile. The well profile is not loaded by default. To activate it, select View / Well
Profile and select one of the Borehole Log Plotter (BHLP) templates discussed later.
About the Interface
9
Menu
Bar
Data
Tabs
Toolbar
Project
Browser
Well
Profile
Data
Grids
Status
Bar
The HydroGeo Analyst Graphical User Interface is composed of several controls:
Provides access to the various parts of the database including the
Station List, Data Query, and Station Data.
Menu Bar:
Contains menu commands with access to most features that are
available in the HydroGeo Analyst package.
Toolbar:
Contains several context sensitive short-cut buttons for the most
frequently used HydroGeo Analyst features.
Project Browser: Hosts a tree view listing some of the most common components of
your project. These include nodes for Station Groups, Queries,
Maps, Cross Sections, Reports, 3D Views, Station Data, and
Borehole Log Plots.
Well Profile:
Provides a borehole log plot for the selected station.
Data Grids:
Contains the grids for data entry and visualization.
Status Bar:
Displays the program status.
Data Tabs:
The following sections describe each of these components in greater detail.
10
Chapter 1: Introduction to HydroGeo Analyst
1.4.1 Data Tabs
To facilitate data management, the main interface is separated into three tabs, described
below.
Stations List Tab
This tab hosts a grid displaying a list of stations for the selected station group. Only a
few selected columns are displayed in this tab, namely: Station Name, X and Y
coordinate, Elevation, and TOC (Top of Casing elevation). The purpose of this list is to
provide an overview of multiple stations and to perform general operations based on
one or more selected stations. For a more detailed view of an individual station, the
Station Data tab should be utilized.
Data Query Tab
This tab displays results from an execution of any selected data query. This tab can be
activated by double-clicking on any query under the Queries node on the Project
Browser, or by directly clicking on the tab itself.
For more details on creating and editing queries, please see Chapter 7: Query Builder of
the User’s Manual.
Station Data Tab
This tab allows the user to enter and view the data for a single station. This tab can be
activated either by selecting a data category in the Station Data node in the Project
Browser or by directly clicking on the tab itself. The former will activate the selected
data category and the related tables will be loaded for viewing and/or editing.
Each table in the selected category will be displayed in a separate tab on this page. Each
of these tabs displays data from corresponding tables filtered for the Station selected at
the top of the window. To change the active station, simply select a new station from
the combo box above the grid.
About the Interface
11
Category
selection
Station
selection
Tables
1.4.2 Main Menu Bar
The menu bar provides access to most of the features available in HydroGeo Analyst.
See “HydroGeo Analyst Main Menu Bar” on page 85 of the HGA User’s Manual for
more details.
1.4.3 Toolbar
The toolbars that appear beneath the menu bar are dynamic, changing as you move
from one window (tab) to another. Some toolbar buttons become available only when
certain tabs are in view. For example, the Add and Delete toolbar buttons are only
available when the focus is on a grid. Some toolbar buttons are available only in a
particular context; for example, the Paste button is only available after the Copy or
Cut command has been used.
The following tool buttons appear at the top of the HydroGeo Analyst main window.
For a short description of an icon, move the mouse pointer over the icon without
clicking either mouse button.
New button loads the Project Manager to create a new project.
Open button opens an existing HydroGeo Analyst project.
12
Chapter 1: Introduction to HydroGeo Analyst
Print button sends the data item that is currently active to the report
manager. This data item could be a list of stations, data from any table or a
query result. This button is activated only if a grid is active.
Refresh button refreshes the current view, by updating the project browser
and all grids.
Copy button copies selected character(s) in a grid cell, to the clipboard.
Paste button pastes text from the clipboard to the active cell.
Add button adds a new record; this button is activated only if a grid is
active.
Delete button deletes the selected record; this button is activated only if a
record is selected.
Post Data button saves (posts) all changes made to the project; this button
is activated if changes to a record have been made.
Find button displays a dialog for searching in a grid using a user-specified
criterion.
Filter by Value filters the grid using the value in the active cell.
Hide Selected button hides selected data records (rows); this button is
activated only if one or more records are selected.
Inverse Selection button will select all records that are not selected, and
de-select all records that are currently selected; this button is activated only
if one or more records are selected.
About the Interface
13
Sort Ascending button sorts records in ascending order based on the
selected column; this button is activated when the cursor is placed in one of
the grid cells.
Sort Descending button sorts records in descending order based on the
selected column; this button is activated when the cursor is placed in one of
the grid cells.
Template Manager button launches the Template Manager.
List Editor button launches the List Editor.
Material Specifications button launches the Material Specifications
Editor.
Query Builder button loads the Query Manager that allows building
simple and advanced queries.
Well Profile Viewer button loads a window displaying the profile view of
the selected station. This includes data for Lithology and Well
Construction (drilling procedure, filling materials, screen and well casing
materials).
Map Manager button loads the Map Manager; by default, the most recently
used map project will be loaded.
View Cross-Section button launches the Cross Section editor and displays
the last edited cross section (if any).
Import button launches the Data Transfer System (TDS) to import data.
Export button launches the Data Transfer System (DTS) to export data.
14
Chapter 1: Introduction to HydroGeo Analyst
1.4.4 Project Browser
The project browser (tree) lists the following items:
•
•
•
•
•
•
•
•
Station Groups
Station Data (Data categories)
Queries
Maps
Cross Sections
Reports
3D Views and
Borehole Logs
These items may be part of any project. Each item is
organized as a node in the tree view with one or more items
under each node. If there is no item under a given node, there
will be no branches available.
Station Groups
The Station Groups node contains the Station Groups in your HydroGeo Analyst
project. By default, all projects will contain a station group named Project that lists all
stations in the database belonging to the project. All station groups that are created for a
project are listed under the Station Groups node below the Project node.
Clicking on any station group under the Station Group node will load the Station List
tab, and display a limited number of columns of data for the stations belonging to that
group. Additional fields and tables for each Station are available through the Station
Data tab (discussed later in this section).
Station Data (Data Categories)
The Station Data node displays the visible data categories under which project tables
are organized. Clicking on any of the data categories activates the Station Data tab (if
it is not already active) and displays a tab for each of the tables classified under the
selected data category. The Station Data tab loads information for the station currently
selected in the Station List tab. The station can be easily changed in the Station Data
About the Interface
15
tab using the Select Station combo box. Data categories are provided to enable logical
groupings of your tables.
Queries
The Queries node lists all the queries that are created and available for the current
project. Double-clicking on any of the queries under this node executes the query,
activates the Data Query tab, and displays the returned results.
Maps
The Map node lists all map projects that are available (created) for the current
HydroGeo Analyst project. Double-clicking on a map project node loads the map
manager (if not already loaded) and opens the selected map project into the map
manager.
Cross-Sections
The Cross-Sections node lists all cross-sectional views created using the CrossSection Editor. Double-clicking on a cross-section launches the Cross-Section Editor
and loads the selected cross-section.
Reports
The Reporting component included with HydroGeo Analyst allows you to create as
many reports as needed for your project, and save the layouts for future report
generation. All the reports created for a selected project will be listed under the
Reports node. Double-clicking on any of these report layouts will open a report
template or a saved report. By default, the report will be displayed in print preview
mode, however it is a simple task to activate the report designer in order to modify the
report layout. See Chapter 11: The Report Editor of the User’s Manual for more details.
3D Views
The 3D Views node contains a list of available 3D views that have been created and
saved for your project. Double-clicking on a 3D view loads the selected view into the
HydroGeo Analyst 3D Explorer.
Borehole Logs
The Borehole Logs node contains a list of all Borehole Log Plot (BHLP) Templates
that have been created and saved for your project. Double-clicking on a Borehole Log
loads the selected template into the BHLP viewer. The station group that is currently
active will be available to be viewed in BHLP.
16
Chapter 1: Introduction to HydroGeo Analyst
2
Demonstration Exercise
Before you begin this chapter, ensure that you have read through Chapter 1:
Introduction to HydroGeo Analyst of this Demo Tutorial. Chapter 1 is designed to
provide a cursory overview of HydroGeo Analyst’s major modules and their functions.
This chapter contains a step-by-step review of some of HydroGeo Analyst’s key
features and analysis capabilities. This exercise will give you some practical experience
using HydroGeo Analyst and familiarize you with the HydroGeo Analyst demo project.
In this exercise, you will become familiar with the following functions:
•
•
•
•
•
•
•
Viewing the Demo Project
Querying the Database
Plotting Stations on a Map Project
Viewing Geological Cross Sections
Visualizing Cross Sections and Maps in 3D
Creating Borehole Log Reports
Creating Data Summary Reports
Limitations of Demo Version
The Demo version of HydroGeo Analyst (HGA) is designed to provide a brief
overview of the capabilities of the software. As such, you may only open and view the
demo database provided with the installation. Also, the following limitations exist:
•
•
•
•
•
•
•
Cannot create new projects
Cannot create or delete records
Cannot save (post) records
Cannot edit cross sections
Cannot add annotation layers
Cannot save map projects
Demo watermark appears on all reports, maps, cross sections, and 3D projects
NOTE: If you have purchased a full license and are running the Demo project to
familiarize yourself with the interface, the above limitations do not apply to you.
17
Terms and Notation
The following terms and notations will be used in this exercise:
type:
Type in the given word or value
Click the left mouse button where indicated
Double-click the left mouse button where indicated
<Tab>
Press the Tab key on your keyboard
<Enter>
Press the Enter key on your keyboard
The bold faced type indicates menu or window items to click, or values to
type.
The Main Menu items are the items available at the top of the HydroGeo
Analyst Parent window.
2.1 Viewing the Demo Project
In this first section of the tutorial, you will start HydroGeo Analyst, open the Demo
project, and become familiar with the program layout.
To start HydroGeo Analyst,
Start and choose Programs/WHI Software/HydroGeo Analyst 1.0 Demo,
or double-click on the desktop icon
.
When HydroGeo Analyst starts, it displays the main window. To open the demo
project,
Project / Open
An Open Database dialogue will appear, prompting you to select a HydroGeo Analyst
project to open.
Browse to the folder, C:\Program Files\HGAnalyst\Projects\Demo_Project.
If you have installed HydroGeo Analyst in another folder, please browse to
the appropriate folder now, and locate this file.
Project.VBH (located in this folder).
[Open]
A prompt will appear for the password for the project. HydroGeo Analyst uses
password protection for projects, to support multiple user levels. If a password is
entered, the user will have Project Manager status, and full control over the project.
Enter the following password for this project:
type: password
[OK]
18
Chapter 2: Demonstration Exercise
The Demo project should then be loaded into HydroGeo Analyst, as shown in the
following window.
The Project Browser (tree) can be easily expanded to see all the nodes and entities of
the Demo project. To expand the entire tree,
View / Expand All from the main menu bar.
[OK] in the message box that appears.
Take a moment to inspect the items under each node in the Project Browser.
In the next section, you will learn about Station Groups.
2.1.1 Station Groups
In HydroGeo Analyst, stations can be sorted into groups allowing for efficient
management and quick retrieval of data stored in the database. All station groups
created for a project are listed in the Project Browser under the Station Group node.
Clicking on any of the sub-nodes corresponding to a station group will load the Station
List tab, and display the appropriate stations belonging to that group. In the demo
database, there are several station groups:
•
•
•
•
Project (the complete list of stations)
Boreholes (contains only those stations which are boreholes)
Monitoring Wells (contains only those stations which are monitoring wells)
Soil Borings (contains only those stations which are soil borings)
Viewing the Demo Project
19
To see the stations which belong to the Monitoring Wells station group, select this node
from the project tree.
Monitoring Wells (under the Station Groups node in the project tree).
When a station group is selected, the stations belonging to that group will appear in the
Station List tab. Once the stations in a group are displayed, a number of operations can
be applied based on the selection. For example, loading a station group and then
selecting the Display on Map option from the Record menu, activates the Map
Manager component and automatically creates a GIS layer containing all stations from
this group. The mapping feature will be demonstrated later in this tutorial.
2.1.2 Viewing Station Data
In this section, you will see how data is organized in the HydroGeo Analyst database.
First, load the Boreholes Station Group,
Boreholes (under the Station Groups node in the Project Browser).
GB-20
The Station List tab provides only the station coordinates, elevation, and TOC (Top of
Casing) elevation (if provided). To see the additional data belonging to this station,
GB-20 (double-click on this station), or click on the Station Data tab from
the top of the window.
20
Chapter 2: Demonstration Exercise
The Station Data tab provides access to all data related to a single station. There are
several Data Categories available, which are available in the Data Category combo box
in the upper-left corner.
Geologic Description (from the Data Category combo box).
This will load the Geologic Description data for the selected station (GB-20). In this
table, you will see soil sampling intervals (from - to), soil descriptions, soil
classification names, and soil patterns. Soil classifications may be selected from a
picklist. This data will be used to create Borehole log reports and Geological cross
sections. These features will be demonstrated later in this exercise.
Next, you will view the Well Construction data for the selected borehole.
Well Construction (from the Data Category combo box as shown below).
This will load the Well Construction data for the selected station (GB-20). In this table,
you will see four tabs:
•
•
•
•
Drilling Protocol (contains drilling information)
Casing (contains info on well casing materials, diameter, etc.)
Screen (contains screen interval details)
Annular Fill (contains info on annular fill, gravel packs, sand packs, etc.)
Annular Fill tab, to see the records entered in this table.
You will see the interval and filling materials entered for this borehole.
From this window you may also view data for another station. There is a picklist of
stations under the Select Station label at the top of the window.
Viewing the Demo Project
GB-15
21
This will load the Well Construction data for the newly selected station. You can also
see the Well Construction in the Well Profile diagram. To do this,
Station List tab
GB-15 in the list to ensure it is selected
View / Well Profile. A new frame will appear in the HGA window,
containing a profile view of the selected station. After resizing the plot
columns, your view should be similar to the figure shown below.
Selecting a new Borehole in the Station List will load the respective well profile view.
Feel free to experiment with this option now.
22
Chapter 2: Demonstration Exercise
Once you are finished, the well profile view should be turned off before proceeding. To
hide the well profile view,
View / Well Profile
Next, you will view the Monitoring Event data (groundwater chemistry and water table
elevations). First, you must select an appropriate station group.
Monitoring Wells (from the Station Group node in the Project Tree).
W-01 (the first station in the list)
Station Data tab to view the data for this station (or simply double-click on
the station).
Monitoring Event (from the Data Category combo box). The data for this
will appear as shown in the figure below.
This data category contains four tables:
•
•
•
•
Chemistry_Sample (sample code, date, etc.)
Chemistry_Results (sampling results for various chemicals)
Field Props (physical properties)
Water Level (results from water table elevations measurements for several
dates).
Viewing the Demo Project
Chemistry_Results to view the list of samples collected for this well, the
date and time of the observation, and the concentrations provided by
laboratory analyses.
23
Sorting Records
Using the sorting and filtering options, you can also select different views for the data.
For example, it may be helpful to view just the stations at specific elevation.
To do this,
Station List tab
Project from the Station Groups node
Place the mouse cursor into any field under the Elevation column.
Record / Sort Descending from the main menu.
This will sort the values in this column from highest to lowest. You will see that the
highest elevation is 340.49 and this occurs at station GB-33.
There is a more efficient way to find the data that you want, and this involves Queries,
which will be demonstrated in the next section.
2.2 Querying the Database
Queries can be used to create station groups, or find and locate crucial data values; you
can quickly filter and locate the desired data, from a larger dataset. Data Queries can be
used for quantifying and qualifying any field in the HGA database, and can be used to
create a new map layer on a map project.
2.2.1 Creating a Data Query
In this example, you will create and execute a Data Query to find exceedences of TCE
(Trichloroethylene) in the Soil Samples.
To load the Query Builder,
Tools / Query Builder from the main menu, or click on the
(Query)
button in the toolbar.
A prompt may appear to save the query. Click [NO] to continue.
The Query Builder window will load as shown below.
24
Chapter 2: Demonstration Exercise
Data Query (radio button) in the upper left corner of the window.
A prompt may appear to save the query. Click [NO] to continue.
(New) button in the toolbar, and the following dialog will appear.
A prompt may appear to save the query. Click [NO] to continue.
In the dialogue that appears, enter a Name for the new query, and a Description
(optional).
type: TCE Exceeds 5 mg_kg
[OK]
NOTE: Slashes are not supported in the SQL string, therefore the
underscore is used to denote “per”.
Querying the Database
25
In the tree on the left side of the window, expand the Soil Sampling node, then expand
the Soil Chemistry node.
Locate and click on the chemical_name field. Drag this field into the blank
Conditions frame, under the Expression column. The selected field will
be added automatically to the Query Conditions.
Under the Conditions, select an Operator for this field.
= from the combo box.
Select an Expression for the field. For this example, locate TCE (Trichloroethylene)
from the list:
26
Chapter 2: Demonstration Exercise
Trichloroethylene
Next, add two additional fields to the Query Conditions:
Locate and click on the result_value field. Drag this field into the blank
conditions field, under the Expression column. The selected field will be
added automatically to the Query Conditions.
NOTE: Operator “AND” is added by default. You can change this operator by
selecting a new one from the drop-down menu.
For the Operator,
> from the combo box
Select an Expression for the field. For this example, enter the concentration criteria:
type: 5
Finally, repeat these steps for the result_unit field.
Locate and click on the result_unit field. Drag this field into the blank
conditions field, under the Expression column. The selected field will be
added automatically to the Query Conditions.
For the Operator,
= from the combo box
Select an Expression for the field. For this example, select the appropriate soil
chemistry units:
mg/kg, from the combo box
In addition, some fields must be also be added to the Display Fields. The Name field
has been added automatically, however you can also add any relevant fields to display
in the query results. To do so,
Querying the Database
Locate and click on the chemical_name field in the tree on the left side of
the window. Drag this field into the blank Display Fields grid (in the upper
part of the window).
27
Repeat this for the result_value and result_unit fields.
In the Display Fields, you may specify aggregate (function) or sort options. These
options are not explored in this example.
Once the fields have been added, the Query Manager display should be similar to the
one shown in the figure below.
(Generate SQL Statement) button from the toolbar to Generate the SQL
string. If the Query string is invalid, the violating rows will be highlighted
red (indicating error) or yellow (indicating warning).
Finally, to execute the Data Query,
28
(Execute SQL Statement) button from the toolbar
Chapter 2: Demonstration Exercise
The results of the query should appear, as shown in the figure below.
This query should return 10 records that satisfy the specified conditions.
(Save Query) button to save the query.
The Query Results may be sent to a data summary report, or as a new map layer. This
will be demonstrated later in this exercise.
[Close] to return to the main HydroGeo Analyst window.
Upon returning to the HGA window, you will see the Data Query will appear as a new
node under the Queries node in the project browser.
Expand the Queries node in the project browser, and locate this query.
There are several ways to recall this query:
Data Query tab at the top of the window
Under the Query List, select the new query (TCE exceeds 5 mg_kg).
(Execute Query) button (located at the bottom of the window)
This will execute the Query, and display the Query results.
Alternately, you may select the query node from the project tree, and double click on
the query, or right-mouse click on the query and select Execute Data Query.
Several queries have been created for you in the Demo Project. Feel free to peruse them
and see how they were constructed. To view how a query was designed, right-click on
the desired query and select Edit. The names and organization of the queries should
give you an idea of their purpose.
Querying the Database
29
In the next section, you will experiment with Map projects.
2.3 Plotting Stations on a Map Project
The HydroGeo Analyst’s Map Manager provides a tool for mapping station data on
basemaps, in addition to thematic and contour maps. Basemaps may be in AutoCAD,
Shape file, or Georeferenced Raster Image formats (.BMP, .JPG, .GIF, .PNG, .TIF,
etc.). The Map Manager tool is also used to digitize the locations for cross-section lines.
In this example, you will load an existing map project, then plot the TCE exceedences
which were determined using a Data Query in the previous section.
First, before proceeding, ensure that you are viewing the main window of HydroGeo
Analyst. Then to load the Map Manager,
+ Maps, to expand this node of the project tree,
Site Map.
Once the Map Manager window is loaded, the display should be similar to the one
shown below.
Active
Window
Menu
Bar
Toolbar
Layer
Manager
Map
Window
Layer
Information
Current projection
System
30
X,Y Co-ordinates
Scale
Chapter 2: Demonstration Exercise
The Map Manager window contains the following elements:
• Menu Bar: Contains program menu commands
• Toolbar: Contains short cut buttons to some of the functions in the Map
manager
• Layer Manager: Modify layer order, set layers visible, active, and modify layer
properties.
• Map Window: Contains the layers for the map project.
• Layer Information: Displays the projection system for the selected layer.
• Coordinates: Displays the X,Y co-ordinate for the current mouse cursor
location.
• Scale: Displays scale for the map window.
• Active Window: Select between the Map window or the Cross Section
window.
The Demo Map Project contains several layers, as indicated in the Layer Manager on
the left side of the window. There are two air photos of the site, which is a helpful
visual aid to relate station locations to land features.
In this map project, some Station Groups have been loaded as a new map layer, each
represented by a unique symbol.
In the next section of this exercise, you will load the data query as a new map layer.
2.3.1 Creating a New Map Layer with a Data Query
You will now load the TCE data query as a new map layer. To do so,
Layer / Load HGA Data
Data Query radio button, in the dialog that appears
TCE exceeds 5 mg per_kg from the list of data queries (you will need to
scroll down to the bottom of the list)
[OK]
Plotting Stations on a Map Project
31
This will display the query results on the map project, as a new map layer. Next, you
will create a Thematic map, in order to visually represent the greatest concentrations of
TCE at these stations.
2.3.2 Creating a Thematic Map
In this example, you will create a Bar chart:
To create a Thematic Bar Chart,
TCE exceeds 5mg per_kg layer from the Layer Control (it should be the
Layer / Create Thematic Map / Bar Chart from the Map Manager main
first, top-most, layer) to ensure that this layer is active.
menu.
A Thematic map window will appear as shown below:
type: BarChart in the Name field.
(This name will appear in the thematic map list should you choose to edit it later on.)
32
Result_Val field from the left panel
[>] button to move this field to the right panel
[Next] to proceed to the next window.
Chapter 2: Demonstration Exercise
In this dialogue, specify the bar chart color, and the column dimensions. A preview
window in the lower right corner displays a preview of the true size and color of the
thematic map, as it will appear in the map manager.
type: 20 for the height.
type: 10 for the width.
[OK] to create the map.
The thematic map is an entity of the selected layer; when this layer is hidden, so too
will the corresponding thematic map.
An example of a Map Project with a Bar Chart is shown below:
To visualize only this bar chart, it may be helpful to hide the non-essential layers by
selecting View / Turn off all layers. Having done so, turn on one of the air photos (to
Plotting Stations on a Map Project
33
provide a map background) and the “TCE exceeds 5 mg_kg” layer by clicking on the
check-boxes beside them.
In the next section, the options for saving and printing will be presented.
2.3.3 Saving and Printing
Once you are satisfied with the map view, there are several options to exporting the
display:
• Save the image as a graphics file
• Print the image directly as is
• Insert the image into a report
If you wish, you may print this map view now. To do so,
Project / Print from the main menu.
Select any print template from the list
[OK]
The map window will load into the Report Editor, where the image may be inserted into
a report, and printed or saved to .PDF, .HTML, .RTF, and other file formats. In
addition, the Report Editor allows for customizing the header, footer and logo. The
image will appear similar to the one shown below.
34
Chapter 2: Demonstration Exercise
Print Report button from the toolbar
[X] (Close) button to return to the Map Manager window.
In the next section, you will view a pre-defined cross section using the Cross Section
editor.
2.4 Viewing Geological Cross Sections
The Cross Section editor tool included with the HydroGeo Analyst package can be used
to view and interpret cross sections for your station data. The Cross Section editor is
able to display the following cross section interpretation types:
• Geologic (containing lithology structure data)
• Hydrogeologic (containing locations of aquifers, aquitards, etc.)
• Model (containing locations of model layer lines, which may be used in
numerical groundwater modeling)
To load the cross section editor from the map manager,
Viewing Geological Cross Sections
35
Cross Section tab in the upper right corner of the Map Manager
window.
Next, select a cross section from the tree on the left side.
[+] beside AA.
Once a cross section has been loaded into the Cross Section Editor, the window will
appear similar to the figure shown below.
Active
Window
Menu
Bar
Toolbar
Layer
Control
Cross-Section
Window
Map
Preview
X, Z Co-ordinates
The Cross Section Editor window contains the following items:
• Menu Bar: Contains program menu commands
• Toolbar: Contains short cut buttons to some of the functions in the Cross
Section editor
• Layer Control: Modify layer order, make layers visible, active, and modify
layer properties.
• Cross-Section Window: Contains the cross-section view for the selected
cross-section line.
• Map Preview: Displays the selected cross-section line, as it appears in the map
project. The selected stations for the cross-section are highlighted in this Map
preview window.
36
Chapter 2: Demonstration Exercise
• Coordinates: Displays the X, Z co-ordinate for the current mouse cursor
location.
• Active Window: Select between the Map Manager window or the Cross
Section window.
In the Demo Map project, the cross sections have already been defined for you.
However, it is simple task to define new cross section interpretations using the polygon
and line drawing tools that are included with the Cross Section Editor.
In the layer control, you can see the aforementioned interpretation types (Model,
Geologic, and Hydrogeologic). From here, you can show/hide each interpretation type.
Also, note some of the other convenient features of the Cross Section editor:
The Map Preview window shows the location of the cross section line, and the stations
involved in the cross section. The Map Preview window is linked directly to the
displayed cross section.
Place your mouse cursor over the Map Preview window, and place it on top of one of
the stations selected for this cross section. This causes the selected station to
temporarily flash in the cross section window. This helps you to relate the stations in a
planar view, to what you are seeing in the cross section (2D) view.
Conversely, you may relate stations in the cross section view to what is displayed in the
map preview window. Place your mouse cursor over a single station in the cross section
window, then look at the Map Preview window. You will see the selected station will
flash temporarily in the map preview window. This helps you to relate the stations in
the cross section view, to their physical XY location on the map view.
To confirm the lithology for an individual station, use the information button in the
toolbar:
View / Information from the main menu, or select the
button from
the toolbar.
Move the mouse cursor over a station, and move through the depth of the borehole.
This will display a text box containing the soil description and interval information for
the station.
Intersecting Layers
When viewing an individual cross section, you can also see the intersection locations of
other cross sections or other layers such as contour lines and highways as defined in the
map project. To do so, BEFORE you create a new cross section line, in the Map
Manager
Select Settings / Cross Section
The following dialogue will appear:
Viewing Geological Cross Sections
37
Click on the symbol in each layer to customize the display
[OK] to close the dialog
Cross Section tab in the Map window to return to the Cross Section editor.
Saving and Printing
Once you are satisfied with the cross section view, there are several avenues you can
follow:
•
•
•
•
Save the image as a graphics file
Print the image directly as is
Insert the image into a report
View the cross section (and other cross sections) in 3D
If you wish, you may print this cross section now. To do so,
38
File / Print from the main menu.
Chapter 2: Demonstration Exercise
Select any print template from the list
[OK]
The cross section will load into the Report Editor, where the image may be inserted into
a report, and printed or saved to .PDF, .HTML, .RTF, and other file formats. In
addition, the Report Editor allows for customizing the header, footer and logo. The
image will appear similar to the one shown below.
Print Report button from the toolbar
[X] (Close) button to return to the Cross Section Editor window.
In the next section, you will see how multiple cross sections can be viewed in 3D.
2.5 Visualizing Cross Sections and Maps in 3D
Quite often, viewing individual cross-sections in 2D simply does not provide the
overall picture of the site lithology. Fortunately, HydroGeo Analyst offers the 3D
Explorer tool, which allows you to simultaneously display multiple cross sections in
order to create fence diagrams. In this demonstration, you will select a few cross
sections from the Demo Map project, and load these into 3D Explorer.
Visualizing Cross Sections and Maps in 3D
39
From the Cross Section Editor,
View / View 3D from the main menu, or select the
button from the
toolbar. The following dialogue will appear:
Select the cross sections to display from the dialogue, by placing a check mark beside
each cross section name. Or, to select all cross sections, place a check mark beside
Select All at the top of the dialog.
Select AA and CC
Enter a name for the 3D project in the field in the lower-right corner:
type: Demo
[OK]
This will load the 3D Explorer window, similar to the figure shown below:
40
Chapter 2: Demonstration Exercise
The 3D Explorer window contains several controls, which are not discussed in this
exercise. For more details, refer to Chapter 10: HydroGeo Analyst 3D Explorer of the
User’s Manual.
You will see that the fence diagrams produce a new perspective on the site geology.
The site map from the demo map project is also displayed, by default, to help relate the
cross section data to surficial features.
2.5.1 Navigation Tools
Locate the field containing the Vertical Exaggeration (at the top of the window), and
enter a new value:
type: 4
<Enter> (on your keyboard)
At the bottom of the 3D window, there is a Navigation tools panel which is used to
orient the 3D grid. To rotate the 3D grid,
Rotate tab
X slider bar
Visualizing Cross Sections and Maps in 3D
41
Drag the X slider bar slowly to the left, to see the resulting affect on the 3D
grid.
Alternately, you may use the AutoRotate feature. The AutoRotate tools located on the
right-hand side of the Rotate tab may be used to continuously rotate the model image
around the X, Y and/or Z axis.
Z under the AutoRotate options
(Play) button to start the rotation. Observe the rotation for a few
seconds, then,
(Stop) button to stop the rotation.
You can also record the Autorotate as an .AVI file. To do so
(Record) button
This will load the following dialog:
By default, the .AVI file will be saved to the folder in which the project is located. You
can change the file destination by browsing to the desired location. You can also set the
speed of the video by changing the value in the “Frames per second” field. The larger
the value, the faster the video will play. This has no effect on the recording time. Feel
free to record a video file now by pressing [OK].
When you are finished, after about 30 seconds
(Stop) button
NOTE: The recorded .AVI files may get very large depending on the length of the
video.
42
Chapter 2: Demonstration Exercise
To play back the file, browse to the folder on your hard drive, locate the .AVI file and
load it into a supported media player.
You can shift or zoom in/out of the 3D grid using the shift options.
Shift tab
Z slider bar.
Drag the slider bar to the left to zoom out, or to the right to zoom in.
Individual cross sections and interpretation types may be shown or hidden from the 3D
display, using the project tree on the left side of the 3D Explorer window. However,
these capabilities are not explored in this demo exercise.
Once the desired view has been loaded, the 3D image may be loaded into the Report
Editor for printing. To do so,
File / Print from the main menu, or click the
(Print) button from the
toolbar.
Select any print template from the list
[OK]
The 3D window will load into the Report Editor, where the image may be inserted into
a report, and printed or saved to .PDF, .HTML, .RTF, and other file formats. In
addition, the Report Editor allows for customizing the header, footer and logo. The
image will appear similar to the one shown below.
Visualizing Cross Sections and Maps in 3D
43
Print Report button from the toolbar
[X] (Close) button to return to the 3D Explorer window.
Then, close the 3D Explorer window by selecting
File / Exit from the main menu.
In the next section you will view borehole log plots for one of the stations.
2.6 Creating Borehole Log Reports
Using the HydroGeo Analyst Borehole Log Plotting (BHLP) Tool, you can create a
professional style borehole log report. A few samples are provided in the Demo project.
Select Boreholes from the Station Groups node in the project browser
From the project tree, expand the Borehole Logs node, then
bhlp1
The WHI Borehole Log Plot Designer window will appear as shown below:
44
Chapter 2: Demonstration Exercise
:
From the Select Stations drop down menu (circled above),
GB-03
The display is updated to reflect the Lithology, Well Construction, and Scale of the
selected station.
The BHLP templates created in the Demo Project each contain a different number and/
or order of data columns. Feel free to peruse the other BHLPs.
Once the desired view has been loaded, the BHLP may be loaded into the Report Editor
for printing. It is possible to create one report for each station in the group, or only one
report for the selected station. To print a report for the selected BHLP only,
Right-click on the station name at the top of the window. From the menu
that appears,
Print current borehole
Select any print template from the list
[OK]
Creating Borehole Log Reports
45
Print Report button from the report toolbar
[X] (Close) button to return to the BHLP window.
[Close] button to return to the main HGA window.
In the next section you will learn how to prepare data summary reports.
2.7 Creating Data Summary Reports
Using the HydroGeo Analyst Report Tool, you can create a professional style report of
any types of data in your project. A few samples are provided in the Demo project,
however all reports start with a template. The templates are provided under each node
of the Reports node and are provided automatically when you choose Project / Report
(or Project / Print or File / Print) from each corresponding module of HydroGeo
Analyst.
46
Expand the Station Groups node
Boreholes group
Project / Report from the main menu
Stations as a template
Chapter 2: Demonstration Exercise
The WHI Report Designer window will appear as shown below:
To print the report as it is,
Print Report button from the toolbar.
The HydroGeo Analyst reports are fully customizable. You may modify the title,
header, footer, company info, company logo, etc.
For this exercise you will change some minor features in the report.
Return to Designer
button to move to the Report Designer
The following window will appear:
Creating Data Summary Reports
47
48
Properties button (circled in the image above) to display the ToolBox
Properties menu
“New Report” in the Designer window (circled in the image above) to
activate that label
Caption field of the Properties and change “New Report” to “Boreholes”
Expand the Detail node of the Report tree
fldx to activate the x-coordinate field
OutputFormat field
Chapter 2: Demonstration Exercise
[...] button to launch the following dialogue
Set the dialogue to match the settings shown above (i.e. set Category “Number” and Decimal Places - “4”)
Repeat the above procedure for fldy.
Creating Data Summary Reports
49
Now that you are done formatting your report, click the Report Preview
button to
move to the Preview window. The report should appear similar to the image shown
below:
Print Report button from the toolbar
[X] (Close) button to return to the main HydroGeo Analyst window.
This concludes the demonstration exercise for HydroGeo Analyst v.1.0.
2.8 Contacting WHI
Although the purpose of this exercise is to highlight some of the key features and
analysis capabilities of HydroGeo Analyst, it really only scratches the surface of the
potential applications for this software package. Continue to explore HydroGeo
Analyst and discover for yourself how truly powerful it can be.
If you have specific questions regarding the features and analysis capabilities of
HydroGeo Analyst, please contact a Waterloo Hydrogeologic Sales Representative at:
Phone: +1 (519) 746-1798
Fax: +1 (519) 885-5262
E-mail: [email protected]
Web: www.waterloohydrogeologic.com
50
Chapter 2: Demonstration Exercise