1
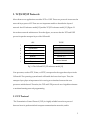
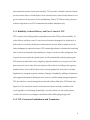
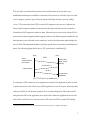
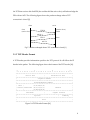
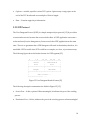
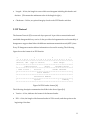
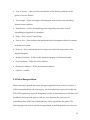
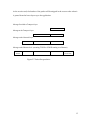
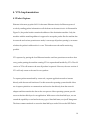
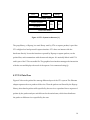
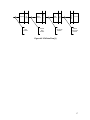
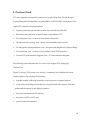
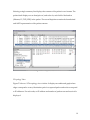
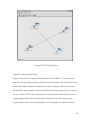
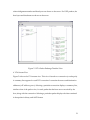
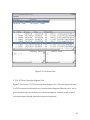
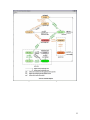
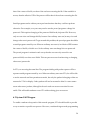
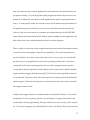
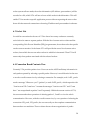
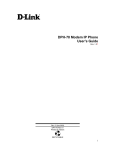
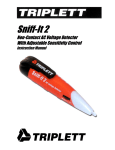
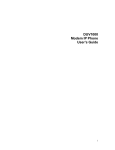
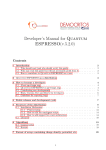
A TCP/UDP Protocol Visualization Tool: Visual
TCP/UDP Animator (VTA)
Project Proposal
Chunhua Zhao
Advisor: Dr. Jean Mayo
Computer Science Department
Michigan Technological University
Houghton, MI 49931
March 2002
Abstract
Network proto col education requires that students understand the layered nature of
network protocols, as well as details of protocol execution. Visualization of protocol
operation based on real network traffic can greatly enhance the ability of a student to
understand these protocols. However, existing tools are primarily aimed at traffic
analysis, rather than illustration of protocol operation. They do not facilitate connectionoriented display of network data, but focus on depiction of all traffic through a network
interface. Further, use of these tools requires privileged access, which is not always
feasible within an academic environment.
The Visual TCP/UDP Animator (VTA) was designed for visualization of the operation
of the TCP and UDP protocols. VTA was originally developed as a course project. It
currently provides five different views of network traffic, aimed at illustrating the
details of TCP/UDP protocol execution, rather than at traffic analysis. This project
proposes a new version of VTA, based on our use of the original software. The new
version will allow an ordinary user to monitor the traffic associated with a specific
application process, and to capture his own traffic without special privileges. It will
provide the user with a list of currently active sockets, from which one or more sockets
can be selected for monitoring. Support will be added for replay of streams of data
captured live from the network. In addition, the new version will reorganize packet data
and provide an overall contents view based on a single TCP connection. With the newly
added features, VTA will be a useful tool for network protocol education. Additionally,
it will be very useful for network monitoring, and network program debugging.
2
Acknowledgements
I would like to take this chance to thank my advisor Dr. Jean Mayo. Without her
guidance and encouragement, this proposal would not have been completed. I would
also like to thank my committee members: Dr. Ching-Kuang Shene, Dr. Soner Onder,
and Dr. Jianping Dong for their time and support.
3
Table of Contents
1. INTRODUCTION....................................................................................................... 1
2. RELATED WORK....................................................................................................... 3
3. TCP/UDP/IP PROTOCOLS....................................................................................... 5
3.1 TCP PROTOCOL .................................................................................................. 5
3.2 UDP PROTOCOL ............................................................................................... 10
3.3 IP PROTOCOL ..................................................................................................... 11
3.4 PACKET ENCAPSULATION .............................................................................. 12
4. VTA IMPLEMENTATION ..................................................................................... 14
4.1 PACKET CAPTURE ............................................................................................. 14
4.2 PACKET VISUALIZATION................................................................................. 15
4.3 VTA SYSTEM ARCHITECTURE ....................................................................... 15
4.2 VTA DATA FLOW............................................................................................. 16
5. PREVIOUS WORK................................................................................................... 18
6. PROPOSED WORK.................................................................................................. 24
6.1 SETUID PROGRAM............................................................................................... 25
6.2 SYSTEM CALL WRAPPER .................................................................................. 26
6.3 SOCKET LIST........................................................................................................ 28
6.4 CONNECTION BASED CONTENTS VIEW.......................................................... 28
6.5 SAVE REAL-TIME NETWORK DATA................................................................ 29
6.6 USER WIZARD..................................................................................................... 29
REFERENCES................................................................................................................ 31
4
1. Introduction
Many client-server applications use the TCP and UDP protocols. These two protocols are
usually covered in network programming courses to help students to better understand
related issues in the layered structure of networks, security, operating system
implementation, system administration, etc. Since the protocol implementation details are
hidden to students, they often have difficulty in understanding protocol architectures and
determining why a program does not work. Though studying the operating system
protocol stack code would be helpful, it is beyond the time and scope of most courses. A
better way to help students is to provide a visualization tool that can show the protocol
execution details, such as how the packets are exchanged between client and server,
content of each packet, etc. Network system administrators and network programmers
also need to monitor existing network traffic. They can benefit from a packet capture
utility to get data from the network and perform post-capture analysis. In order to address
these needs, we developed a visualization tool, the Visual TCP/UDP Animator (VTA).
VTA is a network monitor and TCP/UDP protocol analyzer tool based on the Linux
operating system. It allows the user to examine TCP/UDP packet data from a live network
or from a capture trace file that contains time-indexed network events [1]. The user can
interactively browse the captured data in various ways. VTA was originally developed by
a team of five people (Ping Chen, Yin Ma, Rong Ge, Yuping Zhang and Chunhua Zhao) in
spring 2001 as a CS5441 course project. The original version provided the following views
(see Chapter 5 for screenshots and detailed descriptions of each view):
•
Packet View -- contents of each field in each packet
1
•
Network Topology View -- the layout of machines in the network
•
Packet Exchange Timeline View -- the space-time diagram of packet exchange
•
Stream View – contents of each packet for each TCP connection
•
TCP State Transition Diagram View – TCP state transition diagram
From these views, the user can monitor the network traffic and learn details of TCP/UDP
protocol execution. Some important concepts and mechanisms, such as the layered
structure of the network, packet encapsulation, TCP three-way handshake and the four
packet close mechanism, are vividly illustrated. VTA also provides a space-time packet
exchange diagram, so users can easily see the communication between sockets in a clear
manner. All of these are unique features not found in other tools.
In this paper, we propose to add the following functionality to the original version:
•
Allow an ordinary user to capture his own traffic without requiring root access
•
Allow an ordinary user to monitor traffic of a specific application process
•
Provide a list of current active sockets, from which the user can select his interested
sockets to be visualized
•
Provide a connection based contents view (contents of communication categorized by
socket address <IP address, port number>)
•
Allow users to save captured real-time data into a disk file
•
Provide a user wizard to guide users in using VTA
Additionally, we plan to more fully test and debug the original implementation, so that
VTA can be easily used in network programming education.
2
2. Related Work
A significant amount of commercial and institutional research has been done to monitor
or simulate network traffic and visualize network data. Protocol designers use network
simulators to emulate real world conditions. For example, the Virtual Inter-NetWork
Testbed (VINT) project [2, 3] provides network researchers with a useful tool for
emulating real-world networks. On the other hand, there are many packet capture
programs for network traffic monitoring. Some are widely available based on the Unix
platform, including Tcpdump [4], RealSecure, SniffIt, Etherfind, Snoop, Packetman, etc.
Among these, Tcpdump is one of the most widely used free network packet capture
programs. It prints out the headers of selected packets on a network interface in text
mode. It has been ported from Unix to Windows (Windump [5]). There are also some
commercial packet capture applications, such as Packet View, Network General's Sniffer,
and Microsoft's Net Monitor. Although the non-commercial packet capture programs are
powerful, they usually interact with the user in text mode, without a graphical user
interface. Users of these programs are challenged to comprehend and analyze large
amounts of complex data. Commercial programs do a good job providing collected
information in a graphical way, but most of them run on the DOS or Windows operating
systems. Their use is restricted by platform.
There are also some network traffic analysis tools available. Some of them integrate data
capture with graphical analysis; others just take the output from packet capture programs
as input and provide only analysis. These tools include Multi Router Traffic Grapher
(MRTG), IPTraf, IP Flow Meter (IPFM), Tcptrace and Ethereal. For example, Ethereal [6] is
3
a free network protocol analyzer for Unix and Windows. The user can examine data from
a live network or from a capture file on disk. It allows users to interactively browse the
captured data, viewing summary and detail information for each packet. TCPTrace [7]
accepts many trace file formats. It can be used to analyze the behavior of captured TCP
streams.
In the academic field, little work has been done on visualization of the TCP and UDP
protocols. In 1998, Bob Barr et al. presented XSNIFF, which is a network -monitoring tool
with graphical X -Window based display [12]. XSNIFF provides statistical information
about data at the network level and the user process level. It also provides a TCP
connection graph showing the connection between the network nodes.
These existing network traffic analysis tools, like XSNIFF, require super user privilege and
focus on traffic analysis. However, for students learning network protocols, super user
privilege is usually not available, and detailed information about execution of the protocol
is of more interest. Moreover, these existing tools often allow the user to assess the traffic
on a per-packet basis, not on a per-connection basis. For example, the user may see the
content of each TCP packet one by one, but cannot see the overall content for a socket-pair
connection in a continuous form. Therefore, we developed our tool: Visual TCP/UDP
Animator (VTA). The goal of our tool is to illustrate execution of the TCP and UDP
protocols over IP and Ethernet.
4
3. TCP/UDP/IP Protocols
Most client-server applications use either TCP o r UDP. These two protocols in turn use the
network-layer protocol IP. There are two important models to describe the layered
network: the OSI reference model [13] and the TCP/IP reference model [13]. Figure 3.1
shows these network architectures. From the figure, we can see that the TCP and UDP
protocols span the transport layer of the OSI model.
OSI
7
Application
6
Presentation
TCP/IP
Application
5
Session
4
Transport
Transport (TCP, UDP)
3
Network
Internet (IP)
2
Data Link
1
Physical
Host to Network
Fig 3.1 The OSI and TCP/IP reference model [13]
User processes, such as FTP, Telnet, or HTTP, correspond to the upper three layers in the
OSI model. The operating system kernel will handle the lower four layers. Thus, the
transport layer plays an important role in serving as an interface between the user
processes and the kernel. Therefore, the TCP and UDP protocols are of significant interest
to students learning network programming.
3.1 TCP Protocol
"The Transmission Control Protocol (TCP) is a highly reliable host-to-host protocol
between hosts in packet-switched computer communication networks, and in
5
interconnected systems of such networks [14]. " TCP provides a reliable connection based
service between hosts. It is full-duplex. It can send and receive data in both directions on a
given connection at any time. It is also multiplexing. That is, TCP allows many processes
within a single host to use TCP communication facilities simultaneously.
3.1.1 Reliability, Ordered Delivery and Flow Control of TCP
TCP's variant of the sliding window algorithm ensures that TCP provides reliability , inorder delivery and flow control. It can recover data that is damaged, lost, duplicated, or
delivered out of order by the Internet communication system. When a packet is sent, an
acknowledgment is required in return. TCP contains algorithms to calculate the round -trip
time so that it can determine dynamically how long to wait for an acknowledgment. If no
response is received after the specified time, it will automatically send the packet again.
TCP ensures in-order delivery by assigning a sequence number to every byte sent. If the
data is received out of order, the receiving host will reorder it according to the sequence
numbers before it forwards the data to the receiving application. It can also avoid data
duplication by using the sequence numbers. Damage is handled by adding a checksum to
each segment transmitted, checking it at the receiver, and discarding damaged segments.
TCP provides flow control through the advertised window field in the TCP header (See
Figure 3.4). The advertised window is the amount of bytes currently available in the
receiving buffer. It will change dynamically over time. In this way, the sender cannot
overflow the receiver by sending too much data while still keeping the pipe full.
3.1.2 TCP Connection Establishment and Termination
6
TCP provides a connection between the server and the client. It uses a three-way
handshake mechanism to establish a connection. First, the server will call socket, bind, and
listen to prepare a passive open. Then the client will initiate an active open by calling
connect∗ . This causes the client TCP to send a SYN segment to the server to indicate the
client's initial sequence number for the data that the client will send on the connection.
Normally the SYN segment contains no data. When the server receives the client's SYN, it
must send an acknowledgment back together with its own initial sequence number for the
data that the server will send on the connection. At last, the client must acknowledge the
server's SYN. The minimum number of packets required for a connection establishment is
three. The following figure shows how a TCP connection is established [9].
client
socket
connect (blocks)
(active open)
server
SYN J
socket, bind,
listen, accept
(blocks)
SYN K,ack J+1
connect returns
ack K+1
accept returns
read(block)
Fig 3.2 TCP three-way handshake [9]
To terminate a TCP connection, four segments are needed. One application calls close first
to perform an active close. This causes a FIN segment to be sent to its peer. When the other
end receives FIN, it will perform a passive close. It acknowledges the FIN with an ACK,
and passes the FIN to the application as an end -of-file. When the application receives the
end-of-file, it will call close to close its socket. This causes its TCP to send a FIN. Finally,
∗
Socket, bind, listen and connect are UNIX system calls. See [9] for a complete description.
7
the TCP that receives this final FIN (the end that did the active close) will acknowledge the
FIN with an ACK. The following figure shows the packet exchange when a TCP
connection is closed [9].
client
close
(active close)
server
FIN M
(passive close)
read 0
ack M+1
FIN N
close
ack N+1
Fig 3.3 Packets exchanged when a TCP connection is closed [9]
3.1.3 TCP Header Format
A TCP header provides information specific to the TCP protocol. It will follow the IP
header in the packet. The following figure shows the format of the TCP header [14].
0
1
2
3
0 1 2 3 4 5 6 7 8 9 0 1 2 3 4 5 6 7 8 9 0 1 2 3 4 5 6 7 8 9 0 1
+-+-+-+-+-+-+-+-+-+-+-+-+-+-+-+-+-+-+-+-+-+-+-+-+-+-+-+-+-+-+-+-+
|
Source Port
|
Destination Port
|
+-+-+-+-+-+-+-+-+-+-+-+-+-+-+-+-+-+-+-+-+-+-+-+-+-+-+-+-+-+-+-+-+
|
Sequence Number
|
+-+-+-+-+-+-+-+-+-+-+-+-+-+-+-+-+-+-+-+-+-+-+-+-+-+-+-+-+-+-+-+-+
|
Acknowledgment Number
|
+-+-+-+-+-+-+-+-+-+-+-+-+-+-+-+-+-+-+-+-+-+-+-+-+-+-+-+-+-+-+-+-+
| Data |
|U|A|P|R|S|F|
|
| Offset| Reserved |R|C|S|S|Y|I|
Window
|
|
|
|G|K|H|T|N|N|
|
+-+-+-+-+-+-+-+-+-+-+-+-+-+-+-+-+-+-+-+-+-+-+-+-+-+-+-+-+-+-+-+-+
|
Checksum
|
Urgent Pointer
|
+-+-+-+-+-+-+-+-+-+-+-+-+-+-+-+-+-+-+-+-+-+-+-+-+-+-+-+-+-+-+-+-+
|
Options
|
Padding
|
+-+-+-+-+-+-+-+-+-+-+-+-+-+-+-+-+-+-+-+-+-+-+-+-+-+-+-+-+-+-+-+-+
|
data
|
+-+-+-+-+-+-+-+-+-+-+-+-+-+-+-+-+-+-+-+-+-+-+-+-+-+-+-+-+-+-+-+-+
Figure 3.4 TCP Header Format [14]
8
The following description summarizes the TCP packet fields in Figure 3.4 [14].
•
Source Port -- 16 bits, the source port number.
•
Destination Port -- 16 bits, the destination port number.
•
Sequence Number -- 32 bits, the sequence number of the first data octet in this segment
(except when SYN is present).
•
Acknowledgment Number -- 32 bits, if the ACK control bit is set, this field contains the
value of the next sequence number the sender of the segment is expecting to receive.
•
Data Offset -- 4 bits, the number of 32 bit words in the TCP Header. This indicates
where the data begins.
•
Reserved -- 6 bits, reserved for future use. Must be zero.
•
Control Bits -- 6 bits (from left to right):
URG: Urgent Pointer field significant
ACK: Acknowledgment field significant
PSH: Push Function
RST: Reset the connection
SYN: Synchronize sequence numbers
FIN: No more data from sender
• Window - 16 bits, the number of data octets beginning with the one indicated in the
acknowledgment field which the sender of this segment is willing to accept
•
Checksum -- 16 bits, indicates whether the header was damaged in transit.
•
Urgent Pointer -- 16 bits, points to the sequence number of the octet following the
urgent data.
9
•
Options -- variable, specifies various TCP options. Options may occupy space at the
end of the TCP header and are a multiple of 8 bits in length.
•
Data -- Contains upper-layer information.
3.2 UDP Protocol
The User Datagram Protocol (UDP) is a simple transport-layer protocol [15]. It provides a
connectionless service between the server and the client. A UDP application can create a
socket and send/receive datagrams to/from several other UDP applications at the same
time. There is no guarantee that a UDP datagram will reach its destination; therefore, it is
unreliable. UDP is useful when TCP would be too complex, too slow, or just unnecessary.
The following figure shows the header format of a UDP segment [15].
0
7 8
15 16
23 24
31
+--------+--------+--------+--------+
|
Source
|
Destination
|
|
Port
|
Port
|
+--------+--------+--------+--------+
|
|
|
|
Length
|
Checksum
|
+--------+--------+--------+--------+
|
|
data octets ...
+---------------- ...
Figure 3.5 User Datagram Header Format [15]
The following description summarizes the fields in Figure 3.5 [15].
•
Source Port -- 16 bits, optional. When meaningful, it indicates the port of the sending
process
•
Destination Port -- 16 bits, indicates the port of the receiving process when meaningful
10
•
Length -- 16 bits, the length in octets of this user datagram including this header and
the data. (This means the minimum value of the length is eight.)
•
Checksum -- 16 bits, an optional integrity check on the UDP header and data.
3.3 IP Protocol
The Internet Protocol (IP) is a network -layer protocol. It provides a connectionless and
unreliable datagram delivery service. It also provides the fragmentation and reassembly of
datagrams to support data links with different maximum-transmission unit (MTU) sizes.
Every IP datagram contains address information to be used in routing. The following
figure shows the format of an IPV4 header.
0
1
2
3
0 1 2 3 4 5 6 7 8 9 0 1 2 3 4 5 6 7 8 9 0 1 2 3 4 5 6 7 8 9 0 1
+-+-+-+-+-+-+-+-+-+-+-+-+-+-+-+-+-+-+-+-+-+-+-+-+-+-+-+-+-+-+-+-+
|Version| IHL |Type of Service|
Total Length
|
+-+-+-+-+-+-+-+-+-+-+-+-+-+-+-+-+-+-+-+-+-+-+-+-+-+-+-+-+-+-+-+-+
|
Identification
|Flags|
Fragment Offset
|
+-+-+-+-+-+-+-+-+-+-+-+-+-+-+-+-+-+-+-+-+-+-+-+-+-+-+-+-+-+-+-+-+
| Time to Live |
Protocol
|
Header Checksum
|
+-+-+-+-+-+-+-+-+-+-+-+-+-+-+-+-+-+-+-+-+-+-+-+-+-+-+-+-+-+-+-+-+
|
Source Address
|
+-+-+-+-+-+-+-+-+-+-+-+-+-+-+-+-+-+-+-+-+-+-+-+-+-+-+-+-+-+-+-+-+
|
Destination Address
|
+-+-+-+-+-+-+-+-+-+-+-+-+-+-+-+-+-+-+-+-+-+-+-+-+-+-+-+-+-+-+-+-+
|
Options
|
Padding
|
+-+-+-+-+-+-+-+-+-+-+-+-+-+-+-+-+-+-+-+-+-+-+-+-+-+-+-+-+-+-+-+-+
Figure 3.6 IPV4 header format [16]
The following description summarizes the fields in the above figure [16].
•
Version -- 4 bits, indicates the format of the Internet header.
•
IHL -- 4 bits, the length of the Internet header in 32 bit words, and thus points to the
beginning of the data.
11
•
Type of Service -- 8 bits, provides an indication of the abstract parameters of the
quality of service desired.
•
Total Length -- 16 bits, the length of the datagram, measured in octets, including
Internet header and data.
•
Identification -- 16 bits, an identifying value assigned by the sender to aid in
assembling the fragments of a datagram.
•
Flags -- 3 bits, various Control Flags.
•
Time to Live -- 8 bits, indicate s the maximum time the datagram is allowed to remain
in the Internet system.
•
Protocol -- 8 bits, indicates the next level protocol used in the data portion of the
Internet datagram.
•
Header Checksum -- 16 bits, used to check the integrity of the Internet header.
•
Source Address -- 32 bits, the source address.
•
Destination Address -- 32 bits, the destination address.
•
Options -- variable
3.4 Packet Encapsulation
When a message is passed down from the upper application layer to the lower layers , it
will be encapsulated into a new message by the downstream layer protocols. In this way,
TCP/UDP segments are sent as IP datagrams. Usually, downstream protocol headers will
be added to the front of the packet, while the error detection bits, such as cyclic
redundancy check (CRC) bits or checksum bits , will be appended to the packet. The
following figure shows how a packet is encapsulated on the Ethernet before it is sent out.
12
At the receiver end, the headers of the packet will be stripped in the reverse order when it
is passed from the lower layers up to the application.
Message Provided to Transport Layer
User Data
Message at the Transport Layer
TCP/UDP Header
User Data
TCP/UDP Header
User Data
Message at the Network Layer
IP Header
Message at the Ethernet level (assuming TCP/IP or UDP/IP running over Ethernet)
Ethernet
header
IP Header
TCP/UDP Header
User Data
Ethernet
32-bit CRC
Figure 3.7 Packet Encapsulation
13
4. VTA Implementation
4.1 Packet Capture
Ethernet is the most popular LAN. On the same Ethernet circuit, the Ethernet protocol
works by sending packet information to all the hosts on the same circuit. As illustrated in
Figure 3.6, the packet header contains the address of the destination machine. Only the
machine with the matching address is supposed to accept the packet. But if a machine has
its network card set into promiscuous mode, it can accept all packets passing it, no matter
whether the packet is addressed to it or not. This makes network traffic monitoring
possible.
VTA operates by putting the local Ethernet interface card into promiscuous mode so that
every packet passing the machine running VTA is captured and handled by VTA. The old
vers ion of VTA will return to the user all packets it captured. However, the new version of
VTA will only return to the user his own packets.
To capture packets transferred by a network, a capture application needs to interact
directly with the network hardware. For this reason the operating system should offer a
set of capture primitives to communicate and receive data directly from the network
adapter and then transfer the data to the user process. Most operating systems provide
access to the data link layer for an application. With access to the data link layer, we can
extend the capability to read and write any type of data link frame, not just IP datagrams.
The three common methods to access the data link layer under Unix are the BSD Packet
14
Filter (BPF), the SVR4 Data Link Provider Interface (DLPI), and the Linux SOCK_PACKET
interface [9]. In VTA, we use libpcap, the publicly available packet capture library. This
library works with all three methods above. Using this library makes our program
independent of the actual data link access provided by the operating system [9], so VTA is
more portable to other systems.
4.2 Packet Visualization
VTA uses the Qt library for the graphical user interface. "Qt is a cross-platform C++ GUI
application framework [8]". It is object-oriented and greatly eases component
programming. The KDE developers, whose work has resulted in a user-favorite Linux
desktop environment, also chose qt. Qt is supported on both Windows and various Unix
platforms [8]. By using Qt, VTA can more easily be ported to other platforms.
4.3 VTA System Architecture
Figure 4.1[1] shows the layered system architecture of VTA. The lowest level is the data
link layer access primitive that is provided by the operating system. It supplies the
application a set of functions used to read and write data from the network at the data link
layer.
15
Views
Charts
Dialogs
VTA Main Frame
Packet Analyzor
File
QT
pCapLib
Linux/Unix Kernel
Figure 4.1 VTA System Architecture [1]
The pcap library, or libpcap, is a static library used by VTA to capture packets; it provides
VTA a higher level and powerful capture interface. VTA does not interact with the
hardware directly. It uses the functions exported by libpcap to capture packets, set the
packet filter, and communicate with the network adapter. It is statically linked with VTA
and is part of the VTA executable file. The graphical user interface manages the interaction
with the user and displays the result of the capture. It is constructed using Qt.
4.2 VTA Data Flow
Figure 4.2 shows the packet flow among different layers of the VTA system. The Ethernet
adapter captures the raw packets off the wire. Then the packets are filtered by the libpcap
library; after that the packet traffic specified by the user is re -capsulated into a sequence of
packets by the packet analyzer and delivered to the main frame, which then distributes
the packet to different views specified by the user.
16
Filtered
Raw
Packets
Structured
Packets
Select
Main
Frame
Filter
Raw
Packets
packet
Analyzer
Reconstruct
Filter
pcapLib
Views
Filtered
Structured
Packets
Figure 4.2 VTA Data Flow [1]
17
5. Previous Work
VTA was originally developed by a team of five people (Ping Chen, Yin Ma, Rong Ge,
Yuping Zhang and Chunhua Zhao) in spring 2001 as a MTU CS5441 course project. The
original VTA had the following functions:
•
Capture packet data (in real-time from the network and from disk file)
•
Reconstruct the packet into a special format recognizable to VTA
•
Provide packet view – contents of each field in each packet
•
Provide network topology view – the layout of machines in the network
•
Provide packet exchange timeline view – the space-time diagram for packet exchange
•
Provide stream view - contents of each packet for each TCP connection
•
Provide TCP state transition diagram view – TCP state transition diagram
The following section describes the five views of the original VTA package [1].
1.Packet View
Figure 5.1 shows a VTA packet view window. A summary line is displayed for each
captured packet. The summary line contains:
•
a packet number, indicating its position in the sequence of captured packets,
•
a time value, indicating seconds that have elapsed between the capture of the first
packet and the capture of the displayed packet ,
•
the source and destination IP address,
•
the protocol (TCP or UDP), and
•
protocol related information.
18
Selecting a single summary line displays the contents of the packet in two formats. The
packet detail displays a text description of, and value for, each field of the headers
(Ethernet, IP, TCP/UDP) in the packet. The second depiction contains the hexadecimal
and ASCII representation of the packet contents.
Figure 5.1 VTA packet view
2.Topology View
Figure 5.2 shows a VTA topology view window. It displays an undirected graph where
edges correspond to source/destination pairs in a captured packet and nodes correspond
to IP addresses. For each node, an IP address and number of packets sent and received is
displayed.
19
Figure 5.2 VTA Topology View
3.Packet Exchange Timeline View
Figure 5.3 shows the VTA packet exchange timeline view window. To use it, the user
must enter the information about the socket he wants to monitor. This requires the user to
know the IP address and port number before he starts to capture packets. If the socket
information is input correctly, an axis will appear for each new socket (<IP, port> pair). In
the new version of VTA, a user will not need to enter any information before he starts to
capture packets. Each sent or received packet results in an arrow between the axes
corresponding to the source and destination. For a TCP packet, the sequence number,
20
acknowledgement number and data bytes are shown on the arrow. For UDP packets, the
data bytes and checksum are shown on the arrow.
Figure 5.3 VTA Packet Exchange Timeline View
4. VTA Stream View
Figure 5.4 shows the VTA stream view. This view is based on a connection (a socket pair).
A summary line appears for each TCP connection. It contains the source and destination
addresses (<IP address, port>). Selecting a particular connection displays a summary line,
similar to that of the packet view, for each packet that has been sent or received by the
host, along with the connection. Selecting a particular packet displays the data contained
in that packet in binary and ASCII format.
21
Figure 5.4 VTA Stream View
5. VTA TCP State Transition Diagram View
Figure 5.5 shows the VTA TCP state transition diagram view. This view depicts the state
of a TCP connection within the protocol state transition diagram. Different colors, red or
green, mark the state in which the two connection endpoints currently reside. A third
color marks states through which the connection has passed.
22
Figure 5.5 VTA TCP State Transition Diagram View
23
6. Proposed Work
Subsequent use of VTA has demonstrated a need for improvement. To use VTA, the user
must have root access to the machine. However, the students cannot always be given root
privilege. The user can only view data by selecting a specific packet; he cannot view all the
related data in a continuous way by selecting a socket pair. When operated in the real-time
mode, it cannot save captured data into a disk file. In addition, it is very hard for the user
to figure out how to use VTA, for it requires operation in a special sequence, but there are
no instructions or help. Bugs have also arisen that must be fixed. All these shortcomings
prevent VTA from easy real-life usage. More work must be done to improve it.
To solve the problems mentioned above and provide more functionality, a new version is
proposed in this paper. The new version is aimed at providing the user with a handy tool
for visualizing network application data. It will allow an ordinary user without root access
to be able to execute and monitor his own process, then capture and analyze those packets
associated with that process. It will let the user consult the current active sockets on his
system, selecting those sockets of special interest from the list and capturing only those
packets. It will also allow the user to save captured data into a disk file. In summary, the
following capabilities will be added to the original version:
•
Allow an ordinary user to capture his own traffic without requiring root access
•
Allow an ordinary user to monitor traffic of a specific application process
•
Provide a list of current active sockets, from which the user can select sockets to be
visualized
24
•
Provide a connection based contents view (contents of communication categorized by
socket address <IP address, port number>)
•
Allow users to save captured real-time data into a disk file
•
Provide a user wizard to guide users in using VTA
Additionally, we plan to more fully test and debug the original implementation, so that
VTA can be easily used in network programming education. The following section
describes these proposed improvements for VTA.
6.1 Setuid program
Capture of packets from the network requires privileged access to the network card. In
the Linux operating system, this requires root access. However, students cannot always be
given root access. In order to overcome this problem, a setuid root-owned packet-capture
binary is being created to capture packets according to issued requests [1]. It will be
owned by root with its setuid bit set. When an ordinary user executes it, the effective user
id of this program will be its owner (root). Therefore the students can use VTA without
root access. The setuid program will return a packet to the user only if the real UID of the
packet capturing process (the ordinary user) is the same as the owner of the socket for
which the packet is destined (or from which it originated)[1].
UNIX provides two sets of identifications for processes. The first set is the real user
identification (UID) and group identification (GID), indicating the real user of the process.
The other one is the effective UID and GID, indicating what rights the process has. A
process that changes its UID is called a setuid program; a program that changes its GID is
called a setgid program. When the setuid bit is set, the effective UID of the process will be
25
that of the owner of the file, not that of the real user executing the file. If the setuid bit is
not set, then the effective UID of the process will be that of the real user executing the file.
Setuid programs can let ordinary users perform functions that they could not perform
otherwise. For example, every user may need to run the passwd program to change his
password. This requires changing of the password field in the /etc/passwd file. However,
only root can view and change this file, because if an ordinary user can, he may view and
change other users' passwords! To get around this problem, the passwd program should be
a setuid program owned by root. When an ordinary user runs it, its effective UID becomes
the owner of the file, which is root. So the ordinary user can change his own password.
The passwd program is written in such a way that the user can only access his own
password field, not other users' fields. This can prevent a user from knowing or changing
other users' passwords.
In VTA, we are using the same idea. The program dealing with packet capture will be a
separate setuid program owned by root. When an ordinary user runs VTA, he will be able
to set the network card into promiscuous mode, but only the packets belonging to him are
returned to VTA for display. Other packets will not be returned to him. So a user cannot
access other users' packets, although he doesn’t need root access to monitor his own
traffic. This will enable students to run VTA without being given root access.
6.2 System Call Wrapper
To enable a student to keep track of his network program, VTA should be able to provide
a way to monitor a specific user process. However, a student doing network programming
26
may run numerous other network applications on his machine at the same time his own
program is running. So even though the setuid program can return only the user's own
packets, it is still hard to tell which network application the packet is generated from or
sent to. To catch specific traffic, the user has to know the IP address and port numbers of
the application process in advance (or he can close off all other network connections).
However, this is not convenient, as sometimes, the student must (use the WILDCARD
option and) let the kernel decide the IP address and port numbers for the application. He
then will not know the socket information before he runs the program.
Thus, we plan to write some socket wrapper functions and record the information needed
to monitor sockets belonging to a specific user application. The socket information we
need is decided by the socket system calls, such as bind, connect, accept, etc. System calls
provide ways for user applications to access the operating system kernel. To invoke a
system call on the Linux operating system, the user calls a wrapper function (such as
socket()) that writes its arguments and the number of the system call to a defined transfer
register and then triggers the 0x80 interrupt [17]. In Linux, the interrupt 0x80 is reserved
for system calls. The return value of the interrupt service routine is placed in the defined
transfer register. When the interrupt service routine returns, the return value is read and
the wrapper function ends.
Usually, the wrapper functions are implemented in the standard C library. To record the
information we need, we plan to provide our own library of wrapper functions for the
system calls in socket programming. This may include bind, connect, accept, sendto, recvfrom,
etc. To use these wrappers, the student links his codes to our library. Then each time these
27
socket system calls are made, the socket information (<IP address, port number>) will be
recorded to a file, which VTA will use to know which socket it should monitor. This will
enable VTA to monitor a specific application process without requesting the user to shut
down all other network connections or knowing IP address and port numbers in advance.
6.3 Socket List
It would be convenient for the user of VTA to know how many sockets are currently
active before he starts to capture packets. With the list of current active sockets and the
corresponding Unix Process Identifier (PID)/program name, he can then select the specific
one he wants to monitor. So the future VTA will provide the user a list of current active
sockets, from which the user can select sockets in which he is interested. Then VTA will
return only those packets associated with the selected sockets.
6.4 Connection Based Contents View
Currently VTA provides packet views. Users can see the ASCII and binary information in
each packet captured by selecting a specific packet. However, it would be nice for the user
to see the overall content view by selecting a connection. For example, node 1 <IP1, port1>
sends a message “Where are you?” (packet 1) to node 2<IP2, port2>, which responds with
“I am in room 232. Come here.” Assume the messages “I am in room 232.” and “Come
here.” are encapsulated as packet 2 and 3 separately. Within the current version of VTA,
the user must make three operations of selecting packet 1, 2 and 3 to view the whole
communication. However, with the overall content view, by one operation of selecting the
connection <IP1, port1, IP2, port2>, the user can easily see the complete communication
between these two machines. Thus to release the user from reorganization of packet
28
contents, we plan to add a connection based contents view. Each connection will be
identified by a pair of sockets <IP address1, port number1, IP address2, port number 2>.
6.5 Save Real-time Network Data
VTA can be operated in two modes: real-time or off-line. In off-line mode, VTA will read
data from a file. In real-time mode, VTA will capture packets in real-time from the
network. The original version of VTA can be run in both modes. When in off-line mode, it
can read trace files produced by Tcpdump [4]. However, in real-time mode, it cannot save
captured data and produce its own trace files. If a user does a real-time run, he cannot
repeat the operation unless he recreates exactly the same network condition and restarts
the whole capture process again. The new VTA package will provide the user a way to
save the captured real-time data into a file, so that an operation can be saved and repeated
easily.
6.6 User Wizard
Usage of VTA requires the user to perform a series of operations in a specific order. For
example, the user must set the protocol filter before capturing packets. The views must be
open before capturing as well. To help the user use VTA correctly, we plan to provide a
user wizard. The wizard will guide the user through the setup stages and ensure VTA is
running in a correct manner.
29
7. Summary
Network monitoring and protocol analysis are important for network programmers and
system administrators. Network protocol education also requires students to gain a good
understanding of protocol design issues such as layered protocol structure, data
encapsulation, packet header format, etc. To serve these needs, we initiated development
of VTA. The original version of VTA can provide five types of views, illustrati ng details of
TCP/UDP protocol execution. Subsequent usage has demonstrated a need for
improvement. The new version aims at providing a more handy and powerful tool for
users. It will let the user consult the current active sockets on his system, selecting those
sockets of special interest from the list and capture only those packets passing through
these sockets. It will also allow an ordinary user without root access to be able to execute
and monitor a specific application process, then capture and analyze those packets
associated with that process. The user will be allowed to save captured data into a disk
file. With the newly added features, VTA will be a useful tool for network protocol
education, network monitoring, and network program debugging.
30
References
[1] P. Chen, R. Ge, Y. Ma, J. Mayo, Y. Zhang, and C. Zhao, "A TCP/UDP Protocol
Visualization Tool: Visual TCP/UDP Animator (VTA)". Technical report, 01-10,
Computer Science Department, Michigan Technological University, 2001.
[2] L. Breslau et al., "Advances in Network Simulation", Computer, May 2000, pp 59-67.
[3] D. Estrin, M . Handley, J. Heidemann, S. McCanne, Y. Xu, and H. Yu, "Network
Visualization with the Nam, VINT Network Animator", Computer, Nov. 2000, pp. 6468.
[4] V. Jacobson and S. McCanne, "The Tcpdump Manual Page", Lawrence Berkeley
Laboratory, Berkeley, CA, June 1989.
[5] Windump Group, "Windump User Manual", 2001
[6] Ethereal Group, "Ethereal User Manual", 2000
[7] S. Ostermann, "TCPTrace User Manual", 2000
[8] Trolltech Company, "Qt Reference Manual (version 2.3.0)", 2001
[9] R. Stevens, "UNIX Network Programming, Volume I", Prentice-Hall, 1998.
[10] T. Oetiker and D. Rand, "Mrtg: The multi router traffic grapher".
http://www.mrtg.org/, 2001
[11] Java, "G. P. Iptraf - an ip network monitor", http://cebu.mozcom.com/riker/iptraf/ ,
2001
[12] B. Barr, S. Yoo, and T . Cheatham. "Network Monitoring System Design", Proc.
SIGCSE 1998.
[13] A. S. Tanenbaum, "Computer Networks", Third Edition, 1996, Prentice Hall.
[14] RFC 793: TCP Specification, http://www.ietf.org/rfc/rfc0793.txt
31
[15] RFC 768: UDP Specification, http://www.ietf.org/rfc/rfc0768.txt
[16] RFC 791: IP Specification, http://www.ietf.org/rfc/rfc0791.txt
[17] M . Beck, H. Böhme, etc. "Linux Kernel Internals", First Edition, 1996, Addison-Wesley
Longman Limited, England.
32