1
Advanced Process Control
Profit Suite
Toolkit
Rev 2.0
5/01
AP09-300
Advanced Process Control
Profit Suite
ToolKit
Revision 2.0
5/01
AP09-300
Copyright, Notices, and Trademarks
Copyright 2001 by Honeywell International Inc.
While this information is presented in good faith and believed to be accurate, Honeywell
disclaims the implied warranties of merchantability and fitness for a particular purpose and
makes no express warranties except as may be stated in its written agreement with and for
its customer.
In no event is Honeywell liable to anyone for any indirect, special or consequential
damages. The information and specifications in this document are subject to change without
notice.
Profit, TDC 3000, and TotalPlant are registered trademarks of Honeywell International Inc.
Other product names are trademarks of their respective owners.
Honeywell
Industrial Automation and Control
16404 N. Black Canyon Hwy
Phoenix, AZ 85053
ii
Profit Suite Toolkit
Honeywell Inc.
5/01
Table of Contents
TABLE OF CONTENTS ...........................................................................................................III
ABOUT THIS PUBLICATION.................................................................................................. XI
Statement of Work .................................................................................................... xi
How This Book Is Organized ..................................................................................... xi
Writing Conventions Used in This Book ................................................................... xii
REFERENCES....................................................................................................................... XIII
Documentation..............................................................................................................xiii
Open ..........................................................................................................................xiii
TPS System .................................................................................................................xiii
Embedded Uniformance..................................................................................................xiii
FOR TECHNICAL ASSISTANCE.......................................................................................... XIV
If You Need Assistance ........................................................................................... xiv
International Customers .......................................................................................... xiv
Customers Inside the United States ........................................................................ xiv
Arizona Customers .................................................................................................. xiv
Services Provided.................................................................................................... xiv
Time Saving Tip....................................................................................................... xiv
SECTION 1 TDC DATA CONVERTER ...................................................................................3
1.1 Overview......................................................................................................................3
In This Section............................................................................................................3
Version and Installation Information ...........................................................................3
What TDC Data Converter Does................................................................................3
Files Used to Convert a TDC File...............................................................................4
Sampling Frequency...................................................................................................4
1.2 Procedure...................................................................................................................5
Preparing to Use the TDC Data Converter.................................................................5
Using TDC Data Converter.........................................................................................5
Selecting Files ............................................................................................................6
Selecting the Point Type.............................................................................................6
Completion .................................................................................................................7
Stopping the Conversion before Completion..............................................................7
SECTION 2 --- DATA COLLECTOR .....................................................................................11
2.1 Overview.....................................................................................................................11
In This Section..........................................................................................................11
Purpose of the Data Collector ..................................................................................11
Parameters Limitations.............................................................................................11
Data Collection Information Flow..............................................................................11
5/01
Profit Suite Toolkit
Honeywell Inc.
iii
Table of Contents
Archived Data Files .................................................................................................. 12
Multi-Point Data Files ............................................................................................... 13
Example File ............................................................................................................ 13
2.2 Installation................................................................................................................. 14
Media Contents .......................................................................................................... 14
Backing Up the Media .............................................................................................. 15
Task 1 - Compile the CDS Package ........................................................................ 15
Task 2 - Build the Collector Point............................................................................. 16
Example of DCPTS.EB Editing ................................................................................ 17
Task 3 - Load the External Load Modules ............................................................... 18
Task 4 - Shutdown and Load the AM....................................................................... 19
Task 5 - Link CL Blocks to COLLECT point............................................................. 19
Task 6 - Compile the DC graphic............................................................................. 19
Initial Action............................................................................................................. 20
2.3 Graphics Interface Familiarization ............................................................................ 21
Overview .................................................................................................................. 21
2.4 Point Setup .............................................................................................................. 24
Point Setup............................................................................................................... 24
2.5 Collection Setup........................................................................................................ 26
Collection Setup ....................................................................................................... 26
2.6 Operation ................................................................................................................. 27
Overview .................................................................................................................. 27
Starting a Collection Cycle ....................................................................................... 27
Suspending a Collection Cycle ................................................................................ 27
Resuming a Collection Cycle ................................................................................... 27
Terminating a Collection Cycle ................................................................................ 27
Deactivation of the Data Collector............................................................................ 28
Status Indications..................................................................................................... 28
2.7 Point Structure ......................................................................................................... 29
Overview .................................................................................................................. 29
Point Parameters ..................................................................................................... 29
2.8
Customizing the Data Collector .............................................................................. 32
Changing the Collector Frequency........................................................................... 32
Adding Another Data Collector................................................................................. 32
Storing Sets of Points to a File................................................................................. 33
2.9
Known Data Collector Problems ............................................................................. 34
Foreground code configuration error ....................................................................... 34
Background code configuration error....................................................................... 34
SECTION 3 STEP TEST BUILDER ...................................................................................... 38
3.1 Overview ................................................................................................................... 38
Overview .................................................................................................................. 38
iv
3.2 Off-Line Signal Generator ........................................................................................ 39
Profit Suite Toolkit
5/01
Honeywell Inc.
Table of Contents
Overview...................................................................................................................39
3.2.1 Introduction to the Signal Generator .....................................................................40
Philosophy ................................................................................................................40
Features ...................................................................................................................41
Background ..............................................................................................................41
Signals ......................................................................................................................43
PRBS Sequence.......................................................................................................44
Schroeder Sequence................................................................................................45
3.2.2. Getting Started ......................................................................................................47
Installing the Signal Generator .................................................................................47
3.2.3. Starting a Signal Session ......................................................................................48
To Open an Existing Signal Session ........................................................................48
To Save a .sig File....................................................................................................48
Creating a New Signal Session ...............................................................................49
Example Explained...................................................................................................49
Parameter Specification ...........................................................................................50
Variable Descriptors .................................................................................................50
Variable Type............................................................................................................51
Sample Time ............................................................................................................51
Signal Form ..............................................................................................................52
Settle T .....................................................................................................................52
Amplitude..................................................................................................................53
Time of Sig. Insert ....................................................................................................53
Cycles .......................................................................................................................53
Signal Types .............................................................................................................54
3.2.4 Signal Synthesis and Evaluation ...........................................................................56
Overview...................................................................................................................56
Step Test Signal .......................................................................................................56
Evaluate the Results.................................................................................................57
Single graph Data Plots ............................................................................................58
Selecting Data for Deletion.......................................................................................59
Correlation ................................................................................................................59
Interpretation of the Correlation Plots.......................................................................60
Edit Data...................................................................................................................61
Signal Export ............................................................................................................63
LCN File Format .......................................................................................................63
Free File Format .......................................................................................................65
3.3
5/01
Automated Step Tester ...........................................................................................66
About this Section.....................................................................................................66
LCN Hardware and Software Requirements ............................................................66
Preparation and Installation......................................................................................67
CDS Installation........................................................................................................67
Building a Step Testing Point ...................................................................................68
Configuration Graphics Installation...........................................................................69
Automated Step Tester Program Architecture .........................................................69
Profit Suite Toolkit
Honeywell Inc.
v
Table of Contents
Point Structure ......................................................................................................... 70
Process Inputs ......................................................................................................... 70
Configuration Inputs (STEP2CDS) ................................................................................. 70
Calculation Outputs.................................................................................................. 70
Configuring an Automatic Step Test Application...................................................... 71
Note – Link Errors .................................................................................................... 71
Point Config Using Graphic STEP_TST .................................................................. 71
STEP_TST Targets Explained................................................................................. 72
Application Configuration through Direct CDS Entry................................................ 72
Configuration Parameters ........................................................................................ 72
Loading the Step Test Coefficients .......................................................................... 73
Link CL Programs .................................................................................................... 73
On-line Error Messages ........................................................................................... 74
SECTION 4 — GAIN SCHEDULER........................................................................................ 78
4.1 Overview .................................................................................................................. 78
Definition .................................................................................................................. 78
Application................................................................................................................ 78
Acronym List ............................................................................................................ 78
Hardware and Software Requirements.................................................................... 78
4.2 Software Description................................................................................................. 79
Overview .................................................................................................................. 79
Software Structure ................................................................................................... 79
Software Supplied .................................................................................................... 79
Software Installation................................................................................................. 79
Configuration............................................................................................................ 80
Limitations ................................................................................................................ 81
Trouble Shooting...................................................................................................... 81
4.3 Error Messages ........................................................................................................ 82
SECTION 5 ---- PERFORMANCE MONITOR ........................................................................ 86
5.1 Overview ................................................................................................................... 86
Definition .................................................................................................................. 86
Application................................................................................................................ 86
Calculation ............................................................................................................... 86
Purpose.................................................................................................................... 86
Hardware and Software Requirements.................................................................... 86
5.2 Detailed Description.................................................................................................. 87
Overview .................................................................................................................. 87
Point Structure ......................................................................................................... 87
Process Inputs ......................................................................................................... 87
Configuration Inputs ................................................................................................. 88
RPRF_CDS.............................................................................................................. 88
Calculation Outputs.................................................................................................. 88
Calculation Outputs.................................................................................................. 89
vi
Profit Suite Toolkit
Honeywell Inc.
5/01
Table of Contents
5.3 Installation Procedure................................................................................................91
Overview...................................................................................................................91
Preliminary Requirement ..........................................................................................91
Task 1 Prepare for Installation ...............................................................................91
Task 2 CDS & PL Installation .................................................................................91
Set volume pathnames ................................................................................................91
Compile Param List RPRF_PL.CL ...............................................................................92
Compile CDS Param RPRF_CDS.CL ...........................................................................92
Task 3 Building Performance Monitoring Point ......................................................92
Task 4 Configuration Graphics Installation..............................................................93
Note on verification of the graphics ..........................................................................93
Task 4.......................................................................................................................94
Continued .................................................................................................................94
5.4 Configuring a Monitoring Application.........................................................................96
Overview...................................................................................................................96
Setup of the Calculation Point ..................................................................................96
Point Configuration Using Graphic RMPC_PRF ......................................................97
Link CL Programs ............................................................................................................98
Point Configuration Using Graphic RMPC_PRF ......................................................98
Application Configuration through Direct CDS Entry ................................................99
5.5 Overview of the RMPCT Monitor Displays ..............................................................100
Application Overview ..............................................................................................100
MV Limit Information ..............................................................................................101
MV Statistic Information..........................................................................................102
MV Averages and Standards Deviations................................................................103
CV Limit Information...............................................................................................104
CV Model Statistic Information ...............................................................................105
CV Statistic Information ..........................................................................................106
CV Averages and Standards Deviations ................................................................107
5.6 Viewing Different Monitoring Points ........................................................................108
Overview.................................................................................................................108
View Specific Monitor Applications .........................................................................108
5.7 Monitoring Reports and Filenames .........................................................................109
Viewing or Altering the Report Filename ................................................................109
Changing the Displayed Monitor.............................................................................109
Path Filenames.......................................................................................................109
Examples of File Pathnames..................................................................................109
5.8 Configuring the Reporting Frequency .....................................................................110
Viewing or Altering the Reporting Frequency .........................................................110
Monthly Reports......................................................................................................110
Days Reports ..........................................................................................................110
Initializing Averages, Standard Deviations, and Percentages ................................110
Definition of Standard Deviation .............................................................................110
5.9 Monitoring Re-Configuration ...................................................................................111
Configuration Check ...............................................................................................111
5/01
Profit Suite Toolkit
Honeywell Inc.
vii
Table of Contents
Configuration Based on Two Events..................................................................... 111
Viewing the Progress of the Configuration Checks................................................ 111
5.10 Spot Reports ......................................................................................................... 112
Requesting Spot Reports ....................................................................................... 112
Generating Spot Reports ....................................................................................... 112
5.11 Appendix -- Error Codes ....................................................................................... 113
Overview ................................................................................................................ 113
Configuration/ Initialization ..................................................................................... 113
Configuration/ Initialization ..................................................................................... 114
Controller Information Error Codes ........................................................................ 114
MV Information Error Codes .................................................................................. 115
CV Information Error Codes................................................................................... 116
MV Reporting File Error Codes .............................................................................. 117
MV Reporting File I/O Error Codes ........................................................................ 118
CV Reporting File Error Codes .............................................................................. 119
CV Reporting File I/O ............................................................................................. 120
Error Codes............................................................................................................ 120
Software License Error Codes ............................................................................... 120
SECTION 6 — RMPCT CASCADE....................................................................................... 124
6.1 Overview ................................................................................................................. 124
In This Section ....................................................................................................... 124
Requirements......................................................................................................... 124
6.2 Detailed Description................................................................................................ 125
Configuration Change Summary............................................................................ 125
6.3 Installation Procedure ............................................................................................. 127
Preparation for Installation ..................................................................................... 127
6.4 Configuring the RMPCT Points............................................................................... 129
MV/CV Pairs........................................................................................................... 129
Point Configuration................................................................................................. 129
6.5 RMPCT Cascade Operation ................................................................................... 131
To initiate an MV to CV cascade:........................................................................... 131
6.6 To Break an MV to CV Cascade............................................................................. 133
Primary Controller .................................................................................................. 133
Primary Controller MV Summary Display............................................................... 133
Secondary Controller ............................................................................................. 134
Secondary Controller CV Summary Display .......................................................... 134
SECTION 7 —PV VALIDATION ........................................................................................... 138
7.1 Overview ................................................................................................................. 138
Definition ................................................................................................................ 138
Application.............................................................................................................. 138
Incentive................................................................................................................. 138
viii
Profit Suite Toolkit
Honeywell Inc.
5/01
Table of Contents
Acronym List...........................................................................................................138
Hardware and Software Requirements ..................................................................138
7.2 Installation Procedure..............................................................................................139
7.3 Preparation for Installation ......................................................................................140
CDS Installation......................................................................................................140
7.4 Building / Reconfiguring the AM Regulatory Point...................................................141
RMPCT Applications ..............................................................................................141
Non-RMPCT Applications.......................................................................................141
7.5 Detailed Description ................................................................................................142
Overview.................................................................................................................142
Point Structures ......................................................................................................142
Custom Data Segments .........................................................................................143
7.6 System Configuration ...............................................................................................145
7.7 AM Regulatory Point Configuration (Direct CDS Entry) ..........................................146
7.8 Linking CL Programs...............................................................................................147
Linking RMPCT Applications ..................................................................................147
Linking
Non-RMPCT Applications ....................................................................147
7.9 PV Validation Operation ..........................................................................................148
Overview.................................................................................................................148
Validation errors that clear automatically................................................................148
Validation errors that the user must clear...............................................................148
Using PV Validation in conjunction with RMPCT CV Interface Point .....................148
7.10 Appendix - Error Codes.........................................................................................149
Bad Value Error Codes...........................................................................................149
Diagnostic Error Codes ..........................................................................................150
SECTION 8 — SIMULATION BACKBUILDER.....................................................................154
8.1 Overview..................................................................................................................154
Definition.................................................................................................................154
Application ..............................................................................................................154
Calculation..............................................................................................................154
Acronym List...........................................................................................................154
Hardware and Software Requirements ..................................................................155
8.2 Detailed Description ................................................................................................156
Overview.................................................................................................................156
Point Structure........................................................................................................156
Process Inputs........................................................................................................156
Configuration Inputs ...............................................................................................156
Calculation Outputs ................................................................................................156
8.3 Error Codes .............................................................................................................157
Array Index Location Error Codes ..........................................................................158
5/01
Profit Suite Toolkit
Honeywell Inc.
ix
Table of Contents
8.4 Installation Procedure .............................................................................................. 159
Preparation for Installation ..................................................................................... 159
CDS and PL Installation ......................................................................................... 159
8.5 Building a Simulation BackBuilder Point ................................................................. 160
Steps to Build the Point.......................................................................................... 160
Application Configuration through CDS Entry ........................................................ 160
Linking CL Programs ............................................................................................. 161
Setting the Path and File Name ............................................................................. 161
Generating Settings Files....................................................................................... 162
Back-Building Different RMPCT Controllers .......................................................... 162
CV Information Captured ....................................................................................... 163
MV Information Captured....................................................................................... 163
x
Profit Suite Toolkit
Honeywell Inc.
5/01
About This Publication
Statement of Work
How This Book Is
Organized
The following table describes the audience, purpose, and scope of this book:
Purpose
This book is a combination of many different tools.
Audience
Process and control engineers
The following table summarizes what each section in this book tells you about
this publication and about the Profit Suite Toolkit.
In This Section
You Can Find This Information
About This Publication
(You are here)
Moved - Model Converter
•
How to make the best use of this book, and how the
information is ordered.
•
What information you can find in the different sections.
•
What writing conventions have been used throughout this
book and the Profit library.
How to convert controller models to Profit Controller format.
see Profit Controller (RMPCT)
Designer’s Guide
Section 1 TDC Data Converter
How to take PV retrieval data and make it compatible with
RMPCT.
Section 2 Data Collector
(Optional Item) – How to collect TPS data for use in RMPCT.
Section 3 Step Test Builder
(Optional Item) – How to design and implement automated step
testing
Section 4 Gain Scheduler
(Optional Item) – How to automatically update gains in an
RMPCT controller.
Moved - (RMPCT Point
Builder)
How to build the points necessary to create a Profit Controller
(RMPCT) application.
see Profit Controller (RMPCT)
Designer’s Guide
5/01
Section 5 Performance
Monitor
(Optional Item) – How to monitor statistical performance of
RMPCT.
Section 6 RMPCT Cascade
(Optional Item) – How to cascade the setpoint of a MV interface
point in a primary RMPCT controller to the setpoint of a CV
interface point in a secondary RMPCT controller.
Section 7 PV Validation
(Optional Item) – How to setup PV (Process Value) Validation for
of an input process value.
Section 8 Simulation
BackBuilder
(Optional Item) – How to capture DCS controller tuning and
configuration.
Profit Suite Toolkit
Honeywell Inc.
xi
About this Publication
Writing
Conventions Used
in This Book
xii
The following writing conventions have been used throughout this book and other
books in the Profit Suite library.
•
Words in double quotation marks " " name sections or subsections in this
publication.
•
Words in italics name book titles, add grammatical emphasis, introduce
words that are being referenced or defined, or represent mathematical
variables. The context makes the meaning and use clear.
•
Words in bold type indicate paragraph topics or bring important phrases to
your attention.
•
Shading brings paragraphs and table entries to your attention.
•
Windows pull down menus and their options are separated by an angle
bracket >. For example, Under Settings> Communications, set the baud rate.
•
Messages and information that you type appear in Courier font.
•
Acronyms, Scan parameters, point names, file names, and paths appear in
UPPERCASE. The context makes the meaning and use clear.
•
Command keys appear in UPPERCASE within angle brackets. For example,
press <ENTER>.
•
TPS user station touch-screen targets appear in rounded boxes. For example,
touch
MODIFY NODE .
•
Graphic buttons appear in UPPERCASE within brackets [ ]. For example,
touch [TAG].
•
Point-dot-parameter means a point name and one of its parameters. For
example, point-dot-SP means the SP parameter for the point.
•
Zero as a value and when there is a chance for confusion with the letter O is
given as Ø. In all other cases, zero as a numerical place holder is given as 0.
For example, 1.0, 10, 101, CVØ1, parameter PØ.
•
The terms screen and display are used inter changeably in discussing the
graphical interfaces. The verbs display a screen and call a screen are also used
inter changeably.
•
These names, and may be used interchangeably.
Former Name
Product Name
RMPCT
Profit Controller
DQP
Profit Optimizer
APC Development Environment or APCDE
Profit Design Studio
RPID
Profit PID
Profit Suite Toolkit
Honeywell Inc.
5/01
References
The following comprise the Profit Suite library.
Documentation
Title
General
Number
Profit Controller (RMPCT) Concepts Reference
Profit Controller (RMPCT) Designer’s Guide (Off-Line Design)
Profit Optimizer Designer’s Guide (Off-Line Design)
Profit Toolkit Designer’s Guide
APC Identifier User’s Guide
Profit-PID (RPID)
Profit Sensor User’s Guide
RM09-400
RM11-410
PR11-400
AP11-400
AP09-200
RM11-100
PS09-100
Open
Profit Suite Installation Guide for Open Systems
Viewer - Controller - Optimizer - Toolkit
Profit Controller (RMPCT) User’s Guide for Open Systems
Profit Optimizer User’s Guide for Open Systems
Profit Trender User’s Guide
Profit Toolkit User’s Guide for Open Systems
Profit Toolkit Function Reference
FCCU Toolkit User’s Guide for Open Systems
Fractionator Toolkit User’s Guide for Open Systems
Lab Update User’s Guide
Wrapper Builder User’s Guide
Profit Bridge User’s Guide
RM20-501
RM11-401
PR11-421
RM11 431
AP11-401
AP11-410
AP13-201
AP13-101
AP13-111
AP11-411
AP20-401
TPS System
Profit Controller (RMPCT) Installation Reference for AM, AxM and Open LCN-Side
Profit Controller (RMPCT) Commissioning
Profit Controller (RMPCT) User’s Guide for AM, AxM and Open LCN-Side
Profit Optimizer Installation Reference for AM and Open LCN-Side
Profit Optimizer User’s Guide for AM and Open LCN-Side
Profit Suite ToolKit
TDC Data Converter
Data Collector
Step Test Builder
Performance Monitor
RMPCT Cascade
PV Validation
RM20-400
RM20-410
RM11-400
PR20-400
PR11-420
AP09-300
Simulation BackBuilder
Gain Scheduler
Fractionator Toolkit (LCN)
FCCU Toolkit (LCN)
Furnace Pass Balance Temperature Control User’s Guide
Non-Linear Level Control User’s Guide
AP13-100
AP13-200
AP13-600
AP09-700
Embedded Uniformance
Excel Companion User’s Guide (Profit Embedded PHD)
Power Point Companion User’s Guide (Profit Embedded PHD)
Process Trend User’s Guide (Profit Embedded PHD)
5/01
Profit Suite Toolkit
Honeywell Inc.
AP20-510
AP20-520
AP20-530
xiii
For Technical Assistance
If You Need
Assistance
If you need technical assistance, contact your local Honeywell Service
Organization, as explained in the following paragraphs.
International
Customers
Outside of the United States, contact your local Honeywell Service Organization.
If you are not sure of the location or telephone number, call your Honeywell
representative for information.
Customers Inside
the United States
Within the United States, call the Technical Assistance Center (TAC) at the toll
free number 1-800-822-7673.
Arizona
Customers
Within Arizona, the local number for TAC is 602-313-5558.
Services Provided
Calls to TAC are answered by a dispatcher from 7:00 A.M. to 5:00 P.M.,
Mountain Standard Time (6:00 A.M. to 4:00 P.M. when daylight savings time is in
effect).
Outside of these hours, emergency calls—those which affect your ability to control
or view a process—will be received by an answering service, and returned within
one hour. TAC maintains its own TPS network, and frequently can duplicate
problems on this equipment.
Time Saving Tip
xiv
It is a good idea to make specific notes about the problem before making the call.
This helps to reduce delays and expedite answers.
Profit Suite Toolkit
Honeywell Inc.
5/01
TDC Data
Converter
(Optional Item)
5/01
TDC Data Converter
Profit Suite Toolkit
Honeywell Inc.
1
For Technical Assistance
1.1 Overview
2
TDC Data Converter
Profit Suite Toolkit
Honeywell Inc.
5/01
Section 1 TDC Data Converter
1.1 Overview
In This Section
This section explains how to use the TDC Data Converter tool. The files created
by it can be used as inputs to the Identifier.
Read this document to find out how to:
Version and
Installation
Information
Install your TDC Data Converter.
Use Process Variable Retrieval and Virtual Printers on the LCN to create an input
file for the PC.
Create RMPCT PNT files from your TDC Virtual Printer files.
Create Excel spreadsheet files from your TDC Virtual Printer files.
Select whether your points are MVs, DVs, or CVs.
Stop the conversion before it is completed.
TDC Data Converter functionality was introduced in version 110.00 of the APC
Development Environment.
The TDC Data Converter is included in the standard installation of Profit Design
Studio (APCDE). See Profit Controller Designer’s Guide for installation
instructions. When the Profit Design Studio is started, note that the TDC Data
Converter is “checked” in the “About Box.”
What TDC Data
Converter Does
You can configure the TDC to output to a file instead of the printer by
configuring the system for “virtual printers.” By using the standard print
command and specifying the virtual printer, you can write your data to a file in
ASCII format. Using this mechanism together with the LCN’s Process Variable
Retrieval functionality, you create an input file that is transported to the PC.
Note: This tool assumes that the sampling rate of the data is one minute.
The TDC Data Converter converts your input file into multiple PNT files. PNT
files are single point data files that can be used in the Identifier to create an RPID
or Profit Controller (RMPCT) model. An Excel-formatted spreadsheet is also
created as the output file.
5/01
TDC Data Converter
Profit Suite Toolkit
Honeywell Inc.
3
Section 1 TDC Data Converter
1.1 Overview
Files Used to
Convert a TDC File
Your input file is a TDC virtual printer file from the LCN that was created as
output of a Process Variable Retrieval session. This is an ASCII text file,
typically ending with a one-or-two-character extension starting with x, y, or z
(e.g., DATA1.XT). However, the TDC Data Converter makes no assumptions
about the input file extension. It may be any legal “Windows” filename.
Your output file will be an Excel spreadsheet file. By default, the output file
will be created in the same directory as the input file and will have the same
name but with an “xls” file extension (e.g., DATA1.xls). You may override the
default with any legal “Windows” filename you prefer.
PNT files are created in the same directory as the input file and their filenames
are taken from the point names in the input file. They follow the naming
convention , pointname.pnt for an up-to-8 character point name (e.g.,
TIC60010.PNT). Names longer than 8 characters are truncated.
Sampling
Frequency
4
This tool assumes that the sample rate at which the data was taken is one minute
TDC Data Converter
Profit Suite Toolkit
Honeywell Inc.
5/01
Section 1 TDC Data Converter
1.2 Procedure
1.2 Procedure
Preparing to Use
the TDC Data
Converter
To use the TDC Data Converter, you must prepare your input file on the LCN.
First, create a virtual printer on the TDC and configure the system to recognize it.
For details, refer to the book Implementation: Startup & Reconfiguration,
Report to Output File (TDC 2030-2 section 32) or the equivalent book for your
release of the LCN.
Then, from the Engineering Personality Main Menu, select System Menu. From
the System Menu, select Process Variable Retrieval. Note that the TDC Data
Converter assumes a one minute sampling rate. Choose the type of retrieval, the
points or group that you wish to capture, and then select Print. The system will
ask you for a printer number and this is where you enter the virtual printer file
that you configured. This file will be used on the PC as your input file. For
details on Process Variable Retrieval, refer to the book Operation: Process
Operations, Obtaining Process Histories: Logs, Reports, Journals (TDC 2050
section 10) or the equivalent book for your release of the LCN.
Your virtual printer file can be moved to the PC using a number of different
methods, including Text File Converter, File Link, or by dumping to the PC using
Windows terminal emulation.
Using TDC Data
Converter
To start the APC Development Environment, click on the icon labeled APCDE
that was installed in the Windows Program Manager.
Select TDC Data Converter from the Tools menu.
This action brings up the TDC Data Converter dialog box. If the TDC Data
Converter selection is “grayed out” under the Tools menu, then it probably has
not been installed correctly. Be sure to install the TDC Data Converter in the
same directory as the APCDE.
Errors and information about the progress of your conversion will be written into
the APCDE Messages window.
5/01
TDC Data Converter
Profit Suite Toolkit
Honeywell Inc.
5
Section 1 TDC Data Converter
1.2 Procedure
Selecting Files
From the TDC Data Converter dialog box, type your input filename or select it
using the input Browse button. If you use the Browse button, the tool will
automatically set a default output name for you.
Then, select your output filename by typing it, selecting it with the output Browse
button, or just accepting the default.
When you are satisfied with your entries, click on the Convert button. You may
also cancel at anytime by using the Cancel button.
Selecting the
Point Type
6
You must specify whether each point listed in your input file is a Manipulated
Variable (MV), Disturbance Variable (DV), or Controlled Variable (CV). For
each point found in the input file, a “Select Point Type” dialog box will pop up.
TDC Data Converter
Profit Suite Toolkit
Honeywell Inc.
5/01
Section 1 TDC Data Converter
1.2 Procedure
Choose the type for the given point, and click the OK button.
Completion
While the TDC Data Converter executes, it writes to the Messages window much
like other APCDE functions do. It will write the date and time it started and
ended, the input filename, the output filename, the date and time the data
collection started, and all the PNT filenames.
If the tool is unable to complete successfully, you will receive a message in the
Messages window. Error messages are usually due to a bad input file or because
the user stopped it before completion.
Stopping the
Conversion before
Completion
5/01
You have the option of stopping the conversion during execution. Do so by
pressing the Stop button on the TDC Data Converter dialog box. You will then
be asked for confirmation. If you select Cancel, the program will continue
execution from where it stopped. If you select OK, the conversion will stop and
an error message will be written to the Message window saying that the execution
was “Stopped by user.” Then the data conversion will be terminated without
saving any results.
TDC Data Converter
Profit Suite Toolkit
Honeywell Inc.
7
Section 1 TDC Data Converter
1.2 Procedure
8
TDC Data Converter
Profit Suite Toolkit
Honeywell Inc.
5/01
Data Collector
(Optional Item)
5/01
Data Collector
Profit Suite Toolkit
Honeywell Inc.
9
10
Data Collector
Profit Suite Toolkit
Honeywell Inc.
5/01
Section 2 --- Data Collector
2.1 Overview
In This Section
Purpose of the
Data Collector
The data collector is a set of AM programs, builder files, and graphics which
allows numerical process data to be stored in a file.
The data collector package is an engineering tool, designed to periodically collect
numeric values from the LCN and store them in a file on the LCN History
Module (HM). The file is specifically formatted for use with the RMPCT
identifier. The files can also be read and modified by PC packages such as
EXCEL, Word, etc.
The data collector graphics supply an easy means of specifying the data to be
collected, monitoring the current values of the data, and of monitoring,
debugging, and controlling the archiving of the data.
Parameters
Limitations
Up to fifty real parameters {process variables (PV), setpoints (SP), outputs (OP),
or outputs in engineering units (OPEU) in any mix} can be stored by each data
collection point.
The data collector can only be configured to collect the PV, SP, OP, or OPEU of
a point. Should a parameter other than these be required, a data acquisition point
should be built which executes before the data collector and brings the desired
parameter into the PV of the point.
Data collection of a large number of parameters(more than 10) should be
performed slowly (period >= 1MIN) or on multiple data collectors. The number
of parameters which can successfully be stored at a fast scan rate depends upon
the AM loading and HM communications traffic. History module access limits
the speed at which data can be stored.
Data Collection
Information Flow
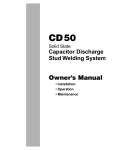
The collection and storage of the data to an HM file (referenced in Figure 1 as .
XX Files) is performed by an AM resident custom point. Numeric data from the
LCN is collected by a foreground AM program and stored in a buffer along with
a timestamp on the data collector point. When one buffer is filled that buffer is
marked as full, and data is stored to the other buffer. If a buffer is full, the data
from that buffer is written to the HM file, after which that buffer is marked as
empty.
When a new file is created by the data collection point the header data is written
to the file. This data consists of tagname, parameter, descriptor, engineering
units, date, and variable type (Manipulated/Controlled/Disturbance).
5/01
Data Collector
Profit Suite Toolkit
Honeywell Inc.
11
Section 2 --- Data Collector
2.1 Overview
When data collection is completed the collection file may be copied to a floppy disk
or Bernoulli drive in LCN format and converted to PC format using a TEXT FILE
CONVERTER (Honeywell LCNBB program or TRANSFER For DOS ). The
converted file is directly usable by the RMPCT identification package. A block
diagram of this process is shown in Figure 1.
Points
TDC
File Copy
Honeywell
LCN
Data
Collector
TDC3000
Bernoulli
.XX
.XL
Files
Files
History
Module
Data
Collector
LCNBB
Text File
Converter
Future Functionality
File
Modify
TDC
Function
PC Terminal
PC
Emulation
Figure 1--Block Diagram of Data Collector Information Flow
Archived Data
Files
The filename is assigned by the user, however the extension to the file name is
defined by the graphic as .XX. More than one collector point may be built and
more than one may be collecting data concurrently. If more than one point is active
each must have a different file name assigned for data storage.
An example of the data collection file is shown in Figure 02. The variables are:
26T356.OP
26T425.PV
26T672.PV
12
REACTOR TEMP
CIRC-COKE BELOW J BEND
SCRUBBER SOUTH DRAW
Data Collector
Profit Suite Toolkit
Honeywell Inc.
in DEGC
in DEGC
in DEGC
5/01
Section 2 --- Data Collector
2.1 Overview
Multi-Point Data
Files
Multi-point files (which must have an MPT extension) contain sampled values for
multiple points. These files are created by the AM Data Collector and contain one
variable per column (is eight character wide, and each column is separated by a
blank.
The first nine rows contain header information:
Rows one and two allow for sixteen character tagnames for each variable;
Row three contains the parameter (OP, SP, PV, etc) of the point;
Row four, five, and six are used for a twenty four character point
description;
Row seven contains the engineering units;
Row eight contains the Date stamp (m-d-y)
Row nine contains the point category.
Example File
This is what data looks like in an .mpt file.
26T356
26T425
26T672
OP
PV
PV
REACTOR
CIRC-COK
SCRUBBER
TEMP
E BELOW
DEGC
SOUTH D
J BEND
RAW
DEG C
DEG C
12-01-94
12-01-94
12-01-94
MANIP
DISTURB
CONTROLD
85.142
309.304
309.304
09:55:52
85.142
309.304
309.304
09:56:52
85.142
309.304
309.304
09:57:52
85.142
309.304
309.304
09:58:52
36.5486
537.213
365.483
09:59:52
35.0382
537.518
365.483
10:00:52
36.0451
537.713
365.483
10:01:52
36.0451
537.879
365.361
10:02:52
35.7951
537.518
365.361
10:03:52
37.0278
537.574
365.118
10:04:52
Table 1--Sample Data File
5/01
Data Collector
Profit Suite Toolkit
Honeywell Inc.
13
Section 2 --- Data Collector
2.2 Installation
2.2 Installation
Media Contents
Your Data Collector distribution Bernoulli contains the following files necessary
for installation of the Data Collector:
File
Description
Directory
DCPTS.EB
An exception build file template for a data collector
point and a dummy point for linking. The dummy
point is an AM regulatory point with the parameters
NAME, PTDESC, EUDESC, PV, SP, OP, and OPEU.
This is needed for CL linking
EB
DC_PKG.CL
A CL package containing the custom data segment
package which defines the custom parameters of the
data collector point
CDS
DC_CL2.AO
A CL package which contains the blocks DC_FGD
and DC_BKG which do the collection and storage of
the data.
AO
DC_DDB.DF
The display database used by the data collector
graphics
PICS
DC.DS
Data Collector Main Graphic
DC
DCOPER1.DS
&.DO
Data Collector Collection control and Status Graphic
DC
DCPTS1.DS
&.DO
Data Collector Points Setup Graphic
DC
DCPTS2.DS
&.DO
Data Collector points current selected input values
Graphic
DC
DCFILE1.DS
&.DO
File modification graphic (future)
DC
DCMSG1.DS
&.DO
Message modification for Error messaging
DC
Table 2 Installation Files
14
Data Collector
Profit Suite Toolkit
Honeywell Inc.
5/01
Section 2 --- Data Collector
2.2 Installation
Backing Up the
Media
Task 1 - Compile
the CDS
Package
(DC_PKG.CL)
If you have not already done so, make a backup copy of your distribution media
and use the backup copy for the installation. The following instructions represent
the drive in which the media is installed as $Fn. As you follow these procedures
substitute the name of the actual drive in which your backup media is installed for
$Fn.
Step
Action
1.
From the Engineering Main Menu select SUPPORT UTILITIES> MODIFY
VOLUME PATHS
2.
From the Engineering Main Menu select COMMAND PROCESSOR
3.
The DC_PKG CDS package adds a package name to the LCN, but does not add
any CDS names. All CDS names in this package should already exist on the
LCN.
At the command processor command line enter the command:
CL $Fn>CDC>DC_PKG -UL
The CDS package will be compiled and added to the system.
Note: If an older version of the data collector exists use the -OCD command.
5/01
Data Collector
Profit Suite Toolkit
Honeywell Inc.
15
Section 2 --- Data Collector
2.2 Installation
Task 2 - Build the
Collector Point
Step
1.
2.
16
Action
While still in the COMMAND PROCESSOR type:
ED $Fn>EB>DCPTS.EB
This is the exception build file for the collection point and the dummy linking
point.
Edit this exception build file (see Example Edit of DCPTS.EB on next page)
a.
Assign the name of your choice to the data collector point.
b.
You may change the data collector dummy linking point, but if you change
the name, the parameter PT(0) of the data collector point must be changed
to match it.
c.
Change the unit assignment of the dummy point and the collector point to
the name of a unit assigned to the AM in which the collector is to be
installed.
d.
Specify the period for the data collection. The default is 1 minute. You may
assign any valid AM point execution period. We recommend, under normal
operating circumstances, that you do not specify a period less than 10
seconds. The collection period should be an even divisor of the period at
which the controller will be executed when completed.
e.
Exit the text editor.
3.
From the Engineering Main Menu Select the [BUILDER COMMANDS] target.
4.
From the builder command menu (Figure 6) select [EXCEPTION BUILD].
5.
Select [LOAD ENTITIES].
6.
Enter REFERENCE PATHNAME
$Fn>EB>
Pathname for SOURCE file = DCPTS.EB
Pathname for IDF
= DCPTS.DB
7.
Press [ENTER].
The dummy link Point, (required for proper CL linking), and the collection
point, with the name you assigned when you edited the file, will be built and
loaded to the AM in the unit you designated in step 2.
Data Collector
Profit Suite Toolkit
Honeywell Inc.
5/01
Section 2 --- Data Collector
2.2 Installation
Example of
DCPTS.EB Editing
Dummy link point
No changes needed
{SYSTEM ENTITY DC0000( )
}
&T REGAM
&N DC0000
UNIT
= 01
PTDESC
="DATA COLLECTOR LINK PT
EUDESC
="
"
KEYWORD
="DATA_COL"
Change name (optional)
Change unit
Change descriptor
(optional)
Change
keyword(optional)
No changes needed
PRIMMOD
CCINPT
No changes needed
Change name (optional)
Change unit
Change descriptor &
keyword (optional)
No changes needed
Delete ALPRIOR for
Release 500
Change only if Dummy
link point name changed
No changes needed
WIDTH
5/01
= -~~
= NO
Data Collector Point
{SYSTEM ENTITY DATA_COL( )
}
&T CUSTOMAM
&N DATA_COL
UNIT
= 01
PTDESC
="dummy data collector
KEYWORD
="DC0001 "
CLSLOTS
= 2
NOPKG
= 1
PRIMMOD
= -ALPRIOR
= LOW
ALENBST
= ENABLE
PKGNAME(1)
="DC_PKG "
PERIOD
= 1MIN
BEFAFT
= NO
PATHNAME(1) = "NET>DC>"
PATHNAME(2) = "NET>DC>COLLECT.XX"
HISFILE
= "COLLECT.XX"
NUMPTS
= 6.000
PT(0)
= DC0000
PT(1)
Data Collector
Profit Suite Toolkit
Honeywell Inc.
"
"
= -~
= 8.0
17
Section 2 --- Data Collector
2.2 Installation
Task 3 - Load the
External Load
Modules
Step
Action
If it is known that loader module FILE and loader module CONV are, on the target
AM, then proceed to Task 5
Mount your Backup NCF volume on a system drive.
1.
18
2.
From the Engineering Main Menu, select SUPPORT UTILITIES
3.
Select MODIFY VOLUME PATHS
4.
Enter $Fn>&ASY> into NCF Backup Path where $Fn is the drive in which
your backup NCF volume is loaded.
5.
From the Engineering Main Menu, select LCN NODES. The LCN NODE
CONFIGURATION display appears.
6.
From the LCN NODE CONFIGURATION display, select the AM Node to
which the Data Collector is to be installed. The APPLICATION MODULE
NODE display appears.
7.
Page forward twice to the External Load Module page.
8.
Check to see if the modules FILE and CONV appear in the installed modules
table.
If the modules are already loaded abort the change (press <CTL F5> and
[ENTER], and proceed to Task 5.
If the modules do not appear continue.
9.
Page back twice to the Application Module Node page.
10.
Select MODIFY NODE.
11.
Page forward twice to the External Load Module page.
12.
Select Yes for use Default Personality Type?
13.
Enter the word FILE in the table under name, then press <Enter>. The system
will enter both FILE and CONV into the table.
14.
Check the NCF.WF by pressing <CTL> and <F1>.
15.
Press <CTL> and <F2> to load into the NCF.
Data Collector
Profit Suite Toolkit
Honeywell Inc.
5/01
Section 2 --- Data Collector
2.2 Installation
Task 4 Shutdown and
Load the AM
Task 5 - Link CL
Blocks to
COLLECT point.
Task 6 - Compile
the DC graphic.
5/01
Step
Action
1.
List all points in this AM (Use the documentation tools or other methods).
Modify the control status of any AM applications which are running in this AM,
such that operations is minimally effected by the AM shutdown. This action
must be coordinated with plant operations.
2.
From the SYSTATS display, select APPLICATION MODULES.
3.
Select the target AM, then SAVE DATA.
4.
Wait for the AM to return to OK
5.
Select the target AM, then SHUTDOWN.
6.
After the AM shows QUALIFY, Reload the AM.
7.
With plant operations, ensure that all points and applications in this AM are in
the proper operating mode.
Step
Action
1.
Return to the COMMAND PROCESSOR (see Task 1 step 4).
2.
Enter the command:
LK $Fn>AO >DC_CL2 DATA_COL
(DATA_COL represents the name of your collection point).
Step
Action
1.
Enter the Picture Editor
2.
Load the $Fn>PICS>DC_DDB
3.
Read the $Fn>DC>DC graphic
4.
Type DEF INIT
5.
Make your modifications to DEF INIT. (As shown in the example below.
Changes are bold.)
The variable INIT02 defines the number of data collectors.
Entities ENT01 through ENT09 are used to define the collector points.
ENT10 is the default (or primary) data collector point.
Data Collector
Profit Suite Toolkit
Honeywell Inc.
19
Section 2 --- Data Collector
2.2 Installation
Initial Action
If there is more than one data collector point, then the other data collector points
must be built prior to graphics modifications.
S_INT(INT02,3);
{NUMBER OF DATA COLLECTORS}
S_ENT(ENT01, 81DC001);
{NAME OF FIRST DATA COLLECTOR}
S_ENT(ENT02, 27DC001);
{NAME OF SECOND DATA COLLECTOR}
S_ENT(ENT03, 81DC002);
{NAME OF THIRD DATA COLLECTOR}
S_ENT(ENT10, 81DC001);
{FUTURE USE FOR FILE CONVERSION POINT}
S_INT($_SELIDX,0);
{FOR INITIALIZATION}
S_INT(INT03,0);
{FOR INITIALIZATION}
MULT_OV(“DCOPER1”,0,3,79,22);
{CALLS OPERATING FUNCT OVERLAY}
S_STR(STRING01, “COLLECTOR FUNCTIONS”); {SETS SCR HEADER STRING}
Example of DC graphic Initial Action
6.
Press <ENTER>.
7.
VERIFY the graphic. <VER>
During verification the Picture Editor will ask the type of the variable &I. &I is of
type integer (I). “I“ should be entered as the response.
8.
COMPILE the graphic.
9.
Read, Verify and Compile the other graphics:
DCPTS1DC_MSG1
DCPTS2
COM DC
DC_FILE1
DCOPER1
10.
When complete type END.
11.
Copy all of the graphics to the executable graphics directory. From the
Command processor Display:
Copy $Fn>DC>*.DO NET>pic_dir>=-D-V [ENTER]
Where pic_dir is the picture source directory specified in the schematic
search path, which is found in the SYST_MENU, Organizational
Summary page.
20
Data Collector
Profit Suite Toolkit
Honeywell Inc.
5/01
Section 2 --- Data Collector
2.3 Graphics Interface Familiarization
2.3 Graphics Interface Familiarization
Overview
1.
Call the DC schematic on the Universal Station. <SCHEM> DC.
2.
Touch the [APPLCN MENU] target (bottom left), and select your data
collector.
3.
Ensure that the presented data is reasonable.
Figure 3. Data Collector - Collector Functions
4.
5/01
Select the [POINTS SETUP] target. Ensure that the DCPTS1 overlay (as
follows) is shown:
Data Collector
Profit Suite Toolkit
Honeywell Inc.
21
Section 2 --- Data Collector
2.3 Graphics Interface Familiarization
22
5.
Select the [CURRENT DATA] target. Ensure that the DCPTS2 overlay
(as follows) is shown:
6.
Select the [MESG CONFG] target. Ensure that the DCMSG1 overlay
(as follows) is shown:
Data Collector
Profit Suite Toolkit
Honeywell Inc.
5/01
Section 2 --- Data Collector
2.3 Graphics Interface Familiarization
5/01
7.
Select the remaining Menu Item Buttons to gain familiarity with the data
collector interface graphics.
8.
The message configuration page is for changes to different languages or
verbiage in the messages.
9.
The File Handle target is for future LCN Data Collector functionality.
Data Collector
Profit Suite Toolkit
Honeywell Inc.
23
Section 2 --- Data Collector
2.4 Point Setup
2.4 Point Setup
Point Setup
1.
Call the DC graphic on the User Station.
2.
Select the desired data collector from the Application Menu, or by typing
in the name of the point after selecting the current point’s description
(upper left hand corner target).
Changes to the number of points and type of input should always be made
with the data collector OFF.
24
3.
Select the POINTS SETUP page.
4.
Change the number of points to be sampled to the desired number (1 to 50)
by selecting the target after the #PNTS on the display.
5.
Add or change points, by selecting the point name.
6.
Enter the tagname at the prompt.
Data Collector
Profit Suite Toolkit
Honeywell Inc.
5/01
Section 2 --- Data Collector
2.4 Point Setup
7.
Select the Parameter Target for the point and select the desired parameter
(PV, SP, OP, or OPEU).
8.
Select the Type Target for the point and indicate the type of variable
([CONTROLD], [MANIP], or [DISTURB]).
9.
Repeat for all points and all data collectors.
10. Test the configuration by looking at the Current Data Page.
5/01
Data Collector
Profit Suite Toolkit
Honeywell Inc.
25
Section 2 --- Data Collector
2.5 Collection Setup
2.5 Collection Setup
Collection Setup
1.
Return to the LCN DC FUNCTion page.
2.
Select the desired data collector from the Application Menu, or by typing in
the name of the point after selecting the current point’s description (upper
left hand corner).
3.
Select the Column Width target and enter the width (8)of the data columns.
This allows the column width to be adjusted although RMPCT requires a
fixed width of 8 characters with a delimiting space.
4.
Select the Path target and enter the LCN path.
The data collector generally writes to the Network History
module. This is much faster (and allows faster collection
rates) than writing to a Bernoulli drive. Reference to a
Bernoulli can be made using the
PN:nn>DEVxxmm>VOLDIR> notation
Where: nn = the US node number, xx = the drive number,
mm = the device number on the node. This entry is not
supported by the data collector graphics.
26
5.
Select the file name target and enter an 8 character (or less) file name. The
.XX extension will be added by the graphics. Ensure that this is done.
6.
Activate the data collector point, if the point is inactive.
Data Collector
Profit Suite Toolkit
Honeywell Inc.
5/01
Section 2 --- Data Collector
2.6 Operation
2.6 Operation
Overview
Operation of the data collector point functions are performed through the LCN
DC FUNCTion display of the data collector. These functions are:
1.
Start a data collection cycle
2.
Suspend a data collection cycle
3.
Resume a data collection cycle
4.
Terminate a data collection cycle
5.
Start a data collection cycle with file overwrite.
Starting a
Collection Cycle
To start a collection cycle, select the [START] target on the LCN DC function
page, and press enter. The collection cycle will start, and [START] will change
to [COLLECTING]. The data archiving starts on the normal cycle of the point.
This program will continuously store one set of data every execution of the
point. Since the program was Off, the file writing program (background
program) will run in this first cycle. This program checks for the existence of
the file. If the file exists and file deletion is not selected, data will be appended
to the existing file. If file deletion is selected and the file exists, the file is
deleted and a new file is created.. If the file does not exist the new file is
created. Header data is written to new files. The background program then
waits for a buffer (10 sets of data taken) to be filled, after which it writes the
data to file. After each subsequent ten data collection cycles the data is
appended to the file until the collection cycle is terminated
Suspending a
Collection Cycle
Selecting the [COLLECTING] target on the LCN DC function graphic and
pressing enter will suspend a data collection cycle. Suspension stops data
collection, causes all data to be written to the files, and writes a time break
indication to the file. A time break indication consists of a NAN (Not a
Number) indication for each data entry, and a 0:00:00 timestamp. The
[COLLECTING] target will change from [COLLECTING] to [STOP
REQUEST], and then to [START].
Resuming a
Collection Cycle
To resume a collection cycle, select the [START] target, and press enter. Since
the file exists, data will be appended to the file.
Terminating a
Collection Cycle
To terminate a collection cycle, suspend the cycle and enter a new file name .
- or Enter a new file name. If a new filename is encountered, header data is written
and subsequent data is written to the new file. (This method should be avoided
in high speed data collection of numerous points, since the writing of the
header data may result in filling of both buffers.)
5/01
Data Collector
Profit Suite Toolkit
Honeywell Inc.
27
Section 2 --- Data Collector
2.6 Operation
Deactivation of the
Data Collector
The data collector may be left active and off. Very little system resources are
used in this mode. Deactivation of the collection point causes termination of
any active collection cycle without writing data in the buffers to the HM.
Status Indications
The collection point has parameters which the user may use to determine the
status of the collection function. These parameters are decoded on the LCN DC
Functions display, and can be used for troubleshooting.
28
Data Collector
Profit Suite Toolkit
Honeywell Inc.
5/01
Section 2 --- Data Collector
2.7 Point Structure
2.7 Point Structure
Overview
Point Parameters
The Data Collector point is a custom AM point with one CDS package
(DC_PKG) and two CL blocks (DC_FGD and DC_BKG). The CL blocks are
described in detail in the following section. The CDS package is defined by the
CL block DC_PKG.CL which is compiled on the target system.
The data collector parameters are as follows:
Parameter
Index
Initial Value
Function
1
OFF
Set ON to collect
2
3
OFF
OFF
4
5
ON
OFF
Set ON to stop data collection
ON indicates both buffers filled
causing a pause in collection
On indicates collection was off
Delete file on Start
1
0
2
3
0
0
4
5
0
0
0
Type
COMMAND
logical
XSTS
real
BUFACTS
logical
1
2
0
DCOUNTS
Status of DC_FGD
0=no error
1=Points limit error
2=Scanning too fast for File
writes
Prior DC_FGD error
Status of DC_BKG
0=no error
Prior DC_BKG error
DC_BKG error sub-status
On if buffer 1 is the current
buffer in use
ON declares the buffer 1 full
ON declares the buffer 2 full
Scan number
real
VALUE 0
1
2
3
real
PATHNAME
0
1
2
1
"NET>DC>"
2
"NET>DC>
COLLECT.XX"
Number of entries in Buffer1.
Number of entries in Buffer2.
Number of records in the
data file
Directory of this file
string
5/01
Data Collector
Profit Suite Toolkit
Honeywell Inc.
full collector file pathname
29
Section 2 --- Data Collector
2.7 Point Structure
Parameter
Index
Initial Value
Function
COLLECT.XX
"'name.ext' of collection file"
1
No. of data items, max. 50
0
DC0000
Point for successful link of
CL code
1 to 50
1 to 50
"CONTROLD"
1 to 50
1
Type
HISFILE
string
NUMPTS
real
PT
entity
$REG_CTL
(HREG_CTL
at CL compile)
PNTTYPE
string
C1SRC
real
WIDTH
8
Point names of data items
Category descriptions of data
items
Used by RMPCT
Parameter to be recorded
1=PV
2=SP
3=OP
4=OPEU
column width
real
AVFORMAT
1
"R-9.99999"
Format for real values
2
"DATE
MM-DD-YY
ENDDATE"
"TIME
HH:MM:SS
ENDTIME"
"TEXTL1:8"
Format for date values
string
3
30
T1
time
4
1 to 10
T2
time
1 to 10
B1
real
1 to 500
B2
real
1 to 500
Data Collector
Profit Suite Toolkit
Honeywell Inc.
Format for time values
Format for point names
Time when data was
scanned Buffer 1
Time when data was
scanned Buffer 2
data from points scanned,
Buffer 1
data from points scanned,
Buffer 2
5/01
Section 2 --- Data Collector
2.7 Point Structure
Parameter
Index
Initial Value
Function
Type
MSGTXT
0
"NoError"
1
"Too many Points"
2
"Processing too fast"
3
"File Access Error"
4
"Delete File Error"
5
"File Create Error"
6
"File Open Error"
7
"Field Put Error"
8
"Record Write
Error"
9
""
10
"Initial"
11
"New File"
12
"Name Lines"
13
"Param Lines"
14
"Descriptor Line"
15
"EU Descriptor
Line"
16
"Header Date Line"
17
"Category Line"
18
"Data Write Line"
19
""
20
""
string
5/01
Data Collector
Profit Suite Toolkit
Honeywell Inc.
31
Section 2 --- Data Collector
2.8 Customizing the Data Collector
2.8
Customizing the Data Collector
Changing the
Collector
Frequency
The collector frequency is set by the Period of the point. This is changed by
reconstituting the point from the Engineering Builder Commands display. The
period can be changed to the following values:
1sec
2sec
5sec
10sec
15sec
30sec
1min
2min
1Smin
2Smin
5min
10min
15min
30min
1hr
8hr
12hr
24hr
NoPeriod
It should be noted that when processing at high speeds (less than 1 minute), there
is a possibility that both data collector buffers will fill before the data is written to
the storage file. This is indicated by an error. The error is caused by insufficient
time for the AM to write the data to the HM. This can be caused by insufficient
background processing time in the AM or by high amounts of communication to
the HM from the LCN. The possible solutions are:
1)
2)
3)
4)
Adding Another
Data Collector
The number of data points can be reduced,
The data collector can be moved to another AM,
Others points which write to the HM can be inactivated,
The file can be written to a different HM.
The data collector graphics are set-up to handle a maximum of 9 data collector
points. New data collectors and the data collector names are defined in the Initial
target of the DC graphic.
The variable INIT02 defines the number of data collectors. Entities ENT01
through ENT09 are used to define the collector points. ENT10 is the default (or
primary) data collector point.
Edit this graphic to change the Data Collector using the following steps:
1)
2)
3)
4)
5)
6)
7)
32
Enter the picture editor
Load the DC_DDB
Read the DC graphic
Type DEF INIT and press ENTER
Make your modifications as per Task 3 section 3.2
Press ENTER
COMPILE the graphic and copy the .DO file to the proper directory.
Data Collector
Profit Suite Toolkit
Honeywell Inc.
5/01
2.8
Section 2 --- Data Collector
Customizing the Data Collector
S_INT(INT02,1);
{NUMBER OF DATA COLLECTORS}
S_ENT(ENT01,DATA_COL);
{S_ENT(ENT02,DATACOL2); }{SECOND DATA COLLECTOR}
{S_ENT(ENT03,DATACOL3); }{THIRD DATA COLLECTOR}
S_ENT(ENT10,DATA_COL);
S_INT($_SELIDX,0);
S_INT(INT03,0);
MULT_OV("DCOPER1",0,3,79,22);
S_STR(STRING01, "COLLECTOR FUNCTIONS");
Original Initial Target
S_INT(INT02,3);
{NUMBER OF DATA COLLECTORS}
S_ENT(ENT01,SLOWDC01);
S_ENT(ENT02,FASTDC01);
{SECOND DATA COLLECTOR}
S_ENT(ENT03,FASTDC02);
{THIRD DATA COLLECTOR}
S_ENT(ENT10,SLOWDC01);
S_INT($_SELIDX,0);
S_INT(INT03,0);
MULT_OV("DCOPER1",0,3,79,22);
S_STR(STRING01, "COLLECTOR FUNCTIONS");
Initial Target Modified for 3 Collectors
Storing Sets of
Points to a File
After a data collector has been setup, store the setup for future use. The setup is
stored by printing the system entity to a file. This is done from the Engineering
Builder Commands Menu.
After the file is printed, the file should be edited to form an alter parameter file.
In this file, only the items to be changed (points, and data types) appear. Other
information (tagname, a description of when this data set is useful, etc.) is
commented out by placing each comment line inside brackets { }.
Restoration of a stored data collector setup is done using the alter parameter
function from the Engineering Builder Commands Menu. The file, generated
above, is entered in the PARAM=VALUE list. This changes the parameters,
even while the point is running, to those listed in the file. It is best to inactivate
the data collector prior to this change.
5/01
Data Collector
Profit Suite Toolkit
Honeywell Inc.
33
Section 2 --- Data Collector
2.9 Known Data Collector Problems
2.9
Known Data Collector Problems
Foreground code
configuration
error
The data collector can be configured to collect a SP or OP of a point even though
the point does not have a setpoint or an output. This is evident from the current
data page.
The error can only be corrected by changing the parameter to be collected.
Background
code
configuration
error
When a system is upgraded to a new LCN revision, and the Data Collector is rebuilt
(such as when changing the period of the point) the background code can give a
configuration error. This error results in a data collection file having no header
data.
The only solution is to unlink and link the code on all of the data collection points.
The unlink and link can be performed one by one but eventually all data collector
points should be rebuilt and have the code unlinked and linked.
\
34
Data Collector
Profit Suite Toolkit
Honeywell Inc.
5/01
Step Test
Builder
(Optional Item)
5/01
Step Test Builder
Profit Suite Toolkit
Honeywell Inc.
35
36
Step Test Bldr
Profit Suite Toolkit
Honeywell Inc.
5/01
Section 3 Step Test Builder
3.1 Overview
Overview
The Step Test Builder is designed to provide a mechanism to generate and retain
the best information possible from unit plant tests while minimizing disruptions to
operations and production.
The Step Test Builder consists of two parts.
1. Signal Generator The first part is an offline PC tool called the Signal
Generator which is available under the Profit Design Studio(APCDE). See
Section 3.2.
2. Automated Step Tester The second part is LCN software called the Step
Tester Builder. See Section 3.3.
5/01
Step Test Builder
Profit Suite Toolkit
Honeywell Inc.
37
Section 3 Step Test Builder
3.2 Off-Line Signal Generator
3.2 Off-Line Signal Generator
Overview
38
This section starts with the procedure for installing the signal generator on the
PC. Next, a general introduction is presented which describes the philosophy,
features and background of this signal generator. Also included in the
introduction is a description of the PRBS and Schroeder sequences which are the
two basic signal types used in the generator. A description of the software itself is
then presented, followed by the effective use and operation of this signal
generator.
Step Test Bldr
Profit Suite Toolkit
Honeywell Inc.
05/01
Section 3 Step Test Builder
3.2.1 Introduction to the Signal Generator
3.2.1 Introduction to the Signal Generator
Philosophy
With the Signal Generator, you can easily create a series of one or more sequences
that can be used to properly excite the actual process. The generator has been
designed to work in conjunction with APC Identifier. Sequential or/and
simultaneous signals can be readily synthesized and evaluated. Signals are
designed for minimum length and broadband uniform power.
A fundamental requirement for any advanced process control project is the
determination of an acceptable process model. While many factors influence the
success of the modeling task, none is more important than proper plant excitation.
The rule is simple: To get ‘good’ models you must have ‘good’ (information rich)
data. Proper choice of the input (excitation) signal is paramount to satisfying this
rule. The APC Signal Generator is an automated tool to help design signals leading
to information rich data.
Extracting models from process data for control purposes can require several steps.
At a minimum, the diagram shown below illustrates the overall procedure.
Start
Experimental Design
Steps, Pulses, PRBS, etc.
and Execution
S
Identification
•
Data Processing
Correlation,
•
Model Order and Structure Transformation Plant
•
Parameter Estimation
Models
Model ValidationSimulation, Cross Validation
Is Model
Good?
Use Model
This document is concerned only with the experimental design portion of the above
diagram. Identification and model validation techniques are described in detail in
the APC Identifier User’s Guide.
05/01
Step Test Builder
Profit Suite Toolkit
Honeywell Inc.
39
Section 3 Step Test Builder
3.2.1 Introduction to the Signal Generator
Features
A variety of automated excitation tools are contained in Honeywell's windows
based signal generation tool. This package offers the following characteristics:
• Gives the engineer a powerful tool to inspect signals
• Both sequential and simultaneous signals can be generated
• Different signal types are accommodated
− Frequency matched Pseudo Random Binary Sequence (PRBS) (Default)
− Schroeder Phased input (experimental)
− User Specified
• Performance is given in terms of:
− Signal profile
− Correlation profile
− Correlation targets
• One or more signals can be exported for on-line use.
• LCN Parameter lists are automatically generated
In conjunction with the Signal Generator software, the Automated Step Tester’s
LCN CL code is used for on-line implementation of the input signals.
Background
Model synthesis is the first step in the design of an advanced control project. In
most instances, plants are too complex to be modeled in a cost effective manner
based on first principles. By far the most common approach is the use of black-box
models. In this approach, the models are obtained based on plant experiments. The
task of obtaining ‘good’ models based on plant data is one of the most demanding
and time consuming steps in any advanced control project. Inappropriate tests can
result in poor or useless models. Retesting is extremely expensive and frustrating.
It is the intent of this package to circumvent or at least reduce these problems.
To understand the approach, it is useful to first define the requirements of a good
model. One possible definition, the one that will be used here, is that a good model
is one that is consistent and unbiased. All the usual assumptions apply (i.e.
linearity, stationarity, etc.). Unbiased implies that the expected values of the
estimated model coefficients are the correct values. Consistency implies (as the
number of samples goes to infinity) the estimated values converge to the correct
values. While this definition is clearly academic, it does give guidance as to what is
required for effective testing.
40
Step Test Bldr
Profit Suite Toolkit
Honeywell Inc.
05/01
Section 3 Step Test Builder
3.2.1 Introduction to the Signal Generator
With the above definition of a good model, theory shows that the requirements for
an unbiased consistent estimate are:
1.
Model must have the correct structure
2.
For FIR models, all inputs including DVs must be independent of
the disturbances (uncrosscorrelated). This implies Φ uν (ω) = 0 ,
for all omega.
3.
Inputs must exhibit persistent excitation for all frequencies. This
implies Φ u (ω) ≠ 0 , for all omega.
where : Φ is the input power spectrum
ω isand
the frequency. While Item 2 is not
necessarily required for model forms other than FIR, it is nonetheless still very
desirable. In fact it is in general desirable to have all inputs be un-auto/cross
correlated to the extent possible.
It is the intent of the signal design software to directly address items two and three
of the above list. The first item is addressed specifically by the identification
software described in detail in the APC Identifier Users Guide
To aid in the experiment design, it is useful to understand what contributes to model
errors. Error sources in estimation are given by:
e = bias + Var
where: e= total error
bias= error due to bias
Var= error due to variance
Bias are systematic errors caused by
05/01
•
Input signal characteristics (power, correlation, etc.)
•
Choice of model structure
•
Mode of operation (open vs. Closed-loop)
Step Test Bldr
Profit Suite Toolkit
Honeywell Inc.
41
Section 3 Step Test Builder
3.2.1 Introduction to the Signal Generator
Variance is the variability caused by
• presence of noise
• number of model parameters
• duration of the test
An expression for the model variance (open-loop) is given by:
nΦ v (ω )
Var ∝
NΦ u (ω )
where : Φ (ω ) = disturbance power spectrum
v
Φ (ω ) = input power spectrum
u
n = number of parameters
N = number of data points
Open-loop testing is implicitly assumed in the current version of the APC Identifier.
With this stipulation, the nonparametric model form (finite impulse response) can
be bias free. To accomplish this, the input signals (MVs and DVs) should be
uncorrelated with the disturbances, and have power at all frequencies of interest.
Meeting this objective is the goal of proper signal design. However, even when the
signals are uncorrelated and frequency rich, there can be errors due to the variance
as shown above.
In theory, the estimates become error free as N → ∞ . Since this is impractical,
there will always be a tradeoff between input power and disturbance power.
Disturbance power can be due to either deterministic or stochastic events. To
increase accuracy (reduce error) for a set of external conditions, either the test
needs to be lengthened or the magnitude of the input power needs to be increased.
In the signal design algorithm, issues related to correlation and spectrum are
automatically addressed. Power magnitude and plant specific response times are
user supplied.
Signals
42
While the signal generation tool has been designed to allow the user as much
freedom as possible in the synthesis of signals, there are basically only three
different signal types. One is the Auto Step which creates a series of steps of
varying duration based on user specified conditions. This technique is heuristic and
will not be described here. The next signal type is the PRBS. This method will
create one or more signals that are not auto/cross correlated and that have a relative
uniform power spectrum over the range of interest. The goal is signals of minimum
length duration. The final signal type is the Schroeder phased input. This is an
experimental signal type that is potentially more plant friendly than the PRBS but
has a finite power spectrum.
Step TestBuilder
Profit Suite Toolkit
Honeywell Inc.
05/01
Section 3 Step Test Builder
3.2.1 Introduction to the Signal Generator
Once the input signal magnitude and plant response times are specified, the
objective of the design is to emphasize the power spectrum in the frequency region
of interest for control. In the APC Signal Generator, the emphasis is placed in the
mid to low frequency region thereby tailoring the sequence for extracting models
that will be well suited for RMPCT. A brief discussion of the PRBS and Schroeder
inputs is given below.
PRBS Sequence
As defined here, the PRBS signal is a 2-level, periodic, deterministic signal
generated by using shift register modulo 2 addition. Its main usefulness lies in the
fact that its auto- and cross-correlation properties closely resemble those of white
noise. That is, it meets the requirements necessary for an unbiased estimate.
Fortunately, since it is frequency matched to the process, it does not suffer from the
practical limitations of a true (or even approximate) white noise signal.
This sequence is characterized by two parameters, the number of registers, n , and
the switching time, Tsw , which is the minimum time between changes in the level of
the signal as an integer multiple of the sample period T . The sequence repeats
itself after NTsw units of time, where N = 2 n − 1.
A very desirable feature of this signal is that it can be generated to have a relatively
uniform power band in the desired frequency range. In addition, the power and
frequency band can be precisely specified. Another advantage of this signal is that
it can be conducted at lower signal to noise ratios than other more conventional
signals such as step or pulse sequences. The power spectrum of this signal is given
by:
Φ u (ω) =
a 2 ( N + 1)Tsw
N
é æ ωTsw
ê sin ç
ê è 2
ê ωTsw
ê
2
ë
öù
÷ú
øú
ú
ú
û
2
where a is the user specified input amplitude. The power reaches it bandwidth at
ω = 2.8 / Tsw . The flat band frequency range useful for identification is:
2π
2.8
≤ω≤
NT sw
Tsw
05/01
Step Test Builder
Profit Suite Toolkit
Honeywell Inc.
43
Section 3 Step Test Builder
3.2.1 Introduction to the Signal Generator
Schroeder
Sequence
In addition to the PRBS signal, a sinusoid based signal referred to as the Schroeder
signal is also supported by the design software. The Schroeder signal is composed
of a harmonically related sum of sinusoids and is given by:
ns
u s (k ) = λ å 2 β i cos(ωi kT + φ i )
i =1
where
T = sample time
n s = Number of sinusoids (n s ≤ N s /2)
N s = Sequence length
β i = Relative power
ω i = 2πi/N s T
i
φ i = 2π å jβ j
j =1
λ = Scaling factor
λ is selected after generating the Schroeder signal such that the time domain peak
magnitude does not exceed the user specified amplitude.
The total power is normalized as
ns
å βi = 1
i =1
where β i is the relative power in each component.
To minimize peaking in the time domain, the sinusoids are phased according to:
i
φi = 2π å jβ j
j =1
44
Step Test Bldr
Profit Suite Toolkit
Honeywell Inc.
05/01
Section 3 Step Test Builder
3.2.1 Introduction to the Signal Generator
This signal has a discrete power spectrum with frequencies spaced 2π / N s T
intervals apart up to the Nyquist frequency π / T . The goal of this tool is to
generate a low pass signal with power up to the frequency ω ns ; this is
accomplished by specifying β i as:
ì1
i = 1, K , ns
ï
β i = í ns
ï0 i = n + 1, K , N / 2
s
s
î
Since the Schroeder signal has zero power at frequencies > ω ns , this tool
automatically adds a small PRBS series at the start of the sequence. In addition, the
input design parameter α is a tuning knob that allows the user to adjust ω ns .
NOTE: No more than “1” Schroeder signals are run at a time, but multiple PRBS
signals can be run.
There are no inherent limitations with this tool with respect to problem size. Any
number of MVs and DVs can be accommodated. No restrictions are placed on the
maximum number of data records. Only computer speed (MHz) and memory
resources (RAM) will limit the application
No one step is more important than the design of the test signal used for plant
testing. This is by far the most crucial part of an entire multivariable predictive
control project. Preliminary tests should be conducted first to make sure all
regulatory loops are properly tuned, all actuators and positioners are performing
correctly, and to get initial estimates on process response times, gains, nonlinearties
and noise levels.
Once the preliminary test is complete, this package can be used to ensure that the
variables of interest will be persistently excited wherever possible. This step will
enhance the prospects of obtaining good results. If the data is sufficiently rich
(persistently excited), then the APC Identifier will extract the appropriate models.
Data should be recorded during all plant testing. Many options exist for saving this
data. The Data Collector, which runs in the AM and is an optional part of the APC
package, can be used to collect this data automatically.
05/01
Step Test Builder
Profit Suite Toolkit
Honeywell Inc.
45
Section 3 Step Test Builder
3.2.2. Getting Started
3.2.2. Getting Started
Installing the
Signal Generator
The Signal Generator is included in the standard installation of Profit Design
Studio (APCDE). See Profit Controller Designer’s Guide for installation
instructions.
When the APC Development Environment is started, note that the Step Test
Builder / Signal Generator is “checked” in the “About Box.”
46
Step Test Bldr
Profit Suite Toolkit
Honeywell Inc.
05/01
Section 3 Step Test Builder
3.2.3. Starting a Signal Session
3.2.3. Starting a Signal Session
To Open an
Existing Signal
Session
A session is started by either opening an existing signal file or by starting a new
session. Existing signal files will always have the .sig extension. Currently it is not
possible to import non native data files into a working session. To open an existing
signal session select File > Open as shown below:
Then simply select the .sig file type and appropriate path and file name from the file
open dialog box which is illustrated in the following picture.
To Save a .sig
File
05/01
You can save a .sig file at any time and open it later to continue where you left off.
To save a .sig file, select File>Save or click the toolbar button that looks like a
diskette. To save a .sig file under a different name, for example to clone it for later
experimenting, select File>Save As. Select a .sig file to resume work where you
were when you previously saved the file.
Step Test Builder
Profit Suite Toolkit
Honeywell Inc.
47
Section 3 Step Test Builder
3.2.3. Starting a Signal Session
Creating a New
Signal Session
Any new or initial session must start by selecting File > New and choosing the
Signal Dev. File option. This procedure is depicted below.
Clicking on OK will open an empty signal session. At this stage it becomes
necessary to add information pertaining to the variables that are to be created. To
do this select Edit>Var Info. When you edit variable information and no variables
exist (as will happen at the beginning of each new session), you will be prompted to
enter the scan rate at which you wish to build the signals. At this stage you should
see the following information.
Example
Explained
48
In the example shown above the scan rate was chosen to be 1 minute. There are no
internal constraints on this parameter. As the ratio of process response time to scan
rate increases, the length of the signal will increase. Remember that this value does
impose a lower limit on the switch interval. This value should be relatively small
compared to the process response time and it should be consistent with the
execution frequency of the target implementation point. Once this value is entered,
all parameters pertaining to the design of the various signals can be specified.
Step Test Bldr
Profit Suite Toolkit
Honeywell Inc.
05/01
Section 3 Step Test Builder
3.2.3. Starting a Signal Session
Parameter
Specification
Signal parameters can be set or modified by selecting Edit>Var Info once the signal
sample rate has been specified. When setting or modifying the parameters it is
important to remember that when a signal is generated or recalculated for a
specified independent variable, the existing signal is not necessarily destroyed.
Thus complex user specified signals can be synthesized by combining one or more
signal segments. The various user settable parameters are shown below in the
Variable Info dialog box.
A description of these parameters follows.
Variable
Descriptors
05/01
There are five fields available for describing the variable that will be used to
represent the signal. The fields include :
Field Name
Description
Name
Supplied to allow the user to enter a shortened string representing an actual
process connected point. By default this is the descriptor used for all plots.
Point
Corresponds directly to the LCN tagname,
Param
Corresponds to the LCN .parameter (i.e. sp, pv, op).
Desc,
Units
Both fields correspond to the detailed (24 character) description and
engineering units found on an LCN point detail.
Step Test Builder
Profit Suite Toolkit
Honeywell Inc.
49
Section 3 Step Test Builder
3.2.3. Starting a Signal Session
While it is a good practice to fill in all these fields, it is only necessary to fill in
either the Name or Point field. Currently these fields are used for graphical display
only. In the future they will be used to define process-connected points.
Variable Type
While the type is unimportant in the generation phase it will be critical in the
control phase.
Manipulated Variable (MV) Generally signals will be designed for these variables.
Disturbance Variable (DV) If a disturbance can be independently excited, then it
may be possible to design a signal for these
variables.
Sample Time
50
At this level, the sample time is displayed for information only. The actual value is
user specified in the sample time dialog box shown previously.
Step Test Bldr
Profit Suite Toolkit
Honeywell Inc.
05/01
Section 3 Step Test Builder
3.2.3. Starting a Signal Session
Signal Form
Two forms exist for each signal.
1
2
Settle T
Sequential - If there is more than one signal and the sequential box is
checked, then when the signal is built the current sequence will be inserted
with overwrite (i.e. old signal data will be overwritten with new signal data)
one interval after the previous signal ends. If the old signal is longer than the
new signal, then trailing data will be unchanged. Any values existing prior to
the insertion point will remain unchanged. If there is no existing signal or the
signal has been cleared, then zero values will be specified prior to the
insertion point. If the sequential box is not checked, then the signal will begin
at the user specified Time of Sig. Insert (see below).
Randomized - In addition to specifying if the signal form is sequential or
not, the user can specify if the signal is to be randomized. The randomization
box applies only to signals of the Auto Step type (see below). If the
Randomized box is checked then the step duration’s will be based on a
uniformly distributed random number.
Specification of the frequency design criterion is accomplished through this
parameter. The user specified value of this parameter should simply be the longest
approximate settling time (response time in minutes - not time constant) expected
for any controlled variables that are a function of this input. The Settle T used here
is equivalent to the Settle T used in the APC Identifier. For PRBS and
SCHROED_PRBS (see Signal Type below), this parameter is used to insure proper
auto and cross-correlation characteristics and to insure a uniform power spectrum
over the frequency band of interest. For Auto Step (see below) it is used to define
the duration of the longest step. For Overwrite Section, this value is multiplied by
the Cycles (see below) parameter to define the length of the overwrite signal.
This parameter is also used to set the axis for the corresponding auto and crosscorrelation plots. It is easy to see extended correlation plots for a given signal by
proper use of this parameter. For example, if a signal is to be built for a maximum
settling time of one hour but there is concern about the correlation function beyond
this time, then first build the signal (see next section) with Settle T = 60. Next set
Settle T = 90. Then execute the correlation calculations with the signal function
deselected. This will update the correlation functions without modifying the signals
themselves.
05/01
Step Test Builder
Profit Suite Toolkit
Honeywell Inc.
51
Section 3 Step Test Builder
3.2.3. Starting a Signal Session
Amplitude
Maximum and minimum values of the automated signals are established through
this parameter. The amplitude establishes the level of the power spectrum.
Reasonable values for this parameter should be established from plant conditions.
For accurate models in a reasonable amount of time, the power of the input signal
should dominate the power of the disturbance. As a rough estimate determine the
value of the input that moves all CVs of concern enough to exceed three times the
amount of the disturbances present during the test. This value can be used to define
the amplitude. If the data is to be exported using the free file format (see section
3.2.5), then enter the value in the amplitude field show below.
NOTE: If the data is to be exported using the LCN format then enter a “1.0” in the
Amplitude field and adjust the amplitude to the desired value in the Maximum
Move Allowed field on the LCN Automated Step Test Builder (see section 3.3.)
Time of Sig.
Insert
For non-sequential signals this field will specify the insertion point of the particular
signal being built. Remember that signals are inserted with overwrite (i.e. old
signal data will be overwritten with new signal data. If the old signal is longer than
the new signal then trailing data will be unchanged.) Values prior to the time of
insert will remain unchanged. If the signal length plus time of insert is shorter than
the length of the existing signal, then the trailing values of the existing signal will
also remain unchanged.
Cycles
Both the PRBS and SCHROED_PRBS signals are deterministic fixed length
signals. Design of these signals is based on a single cycle. This parameter is not
used to specify any design parameters in the first two signal types. The default
value of one should be used, unless due to process constraints, the amplitude is not
of sufficient magnitude to dominate the immeasurable disturbances. In these cases,
the number of cycles can be increased.1 This will increase the duration of the test
and reduce the variance and hence the expected error. For the Auto Step signal
type, the Cycle parameter is used to specify the design of the signal (see below). In
this instance the duration and frequency specification is defined based on the
number of cycles. For the Overwrite signal type, the number of Cycles is multiplied
times the Settle T value to define the duration of the overwrite.
1
Note, Since the design of PRBS & Schroeder is based on a single cycle, design goals with respect to power and
correlation cannot be theoretically guaranteed when multiple cycles are used.
52
Step Test Bldr
Profit Suite Toolkit
Honeywell Inc.
05/01
Section 3 Step Test Builder
3.2.3. Starting a Signal Session
Signal Types
Five distinct signal types are currently supported in this design software. The
signals are:
1. PRBS,
2. SCHROED_PRBS,
3. Auto Step,
4. Overwrite Section
5. Clear Signal.
1. PRBS
This default signal type is a deterministic minimum length signal that is designed to
have both a uniform power spectrum over the frequency range of interest
(automatically determined by the Settle T parameter) and well behaved auto and
cross-correlation function. The details of the design are given in the previous
section
2. SCHROED_PRBS
With the experimental Schroeder based signal, the output sequence is potentially
more plant friendly than the PRBS approach. The design of this signal, described
previously, has the same correlation and power spectrum goals as the PRBS. Due
to the finite frequency band of this signal, a user specified design parameter,
ALPHA, is available for adjustment. This additional parameter allows the user to
adjust the frequency content of the sequence. Decreasing or increasing ALPHA
will respectively reduce or increase the frequency content of the signal. View the
Single Graph Data Plots and Correlation Plots to observe the effects of ALPHA on
the time domain response and correlation functions respectively.
3. Auto Step
If desired, more conventional sequences can be used or added to a signal. Choosing
this option will allow the user to insert steps of a predefined structure. This option
is heuristically based. When chosen, the sequence is based on the Cycle and Settle
T parameters as follows. For Cycles = 1, one step of duration Settle T minutes will
be generated, For Cycle = 2, there will be two steps of duration Settle T/2 and two
steps of duration Settle T for a total of four steps. For Cycles = 3, there will be
three steps of duration Settle T/3, three steps of duration 2 Settle T/3 and three steps
of duration Settle T. For Cycles = N (where N > 3), there will be N steps of
duration Settle T/3, N steps of duration 2 Settle T/3 and N steps of duration Settle
T. When the randomized box is checked, these steps will be uniformly distributed
in a random fashion.
05/01
Step Test Builder
Profit Suite Toolkit
Honeywell Inc.
53
Section 3 Step Test Builder
3.2.3. Starting a Signal Session
4. Overwrite Section
Any part of a sequence can be specified or overwritten by choosing this option.
The value of the new segment is defined by the Amplitude parameter. The segment
starts at Time of Sig. Insert and the duration of the segment is Settle T x Cycles.
5. Clear Signal
To eliminate an entire signal select this option. If any other nonzero signals exist,
then all values of the signal selected will be set to zero. The length of the signal
will be set to the longest existing nonzero signal (i.e. all signals will be of the same
length, shorter signals are padded with zeros). Trailing zeros of the longest signal
will be removed. If all values are zero, then the signals and their corresponding
memory will be cleared. In this state the plots will not be accessible.
When selecting any options or specifying any parameters, remember that nothing
will happen until a build function is invoked. For a new session there will be no
signals present. At this stage, selecting View from the main menu will give results
such as those shown below
Once the parameters are set, the next step is to build and evaluate the signals.
These operations are described in the next section.
54
Step Test Bldr
Profit Suite Toolkit
Honeywell Inc.
05/01
Section 3 Step Test Builder
3.2.4 Signal Synthesis and Evaluation
3.2.4 Signal Synthesis and Evaluation
Overview
Signals can be easily generated evaluated and exported. The main functions
associated with the signal generator are accessible through the main menu. To
observe the main options do the following:
Select Build.
These options can be selected as illustrated below:
By selecting the Step Test Signal option, the user can choose to build: Signals
Only, Correlation (functions) Only or both Signals & Correlation (functions). If
no signals are present (this will happen in a new session or after all signals are
cleared), then the Correlation Only (function) option will not be available.
Step Test Signal
Select the appropriate option (default is Signal &
Correlation). Click the [Build] to perform the specified
calculations. In the above SigDev3.sig Window on the
previous page, the bottom two variables were selected. If
none were selected it would imply that all variables are
selected. Use the normal click, Ctrl, shift keys to select
variables. Select one or more variables in any desired
pattern. The build or view operation will apply only to
those variables selected. Note: You can not build signals
for auxiliary variables.
When the build option is selected, a message window will be created
automatically if it is not already present. The message window will display the
progress of the calculations along with specific information pertaining to the
design process. A typical message window is shown below.
Check this window for any warning or error messages. When the calculations are
complete the message window will be switched to background mode and the
focus will be returned to the main .sig window.
05/01
Step Test Builder
Profit Suite Toolkit
Honeywell Inc.
55
Section 3 Step Test Builder
3.2.4 Signal Synthesis and Evaluation
Evaluate the
Results
In order to evaluate the results after generating or updating the signals select
View from the main menu as shown below.
Five main options are listed. If any signals exist, the first four options will be
selectable.
56
Option
Description
Descriptive Info
Shows all the variable descriptors
Single-Graph Data
Plots
Allows the user to observe one or more signals (depending which are
selected) as a function of time. See section “Single-Graph Data Plots” for
more information.
Multi-graph Data
Plots
Allows the user to observe one or more signals (depending which are
selected) as a function of time.
Correlation
For viewing the Correlation Data. See section “Correlation” for more
information.
Power Spectrum
This last option, Power Spectrum is reserved for future use depending on
user request (Power spectrum will be a plot showing the magnitude of the
signal power as a function of frequency).
Step Test Bldr
Profit Suite Toolkit
Honeywell Inc.
05/01
Section 3 Step Test Builder
3.2.4 Signal Synthesis and Evaluation
Single graph Data
Plots
In Single graph Data Plots view, each selected variable is displayed in its
associated plot box. In Single Graph Data Plots, all selected variables are
displayed on the same graph. In this view, the variables can be plotted with the
Normalized Scale option either selected or not. When selected, the y axis will be
independently scaled such that no variable traces overlap (each variable occupies
its own band on the graph). When not selected, the y axis will span the full range
of each variable (each variable occupies the full height of the graph). Selecting
the Single Graph Data Plots option for the demo example will result in the
following display. In this display the normalized option (default) has been used.
Always check this view after each build to ensure that signals were generated as
expected. It is easy to inadvertently set a parameter incorrectly. The above
picture shows the signature typical of a PRBS signal. It should be clear that these
three signals were built in the sequential mode. To magnify the plot (zoom in),
click and hold the left mouse button anywhere in the plot area and drag the cursor
to open up a dashed rectangle. When you release the button the dashed rectangle
will expand to fill the window. Scroll bars will then appear to allow translations
at the current zoom factor. Repeat this procedure to get finer resolution.
Time/date information is displayed on the horizontal axis. Start time is always
00:00:00. The date is the current date. To observe the time of any data point,
move the cursor into the time axis box. A vertical dashed line appears in the
graph above the cursor and the time/date of this line appears in the center of the
time axis box.
05/01
Step Test Builder
Profit Suite Toolkit
Honeywell Inc.
57
Section 3 Step Test Builder
3.2.4 Signal Synthesis and Evaluation
Selecting Data for
Deletion
To delete a range of data, follow the steps below:
− Move the cursor within the time axis box to one end of the desired time range.
The vertical dash dot line and the time /date in the center of the box show the
current position. When the cursor is at the desired end of the time range, press
and hold the left mouse button.
− Move the cursor to the other end of the desired time range. The second
vertical dash dot line that appears and the time/date in the center of the box
correspond to the other end of the range. Release the mouse button. The selected
time range is shown with a gray background.
− Repeat these steps to select additional ranges.
− Hold down the CTRL key and use the above procedures to deselect all or part
of a previously selected range
To actually delete the data, select Edit>Delete. Be sure you really wish to delete
this data. WARNING: At this time there is no undo command. It is also
important to realize that when ranges are selected for deletion, all data between
these ranges will be deleted. In this instance, it does not matter which variables
are selected. Unlike the delete function in the APC identifier, the signal delete
function will NOT insert NaN markers in the data.
Correlation
58
Once the results have been reviewed using the Single Graph Data Plot, the next
step is to review the correlation data. While the PRBS and SCHROED_PRBS
have been designed with power and correlation concerns in mind, it is still
informative to check the correlation view. In cases where the signals have been
modified or it is desired to answer ‘what if’ questions, the correlation information
should always be scrutinized. To observe correlation data, select
View>Correlation.
Step Test Bldr
Profit Suite Toolkit
Honeywell Inc.
05/01
Section 3 Step Test Builder
3.2.4 Signal Synthesis and Evaluation
Correlation information such as that shown above is very useful. The diagonal
elements of the matrix represent the autocorrelation functions while the offdiagonal elements represent the crosscorrelation functions. The horizontal axis in
each plot is time and is specified based on the Settle T parameter. The vertical
axis in each plot is the correlation value. Since the correlation coefficient is
simply the normalized value of the covariance coefficient, the vertical axis will
always range between -.4 and 1.2.
Interpretation of
the Correlation
Plots
Rather than present the correlation information in a mathematical format, the
correlation view is intended to present this information in a more intuitive
fashion. In each plot box a high and low target value as a function of time will be
displayed as a dashed red (default) line. The ultimate goal is to have the
correlation function fall within this band. When it does, the signal will very
closely approximate the ideal characteristics of a white noise signal. The targets
are very conservative. Small excursions should be of no concern.
Values that exceed 0.5-0.6 and are outside the targets may cause a sensitivity in
the resulting data. If this occurs, adjust the signal to reduce the correlation. Only
the autocorrelation at time 0 should have a value equal to 1. If any other values
are equal to 1, the resultant FIR solution in the APC Identifier will be potentially
incorrect.
Correlation relates directly to the sensitivity encountered in the model
identification phase. Perfectly uncorrelated signals would guarantee that the
solution matrix used in the APC Identifier is full and well conditioned (no
sensitivity). As the correlation increases so does the sensitivity. Sensitivity
usually results in model separation as a function of settling time (see APC
Identifier User’s Guide) and therefore a reduction in model confidence.
Correlation plots are excellent indicators of signal effectiveness for the PRBS and
SCHROED_PRBS since these signals are designed to have a uniform power
spectrum over the frequency range of interest. Since power spectrum concerns
are not addressed in user specified signals (i.e. Auto Step), good correlation
results do not necessarily imply good models.
05/01
Step Test Builder
Profit Suite Toolkit
Honeywell Inc.
59
Section 3 Step Test Builder
3.2.4 Signal Synthesis and Evaluation
Edit Data
Data vectors can be manipulated by selecting edit from the main menu as shown
below.
Either the “Block Manipulation” or “Vector Calculation” mode can be used to
modify the data. For a full description of these editing functions see the APC
Identifier User’s Manual. After editing data remember to always check the
correlation curves for the modified data. For example if “MV2” is filtered as
shown below,
then the correlation curves should be updated. To do this select Build>Step Test
Signals from the main menu and remember to use the “Correlation Only” option.
(If this is not done, the modified data will be overwritten with a new signal.).
60
Step Test Bldr
Profit Suite Toolkit
Honeywell Inc.
05/01
Section 3 Step Test Builder
3.2.4 Signal Synthesis and Evaluation
Correlation results for the signals given above are as follows.
While design goals for both the power spectrum and the auto and crosscorrelation functions are attained for unaltered signals, data modification may
result in substantial performance deterioration. Note, for modified signals good
correlation results do not necessarily imply a good power spectrum. In
particular, filtering can have a drastic negative affect on the power spectrum
(which as yet is not available). If filtering signals USER BEWARE.
05/01
Step Test Builder
Profit Suite Toolkit
Honeywell Inc.
61
Section 3 Step Test Builder
3.2.4 Signal Synthesis and Evaluation
Signal Export
Once the signals have been designed to have the desired characteristics, it is then
necessary to make the signals available for external use. To do this select Export
Signals from the Build dropdown dialog box as shown below
Note that auxiliary variables can not be exported. If they are selected as shown
above then the following dialog box will be displayed.
LCN File Format
62
You can export signals to work with the LCN implementation of Honeywell’s online Automated Step Test Application. The output of the export function is a
series of TDC readable Parameter Lists. To generate these files select the Export
option. The following dialog box will be displayed.
Step Test Bldr
Profit Suite Toolkit
Honeywell Inc.
05/01
Section 3 Step Test Builder
3.2.4 Signal Synthesis and Evaluation
The default extension is .xg (LCN compatible). By browsing, the working path
can be set to any directory in the normal fashion. When the Export button is hit,
files will be generated only for those variables that are selected. In the picture
above, the second and third variables would be exported.
Output Filename Convention - Files are saved based on the filename entered in
the Export Signals dialog box and the particular variables selected. The
convention is that all files that are created will use the first five characters (free
format takes the first six characters) of the entered filename. The variable index
will appear as the next character in the filename. For the selection given above the
filenames would be SigDe2.XG and SigDe3.XG respectively.
Once the files are generated, it is then possible to implement the Automated Step
Test Application. A description of the tool is given in Section 3.3.
One constraint to be aware of when exporting these signals is that the LCN
Automated Step Test Application (receiver of these signals) is currently limited to
signals with 1000 elements. If the signal is longer than this limit, then the export
function will give an appropriate error message and request the signals to be
rebuilt with a longer sample rate.
Placement of files created is recorded in the message window. For the example
the message is shown below.
Notice that there are actually four files generated for this example. There is an A
and B file created for each signal. Due to a parameter list read limitation on the
LCN, export files are limited to 500 elements.
05/01
Step Test Builder
Profit Suite Toolkit
Honeywell Inc.
63
Section 3 Step Test Builder
3.2.4 Signal Synthesis and Evaluation
Free File Format
Use the Free File Format to export the signals to a file without the LCN file format
limitations.
Message box created by this command is shown below.
64
Step Test Bldr
Profit Suite Toolkit
Honeywell Inc.
05/01
Section 3 Step Test Builder
3.3 Automated Step Tester
3.3
Automated Step Tester
About this Section
This section describes the on-line portion of the Step Test builder. The
description begins with a discussion of the installation procedure. This section is
followed by sections describing the architecture, configuration and operation of
the Step Tester..
LCN Hardware and
Software
Requirements
To use the Automated Step Tester on the LCN, the requirements described in the
table below must be met.
Requirement
Hardware Platform
05/01
Description
TDC 3000 AM
Special Boards
None
Other Computing Systems
None
LCN Release
Release 410 or later
AM Load Modules
FILE, AMCL02, AMCL03 (Standard AM Load Modules)
US Load Modules
XY Plot (Supplied as part of RMPCT)
Other Packages
None
Other Control Applications
None
Software Inputs
None
Step Test Builder
Profit Suite Toolkit
Honeywell Inc.
65
Section 3 Step Test Builder
3.3 Automated Step Tester
Preparation and
Installation
Step
Action
1.
Gather the following items:
Removable media containing the monitoring software
2.
Make a backup copy of media/directory on the US with drives n and m
configured as follows
Media:
•
FCOPY $Fn $Fm
Directory only:
•
CD $Fm>vol_dir>PICS
•
CD$Fm>vol_dir>4SCH
•
CD $Fm>vol_dir>CDS
•
CD $Fm>vol_dir>AO
•
CD $Fm>vol_dir>EB
•
COPY $Fn>PICS>*.*
$Fm>PICS>=-V -D
•
COPY $Fn>4SCH>*.*
$Fm>4SCH>=-V-D
•
COPY $Fn>CDS>*.*
$Fm>CDS>=-V -D
•
COPY $Fn>AO>*.*
$Fm>AO>=-V -D
•
COPY $Fn>EB>*.*
$Fm>EB>=-V -D
Where $Fn is the drive with the source media and $Fm is the drive with
the target media
CDS Installation
This procedure must be done once per LCN installation.
Step
Action
1.
Set Volume Parameters From Modify volume Paths display:
CL CUSTOM GDF: NET>CDSG>
USER DEFLT PATH: $Fn>CDS
2.
Compile CDS Parameters From the Command Processor display,
compile the CDS files:
CL $Fm>CDS>STEP1CDS.CL -UL -NX
CL $Fm>CDS>STEP2CDS.CL -UL -NX
If it is necessary to change the CDS due to a software revision, refer to
the Application Module Data Control Language/Application Module Data
Entry Manual.
66
Step Test Bldr
Profit Suite Toolkit
Honeywell Inc.
05/01
Section 3 Step Test Builder
3.3 Automated Step Tester
Building a Step
Testing Point
A custom AM application point is required for each Step Testing variable.
IMPORTANT! For multiple MV testing, multiple step testing points must be
built, one per variable. Testing of multiple MVs is a
complex process and should NOT be attempted without
intimate knowledge of both process and testing tools.
Step
1.
Action
Modify Exception Build File STEP_TST.EB
From the Command Processor display:
ED $Fn>EB>STEP_TST.EB[ENTER]
Edit template as follows:
&N point name
UNIT
=unit number
PTDESC
=“point descriptor text”
PERIOD =1MIN (default execution period - Alter as required. If the testing duration is
longer than 1000 intervals, alter the execution frequency in the off-line
software to 2 minutes or more. Likewise, the on-line step testing point
will need to be altered to match the off-line execution frequency.
Note: Release 500 will require alarm priority changes
2.
Load EB File
From the Builder Commands display:
Select the EXCEPTION BUILD target
Fill in ports as:
REFERENCE PATH NAME: $Fn>EB
Load Entities (select target)
Pathname for SOURCE file: STEP_TST.EB
Pathname for IDF file: STEP_TST.DB
[ENTER]
3.
Verify Load
When the load is complete, verify point loading by accessing the point from the [DETAIL]
button.
05/01
Step Test Builder
Profit Suite Toolkit
Honeywell Inc.
67
Section 3 Step Test Builder
3.3 Automated Step Tester
Configuration
Graphics
Installation
Graphics must be compiled and installed once per LCN
Step
1.
2.
3.
4.
Action
Picture Editor
Enter the Picture Editor, one of two ways:
From the Engineering Main Menu select the PICTURE EDITOR target
or
From the Command Processor command line type: PE [ENTER]
Load DDB
Load Global variable definition file, DDB:
L $Fn>PICS>STEP_DDB [ENTER]
Read File
Read in the picture file, STEP_TST (the name of the schematic should not be changed)
R$Fn>4SCH>STEP_TST [ENTER]
COM [ENTER]
Copy File
Copy STEP_TST.DO to the graphics directory:
From the Command Processor display:
COPY $Fn> 4SCH >*.DO NET>pic_dir>= -D [ENTER]
Where pic_dir is the picture source directory specified in the Schematic Search Path.
Graphic STEP_TST.DO
Automated Step
Tester Program
Architecture
68
The tables in this section describe the APC automated step testing program
architecture. This is the part of the Step Test Builder that resides on the LCN.
Step Test Bldr
Profit Suite Toolkit
Honeywell Inc.
05/01
Section 3 Step Test Builder
3.3 Automated Step Tester
Point Structure
Process Inputs
Point Type
AM Custom Point w/CL
PV_Type
CTL_Type
Custom Data Segment
Algorithm
Insertion point
Slots
Output
None
None
2 CDS Packages - STEP1CDS.CL, STEP2CDS.CL
STEP_TST.AO
General
1CL Slot - STEP_TST
The system information is stored to CDS values
Parameter
FLOW_PT(0..1)
Configuration
Inputs (STEP2CDS)
Tagname of the MV to be tested
Parameter
Flag
Calculation Outputs
Description
Units
N/A
Description
Critical2
Yes
No
X
Units
Turns the step testing routine ON and OFF
None
ENGPAR(1)
Number of steptest coefficients used
None
ENGPAR(2)
Maximum one direction step size (actual Max=2*value)
Process
ENGPAR(3)
Setpoint or Output Direct (0 => Setpoint, 1 => Output)
None
ENGPAR(4)
XYPlot History trend time span (1 . . . 120)
none
ENGPAR(5)
XYPlot Future trend time span (1 . . . 120)
none
XEULO
XYPlot Low limit
Process
XEUHI
XYPlot High limit
Process
X(1 . . . 1000)
Step test coefficient vector (generated by offline software)
None
Parameter
Description
Units
REV_NO
Software revision number
None
CALC_VAL(1)
Current step test interval
None
CALC_VAL(2)
Starting / average value of the testing MV
CALC_VAL(3)
Display update Flag used for XYPLOT
X2(1 . . . 120)
MV history information for plotting
Process
X3(1 . . . 120)
MV future information for plotting
Process
TIMEDESC(1)
Step test starting time
Time
TIMEDESC(2)
Steptest length
Time
TIMEDESC(3)
Steptest time remaining
Time
Process
None
2
Critical indicates that a bad input causes the output of the calculation to be set BAD.
05/01
Step Test Builder
Profit Suite Toolkit
Honeywell Inc.
69
Section 3 Step Test Builder
3.3 Automated Step Tester
Configuring an
Automatic Step
Test Application
Note – Link Errors
Point Config
Using Graphic
STEP_TST
Configuration of the step testing application can be done either through the
graphic STEP_TST or through direct entry to the CDS ports on the Point Detail
display.
Use of the application graphic is recommended.
Setup of the calculation point requires the following steps:
• Graphic or Non Graphic Configuration of Step Testing Point
• Linking CL Program
Link errors may occur, when an improper point type is configured in a CDS
parameter. This is caused by a missing parameter. A null point containing all
required parameters can be used in the configuration for linking purposes only.
After the CL is linked, the desired point is then entered into the proper CDS
location.
Each entry port on the automated step testing graphic, STEP_TST, is described
below.
Graphic STEP_TST
70
Step Test Bldr
Profit Suite Toolkit
Honeywell Inc.
05/01
Section 3 Step Test Builder
3.3 Automated Step Tester
STEP_TST
Targets Explained
Selection Port
Parameter
Step Testing Point
$_LCNPNT
Step Test MV Point
MV Move Type
Maximum Move
Allowed
FLOW_PT(0)
ENGPAR(3)
ENGPAR(2)
Number of Intervals
Average MV Setpoint
ENGPAR(1)
CALC_VAL(2)
Action
Store the step testing point into a display database
variable
Store the desired MV name into the step test application
Defines the MV parameter to be adjusted(SP / OP)
Defines the maximum move in a single direction
(Total max. move is 2 * ENGPAR(2))
Number of step test coef.. - (off-line dependent)
MV valve at start of test (Filled in Automatically)
Application
Configuration
through Direct
CDS Entry
If the application graphic is not used, then the configuration data must be entered
directly onto the step testing point. The required information and associated
parameters are listed below.
Configuration
Parameters
Parameter
Description
Comments
FLOW_PT(0)
Tagname of the MV to be tested
The software will copy this into FLOW_PT(1)
ENGPAR(2)
Maximum step size allow
This is a single direct step, the maximum testing
step will be 2 times this value
ENGPAR(3)
Setpoint or output connection
Specifies whether your are going to write to an
MV, SP, or OP for testing.
CALC_VAL(2)
Starting / Average MV at test
start
This parameter may be altered during the course
of the test in response to operation concerns
FLAG
Start or Stop the step test
Starts the test when set ON
05/01
Step Test Builder
Profit Suite Toolkit
Honeywell Inc.
71
Section 3 Step Test Builder
3.3 Automated Step Tester
Loading the
Step Test
Coefficients
Step testing coefficients are created by the off-line software. The signal generator
will generate one or two files which need to be transferred and loaded onto the step
testing point through an alter parameter function.
Step
Go to Command
Processor
Action
Enter the Command Processor, one of two ways:
From the Engineering Main Menu select the Builder Commands target or
From the Command Processor command line type: CMD [ENTER]
Select the Alter
Parameters target
Select field titled “ALTER PARAMETERS”
Reference Path
Fill in the Reference Path Name field
$Fn>dir>
Where (n) = drive specification
dir = Directory containing the test files
Selection List
Enter the name of the step testing application point to be updated with the offline information
Parameter
Information
Enter the name of the file which contains the information generated by the offline software and [ENTER]
Recall that (2) files might be generated by the off-line software, therefore the
above procedure may have to be executed twice, once for each file
Link CL
Programs
Step
Action
Link STEP_TST
From the Command Processor Display:
LK $Fm>AO>STEP_TST point_name [ENTER]
72
Activate point
Call up the point detail and activate the point.
Verify Operation
Verify that STEP_TST is running without any CL errors
Step Test Bldr
Profit Suite Toolkit
Honeywell Inc.
05/01
Section 3 Step Test Builder
3.3 Automated Step Tester
On-line Error
Messages
This section reviews the messages generated by the step test algorithm and provides
a more detailed description of their meaning
Message
(1) “Step Test
Program Move
Parameter FAILED”
(2) “Step Test
Program Terminated”
•
Meaning
•
This message is generated if the software encounters an error when
copying the MV entity name listed in FLOW_PT(0) into FLOW_PT(1).
This operation is typically done when a new entity name is entered
through the display STEP_TST.
•
If this error occurs, check to make sure the entity name is correct and that
LCN configuration allows access to the unit assigned to this entity.
•
If the step testing point was built with an execution period equal to
“NOPERIOD” the software will terminate. An execution period is required
for operation and for most cases should be set to 1 minute. Processes
with unusually fast or slow dynamics may require different execution
periods.
•
This message is generated when a step testing application has been
started and the down stream MV is not in the proper mode or operations
change the mode during the course of the test. If this error is
encountered the test will terminate, clear the step testing coefficients, and
send the above message to the message summary.
•
MV must be:
“Step Test Program
Requires an
Execution Period”
(3) “Step Test
Program Terminated”
“Step Test MV Mode
must be P-AUTO”
(4) “Step Test
Program Completed”
05/01
•
PROGRAM_AUTO Þ
•
PROGRAM_MAN
•
Þ
•
é P _ AU TO = SP ù
êP _ M AN = OP ú
ë
û
•
If P-AUTO MV must be “SPC” configured
•
then
•
P-MAN
MV must be “DDC” configured.
This message is sent to the alarm summary to notify operations that the
test has completed and they can now return the MV to its normal mode.
Step Test Builder
Profit Suite Toolkit
Honeywell Inc.
73
Section 3 Step Test Builder
3.3 Automated Step Tester
74
Step Test Bldr
Profit Suite Toolkit
Honeywell Inc.
05/01
Gain Scheduler
(Optional Item)
5/01
Gain Scheduler
Profit Suite Toolkit
Honeywell Inc.
75
.
Profit Suite Toolkit
Honeywell Inc.
Section 4 — Gain Scheduler
4.1 Overview
Definition
This document describes the software supplied, installation of the software,
requirements to run the software, how to use the software and error diagnostics.
This version supports any Profit Controller running on Honeywell’s TPS system.
Application
The Profit Controller can be on, in warm, or off. The existing gains are changed
to the user entered gains by updating the multipliers on the gain delay point and
then notifying Profit Controller that new multipliers are available. This package
can support up to 100 gain changes at a time.
Acronym List
Acronym
AM
DCS
LCN
US
PV
MV
RMPCT
PL
CDS
AO
Hardware and
Software
Requirements
Requirements
Hardware Platform
Special Boards
Other Computing Systems
LCN Release
AM Load Modules
US Load Modules
Other Packages
Other Control Applications
Software Inputs
5/01
Term
Application Module
Distributed Control System
Local Control Network
Universal Station
Process variable
Manipulated variable
Robust Multivariable Predictive Control Technology
Parameter List
Custom data segment
CL object code file extension
Description
TDC 3000 AM
None
None
Release 410 or later
None
None
None
RMPCT Release 150 or later
See Process Inputs
Gain Scheduler
Profit Suite Toolkit
Honeywell Inc.
77
Section 4 — Gain Scheduler
4.2 Software Description
4.2 Software Description
Overview
This software package is designed to automatically update gains in a Profit
Controller. The Profit Controller can be on, in warm, or off. The existing gains
are changed to the user entered gains by updating the multipliers on the gain delay
point and then notifying Profit Controller that new multipliers are available. This
package can support up to 100 gain changes at a time.
Software
Structure
The inputs to the software consist of the CV to change, the MV or DV to change,
the new gain value, a tolerance by which the new gain must exceed before
updating, a tolerance by which the new gain must not exceed before updating, a
digital filter for allowing a transition between gain changes, and a flag to
determine where messages are sent. The CDS parameters that correspond to the
inputs are given in the following table.
78
Gain Scheduler
Profit Suite Toolkit
Honeywell Inc.
05/01
Section 4 — Gain Scheduler
4.2 Software Description
Parameter
P1
P2
G
TD
X1
X2
F
Software
Supplied
Software
Installation
Description
A list of CV locations whose gains will change - a row number.
A list of the corresponding MVs or DVs to the CVs in P1 - a column number
A list of corresponding new gain value for each CV/MVDV pair.
A list of corresponding digital filters for each gain.
A list of corresponding minimum tolerance in % for each gain.
A list of corresponding maximum tolerance in % for each gain.
A flag to determine where messaging will be sent. On - to operator. Off - to log
only.
This software is composed of three parts.
1. A CL object (RMPCGMAP.AO) that supports an AM custom point
structure.
2. A CDS package (RGMAPCDS.CL) that holds data for the CL object.
3. A PL package (RGD_PL.CL) that is an update to the RMPCT RGD_PL
package prior to RMPCT Release 160.
The software installation process consists of six steps. A Prerequisite for installing
the software is that the Profit Controller software is already installed.
1. Note: this step is only necessary if the installed version of Profit Controller
is prior to 160.
Compile the RGD_PL.CL file by typing in
CL $Fn>PL>RGD_PL -UL -NX
from the command line. Where $Fn refers to the device where the delivered
software is located.
2. Compile the RGMAPCDS.CL file by typing in
CL $Fn>CDS>RGMAPCDS -UL -NX
From the command line. Where $Fn refers to the device where the delivered
software is located. Note that if this is an upgrade from previous versions the
-OCD argument must also be included on the command line.
5/01
Gain Scheduler
Profit Suite Toolkit
Honeywell Inc.
79
Section 4 — Gain Scheduler
4.2 Software Description
3. Build an AM custom point on the system. The execution time can be
NOPERIOD if point will be PPSd or it can be scheduled. Specify one CL block,
one package, and the package name RGMAPCDS.
4. From either the data entity builder or the point detail, enter in the name of
the RMPCT main controller point in the ANAME CDS parameter and the
name of the gain/delay point, associated with the RMPCT main controller
point, in the BNAME CDS parameter.
5. Link the RMPCGMAP.AO to the point by typing in
LK $Fn>AO>RMPCGMAP POINT_NAME
Configuration
From the command line. Where $Fn Refers to the device where the
delivered software is located and POINT_NAME refers to the name of the
gain updating point. Note that if you link without first entering the name of
the RMPCT main controller point or the gain/delay point, the program will
fail with a CONFIG error when executed. Also note that if you change the
point name reference of a CV or MV interface point on either the gain/delay
point or the main controller point, you must relink to establish the pointer to
the new CV or MV interface point. Not doing so will cause the program to
still use the old point name.
6. Before setting the point ACTIVE, make sure that the software is properly
configured. Especially if connecting to an on-line RMPCT controller.
Activating with improper configuration could cause a severe upset in plant
operation.
In order to configure the software, the user must supply entries to the
aforementioned parameters. The user must identify the CV/MV or CV/DV pairs
whose gains will be changed. This is done by identifying the CVs by their
numerical order in the Profit Controller and identifying the MVs and DVs by their
numerical order in the Profit Controller. Note that DVs must be treated as an
extension to the MVs. For example: Let’s say that Profit Controller had five CVs
three MVs and two DVs. If the user wanted to change the gains of CV3 and MV2
to 5, CV3 and DV2 to 2.2, CV4 and MV1 to 0.25, CV4 and MV3 to 0.1, and CV4
and DV1 to 0.5, the corresponding values of parameters P1, P2 and G would be as
follows.
Array
Location
1
2
3
4
5
80
P1
P2
G
3
3
4
4
4
2
5
1
3
4
5
2.2
0.25
0.1
0.5
Description
Change gain of CV3 and MV2 to 5
Change gain of CV3 and DV2 to 2.2
Change gain of CV4 and MV1 to 0.25
Change gain of CV4 and MV3 to 0.1
Change gain of CV4 and DV1 to 0.5
Gain Scheduler
Profit Suite Toolkit
Honeywell Inc.
5/01
Section 4 — Gain Scheduler
4.2 Software Description
Limitations
Trouble
Shooting
5/01
Note that the array location where the CV/MV or CV/DV pair is entered is not
relevant. All that the user must ensure is that the CV number and MV/DV number
that identify the pair and the new gain are entered into the same their respective
array with the same index. If either P1 or P2 contains a zero or a negative value in
the array, the code will terminate at that location in the array without updating any
more gains. P1 and P2 must be integers.
In addition to entering the location of the CV/MV or CV/DV pair and the new
gain, the user can enter a minimum and maximum tolerance value. The minimum
tolerance value is in percent. It indicates that the new gain must change from the
old gain by more than this percentage or the update will be ignored. The allowed
values range from zero (which is the default) to any number. The maximum
tolerance value is in percent. It indicates that the new gain must change from the
old gain by less than this percentage or the update will be ignored. The allowed
values range from zero to any number (the default is 100).
The digital filter allows the user to apply weighting to the new entered gain and
old gain in order to determine the ultimate new gain. The allowed values range
from zero to one (one being the default). A value of one corresponds to taking the
new entered gain with no weight from the old gain. A value of 0.5 corresponds to
taking half of the new entered gain and half of the old gain to calculate the
ultimate new gain, and etc. The gain scheduler point should be scheduled to run
periodically to take full advantage of this feature.
Note that changing the sign of a gain is allowed as long as the percent of the
difference lies between the maximum and minimum tolerances.
This software is limited to a maximum of 100 gain elements per execution. If
more than 100 elements is required, the user can build a second point to update the
gains of the second 100 elements. If more than 200 gains need to be updated, then
build a third point and so on. Note that Profit Controller is designed to only
accommodate gain changes for the first 1000 non-zero gain elements. Therefore,
if you have a very large matrix, it is recommended that you set up Profit Controller
so that the CVs that require gain updates are within the first 1000 non-zero gains.
The package is built to check and report error conditions as well as flag whether a
gain was updated or updating was bypassed. If an error condition was
encountered, the software is designed to send a message to the operator message
summary. If desired, this can be suppressed and messages will only be sent to the
message log. Additionally, when an error is encountered, the status of the
individual gain, that had the error, will be set to a value corresponding to the error.
If no error occurred, but the gain updating was skipped due to tolerance violation,
there is no message, but the status value will be set to flag the reason for skipping
the updating. An error message once detected is only raised once in order to
prevent the same message from being re-issued every time the gain scheduler runs.
The following table describes the error codes and messages.
Gain Scheduler
Profit Suite Toolkit
Honeywell Inc.
81
Section 4 — Gain Scheduler
4.3 Error Messages
4.3 Error Messages
Error
Code
100
101
102
103
104
105
10
11
82
Error Message
Error Description
Recommendation
Auto gain scheduling was bypassed
for GU_PT_NAME.
Error occurred at time = Time.
NULL value for main controller point
name.
Auto gain scheduling was bypassed
for GU_PT_NAME.
Error occurred at time = Time.
Main controller point
MAIN_PT_NAME INACTIVE.
Auto gain scheduling was bypassed
for GU_PT_NAME.
Error occurred at time = Time.
NULL value for Gain/Delay point
name.
Auto gain scheduling was bypassed
for GU_PT_NAME.
Error occurred at time = Time.
Gain/Delay point G/D_PT_NAME
INACTIVE.
Auto gain scheduling was bypassed
for GU_PT_NAME.
Error occurred at time = Time.
BAD G/D index for CV number = i
and MV/DV number = j.
Make sure RMPCT MAIN_PT_NAME
is properly configured.
Auto gain scheduling was bypassed
for GU_PT_NAME.
Error occurred at time = Time.
Bad gain for CV number = i
and MV/DV number = j.
Make sure RMPCT MAIN_PT_NAME
is properly configured.
Index for P1 array location = i
is outside the bounds of RMPCT
MAIN_PT_NAME.
Updating for this CV/(MV/DV) pair
skipped.
The Profit Controller that the gain
updater is configured for was not
configured or has become
unavailable.
Ensure that the main controller
point name was entered in
parameter ANAME before
linking and that the main point
exists on the system.
Check that the main controller
point name is ACTIVE.
Otherwise, gain updating does
not make sense.
Index for P2 array location = i
is outside the bounds of RMPCT
MAIN_PT_NAME.
Updating for this CV/(MV/DV) pair
skipped.
The MV/DV number entered into the
P2 parameter at array location i is
larger than the number of MVs +
DVs specified in the configured
Profit Controller, or the value
The Profit Controller that the gain
updater is configured for is not
ACTIVE.
The Profit Controller gain/delay point
that the gain updater is configured
for was not configured or has
become unavailable.
The Profit Controller gain/delay
point that the gain updater is
configured for is not ACTIVE.
Check that the gain/delay point
name was entered in parameter
BNAME before linking and that
the gain/delay point exists on
the system.
Check that the gain/delay point
name is ACTIVE. Otherwise,
gain updating does not make
sense.
The gain/delay index for the ith CV
and jth MV/DV was a bad value.
This is typically due to improper
configuration of the main Profit
Controller point.
Check to make sure that the
main controller point and the
gain/delay point have been
activated and are properly
configured.
The gain from the off-line design for
the ith CV and jth MV/DV is a bad
value. This is typically due to
improper configuration of the main
Profit Controller point.
Check that the main controller
point and the gain/delay point
have been activated and are
properly configured.
The CV number entered into the P1
parameter at array location i is larger
than the number of CVs specified in
the configured Profit Controller or
the value specified is a fraction.
Check that the CV number
entered in this array element is
within bounds or that you have
connected to the proper main
controller and/or gain/delay
point.
Check that the MV/DV number
entered in for this array element
is within bounds and that you
have connected to the proper
main controller and/or
Gain Scheduler
Profit Suite Toolkit
Honeywell Inc.
5/01
Section 4 — Gain Scheduler
4.3 Error Messages
Error
Code
Error Message
Error Description
Recommendation
specified is a fraction.
The gain/delay index for the ith CV
and jth MV/DV is greater than 1000.
The current limitation in Profit
Controller is 1000.
gain/delay point.
The elements are counted
starting from CV1 and all its
MV/DV models then CV2 and so
on. If this gain is necessary to
update, you must move this CV
up in the order.
Make the off-line gain non-zero
if updating this gain is required.
12
G/D index for CV number = i
and MV/DV number = j is greater than
1000.
Updating for this CV/(MV/DV) pair
skipped.
13
Zero G/D index for CV number = i
and MV/DV number = j.
You cannot update a gain that is null.
Updating for this CV/(MV/DV) pair
skipped.
The gain from the off-line design for
the ith CV and the jth MV/DV is zero.
Changing the multiplier will not
change the gain.
14
Bad gain for G array location = i.
Updating for this CV/(MV/DV) pair
skipped.
15
Bad filter for TD array location = i.
Updating for this CV/(MV/DV) pair
skipped.
1
No Message
2
No Message
The new gain entered into the G
parameter array location i is a bad
value. The updating for the gain of
the CV number entered into the P1
parameter array location i and the
MV/DV number entered into the P2
parameter array location i was
skipped over.
The filter entered into the TD
parameter array location i is a bad
value. The filter must be between 0
and 1.
No error has occurred, but the gain
update was skipped since its
change is smaller than the minimum
change tolerance
No error has occurred, but the gain
update was skipped since its
change is larger than the maximum
change tolerance
Ensure that the gain entered in
this location is a good value.
Ensure that the filter value in
this location is between 0 and 1.
On occasion, the user may get a CL error. This error will typically be a CONFIG
error. If this is the case, the user should make sure that a main controller point name
was entered into the ANAME parameter and that a gain/delay point name was
entered into the BNAME parameter before the RMPCGMAP.AO was linked.
5/01
Gain Scheduler
Profit Suite Toolkit
Honeywell Inc.
83
Performance
Monitor
(Optional Item)
5/01
Performance Monitor
Profit Suite Toolkit
Honeywell Inc.
85
86
Performance Monitor
Profit Suite Toolkit
Honeywell Inc.
5/01
Section 5 ---- Performance Monitor
5.1 Overview
Definition
The Performance Monitor is designed to provide a mechanism to track unit
performance with and without an Profit Controller cascaded to downstream
controllers.
Application
The performance monitor collects information related to a specific controller and
generates a report based on the user’s configuration. Statistical information such
as averages, standard deviations, and percentages are provided. If the controller
is not active, averages and standard deviations are determined and provided for a
base-line for comparison.
Calculation
The Performance Monitor calculates statistical information based on information
from:
Purpose
Process inputs:
Profit Controller Tagname
Calculated values:
Controller percentage uptime and additional
statistical information related to the controller’s
performance.
Provide information as to the amount of time the controller was actively
controlling the process.
Provide information related to which controller constraints were active and
therefore a bottle neck for the unit.
Provide statistical information for the unit while the controller was NOT active
which provides a performance baseline.
Hardware and
Software
Requirements
Hardware Platform
Special Boards
Other Computing Systems
LCN Release
AM Load Modules
US Load Modules
Other Packages
Other Control Applications
Software Inputs
5/01
Description
Requirement
Performance Monitor
Profit Suite Toolkit
Honeywell Inc.
TDC 3000 AM
None
None
Release 410 or later
FILE, AMCL02, (Standard AM
Load Modules)
None
None
RMPCT Release 120 or later
None
87
Section 5 ---- Performance Monitor
5.2 Detailed Description
5.2 Detailed Description
Overview
The tables in this section describe the Performance Monitor program architecture:
• Point Structure
• Process Inputs
• Configuration Inputs
• Calculation Outputs.
Point Structure
Point Structure
Point Type
AM Custom, CL
AM Custom
None
Custom Data Segment
RPRF_CDS.CL
Algorithm
RMPC_PRF.AO , RMPC_RPT.AO
Insertion Points
General and Background
Slots
7 CL Slots - (1/3/5/7) General, (1/3/5) Background
Output
The system information is stored to CDS values.
Process Inputs
Process Inputs
3
Critical
Parameter
Description
Units
Yes
ANAME
Tagname of the RMPCT controller
N/A
X
P1(0)
Tagname of the CV Dummy point
N/A
X
P2(0)
Tagname of the MV Dummy point
N/A
X
No
All additional information regarding controller MV’s and CV’s is determined from
the controller point. During the “CONFIGURATION” phase the monitor will
examine the controller and store all required information to CDS parameters.
3
Critical indicates that a bad input causes the output of the calculation to be set BAD.
88
Performance Monitor
Profit Suite Toolkit
Honeywell Inc.
05/01
Section 5 ---- Performance Monitor
5.2 Detailed Description
Configuration
Inputs
RPRF_CDS
Configuration Inputs (RPRF_CDS)
Parameter
Description
FL(1)
Monitor Activation Status (ON => Active)
None
FL(4)
Reporting Flag (ON => Monthly, OFF => Daily)
None
FL(5)
Reporting Flag (ON => Initialize value after report)
None
ENGPAR(1)
Number of days within a daily reporting cycle
Days
PATHNAME
File Pathname (i.e. NET>RMPC>FILE.XX)
None
Calculation
Outputs
Calculation Outputs
Parameter
DESCRIPT
MONTH
DAY
NUMPTS(1)
NUMPTS(2)
CALC_VAL(1)
CALC_VAL(2)
CALC_VAL(3)
CALC_VAL(4)
CALC_VAL(5)
CALC_VAL(6)
CALC_VAL(7)
MODEAPPL(1)
MODEAPPL(2)
5/01
Units
Description
RMPCT Controller description
Current monitoring month - (String)
Current monitoring day - (String)
Number of controller CV points
Number of controller MV points
Total number of monitoring counts
RMPCT Controller ON counts
RMPCT Controller OFF counts
RMPCT Controller OPT counts
RMPCT Controller CTL counts
RMPCT Controller HDL counts
Number of days within the current reporting period
RMPCT percent up time
RMPCT percent optimizing time
Performance Monitor
Profit Suite Toolkit
Honeywell Inc.
Units
None
Months
Days
None
None
Counts
Counts
Counts
Counts
Counts
Counts
Counts
%
%
89
Section 5 ---- Performance Monitor
5.2 Detailed Description
Calculation
Outputs
90
Calculation Outputs
Parameter
Description
MODEAPPL(3)
MODEAPPL(4)
TIMEDESC(1)
TIMEDESC(2)
TIMEDESC(3)
RMPCT percent control time
RMPCT percent handling constraint time
Last initialization time
Last execution time
Time difference
P1(0..40)
Profit Controller CV Points ( 0 = Null Point RMPCCV00)
P2(0..20)
Profit Controller MV Points (0 = Null Point RMPCMV00)
SPLOLM
SPEULO
SPLOTR
SPHILM
SPEUHI
SPHITR
SPLOFL
SPHIFL
SP
SPP
SPTV
SPTVP
SPLOCK
SPREC
SPSTS
SPOPT
Minimum MV LOW limit entered
Maximum MV LOW limit entered
Average MV LOW limit
Minimum MV HIGH limit entered
Maximum MV HIGH limit entered
Average MV HIGH limit
% Time at MV LOW limit
% Time at MV HIGH limit
MV average setpoint (w/ Profit Controller ON)
MV setpoint standard deviation (w/ Profit Controller ON)
MV average setpoint (w/ Profit Controller OFF)
MV setpoint standard deviation (w/ Profit Controller OFF)
% Time the MV experienced WINDUP
% Time the MV was under operator control (w/ Profit Controller ON)
% Time the MV was MAX MOVE limited by Profit Controller
Average MV steady state target value
Performance Monitor
Profit Suite Toolkit
Honeywell Inc.
Units
%
%
Time
Time
Time
Entities
Entities
MV Units
MV Units
MV Units
MV Units
MV Units
MV Units
Percent
Percent
MV Units
MV Units
MV Units
MV Units
Percent
Percent
Percent
MV Units
05/01
Section 5 ---- Performance Monitor
5.2 Detailed Description
Calculation Outputs
Parameter
Units
X
MV controlled by Profit Controller count
Counts
X1
MV at LOW limit count
Counts
X2
MV at HIGH limit count
Counts
X3
MV was MAX MOVE limited count
Counts
X4
MV under OPR control count
Counts
X5
MV experienced WINDUP count
Counts
PVLOLM
Minimum CV LOW limit entered
CV Units
PVEULO
Maximum CV LOW limit entered
CV Units
PVLOTR
Average CV LOW limit
CV Units
PVHILM
Minimum CV HIGH limit entered
CV Units
PVEUHI
Maximum CV HIGH limit entered
CV Units
PVHITR
Average CV HIGH limit
CV Units
PVLOFL
% Time at CV LOW limit
Percent
PVHIFL
% Time at CV HIGH limit
Percent
PV
CV average setpoint (w/ Profit Controller ON)
CV Units
PVP
CV setpoint standard deviation (w/ Profit Controller ON)
CV Units
PVTV
CV average setpoint (w/ Profit Controller OFF)
CV Units
PVTVP
CV setpoint standard deviation (w/ Profit Controller OFF)
CV Units
PVLST
% Time a CV violated its limits
Percent
PVSTS
% Time the CV status was GOOD
Percent
CTLOPT
Average CV steady state target
CV Units
Q
Average Error Model versus Plant - (NOT IMPLEMENTED)
N/A
QSTS
Standard Deviation of model error (NOT IMPLEMENTED)
N/A
B
CV status GOOD count
Counts
B1
CV at a LOW limit count
Counts
B2
CV at a HIGH limit count
Counts
B3
CV limit violation count
Counts
PVT
STATUS
05/01
Description
CV limit violation tolerance - (Default is 0.10)
Routine Error codes used for diagnostics
Performance Monitor
Profit Suite Toolkit
Honeywell Inc.
CV Units
None
91
Section 5 ---- Performance Monitor
5.3 Installation Procedure
5.3 Installation Procedure
Overview
This section describes the installation procedure for the Performance monitoring
application on the TPS and covers the following topics:
•
•
•
•
Preliminary
Requirement
Task 1 Prepare
for Installation
Preparation for Installation
CDS and PL Installation
Building a Performance Monitoring Point
Graphics Installation.
Prior to building a Performance Monitor, one Profit Controller with at least one
manipulated variable (MV) and one controlled variable (CV) must exist on the
control system.
Step
1.
Action
Gather the following items:
Removable media containing the monitoring software.
2.
Make Media Backup : Copy each Directory
For each directory on the source media, create the directory on the
backup media and copy all files to the backup media's directory:
CD $Fm>vol_dir> src_dir
COPY $Fn>src_dir>*.* $Fm>src_dir>= -V -D
Where
$Fm is the backup media drive
$Fn is the source media drive
vol_dir is the backup media's root directory
src_dir is one of the source media's directories
Example:
CD $F2>STD> AO
COPY $F1>AO>*.* $F2>AO>= -V -D
CD $F2>STD> CDS
COPY $F1>CDS>*.* $F2>CDS>= -V -D
Task 2 CDS &
PL Installation
Step
1.
Action
This task must be done once per LCN installation.
Set volume
From Modify Volume Paths display:
pathnames
CL CUSTOM GDF: NET>CDSG>
USER DEFLT PATH: $Fn>4SCH
92
Performance Monitor
Profit Suite Toolkit
Honeywell Inc.
05/01
Section 5 ---- Performance Monitor
5.3 Installation Procedure
Step
2.
Action
Compile
Param List
RPRF_PL.C
L
From the Command Processor display, compile the PL file,
RPRF_PL:
CL $Fn>PL>RPRF_PL.CL -UL -NX
If it is necessary to change the PL due to a software revision,
refer to the Application Module Data Control
Language/Application Module Data Entry
3
Compile
CDS Param
RPRF_CDS.
CL
From the Command Processor display, compile the CDS file,
RPRF_CDS:
CL $Fn>CDS>RPRF_CDS.CL -UL -NX
If it is necessary to change the CDS due to a software
revision, refer to the Application Module Data Control
Language/Application Module Data Entry
Task 3 Building
Performance
Monitoring Point
Step
1
05/01
Action
Modify Exception Build file, RMPC_PRF.EB
A custom AM application point is required for each Profit Controller
monitoring point.
From the Command Processor display:
ED $Fn>EB>RMPC_PRF.EB [ENTER]
Edit template as follows:
&N {ENTER NEW MONITOR POINT NAME}
UNIT
= Enter unit number
PTDESC = "Enter Descriptor for point "
KEYWORD = "PERF_MON"
CLSLOTS = 7
NOPKG
=1
PKGNAME(1) = "RPRF_CDS"
PERIOD = 1MIN {Change period if needed}
ANAME
= Enter RMPCT controller name
ENGPAR(1) = 1.0
{ Desired number of days }
ENGPAR(2) = 0.0
{ SPARE }
ENGPAR(3) = 0.0
{ SPARE }
PATHNAME = "NET>DC>PERFILE1.XX"
{Change pathname & File}
P1(0)
= PRP1CV01
{Actual RMPC CV interface point name}
P2(0)
= PRP1MV01
{Actual RMPC MV interface point name}
Performance Monitor
Profit Suite Toolkit
Honeywell Inc.
93
Section 5 ---- Performance Monitor
5.3 Installation Procedure
Step
2.
Action
Load EB file.
From the Builder Commands display:
Select the EXCEPTION BUILD target.
Fill in ports as:
REFERENCE PATH NAME: $Fn>EB
Load Entities (select target)
Pathname for SOURCE file: RMPC_PRF.EB
Pathname for IDF file: RMPC_PRF.DB
[ENTER]
3.
Verify load
When the load is complete, verify point loading by calling the point
detail from the [DETAIL] button
Task 4
Configuration
Graphics
Installation
Step
Action
Comments
Graphics must be compiled and installed once per LCN.
1
2.
Note on
verification of
the graphics
Load DDB
Enter the Picture Editor, one of two ways:
From the Engineering Main Menu select the
PICTURE EDITOR target
or
From the Command Processor command line
type PE [ENTER]
Load Global variable definition file, DDB:
L $Fn>PICS>DDB [ENTER]
During verification the Picture Editor will ask the type of the variable &I.
&I is of type Integer or I. I should be entered as the response
3.
94
Go to Picture Editor
Read Files
Performance Monitor
Profit Suite Toolkit
Honeywell Inc.
05/01
Section 5 ---- Performance Monitor
5.3 Installation Procedure
Task 4
Continued
Step
Action
Read RMPC_PRF
Comments
Read in the picture file, RMPC_PRF
Read RPRF_CTL
R $Fn>4SCH>RMPC_PRF [ENTER]
VER [ENTER]
COM [ENTER]
Read in the picture file, RPRF_CTL
Read RPRF_MVL
R $Fn>4SCH>RPRF_CTL [ENTER]
VER [ENTER]
COM [ENTER]
Read in the picture file, RPRF_MVL
R $Fn>4SCH>RPRF_MVL [ENTER]
VER [ENTER]
COM [ENTER]
Read RPRF_MVS
Read in the picture file, RPRF_MVS
R $Fn>4SCH>RPRF_MVS [ENTER]
VER [ENTER]
COM [ENTER]
Read RPRF_MVA
Read in the picture file, RPRF_MVA
R $Fn>4SCH>RPRF_MVA [ENTER]
VER [ENTER]
COM [ENTER]
Read RPRF_CVL
Read in the picture file, RPRF_CVL
R $Fn>4SCH>RPRF_CVL [ENTER]
VER [ENTER]
COM [ENTER]
Read RPRF_CVM
Read in the picture file, RPRF_CVM
R $Fn>4SCH>RPRF_CVM [ENTER]
VER [ENTER]
COM [ENTER]
Read RPRF_CVS
Read in the picture file, RPRF_CVS
R $Fn>4SCH>RPRF_CVS [ENTER]
VER [ENTER]
COM [ENTER]
Read RPRF_CVA
Read in the picture file, RPRF_CVA
R $Fn>4SCH>RPRF_CVA [ENTER]
VER [ENTER]
COM [ENTER]
4.
5/01
Copy all of the
Performance
Monitor Graphics to
the Executable
graphics directory.
From the Command Processor display:
COPY $Fn>4SCH>*.DO NET>pic_dir>= -D-V
[ENTER]
Where pic_dir is the picture source directory specified
in the Schematic Search Path,
which is found in the SYST_MENU, Organizational
Summary page.
Performance Monitor
Profit Suite Toolkit
Honeywell Inc.
95
Section 5 ---- Performance Monitor
5.4 Configuring a Monitoring Application
5.4 Configuring a Monitoring Application
Overview
Configuration of the Performance Monitor can be done either through the graphic
RMPC_PRF or through direct entry to the CDS ports on the Point Detail display.
Use of the application graphic is recommended.
Setup of the
Calculation Point
Setup of the calculation point requires the following steps:
Graphic or Non Graphic Configuration of Performance Monitoring Point
Linking CL Program.
Notes: Configuration errors may occur if associated points are deleted. To correct
this problem, the AO files must be unlinked and then relinked to
reestablish dynamic indirection.
Link errors may occur, when an improper point type is configured in a
CDS parameter. This is caused by a missing parameter. A dummy point
containing all required parameters can be used in the configuration for
linking purposes only. After the CL is linked, the desired point is then
entered into the proper CDS location.
Any dummy point used in the P1(0) pointname must have the following
parameters: N(1), N(2), PV, T(3), T(7), T(9), X(1), X(2), X(17), X(18)
Any dummy point used in the P2(0) pointname must have the following
parameters: D(1), D(2), T(1), T(12), T(4), T(5), X(1), X(2), X(17), X(18)
96
Performance Monitor
Profit Suite Toolkit
Honeywell Inc.
5/01
Section 5 ---- Performance Monitor
5.4 Configuring a Monitoring Application
Point
Configuration
Using Graphic
RMPC_PRF
Each entry port on the performance monitoring graphic, RMPC_PRF, is
described below.
Graphic RMPC_PRF
5/01
Performance Monitor
Profit Suite Toolkit
Honeywell Inc.
97
Section 5 ---- Performance Monitor
5.4 Configuring a Monitoring Application
Link CL Programs
Step
Action
Check ANAME
Make sure that the desired Profit Controller name is listed within the CDS
field ANAME
Check P1(0)
Ensure that the P1(0) parameter contains the name of an actual RMPC CV
interface point.
Check P2(0)
Ensure that the P2(0) parameter contains the name of an actual RMPC MV
interface point.
Link RMPC_PRF
From the Command Processor Display:
LK $Fn>AO>RMPC_PRF point_name [ENTER]
Link RMPC_RPT
From the Command Processor Display:
LK $Fn>AO>RMPC_RPT point_name [ENTER]
Point
Configuration
Using Graphic
RMPC_PRF
98
Activate point
Call up the point detail and activate the point.
Verify Operation
Verify that RMPC_PRF is running without any CL errors.
Selection Port
Parameter
Action
Performance Point
ANAME
Enter the Performance Monitoring point name.
Report Path and
File Name
PATHNAME
Enter the full pathname NET>RMPC>FILE.XX
Reporting Days
ENGPAR(1)
Desired number of reporting days (1..365)
Monitoring Status
FL(1)
Activate the monitoring application
Reporting Type
FL(5)
Select reporting period Days / Months
Performance Monitor
Profit Suite Toolkit
Honeywell Inc.
5/01
Section 5 ---- Performance Monitor
5.4 Configuring a Monitoring Application
Application
Configuration
through Direct
CDS Entry
If the application graphic is not used, then the configuration data must be
entered directly onto the calculation point. The required information and
associated parameters are listed below.
Parameter
5/01
Description
Comments
ANAME
Tagname of the Profit Controller
This entity name
must be entered
before linking the
application AO.
PATHNAME
String containing the full path and file name
with ext
NET>RMPC>RMP
C_RPT.XX
FL(5)
Flag which determines whether to generate
reports based on days or months
(ON=>DAYS)
Flag status is either
ON or OFF.
Performance Monitor
Profit Suite Toolkit
Honeywell Inc.
99
Section 5 ---- Performance Monitor
5.5 Overview of the RMPCT Monitor Displays
5.5 Overview of the RMPCT Monitor Displays
Application
Overview
100
The application overview display provides a quick review of the configuration and
controller performance information. This display informs the user of the controller
name, the controller status, the controller uptime percentages, the monitoring
execution frequency, and the monitoring start time and date.
Performance Monitor
Profit Suite Toolkit
Honeywell Inc.
5/01
Section 5 ---- Performance Monitor
5.5 Overview of the RMPCT Monitor Displays
MV Limit
Information
5/01
MV limit information provides the working ranges within which the controller
must operate. Minimum and maximum LOW limit values define the lower
constraint bounds, while the average provides a sense of the normal lower
operating limit. Minimum and maximum HI limit values define the upper
constraint bounds, while the average provides a sense of the normal upper
operating limit.
Performance Monitor
Profit Suite Toolkit
Honeywell Inc.
101
Section 5 ---- Performance Monitor
5.5 Overview of the RMPCT Monitor Displays
MV Statistic
Information
MV statistical information is provided to track control limitation or unit
constraints that reduce unit performance.
% LOW LIMIT
Defined as: LOW LIMIT + ∆ SOFT LOW
Tracks the percent of time an MV was constrained at the
low bounds.
% HIGH LIMIT
% OPR CNTLD
% MV WIND UP
% MX MV
LIMITED
102
Defined as: HI LIMIT + ∆ SOFT HI
Tracks the percent of time an MV was constrained at an
upper bounds
Tracks the percent of time an MV was under operator
control rather than available for RMPCT control.
Tracks the percent of time an MV was unavailable for
control due to system conditions (i.e. valve saturation).
Tracks the percent of time an MV was max move limited
within the RMPCT controller. The maximum move
allowed is configured within the RMPCT MV tuning
display.
Performance Monitor
Profit Suite Toolkit
Honeywell Inc.
5/01
Section 5 ---- Performance Monitor
5.5 Overview of the RMPCT Monitor Displays
MV Averages and
Standards
Deviations
5/01
MV averages and standard deviations provide information related to amount of
energy expended by RMPCT to control and optimize a unit. The “AVE SS
TARGET” information provides the average steady state target for each MV
within the monitoring window. In addition to controller information, averages and
standard deviations are calculated for periods when the unit is under operator
control.
Performance Monitor
Profit Suite Toolkit
Honeywell Inc.
103
Section 5 ---- Performance Monitor
5.5 Overview of the RMPCT Monitor Displays
CV Limit
Information
104
CV limit information is tracked to provide the working range within which the
controller must operate. Minimum and maximum LOW limit values define the
lower constraint bounds, while the average provides a sense of the normal lower
operating limit. Minimum and maximum HI limit values define the upper
constraint bounds, while the average provides a sense of the normal upper
operating limit.
Performance Monitor
Profit Suite Toolkit
Honeywell Inc.
5/01
Section 5 ---- Performance Monitor
5.5 Overview of the RMPCT Monitor Displays
CV Model
Statistic
Information
CV model statistical information is track to provide information related to the
model accuracy.
NOTE: This page will only be available for future release of the Performance
Monitor. Currently the values are not updated.
5/01
MDL ERR AVERAGE
Tracks the average model error.
MDL ERR STD DEV
Displays the standard deviation of the CVs model versus
plant error
Performance Monitor
Profit Suite Toolkit
Honeywell Inc.
105
Section 5 ---- Performance Monitor
5.5 Overview of the RMPCT Monitor Displays
CV Statistic
Information
CV statistical information is provided to track control limitation or unit constraints
which reduce unit performance.
% LOW LIMIT
Defined as:
LOW LIMIT + ∆ SOFT LOW
Tracks the percent of time a CV was constrained at or
below a low bounds.
% HIGH LIMIT
Defined as:
HI LIMIT + ∆ SOFT HI
Tracks the percent of time a CV was constrained at or
above an upper bounds.
106
“% OUT SERV”
Tracks the percent of time a CV was out of service or not
available for RMPCT control.
“% LIM VIOLATED”
Tracks the percent of time a CV violates its upper or
lower bounds based on CV limit tolerances.
“% LIMIT ERR
TOLERANCE”
Displays the CV limit tolerance corresponding to each
CV.
Performance Monitor
Profit Suite Toolkit
Honeywell Inc.
5/01
Section 5 ---- Performance Monitor
5.5 Overview of the RMPCT Monitor Displays
CV Averages
and Standards
Deviations
5/01
CV averages and standard deviations provide information related to the
performance of RMPCT control and optimization. The “AVE SS TARGET”
information provides the average steady state target for each CV within the
monitoring window. In addition to controller information, averages and standard
deviations are calculated for periods when the unit is under operator control.
Performance Monitor
Profit Suite Toolkit
Honeywell Inc.
107
Section 5 ---- Performance Monitor
5.6 Viewing Different Monitoring Points
5.6 Viewing Different Monitoring Points
Overview
The performance monitoring schematics are completely generic and therefore can
display any monitoring point established on the system.
View Specific
Monitor
Applications
The following steps outline the procedure to display or view specific monitoring
applications.
Select the SCHEM button from the TDC operator console and enter the
schematic name “RMPC_PRF”.
If the display data base (DDB) does not contain a monitoring point, many of the
schematic field will appear blank. Notice that the display header is flashing
“Select Monitor” and that a red asterisk (*) is flashing next to a blank data box.
Selecting the blank data box prompts the user to enter a performance monitoring
point. Enter the desired application tagname and press ENTER. The monitoring
schematic should now contain information related to the selected application.
If the selected application has not yet been activated, the display header will
display “INACTIVE”. To activate the application go to the monitoring point and
set the point activity status to ACTIVE. The monitoring application will
immediately begin a configuration and initialization check.
To view another application, simply select the “PERFORMANCE POINT” data
box and enter the desired monitoring point, the new selection will now be
displayed.
If the filename and file path are correct the monitoring application can be initiated
by setting the “Monitoring Status”. Once the monitoring status has been set to
ON, the application begins tracking the application during both RMPCT and
operator control.
5/01
Performance Monitor
Profit Suite Toolkit
Honeywell Inc.
108
Section 5 ---- Performance Monitor
5.7 Monitoring Reports and Filenames
5.7 Monitoring Reports and Filenames
Viewing or Altering
the Report
Filename
Performance reports are typically written to the TDC history module (HM). The
user must specify the full path and file name for the application. To view or
alter the report filename follow the guideline below.
Select the SCHEM button from the TDC operator console and enter the
schematic name “RMPC_PRF”.
Changing the
Displayed Monitor
If the monitor displayed within the schematics is not the desired application,
select the performance point data box and enter the desired monitoring tagname.
Path Filenames
The application path and filename are displayed directly below the “Report Path
and Filename” heading. the filename must not exceed 8 characters. The
filename must also include a file extension, typically denoted by .XX or .XT.
Selecting the data box will prompt the user for the desired file path and name.
The file directory must exist on the HM.
Examples of File
Pathnames
The following are several examples of complete file pathnames;
NET>RMPC>ATM_RPT.XX
NET>DATA>FCCU_RPT.XT
NET>D1>TST.XX
*
$F1>DATA>REPORT.XX
* Note: For a report to be sent to a disk drive ($Fn), the removable media must
be mounted within the disk drive and contain the specified directory.
5/01
Performance Monitor
Profit Suite Toolkit
Honeywell Inc.
109
Section 5 ---- Performance Monitor
5.8 Configuring the Reporting Frequency
5.8 Configuring the Reporting Frequency
Viewing or
Altering the
Reporting
Frequency
The frequency at which performance reports are generated is best configured
from the monitoring schematics. To view or alter the reporting frequency follow
the guideline below.
Select the SCHEM button from the TDC operator console and enter the
schematic name “RMPC_PRF”.
If the monitor displayed within the schematics is not the desired application,
select the performance point data box and enter the desired monitoring tagname.
The frequency at which reports are generated is defined by the “Report Type”.
The user can select either “DAYS” or “MONTHLY” reports.
Monthly Reports
These reports are generated at midnight for the completion of the current month.
If the filename does not exist, within the specified directory it is created. If the
file does exist the current report is appended to the existing file.
Days Reports
These reports are generated at midnight for the completion of the configured
number of days. To alter the reporting period, select the “Reporting Days” data
box and enter the number of days desired for the monitoring window. If the
filename does not exist, within the specified directory it is created. If the file
does exist the current report is appended to the existing file.
Initializing
Averages,
Standard
Deviations, and
Percentages
The final consideration is whether or not the user wants to initialize the
monitoring information after generating a report. If initialization [INIT] is
selected, all averages and standard deviations are set to zero for the next
monitoring window. If the user selects no initialization [NO INIT], the previous
monitoring information is averaged into the following monitoring window.
Definition of
Standard
Deviation
T =
n
å
(x
2
) − n
n
(å
(x )
)
2
2
For samples < 60, the standard deviation will be slightly inaccurate.
110
Performance Monitor
Profit Suite Toolkit
Honeywell Inc.
5/01
Section 5 ---- Performance Monitor
5.9 Monitoring Re-Configuration
5.9 Monitoring Re-Configuration
Configuration
Check
If an RMPCT controller is updated or altered, the monitoring application should
perform a configuration check to ensure that the new controller information is
correctly loaded. To perform this configuration check follow the steps outlined
below.
Select the SCHEM button from the TDC operator console and enter the
schematic name “RMPC_PRF”.
If the monitor displayed within the schematics is not the desired application,
select the performance point data box and enter the desired monitoring tagname.
Configuration
Based on Two
Events
The performance monitoring application will check the controller configuration
based on two events, either the monitoring point being set INACTIVE and then
ACTIVE or by the selection of the “Force Re-Config Check” target.
INACTIVE - Every time the monitoring point is first activated the application
performs a configuration check of the RMPCT controller. Therefore by
toggling the point activation status, any controller changes will be updated
within the performance monitor.
RE-CONFIG - Within the application overview display is a target which
initiates a configuration check of the controller. Selecting “Force Re-Config
Check” will therefore initiate an examination of the RMPCT and any changes
will be updated within the performance monitor.
Viewing the
Progress of the
Configuration
Checks
5/01
The user can view the progress of the configuration checks from the monitoring
display. The status of the “Configuration”, “Initialization”, and “Report Status”
fields provide feedback as to the progress of a configuration check. Once each
of the fields display “COMPLETE”, the system is once again ready to begin
monitoring.
Performance Monitor
Profit Suite Toolkit
Honeywell Inc.
111
Section 5 ---- Performance Monitor
5.10 Spot Reports
5.10 Spot Reports
Requesting Spot
Reports
Generating Spot
Reports
112
Spot reports can be requested at any time during the monitoring window. There
are two methods which allow the user to request spot reports. First with a target
[FORCE PERFORMANC RPT] within the application overview display and
second, the menu bar button [PRINT REPORT].
Selecting either of the two targets will generate a prompt asking the user to
confirm by pressing ENTER. Reports generated by these methods will not
initialize the performance information or interrupt the normal reporting cycle.
Performance Monitor
Profit Suite Toolkit
Honeywell Inc.
5/01
Section 5 ---- Performance Monitor
5.11 Appendix -- Error Codes
5.11 Appendix -- Error Codes
Overview
The tables in this section describe the following program error codes:
Configuration and Initialization error codes
Controller information error codes.
MV information error codes.
CV information error codes.
MV Report generation error codes.
CV Report generation error codes.
Software License error codes.
Configuration/
Initialization
Configuration/Initialization Error Codes
Parameter
STATUS(1)
5/01
Value
0.0
Description
No errors
1.0
Null entity entered for the controller tagname
2.0
Error transferring the number of CV’s
3.0
Error transferring the number of MV’s
4.0
Limit violation for the number of CV (1..40)
5.0
Limit violation for the number of MV (1..20)
6.0
Null entity encountered during CV transfer
7.0
Error encountered transferring CV points
8.0
Null entity encountered during MV transfer
9.0
Error encountered transferring CV points
10.0
Error converting Date/Time string for CDS
11.0
Error truncating system Date to string (Day)
12.0
Error truncating system Date to string (Month)
13.0
Error moving system date string to CDS
14.0
Error moving system date string (Update Condition)
15.0
Error moving system month string to CDS
16.0
Error moving CV point PVCALC to CDS
17.0
Error moving MV point T(1) to CDS
Performance Monitor
Profit Suite Toolkit
Honeywell Inc.
113
Section 5 ---- Performance Monitor
5.11 Appendix -- Error Codes
Configuration/
Initialization
Configuration/Initialization Error Codes
Parameter
STATUS(3)
Value
0.0
1.0
NaN real value was stored (comerr / badvalst)
2.0
Local enum store with value greater than max (cnferr)
3.0
Local self defined enum store with value > than max (cnferr)
4.0
Source and destination data type not the same (cnferr)
5.0
Source and destination array type not the same (cnferr)
6.0
Value fetch or store failed (data owner dependent)
7.0
Entire array moves exceed maximum limit (arraylim)
Controller
Information
Error Codes
Controller Information Error Codes
Parameter
STATUS(4)
114
Description
No errors
Value
Description
0.0
No errors
1.0
Null entity entered for the controller tagname
2.0
Bad value for controller point M - Controller ON/OFF
Performance Monitor
Profit Suite Toolkit
Honeywell Inc.
5/01
Section 5 ---- Performance Monitor
5.11 Appendix -- Error Codes
MV Information
Error Codes
MV Information Error Codes
Parameter
STATUS(5)
STATUS(5)
STATUS(6)
5/01
Value
Description
0.0
No errors
1.0
Null entity entered for the controller tagname
2.0
Bad value for controller point M - Controller ON/OFF
100.0
Null entity encountered within MV entity array
101.0
BAD value encountered for MV Setpoint
102.0
BAD value encountered for MV Steady State value
103.0
BAD value encountered for MV Status
104.0
BAD value encountered for MV Low Limit
105.0
BAD value encountered for MV High Limit
106.0
BAD value encountered for MV Max Move Low Limit
107.0
BAD value encountered for MV Max Move High Limit
108.0
BAD value encountered for MV current move
201.0
Error during Average of MV Low Limit
202.0
Error during Average of MV High Limit
203.0
Error during Average of MV Steady State value
204.0
Error during Average of MV Setpoint (Cntl ON)
205.0
Error during Standard Deviation of MV Setpoint (Cntl ON)
300.0
Error during move of MV Setpoint (Cntl OFF)
301.0
Error during Average of MV Setpoint (Cntl OFF)
302.0
Error during Standard Deviation of MV Setpoint (Cntl OFF)
0.0
No errors
1..20
Array location for a MV move parameter failure.
Performance Monitor
Profit Suite Toolkit
Honeywell Inc.
115
Section 5 ---- Performance Monitor
5.11 Appendix -- Error Codes
CV Information
Error Codes
CV Information Error Codes
Parameter
STATUS(7)
STATUS(8)
116
Value
Description
0.0
No errors
1.0
Null entity entered for the controller tagname
2.0
Bad value for controller point M - Controller ON/OFF
100.0
Null entity encountered within CV entity array
101.0
BAD value encountered for CV Present Value
102.0
BAD value encountered for CV Un-Biased Prediction
103.0
BAD value encountered for CV Steady State
104.0
BAD value encountered for CV Status
105.0
BAD value encountered for CV Low Limit
106.0
BAD value encountered for CV High Limit
201.0
Error during Average of CV Low Limit
202.0
Error during Average of CV High Limit
203.0
Error during Average of CV Steady State value
204.0
Error during Average of CV Present Value (Cntl ON)
205.0
Error during Standard Deviation of CV Present Value (Cntl ON)
300.0
Error during move of CV Present Value (Cntl OFF)
301.0
Error during Average of CV Present Value (Cntl OFF)
302.0
Error during Standard Deviation of CV Present Value (Cntl OFF)
0.0
No errors
1..40
Array location for a CV move parameter failure.
Performance Monitor
Profit Suite Toolkit
Honeywell Inc.
5/01
Section 5 ---- Performance Monitor
5.11 Appendix -- Error Codes
MV Reporting File
Error Codes
MV Reporting File Error Codes
Parameter
STATUS(9)
5/01
Value
0.0
1.0
2.0
3.0
4.0
5.0
6.0
7.0
8.0
9.0
10.0
11.0
12.0
13.0
14.0
15.0
16.0
17.0
18.0
19.0
20.0
21.0
22.0
23.0
24.0
25.0
26.0
27.0
28.0
29.0
30.0
31.0
32.0
33.0
Description
No errors
Error during File EXISTS check
Error during File OPEN routine
Error during File CREATE routine
Error during secondary File OPEN routine
Error during controller name WRITE
Error during starting date & time WRITE
Error during ending date & time WRITE
Error during format line WRITE
Error during controller uptime WRITE
Error during controller OPT time WRITE
Error during controller CNTL time WRITE
Error during controller CNSTRT time WRITE
Error during format line WRITE
Error during MV Limits header WRITE
Error during format line WRITE
Error during MV Limit Descriptions WRITE
Error during format line WRITE
Error during MV limit information WRITE
Error during format line WRITE
Error during format line WRITE
Error during MV Statistics header WRITE
Error during format line WRITE
Error during MV Statistics Descriptions WRITE
Error during format line WRITE
Error during MV statistics information WRITE
Error during format line WRITE
Error during format line WRITE
Error during MV Averaged header WRITE
Error during format line WRITE
Error during MV Averaged Descriptions WRITE
Error during format line WRITE
Error during MV averaged information WRITE
Error during format line WRITE
Performance Monitor
Profit Suite Toolkit
Honeywell Inc.
117
Section 5 ---- Performance Monitor
5.11 Appendix -- Error Codes
MV Reporting
File I/O Error
Codes
MV Reporting File I/O Error Codes
Parameter
STATUS(10)
118
Value
Description
0.0
No errors
1.0
NaN real value was stored (comerr / badvalst)
2.0
Local enum store with value greater than max (cnferr)
3.0
Local self defined enum store with value > than max (cnferr)
4.0
Source and destination data type not the same (cnferr)
5.0
Source and destination array type not the same (cnferr)
6.0
Value fetch or store failed (data owner dependent)
7.0
Entire array moves exceed maximum limit (arraylim)
Performance Monitor
Profit Suite Toolkit
Honeywell Inc.
5/01
Section 5 ---- Performance Monitor
5.11 Appendix -- Error Codes
CV Reporting
File Error
Codes
CV Reporting File Error Codes
Parameter
STATUS(11)
5/01
Value
Description
0.0
No errors
1.0
Error during File EXISTS check
2.0
Error during File OPEN routine
3.0
Error during File CREATE routine
4.0
Error during secondary File OPEN routine
5.0
Error during CV Limits header WRITE
6.0
Error during format line WRITE
7.0
Error during CV Limit Descriptions WRITE
8.0
Error during format line WRITE
9.0
Error during CV limit information WRITE
10.0
Error during format line WRITE
11.0
Error during format line WRITE
12.0
Error during CV Statistics header WRITE
13.0
Error during format line WRITE
14.0
Error during CV Statistics Descriptions WRITE
15.0
Error during format line WRITE
16.0
Error during CV statistics information WRITE
17.0
Error during format line WRITE
18.0
Error during format line WRITE
19.0
Error during CV Averaged header WRITE
20.0
Error during format line WRITE
21.0
Error during CV Averaged Descriptions WRITE
22.0
Error during format line WRITE
23.0
Error during CV averaged information WRITE
24.0
Error during format line WRITE
Performance Monitor
Profit Suite Toolkit
Honeywell Inc.
119
Section 5 ---- Performance Monitor
5.11 Appendix -- Error Codes
CV Reporting
File I/O
Error Codes
CV Reporting File I/O Error Codes
Parameter
STATUS(12)
Value
Description
0.0
No errors
1.0
NaN real value was stored
(comerr / badvalst)
2.0
Local enum store with value greater than max (cnferr)
3.0
Local self defined enum store with value > than max (cnferr)
4.0
Source and destination data type not the same (cnferr)
5.0
Source and destination array type not the same (cnferr)
6.0
Value fetch or store failed (data owner dependent)
7.0
Entire array moves exceed maximum limit (arraylim)
Software License
Error Codes
Software License Error Codes
Parameter
ERRCODE
120
Value
0.0
Description
No errors
1.0
Software expiration date has expired
2.0
Software CDS package name error (location CDS )
3.0
Software AM node number error (location CDS )
4.0
Software AM node number error (location Point)
5.0
Software time cross check error (location CDS )
6.0
Software error contact Honeywell
Performance Monitor
Profit Suite Toolkit
Honeywell Inc.
5/01
RMPCT
Cascade
(Optional Item)
5/01
RMPCT Cascade
Profit Suite Toolkit
Honeywell Inc.
121
Section 6 — RMPCT Cascade
6.1 Overview
In This Section
Requirements
5/01
The Cascaded RMPCT Utility allows one RMPCT controller to cascade a setpoint
to another RMPCT controller. The utility consists of a single AM/CL program, a
modified RMPCT CV Summary display, and some minor configuration changes.
Requirement
Hardware Platform
Special Boards
Other Computing Systems
LCN Release
AM Load Modules
US Load Modules
Other Packages
Other Control Applications
Software Inputs
RMPCT Cascade
Profit Suite Toolkit
Honeywell Inc.
Description
TDC 3000â AM
None
None
Release 300 or later
None
None
None
Honeywell RMPCTä On-line Software
None
123
Section 6 — RMPCT Cascade
6.2 Detailed Description
6.2 Detailed Description
This utility allows an MV interface point in a primary RMPCT controller to
cascade a setpoint to a CV interface point in a secondary RMPCT controller. A
program linked to the secondary controller's CV interface point handles windup
status propagation and shedding. There may be more than one MV/CV cascade
pair configured. The primary controller MV interface point, the primary
controller output point, and the secondary CV interface point must be reconfigured.
Configuration
Change
Summary
The following tables list CDS parameters, which require re-configuration.
PRIM_CTL = Primary controller point
PRIM_OUT = Primary controller output point
PRIM_MV = Primary controller MV interface point
SEC_CTL = Secondary controller point
SEC_CV = Secondary controller CV interface point
SEC_CV Configuration Changes
Parameter
CTLALGID
NOCOPTS
CVEUHI
CVEULO
SPEUHI
SPEULO
SPHILM
SPLOLM
CLSLOTS
NOPKG
PKGNAME(2)
SNAME(1)
SNAME(2)
ANAME
PARNAME
T1
5/01
Value
CL
0
PVEUHI value
PVEULO value
PVEUHI value
PVEULO value
PVEUHI value
PVEULO value
1
2
RCAS_CDS
PRIM_CTL tag name
SEC_CTL tag name
PRIM_MV tag name
PRIM_OUT tag name
Primary controller output point M array index for MV/CV pair.
RMPCT Cascade
Profit Suite Toolkit
Honeywell Inc.
125
Section 6 — RMPCT Cascade
6.2 Detailed Description
PRIM_MV Configuration Changes
Parameter
PISRC(1)
PISRC(2)
PISRC(3)
CODSTN(1)
Value
SEC_CV.SP
SEC_CV.PV
SEC_CV.PV
SEC_CV.SP
PRIM_OUT Configuration Changes
Parameter
M(i)
P4(j)
126
Value
AUTO; where i = T1 in SEC_CV above
SEC_CV tag name; where j = the index corresponding to PRIM_MV in the
P2(j) parameter list.
RMPCT Cascade
Profit Suite Toolkit
Honeywell Inc.
5/01
Section 6 — RMPCT Cascade
6.3 Installation Procedure
6.3 Installation Procedure
Preparation for
Installation
Step
Gather Media
Action
Gather the following items:
•
Make Media
Backup
Removable media containing the files for the Remote Cascade routine
Make a backup copy of media/directory on a US with drives n and m configured
as follows:
Media:
FCOPY $Fn $Fm
Custom Data Segment (CDS) and Parameter List (PL) - This procedure must be
done once per LCN installation
Action
Step
5/01
Set Volume Paths
From Modify Volume Paths display:
CL CUSTOM GDF: NET>CDSG>
USER DEFLT PATH: $Fn>CL>
CL PARAM LIST: NET>CL
CL SOURCE/OBJ: $Fn>CL>
Where $Fn is the drive with the source media.
Compile
ROUT_PL.CL
From the Command Processor Display, compile the Parameter List file,
ROUT_PL:
CL $Fn>PL>ROUT_PL –UL –NX
Compile
RCAS_CDS.CL
From the Command Processor Display, compile the CDS file, RCAS_CDS:
CL $Fn>CDS>RCAS_CDS -UL –NX
RMPCT Cascade
Profit Suite Toolkit
Honeywell Inc.
127
Section 6 — RMPCT Cascade
6.3 Installation Procedure
Installing a
Different CV
Summary
Display
A different version of the CV Summary Display is required to interface with the
Cascaded RMPCT feature. The following procedure will install this version on
the system.
Step
Load the picture editor
Load DDB
Read in the schematic
Verify the schematic
Compile the schematic
Copy the object file to the
system directory which hold
schematic object files
128
Action
From the main Engineering display, select the PICTURE EDITOR
target.
Load Global variable definition file, DDB:
L $Fn>4SCH>RMPC_DDB [ENTER]
In the command line at the bottom of the display, type
R $Fn>4SCH>RMPC_CV1 [ENTER]
Where $Fn is the drive with the source media.
In the command line at the bottom of the display, type:
VER [ENTER]
In the command line at the bottom of the display, type:
COM [ENTER]
1. Press the ESC key to escape to the command processor.
2. Type:
CP $Fn>4SCH>RMPC_CV1.DO
NET>xxxx>= -D
Where "xxxx" is the system directory with the object files
(probably "RMPC").
3. Press CTL + HELP key to return to picture editor.
4. Press CTL + HELP again to exit from picture editor.
RMPCT Cascade
Profit Suite Toolkit
Honeywell Inc.
5/01
Section 6 — RMPCT Cascade
6.4 Configuring the RMPCT Points
6.4 Configuring the RMPCT Points
MV/CV Pairs
The following procedure should be used to configure a cascaded RMPCT
controller MV/CV pair.
PRIM_CTL = Primary controller point
PRIM_OUT = Primary controller output point
PRIM_MV = Primary controller MV interface point
SEC_CTL = Secondary controller point
SEC_CV = Secondary controller CV interface point
Point Configuration
Step
0
Point
1
3
PRIM_CTL,
SEC_CTL
PRIM_OUT,
PRIM_MV,
SEC_CV
SEC_CV
4
SEC_CV
2
5/01
Description
Build both the primary and secondary controllers and all of their
associated points following the standard RMPCT build procedures.
Inactivate the primary and secondary controller main points.
Inactivate the primary MV interface and output points, and the
secondary CV interface point.
Reconstitute SEC_CV and make the following changes:
•
Specify a "CL" Control Algorithm
•
Set/Verify the number of output connections to 0
•
Set CVEULO = PVEULO
•
Set CVEUHI = PVEUHI
•
Set SPEULO = PVEULO
•
Set SPEUHI = PVEUHI
•
Set SPLOLM = PVEULO
•
Set SPHILM = PVEUHI
•
Increase the number of CDS packages by one
•
Add the CDS package "RCAS_CDS"
•
Set SNAME(1) = PRIM_CTL tag name
•
Set SNAME(2) = SEC_CTL tag name
•
Set ANAME = PRIM_MV tag name
•
Set PARNAME = PRIM_OUT tag name
•
Set T1 = the primary controller output point shed mode index for
this MV/CV pair
Load SEC_CV with overwrite.
RMPCT Cascade
Profit Suite Toolkit
Honeywell Inc.
129
Section 6 — RMPCT Cascade
6.4 Configuring the RMPCT Points
Step
5
SEC_CV
6
7
SEC_CV
PRIM_MV
8
9
PRIM_MV
PRIM_MV
10
PRIM_OUT
11
12
PRIM_OUT
PRIM_OUT
13
14
15
PRIM_OUT
PRIM_OUT
PRIM_CTL,
SEC_CTL
16
130
Point
Description
Link the RMPC_CAS object code to SEC_CV
•
LK $Fn>AO>RMPC_CAS SEC_CV
Where $Fn is the drive with the source media, and SEC_CV is the CV
interface tag name.
Activate SEC_CV.
Reconstitute PRIM_MV and make the following changes:
•
Set PISRC(1) = SEC_CV.SP
•
Set PISRC(2) = SEC_CV.PV
•
Set PISRC(3) = SEC_CV.PV
•
Set CODSTN(1) = SEC_CV.SP
Load PRIM_MV with overwrite.
Activate PRIM_MV.
•
Note: There will be a "STOREFAIL" error on the
control output for this point when it is set active. This
error will clear when SEC_CV is set to CAS MODE.
On the PRIM_OUT point, locate the P2 array index which contains
PRIM_MV. This value will be referred to as "i" in the next step.
On the PRIM_OUT point, set P4(i) = SEC_CV tag name.
On the PRIM_OUT point, locate the M array index "j" for this MV/CV
pair.
•
Note: If all of the MV's in the primary controller have
only one cascaded controller, then "j" in step 12 will be
the same as "i" in step 10. If not, then "i" and "j" will not
be equal.
On the PRIM_OUT point, set M(j) = AUTO.
Activate PRIM_OUT.
Activate the primary and secondary controller main points.
Use the MV Tuning (Control Tuning) display for the secondary RMPCT
controller to set the PB/SPTK RATIO value to 0.0 for any MV’s that
have a model with any of the SEC_CV points. If there is a non-zero
value for this parameter on any of the MV’s which affect a SEC_CV,
then the SEC_CV will not become wound up (WDUP) and the windup
status will not be propagated to the PRIM_MV. The PRIM_MV should
have a non-zero PB/SPTK RATIO to prevent prolonged windup.
RMPCT Cascade
Profit Suite Toolkit
Honeywell Inc.
5/01
Section 6 — RMPCT Cascade
6.5 RMPCT Cascade Operation
6.5 RMPCT Cascade Operation
When a primary RMPCT controller is cascading to a secondary RMPCT
controller, at least one MV in the primary controller is providing a setpoint for a
corresponding CV in the secondary controller. The operator may not alter the
CV's setpoint (or low or high limit) when it is being cascaded to. There are only
two operations involved with this cascade feature. They are initiating the
cascade, and breaking the cascade.
To initiate an MV
to CV cascade:
If ...
Primary controller is OFF
Secondary controller is
OFF
Step
1
Set the desired MV MODE to RMPC from the Primary controller MV
Summary display (see display below).
2
Turn the Primary controller ON.
Note: This will automatically turn the Secondary controller ON.
Verify both controllers are turned ON, the MV is in RMPC MODE on the
Primary controller MV Summary display (see display below) with
a STATUS of GOOD, and the corresponding CV is in RMPC
mode on the Secondary controller CV Summary display (see
display below).
Set the desired MV MODE to RMPC from the Primary controller MV
Summary display (see display below).
3
Primary controller is OFF
Secondary controller is
OFF
1
2
5/01
Description
Verify the MV is in RMPC MODE on the Primary controller MV
Summary display (see display below) with a STATUS of GOOD,
and the corresponding CV is in RMPC mode on the Secondary
controller CV Summary display (see display below).
RMPCT Cascade
Profit Suite Toolkit
Honeywell Inc.
131
Section 6 — RMPCT Cascade
6.5 RMPCT Cascade Operation
If ...
Primary controller is OFF
Secondary controller is ON
Step
Description
1
2
Turn the Primary controller ON.
Set the desired MV MODE to RMPC from the Primary controller MV
Summary display if necessary (see display below).
Verify the MV is in RMPC MODE on the Primary controller MV
Summary display (see display below) with a STATUS of GOOD,
and the corresponding CV is in RMPC mode on the Secondary
controller CV Summary display (see display below).
Turn the Secondary controller ON.
3
Primary controller is ON
Secondary controller is OFF
1
2
3
132
Set the desired MV MODE to RMPC from the Primary controller MV
Summary display if necessary (see display below).
Verify the MV is in RMPC MODE on the Primary controller MV
Summary display (see display below) with a STATUS of GOOD,
and the corresponding CV is in RMPC mode on the Secondary
controller CV Summary display (see display below).
RMPCT Cascade
Profit Suite Toolkit
Honeywell Inc.
5/01
Section 6 — RMPCT Cascade
6.6 To Break an MV to CV Cascade
6.6 To Break an MV to CV Cascade
Primary Controller
There are two methods that can be used to break the MV to CV cascade.
From the Primary Controller MV Summary display
Step
1
2
Description
Set the desired MV MODE to MAN.
Verify the MV is in OPR with a STATUS of GOOD, and the corresponding CV is no
longer in RMPC mode on the Secondary controller CV Summary display.
Primary Controller
MV Summary
Display
These targets operate the same
regardless of where they are cascaded
to. They provide the only means to
establish an MV to CV cascade.
5/01
RMPCT Cascade
Profit Suite Toolkit
Honeywell Inc.
133
Section 6 — RMPCT Cascade
6.6 To Break an MV to CV Cascade
Secondary
Controller
From the secondary controller CV Summary Display
Step
1
2
Description
Select the RMPC target for the desired CV and press ENTER (see display below).
Verify the RMPC target becomes hidden and the SETPOINT and LO and HI LIMIT
targets become available. Also verify the MV mode becomes OPR from the Primary
controller MV Summary display.
Note:
If the MV is designated as critical or if the Primary controller is configured to
stop on non-critical MV cascade loss then the user will not be able to break
the cascade from the CV Summary display. In this case the cascade may
only be broken by turning either controller OFF.
Secondary
Controller CV
Summary Display
These targets are not
available when the CV
is being cascaded to.
134
These targets indicate the CV setpoint is being
set by a primary controller MV. Selecting the
target (and pressing ENTER) will shed the CV
and return setpoint control to the operator. The
cascade must be initiated from the primary
controller MV Summary display.
RMPCT Cascade
Profit Suite Toolkit
Honeywell Inc.
5/01
Process Value
(PV) Validation
(Optional Item)
5/01
Process Value (PV) Validation
Profit Suite Toolkit
Honeywell Inc.
135
.
136
Process Value (PV) Validation
Profit Suite Toolkit
Honeywell Inc.
5/01
Section 7 —PV Validation
7.1 Overview
Definition
The PV (Process Value) Validation routine determines the validity of any input
process value subject to user criteria. The routine also enables validity checking
and updating for RMPCT asynchronous controlled variables. This provides the
user a mechanism to determine which process input values to use in various
advanced control applications.
Application
The PV Validation routine is designed to work with any of the Honeywell Hi-Spec
Solutions inferential property calculations and RMPCT applications.
Incentive
To provide valid process values to inferential property calculations and RMPCT
applications subject to user validity criteria.
Acronym List
Hardware and
Software
Requirements
5/01
Acronym
AM
Term
Application Module
AO
CL object code file extension
CDS
custom data segment
CL
control language
CVs
LCN
controlled variables
Local Control Network
Requirement
Description
Hardware Platform
TDC 3000 AM
Special Boards
None
Other Computing Systems
None
LCN Release
Release 300 or later
AM Load Modules
None
US Load Modules
None
Other Packages
Any of the Honeywell Hi-Spec Solutions Inferential
Property routines and RMPCT applications (Asynchronous
CVs).
Other Control Applications
None
Software Inputs
The current process value (PVCALC) and validity check
criteria.
Process Value (PV) Validation
Profit Suite Toolkit
Honeywell Inc.
137
Section 7 —PV Validation
7.2 Installation Procedure
7.2 Installation Procedure
This document describes the installation procedure for the PV Validation
Routine on the TPS System AM
This section covers the following topics:
•Preparation for Installation
•CDS Installation
•Building / Reconfiguring AM Regulatory Points
5/01
Process Value (PV) Validation
Profit Suite Toolkit
Honeywell Inc.
139
Section 7 —PV Validation
7.3 Preparation for Installation
7.3 Preparation for Installation
This document describes the installation procedure for the PV Validation
routine on the TPS System AM
Step
Action
Gather media
Gather the following items:
Make media backup
•
Removable media containing the files for the PV
Validation routine
•
Commissioning Worksheet
Make a backup copy of media/directory on a US with drives n and
m configured as follows:
Media:
FCOPY $Fn $Fm
CDS Installation
This procedure must be done once per LCN installation.
Step
Action
Set volume pathnames
From Modify Volume Paths display:
CL CUSTOM GDF: NET>CDSG>
USER DEFLT PATH: $Fn>CDS
Compile PVAL_CDS.CL
From the Command Processor display, compile the CDS file,
PVAL_CDS:
CL $Fn>CDS>PVAL_CDS.CL -UL
If it is necessary to change the CDS due to a software revision,
refer to the Application Module Data Control Language/Application
Module Data Entry
140
Process Value (PV) Validation
Profit Suite Toolkit
Honeywell Inc.
5/01
Section 7 —PV Validation
7.4 Building / Reconfiguring the AM Regulatory Point
7.4 Building / Reconfiguring the AM Regulatory Point
The following describes key point building or reconfiguration parameters for
RMPCT and non-RMPCT applications of the PV Validation routine.
RMPCT
Applications
The following describes changes in the configuration of a standard RMPCT CV
Interface point for use with the PV Validation routine.
Parameters
Notes
CL Slots = 2
The number of CL Slots changes from 0 to 2.
Number of Packages = 2
The number of CDS packages changes from 1 to 2.
PKGNAME(2) = PVAL_CDS
IMPORTANT NOTE: The PV Validation CDS Package,
PVAL_CDS, MUST be configured as the second CDS
Package. The CDS Package RCV_CDS MUST remain
configured as the first CDS Package.
Example:
PKGNAME(1) = RCV_CDS
PKGNAME(2) = PVAL_CDS
*** No Deviations Allowed***
Non-RMPCT
Applications
The following describes key parameters in building AM regulatory points for
use with the PV Validation Routine.
Parameters
5/01
Notes
PV Algorithm = DATAACQ
None
CL Slots = 1
This will be used for PV_VAL.AO
Number of Packages = 1
This will be used for PVAL_CDS.CL
PKGNAME(1) = PVAL_CDS
Package name for PV Validation routine.
Process Value (PV) Validation
Profit Suite Toolkit
Honeywell Inc.
141
Section 7 —PV Validation
7.5 Detailed Description
7.5 Detailed Description
Overview
The information provided within this section describes the PV Validation Routine
architecture and custom data segments.
This section covers the following topics:
• Point Structures
• Custom Data Segments
Point Structures
Input to Inferential Calculations - The validation routine checks for violations
of user entered hi limit, low limit, rate of change, freeze tolerances, and bad input
values.
Point Structure (AM Regulatory Point)
Point Type
Application Module Regulatory Point
DATAACQ (if process variable does not reside in the AM)
PV Algorithm
None (if process variable does reside in the AM)
CTL Algorithm
None
Custom Data Segment
PVAL_CDS.CL
Insertion Point
PST_PVAG(3)
Output
PVCALC ; CALC_VAL(1)
Input to RMPCT Applications - This validation routine is used for Both
continuous and or asynchronous controlled process inputs. The validation routine
checks for violations of user entered hi limit, low limit, rate of change and freeze
tolerances, and bad input values. In addition, the routine also “flags” the
RMPCT controller to update with a new process value when all validity checks
are cleared.
The standard RMPCT CV Interface Point structure is used plus the following
additions.
Point Structure (AM RMPCT Asynchronous CV Interface Point)
Point Type
Application Module RMPCT Asynchronous CV Interface Point
Custom Data Segment
PVAL_CDS.CL
Insertion Point
PST_PVAG(3)
PST_PVAG(5)
Output
142
PVCALC ; CALC_VAL(1)
Process Value (PV) Validation
Profit Suite Toolkit
Honeywell Inc.
5/01
Section 7 —PV Validation
7.5 Detailed Description
Custom Data
Segments
The following section outlines the custom data segments (CDS) which are
attached to the process value validity routine points. The tables provide a brief
description of the parameters and their usage.
The following CDS parameters are attached to any point that will execute the
validity check routine.
Custom Data Segments (PVAL_CDS)
Parameter
Description
Default Values
ENGPAR(1)
User allowed valid process hi limit value
Default = 100
ENGPAR(2)
User allowed valid process lo limit value
Default = 0
ENGPAR(3)
Maximum user allowed rate of change between two
consecutive process values in order to be considered valid
Default = 50
ENGPAR(4)
Minimum change allowed between two consecutive
process values in order to be considered valid (Freeze
tolerance)
Default = 100
ENGPAR(5)
Maximum time allowed for process value to be in a frozen
state (in minutes)
Default = 100
ENGPAR(6)
Maximum time allowed for a process value to be in a
violated state (in minutes). Violated state includes hi limit,
lo limit, rate of change, and bad value violations.
Default = 100
ENGPAR(7)
Current process value valid flag. [Set current value valid =
1 ; Do not set current value valid = 0]
Default = 0
Note: Do not set this flag if current process value is
violating the user entered hi or lo limit, or if the current
value is bad.
ENGPAR(8)
5/01
Current process values less than zero to be set equal to
zero flag. [Allow program to set process values less than
zero equal to zero = 1 ; Do not allow program to set
process values less than zero equal to zero = 0]
Process Value (PV) Validation
Profit Suite Toolkit
Honeywell Inc.
Default = 0
143
Section 7 —PV Validation
7.5 Detailed Description
Custom Data Segments (PVAL_CDS)
Parameter
ENGPAR(9)
Description
RMPCT update flag. Used for RMPCT
Asynchronous CVs. [ Update RMPCT = 1 ; Do not
update RMPCT = 0]
Default Values
Default = 0
Note: This parameter is set by the validation
routine, not the user.
144
ENGPAR(10)
Available for future use.
Default = 0
TIMEDESC
Last execution Date/Time stamp
00:00:00
CALC_VAL(1)
Current input process value
Default = 0
CALC_VAL(2)
Counter tracking process value freeze state
Default = 0
CALC_VAL(3)
Counter tracking any other process value violation
state
Default = 0
CALC_VAL(4)
Last good process value used for rate of change
violation reference
Default = 0
CALC_VAL(5)
Input process value from previous execution
Default = 0
STATUS(1)
Bad value error status
Default = 0
STATUS(2)
Current error
Default = 0
REV_NO
Revision Number of the CDS package
N/A
Process Value (PV) Validation
Profit Suite Toolkit
Honeywell Inc.
5/01
Section 7 —PV Validation
7.6 System Configuration
7.6 System Configuration
Configuration of the PV Validation is accomplished through direct entry to the
CDS ports on the AM Regulatory Point.
Setup of the PV Validation requires the following steps:
• CDS Configuration of AM Regulatory Point
• Linking CL Program.
5/01
Process Value (PV) Validation
Profit Suite Toolkit
Honeywell Inc.
145
Section 7 —PV Validation
7.7 AM Regulatory Point Configuration (Direct CDS Entry)
7.7 AM Regulatory Point Configuration (Direct CDS Entry)
Configuration data must be entered directly onto the AM regulatory point. The
required information and associated parameter are listed below.
Note: The same procedure is used for RMPCT and non-RMPCT applications.
Parameter
Description
Comments
ENGPAR(1)
User allowed process value hi limit.
Default = 100
ENGPAR(2)
User allowed process value lo limit.
Default = 0
ENGPAR(3)
User allowed process value rate of change.
Default = 50
ENGPAR(4)
Minimum allowed process value change
allowed between two consecutive inputs to
be considered valid. (Freeze tolerance)
Default = 100
ENGPAR(5)
Maximum time (in minutes) allowed for
process value to stay within a given freeze
tolerance (Freeze time)
Default = 100
ENGPAR(6)
Maximum time (in minutes) allowed for a
process value to be in a hi limit, lo limit, bad
value, or rate of change violation.
Default = 100
ENGPAR(7)
Reset flag that allows the user to set the
current process value valid.
Default = 0 ; This resets the AM
Regulatory point’s PVCALC
parameter equal to the current
process value.
0 => Do not reset
1 => Reset
ENGPAR(8)
Note: Do not set this flag when
the current process value is in
violation.
Flag that resets any input process value
less that zero equal to zero.
Default = 0
0 => Do not reset
1=> Reset
ENGPAR(9)
This parameter sets a flag to update
RMPCT that a new value is available.
0 => Do not update RMPCT
1 => Update RMPCT
146
Process Value (PV) Validation
Profit Suite Toolkit
Honeywell Inc.
Default = 0 ; This parameter is
set by the program and only used
for RMPCT applications. If the
CL block PV_ASYNC is not used
(non-RMPCT applications), the
value of this parameter does not
affect the validation routine.
5/01
Section 7 —PV Validation
7.8 Linking CL Programs
7.8 Linking CL Programs
Linking RMPCT
Applications
The following procedure is used for RMPCT applications with asynchronous CVs.
Step
Link PV_VAL
Action
From the Command Processor Display:
LK $Fn>AO>PV_VAL (RMPCT CV interface point) [ENTER]
Link PV_ASYNC
From the Command Processor Display:
LK $Fn>AO>PV_ASYNC (RMPCT CV interface point)
[ENTER]
Linking
Non-RMPCT
Applications
(Required only for asynchronous CV’s)
Activate point
Call up the point detail and activate the point.
Verify Operation
Verify that PV_VAL and PV_ASYNC are running without any CL errors.
The following procedure is used for any non-RMPCT application.
Step
Link PV_VAL
Action
From the Command Processor Display:
LK $Fn>AO>PV_VAL (process/unit point) [ENTER]
5/01
Activate point
Call up the point detail and activate the point.
Verify Operation
Verify that PV_VAL is running without any CL errors.
Process Value (PV) Validation
Profit Suite Toolkit
Honeywell Inc.
147
Section 7 —PV Validation
7.9 PV Validation Operation
7.9 PV Validation Operation
Overview
This section deals with the functionality of PV Validation when a validation
check has been violated. It also describes the usage of PV Validation when used
with a RMPCT CV Interface Point.
Validation errors
that clear
automatically
The Hi/Lo limit violations and Bad Value violations are cleared automatically
when the PV returns to normal.
Validation errors
that the user
must clear
The user must clear all freeze and rate of change violations. This can be done by
setting the reset flag equal to 1.0 (ENGPAR(7) = 1.0).
Using PV
Validation in
conjunction with
RMPCT CV
Interface Point
If the PV Validation is configured on a RMPCT CV Interface point then the
status of the PV validation can be viewed on the CV Detail display. Whenever a
check is violated the CV process value is displayed as bad.
148
Selecting the PV Value and then selecting the RESET target will clear the
violation. Note that the resetting functionality is only available for RMPCT
Release 160 or later.
Process Value (PV) Validation
Profit Suite Toolkit
Honeywell Inc.
5/01
Section 7 —PV Validation
7.10 Appendix - Error Codes
7.10 Appendix - Error Codes
Bad Value Error
Codes
Configuration of the PV Validation is accomplished through direct entry to the
CDS ports on the AM Regulatory Point.
Bad value Error Codes
Parameter
STATUS(1)4
Value
Description
0.0
No errors
1.0
Input process value has a:
Bad value
Hi limit violation
Lo limit violation
Rate of change violation
2.0
Input process value has a freeze state violation
Configuration of the PV Validation is accomplished through direct entry to the
CDS ports on the AM Regulatory Point.
Setup of the PV Validation requires the following steps:
•
•
CDS Configuration of AM Regulatory Point
Linking CL Program.
Diagnostic Error
Codes
Subroutine Error Codes
4
Parameter
Value
Description
STATUS(2)
0.0
No errors
1.0
Input process value has a bad pv
2.0
Input process value has violated a hi limit
3.0
Input process value has violated a lo limit
4.0
Input process value has violated a rate of change limit
5.0
Input process value is in a frozen state
STATUS(1) indicates errors in the calculation.
5/01
Process Value (PV) Validation
Profit Suite Toolkit
Honeywell Inc.
149
Simulation
BackBuilder
(Optional Item)
5/01
Simulation BackBuilder
Profit Suite Toolkit
Honeywell Inc.
151
.
152
Simulation BackBuilder
Profit Suite Toolkit
Honeywell Inc.
5/01
Section 8 — Simulation BackBuilder
8.1 Overview
Definition
The RMPCT Settings File (.xs) Back-Builder is designed to provide a mechanism
to capture DCS controller tuning and configuration. The “.xs” file can be read
either by an on-line application or by the off-line software.
Application
The settings file Simulation BackBuilder examines the defined RMPCT controller
to acquire the matrix size and associated point tagnames. The routine then
examines each of the controller interface points, collecting tuning and
configuration information.
Calculation
The RMPCT Settings File Back-Builder performs no on-line calculations, instead
it generates a system file containing the controller tuning and configuration
information:
Acronym List
5/01
Acronym
Term
AM
Application Module
DCS
Distributed Control System
LCN
Local Control Network
US
Universal Station
PV
Process variable
MV
Manipulated variable
RMPCT
Robust Multivariable Predictive Control Technology
PL
Parameter List
CDS
Custom data segment
AO
CL object code file extension
Simulation BackBuilder
Profit Suite Toolkit
Honeywell Inc.
153
.
154
Simulation BackBuilder
Profit Suite Toolkit
Honeywell Inc.
5/01
Section 8 — Simulation BackBuilder
8.1 Overview
Hardware and
Software
Requirements
5/01
Requirements
Description
Hardware Platform
TDC 3000 AM
Special Boards
None
Other Computing Systems
None
LCN Release
Release 410 or later
AM Load Modules
FILE, CONV, AMCL01, AMCL02 (Standard AM Load Modules)
US Load Modules
None
Other Packages
None
Other Control Applications
RMPCT Release 150 or later
Software Inputs
See Process Inputs
Simulation BackBuilder
Profit Suite Toolkit
Honeywell Inc.
155
Section 8 — Simulation BackBuilder
8.2 Detailed Description
8.2 Detailed Description
Overview
The tables in this section describe the RMPCT Setting File Back-Builder program
architecture:
•
Point Structure
•
Process Inputs
•
Configuration Inputs
•
Calculation Outputs.
Point Structure
Point Structure
Point Type
AM Custom, CL
PV_Type
CTL_Type
Custom Data Segment
Algorithm
Insertion Point
None
None
RXSG_CDS.CL
RXSG_CFG.AO , RXSG_WRT.AO
Background
Slots
2 CL Slots - ( 1 and 3 ) Background
Output
The system configuration is stored to a file.
Process Inputs
Process Inputs
Critical
Parameter
ANAME
Description
Tagname of the RMPCT controller
Units
N/A
Yes
X
P1(0)
Tagname of a CV interface point
N/A
X
P2(0)
Tagname of a MV interface point
N/A
X
P3(0)
Tagname of a DV interface point
N/A
X
No
All additional information regarding controller CV’s, MV’s and DV’s is
determined from the RMPCT controller point. During the “CONFIGURATION”
phase the routine examines the controller and store the names of the controller
interface points to CDS parameters.
Configuration
Inputs
Configuration Inputs(RXSG_CDS)
Parameter
PATHNAME
Calculation
Outputs
Units
None
Calculation Outputs
Parameter
STATUS
156
Description
File Pathname (i.e. NET>RMPC>FILE.XS)
Description
Routine Error codes used for diagnostics
Simulation BackBuilder
Profit Suite Toolkit
Honeywell Inc.
Units
None
5/01
Section 8 — Simulation BackBuilder
8.3 Error Codes
8.3 Error Codes
The tables in this section describe the following program error codes:
•
•
Application location error codes
Array index error codes.
Calculation Outputs
Parameter
STATUS(1)
5/01
Value
0.0
No errors
Description
1.0
Null entity entered for the RMPCT controller tagname
2.0
Error transferring the number of CV’s
3.0
Error transferring the number of MV’s
4.0
Error transferring the number of DV’s
5.0
Limit violation for the number of CV (1..40)
6.0
Limit violation for the number of MV (1..20)
7.0
Limit violation for the number of DV (1..20)
10.0
Null entity encountered during CV transfer
11.0
Error encountered transferring CV points
15.0
Null entity encountered during MV transfer
16.0
Error encountered transferring MV points
20.0
Null entity encountered during DV transfer
21.0
Error encountered transferring DV points
101.0
EXISTS check for file name has encountered an error
102.0
DELETE file function has encountered an error
103.0
CREAT file function has encountered an error
104.0
OPEN file function has encountered an error
105.0
Writing the software revisions number has encountered an error
106.0
Writing the # CVs, MVs, DVs to file has encountered an error
107.0
Writing the IJP information to file has encountered an error
108.0
Writing the IJP information to file has encountered an error
109.0
Writing of controller information has encountered an error
110.0
Writing of CV data line 1 has encountered an error
111.0
Writing of CV data line 2 has encountered an error
112.0
Writing of MV data line 1 has encountered an error
113.0
Writing of MV data line 2 has encountered an error
114.0
Writing of DV data line 1 has encountered an error
Simulation BackBuilder
Profit Suite Toolkit
Honeywell Inc.
157
Section 8 — Simulation BackBuilder
8.3 Error Codes
Calculation Outputs
Parameter
Value
115.0
Description
Writing the Header for Open RMPCT has encountered an error
116.0
Writing of controller execution frequency encountered an error
117.0
Writing of controller CV values encountered an error
118.0
Writing of controller MV values encountered an error
119.0
Writing of controller DV values encountered an error
Array Index
Location Error
Codes
158
Controller Information Error Codes
Parameter
Value
Description
STATUS(2)
0.0
No errors
1..40
Array index of the CV, MV, or DV point which has caused the write error
( see STATUS(1) )
Simulation BackBuilder
Profit Suite Toolkit
Honeywell Inc.
5/01
Section 8 — Simulation BackBuilder
8.4 Installation Procedure
8.4 Installation Procedure
This section describes the installation procedure for the RMPCT settings file backbuilder on the TDC 3000.
This section covers the following topics:
•
•
•
•
Preparation for
Installation
Preparation for Installation
CDS and PL Installation
Building a Setting File Back-Builder Point
Linking the Object Code
Step
Gather media
Make media backup
Action
Gather the following items:
•Removable media containing the monitoring software
Make a backup copy of media/directory on a US with drives n and m
configured as follows:
Media:
FCOPY $Fn $Fm
Where $Fn is the drive with the source media and $Fm is the drive with
the target media
CDS and PL
Installation
This procedure must be done once per LCN installation.
Step
Set volume pathnames
Action
From Modify Volume Paths display:
Compile Param List
CL CUSTOM GDF: NET>CDSG>
CL PARAM LIST: NET>CL
USER DEFLT PATH: $Fn>CL
From the Command Processor display, compile the PL file, RXSG_PL:
RXSG_PL.CL
Compile CDS Param
RXSG_CDS.CL
5/01
CL $Fn>PL>RXSG_PL.CL -UL -NX
If it is necessary to change the PL due to a software revision, refer to the
Application Module Data Control Language/Application Module Data Entry
From the Command Processor display, compile the CDS file,
RXSG_CDS:
CL $Fn>CDS>RXSG_CDS.CL -UL -NX
If it is necessary to change the CDS due to a software revision, refer to
the Application Module Data Control Language/Application Module Data
Entry
Simulation BackBuilder
Profit Suite Toolkit
Honeywell Inc.
159
Section 8 — Simulation BackBuilder
8.5 Building a Simulation BackBuilder Point
8.5 Building a Simulation BackBuilder Point
Steps to Build
the Point
Step
Action
Modify Exception Build file,
From the Command Processor display:
ED $Fn>EB>RMPC_XSG.EB [ENTER]
Edit template as follows:
&N point name
UNIT
= unit number
PTDESC ="point descriptor text"
ANAME = RMPCT Controller Point
RMPCMV00
UNIT = unit number
RMPCCV00
UNIT = unit number
RMPCDV00
UNIT = unit number
From the Builder Commands display:
Select the EXCEPTION BUILD target.
Fill in ports as:
REFERENCE PATH NAME: $Fn>EB>
Load Entities (select target)
Pathname for SOURCE file: RMPC_XSG.EB
Pathname for IDF file: RMPC_XSG.DB
[ENTER]
When the load is complete, verify point loading by calling the point
detail from the [DETAIL] button
RMPC_XSG.EB
Load EB file.
Verify load
Application
Configuration
through CDS
Entry
Prior to linking the AM object code, some of the CDS fields must be entered to
ensure proper memory allocation. The required information and associated
parameters are listed below.
Parameter
ANAME
P1(0)
P2(0)
P3(0)
160
Description
Tagname of any RMPCT controller
Tagname of any existing RMPCT CV interface
point.
Tagname of any existing RMPCT MV interface
point.
Tagname of any existing RMPCT DV interface
point.
Simulation BackBuilder
Profit Suite Toolkit
Honeywell Inc.
Comments
This entity name must be entered
before linking the application AO.
The NULL entity RMPCCV00 is the
default tagname within the EB file
The NULL entity RMPCMV00 is the
default tagname within the EB file
The NULL entity RMPCDV00 is the
default tagname within the EB file
5/01
Section 8 — Simulation BackBuilder
8.5 Building a Simulation BackBuilder Point
Linking CL
Programs
Step
Check ANAME
Check P1
Make sure that the desired RMPCT controller name is listed within the CDS field
ANAME
Make sure that the CV NULL point RMPCCV00 is listed as the first entry within
the CDS field P1.
example: [ P1(0) = RMPCCV00 ]
Check P2
Make sure that the MV NULL point RMPCMV00 is listed as the first entry within
the CDS field P2.
example: [ P2(0) = RMPCMV00 ]
Check P3
Make sure that the DV NULL point RMPCDV00 is listed as the first entry within
the CDS field P3.
Example: [ P3(0) = RMPCDV00 ]
Link RMPC_XSG
From the Command Processor Display:
Activate point
LK $Fn>AO>RMPC_XSG point_name [ENTER]
Call up the point detail and activate the point.
Verify Operation
Setting the Path
and File Name
Action
Verify that RMPC_XSG is running without any CL errors and that both
STATUS(1) and STATUS(2) are equal to zero.
* Note: At this point NO settings files have been written.
Back built controller settings files are written to the TDC history module (HM).
The user must specify the full path and file name for the application. To view or
alter the application filename follow the guideline below.
1.
Select the SCHEM button from the TDC operator console and enter the
schematic name “DATACHNG”.
2.
Select one of the user fields and enter the tagname.parameter you wish to view
or modify, (i.e. “RMPC_XSG.PATHNAME”).
The display will now show the current “PATHNAME” stored in CDS. To change /
modify the pathname select the field and enter the desired FULL pathname with
extension.
The following are several examples of complete file pathnames;
•
•
•
5/01
NET>RMPC>ATM_CTL.XS
NET>MDL>FCCU_CTL.XS
NET>D1>TST.XS
Simulation BackBuilder
Profit Suite Toolkit
Honeywell Inc.
161
Section 8 — Simulation BackBuilder
8.5 Building a Simulation BackBuilder Point
The filename can be 1 to 8 character in length and must have the extension “.XS” to
be RMPCT compatible. The directory name can be 1 to 4 characters in length and
must exist on the history module.
NOTE: Do NOT use the same file name as the off-line design software. The LCN
application will check the HM for the defined file name. IF A FILE WITH THE
DEFINED NAME IS DETECTED IT WILL BE DELETED AND REPLACED.
Therefore, always use a different file name for each controller.
Generating
Settings Files
To generate the settings file for a specified controller one only needs to process the
application point. The following steps outline the procedure:
1.
2.
Select “DETAIL” and enter the tagname of the back-builder point.
Select the “PROCESS” target and press ENTER to execute.
Each time the application is executed, the routine examines the specified controller,
downloads the MV, DV, and CV tagnames, and generates a settings file. Always
check to make sure the application completed without encountering an error by
paging forward to the STATUS parameters. If either STATUS(1) or STATUS(2)
is greater than zero, the application had a problem completing the setting file.
NOTE: Do NOT attempt to read a settings file which has encountered an error
during the build process. The file will be incomplete and any attempt to
read the file by RMPCT will generate a “READ” error.
Back-Building
Different
RMPCT
Controllers
162
One Simulation BackBuilder point can be used to generate settings files for all of
the system controllers.
The follow list outlines the procedure to select and generate files for different
controllers:
1.
Select the SCHEM button from the TDC operator console and enter the
schematic name “DATACHNG”.
2.
Select one of the user fields and enter the tagname.parameter you wish to view
or modify, the controller tagname is stored in “ANAME”. (i.e.
“RMPC_XSG.ANAME”).
3.
Select one of the user fields and enter the tagname.parameter you wish to view
or modify, the file pathname is stored in “PATHNAME”. (i.e.
“RMPC_XSG.PATHNAME”).
4.
With the correct controller selected and the correct file name defined, select
“DETAIL” and enter the tagname of the back-builder point (i.e.
“RMPC_XSG”)
5.
Select the “PROCESS” target and press ENTER to execute.
6.
Check the error status parameters.
Simulation BackBuilder
Profit Suite Toolkit
Honeywell Inc.
5/01
Section 8 — Simulation BackBuilder
8.5 Building a Simulation BackBuilder Point
CV Information
Captured
MV Information
Captured
5/01
The settings file contains a variety of information related to the configuration and
tuning of the controller CV’s. The following list outlines which parameters are
captured and stored in the controller “.XS”file:
• Active low limit
•
Active high limit
•
Low ramp rate
•
High ramp rate
•
Low limit error weight
•
High limit error weight
•
Optimization quadratic coefficient
•
Optimization linear coefficient
•
Optimization quadratic desired value / target
•
Performance ratio
•
Closed loop response interval
•
Feedforward to feedback performance ratio
•
Compensation ratio for the PV value
•
Number of blocks
•
Minimum funnel opening
•
Optimization delta soft low limit
•
Optimization delta soft high limit
•
State estimation configuration
•
Optimization error tolerance
The settings file contains a variety of information related to the configuration and
tuning of the controller MV’s. The following list outlines which parameters are
captured and stored in the controller “.XS”file:
•
Active low limit
•
Active high limit
•
Maximum move down permitted
•
Maximum move up permitted
•
High limit ramp rate
Simulation BackBuilder
Profit Suite Toolkit
Honeywell Inc.
163
Section 8 — Simulation BackBuilder
8.5 Building a Simulation BackBuilder Point
•
Low limit ramp rate
•
Optimization quadratic coefficient
•
Optimization linear coefficient
•
Optimization quadratic desired value / target
•
MV weight
•
Number of blocks
•
Predict-Back or Anti-Windup ratio
•
Optimization delta soft low limit
•
Optimization delta soft high limit
NOTE: Some additional reserved parameters are collected in addition to those
noted above.
164
Simulation BackBuilder
Profit Suite Toolkit
Honeywell Inc.
5/01
Section 8 — Simulation BackBuilder
8.5 Building a Simulation BackBuilder Point
5/01
Simulation BackBuilder
Profit Suite Toolkit
Honeywell Inc.
165