1
SRD User Manual
Table of contents:
1. Overview
2. First use of SRD
3. The ‘Sequence Information Script File’format
4. The ‘Sequence Links Script File’format
5. Import new data to visualize
6. Intra-category graph drawing
7. Category-Category graph drawing
8. Extra-category graph drawing
9. Recursion extra-intra categories
10. Fully customizable interface
11. Categories definition
12. Set Categories Map
13. Re-layout objects in each intra-category graph
14. Re-layout category-category graph
15. User-defined help document
16. Splitting sub-windows in different views
17. Results Export
Overview
SRD (Sequence Relationship Drawing program) was developed in order to dynamically draw
plane undirected graphs for a wide range of sequence relationship visualization analysis, either for
nucleic acid sequences or for peptide sequences. Categories analysis is also supported, which
allows visualizing intra-category sequence relationships, extra-category sequence relationships
and category-category relationships in several specific windows, respectively.
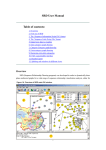
The following picture is the overview of SRD main GUI window. The sample dataset used
here is a dataset of China envelope glycoprotein (env) gene of HIV sequences derived from
Chinese center for disease control and prevention.
Figure 1H. The main GUI of SRD.
1
The main GUI contains several sub-windows:
Number
Window
Description
(1)
(2)
Dataset selector
Zoom selector
(3)
Inter-category drawing
window
(4)
Current sequence list
window
Foreign sequence list
window
Foreign relationship
window
Intra-category drawing
window
Information window
A drop-down menu to select dataset to visualize.
A drop-down menu to set or return the zoom factor used for
displaying all graphs.
Used for drawing category-category relationships, which
depicts Chinese province-province relationships in this
example since sequences in the dataset come from several
different provinces in China.
Lists all sequence within the current category.
(5)
(6)
(7)
(8)
(9)
Extra-category
drawing window
Gives a list of all related sequences linked to the current
category or to the selected sequence.
Gives the relationship value of a selected foreign sequence
in the ‘foreign sequence list window’.
The visualization graph for the current category.
Dynamically displays the corresponding text information of
all generated graphs at a time.
A floating window to visualize another category related to
the current category.
First use of SRD
2
When the program is first started, users will find a Start Wizard to quickly access general
functions in the system. Novice users should follow the steps and click the commands in the
wizard window to perform their visualization.
To begin the visualization:
1. In the first step, create a 'Sequence Information Script File' to contain all sequences
information and their categories. Create a 'Sequence Links Script File' to contain the relationship
values between each two sequences. Import the two script files into the system using the 'Import
New data' dialog.
● To open the 'Import New data' dialog, click 'Import New data' command in the 'File' menu.
● If one would like to visualize all sequences as a whole, i.e., not perform the partition into
several categories, assign all sequence to one same category.
2. (This step is optional) Manually rearranged the graph for each category by mouse-dragging
the sequence vertices to make the graphs more beautiful, using the ‘Set intra-category graph
layout’dialog. In this dialog, we also can export objects into a text file for layout by other software
tools, and import the layout generated by other software tools.
● To open the ‘Set intra-category graph layout’dialog, click 'Set intra-category layout'
command in the 'File' menu.
3. (This step is optional) To vividly depict different categories, create a picture (called Categorys
Map) using any image creation and editing tools, such as MS Paint, Photoshop, Fireworks, etc., in
which each category has an icon on it. Import the picture using the 'Set categories map' command
in the “File” menu.
3
4. (This step is optional) Using the “Set categories and category-category layout” dialog, set hot
spots for each category on the Categorys Map imported in the previous step. You can further add
or delete categories in this dialog.
●
To open the ‘Set categories and category-category layout’dialog, click 'Set
category-category layout' command in the 'File' menu.
Sample datasets are available on the website.
The ‘Sequence Information Script File format
Users must create a “Sequence Information” script file that contains all sequences and their
categories in the dataset. “Sequence Information” script file adopts a format as a FASTA file that
begins with a single-line description, followed by lines of sequence data.
The description line is distinguished from the sequence data by a greater-than (">") symbol in
the first column. There should be no space between the ">" and the first letter of the identifier. The
description line must exist for each sequence while the rest sequence data lines are optional. The
description line must adopt a specific format with several fields separated by a “|” character or a
“<Tab>” character. The format of the description line is as follows:
>[SID] | CategoryID | SeqID | [IsVirtual] | [Caption] | [Memo]
, where fields in brackets are optional and can be omitted. Each sequence must be assigned a
unique zero-based identifier number called SID. Note that SID can also be omitted and be
generated by the system, but the “|” or “<Tab>” character after SID must exist.
Figure 3H. A sample of ‘Sequence Information Script File’.
4
The category each sequence belongs to must also be given by a string identifier (a string not
more than 50 characters), which is called CategoryID. The field SeqID can be the name or the
database ID of the sequence (e.g. a gi number of NCBI, a PDBID of PDB database, etc). IsVirtual
indicates it is a virtual sequence (=1) or not (=0). Caption is a text string that describe the
sequence (could also be none). Other corresponding information can be included in the field
Memo.
Another example with SID being omitted of such file is as follows:
>|c1|Seq_1|RANDOM_4954
CTCAAGAGTACGGCCTCTAGGTCAAACCGTACTTTTTCGTGGTGGATTGATAACTTCGGACGATGTCGCATCAGGTCGTG
ATTTTCGTTTGAACGTTTGTACATCATGCGCGTTAGGGAGGTGTGGCTCCTCAACGTTTTCGAGTCAAGTCCCTTCATAG
ACGTCCGTCGATCTTATCGA
>|c1|Seq_2|RANDOM_5537
ACTCTCCGTCGAATCAGCTGAATGCAATGTGATTGTGCGTACATTTTCTGAGCAC
>|c2|Seq_3|RANDOM_1622
CCCAAACTCCACCAGCCGATTTTTCTACAATTCTCCCTTTTTTGGACATCGGGTGGGGGGCAACCGTAAGCCCGGAATTT
GAGGGCGCGCAAAAACCCCGGCACCCGCACC
>|c2|Seq_4|RANDOM_6623
CTTGAGCGCCTGCGGTGGAAGAGTAAACCCAATGAATTCCACCGTCCTGATAGTCCTGTCATCCGGACCCCGCGCCATTG
AGTC
>|c3|Seq_5|RANDOM_8121
TTGTTTAGAGTTTATCCACGCATACTCCGTCGCAAAATTATTGAGCTCCCCTAAGGCCATGCCATCATCCCACTAAACCA
ACGTACAAGTGATAGGCATTCCGAAACGAATGTTTGCGAACCC
Note that the “|” character after “>” must exist, since ‘[SID]’is omitted. The “c1”, “c2”, “c3” is the
IDs of the categories, which should be no more than 50 characters (we partitioned all sequence
into 3 categories in this example). “Seq_1”, “Seq_2”, “Seq_3”, … are Sequence ID and.
“RANDOM_4954”, “RANDOM_5537”, … are captions in this example.
The separator “|” can also be “<Tab>” like the following example:
In this example, we omitted the sequences. And a sequence “Virtual” or not is given (1 presents
virtual, 0 presents not).
The sequence ends if another line starting with a ">" or end of file (EOF) appears.
The script file is text-based and can be created and edited using any text-processing tools or
by simply pasting from some other software tools, such as Excel, Orgin Pro, or Matlab. Note that
text pasted from Excel is separated by a “<Tab>” character. It can be imported directly into the
system by the ‘‘Import New data’dialog provided by SRD, which is activated by mouse clicks
5
throughout the entire importing process. An input module of the software will automatically detect
the file formats and an internal syntax analyzer will give back any error information. When the
input process completes, the parser recognizes the text and stores all the information into the
background database along with the application.
The ‘Sequence Links Script File format
Users must create a “Sequence Links” script file that contains relationships between each two
sequences. Both the script files are text-based and can be generated and edited using any
text-processing tools.
‘Sequence Links script file’can adopt one of the following format:
z Matrix format: a n × n matrix separated by spaces in each line. The separator can be one
space or several spaces or even Tab, which is useful to load a table style text file.
Figure 4H. A sample of ‘Sequence Links script file’(Matrix format)
z
Relationship lines format: each line indicates one relationship and its value between one pair
of sequences. For instance, if sequence SID1 and sequence SID2 has a relationship value V,
the corresponding line should be:
SID1
SID2
6
V
The separator can either be a “Tab” or any number of spaces. SID1 and SID2 must be consistent
with the ones in the ‘Sequence Information script file’.
Figure 5H. A sample of ‘Sequence Links script file’(Relationship lines format)
The script file is text-based and can be created and edited using any text-processing tools or
by simply pasting from some other software tools, such as Excel, Orgin Pro, or Matlab. It can be
imported directly into the system by an interactive ‘‘Import New data’dialog provided by SRD,
which is activated by mouse clicks throughout the entire importing process. An input module of
the software will automatically detect the file formats and an internal syntax analyzer will give
back any error information. When the input process completes, the parser recognizes the text and
stores all the information into the computerized database along with the application.
Import new data to visualize
To start a sequence relationship visualization, sequences and the relationship values must be
imported into the system. Users must create a ‘Sequence Information script file’that contains all
sequences and their categories in the dataset and a ‘Sequence Links script file’that contains
relationships between each two sequences.
Import both the script files using the ‘‘Import New data’dialog.
z To open the ‘Import New data’dialog, click ‘‘Import New data’command in the
‘File’menu.
7
Click ‘Import sequences’command to import a ‘Sequence Information script file’. Then click
‘Import Links’to import a ‘Sequence Links script file’. Data set ID (DstID) will be asked when
click the commands. Please Input a string no more than 50 characters as your dataset ID. The
dataset ID you input must be consistent (the same) with the two askings when you click the two
commands separately.
When the ‘Sequence Links script file’importing is complete, graphs layout for all categories
will be performed automatically (automatically set vertices coordinates of all sequences) and data
structures will be optimized for fast running.
Note:
1). Before importing, users can define all categories (CategoryID and CategoryName) in the “Set
categories and category-category layout” dialog. If so, the CategoryID in a ‘Sequence Information
script file’must be consistent with that defined before. Users may also define no categories before.
If so, the categories will be defined automatically according to the categories each sequence
belong to from the ‘Sequence Information script file’.
2). When importing new data, if a Data set ID (DstID) a user inputs already exists in the system,
the previous dataset will be overwritten. And the system will ask the user if he want to do so.
3). To visualize new data, please click “Delete all categories” command in the “File” menu to
delete all previous data and then import new data.
Intra-category graph drawing
An intra-category graph is used to depict all sequences and their connections within a
category (the current category). Unlike some regular graph drawing software, in which the
location of an object is fixed, SRD provides an interactive dynamic drawing by using a hot spot
technique jointly with a user-steered object location.
8
Categories are displayed graphically as a user-defined beautiful picture (Categories Map) in
the ‘inter-category drawing window’. The picture has a hot spot for each category, which is also
user-defined. When a user clicks one of these hot spots, the corresponding category becomes the
“current category”, and SRD displays all the sequences of the category and their connections
simultaneously in the ‘intra-category drawing window’.
In intra-category graphs, each sequence is represented by an open circle except for the virtual
ones, which are displayed as black solid circles. The number marked in the middle of the circle
denotes the SID of each sequence. For clarity, only SID is printed in graphs, other properties such
as SeqID, Caption, sequence strings, etc. are not printed. However, full details are available in the
‘current sequence list window’. On the other hand, SRD provides a hot spot for each sequence
vertex. When a user’s mouse moves onto a vertex circle, the mouse pointer changes to the pointing
finger shape and the cursor returns the SID, SeqID and caption of the corresponding sequence in a
ToolTip text box.
9
The reticulate relationships between each pair of sequences are displayed as connection lines
labeled with the relationship values at the middle of the line. The minimum and the maximum
relationship values are calculated and the corresponding connection line is drawn as red color and
blue color, respectively. This is useful for the user to find out the minimum and the maximum
relationship and acquire the value range at a glance.
When there are a large number of sequences and a large number of relationship links, connection
lines will mix up together. To overcome this problem, separate edges displaying is supported in the
system. Any sequence can be selected by clicking on the corresponding vertex. When a sequence
is selected, the corresponding vertex is highlighted with a particular color, and edges only linked
to the selected sequence are drawn, other edges are omitted. The minimum and the maximum
relationship values are re-calculated and colored lines are also re-marked according to the current
lines drawn. When users click anywhere else of the graph, all connection lines will display
together again. Which part of the edges to be displayed depends on the user’s selection.
Furthermore, sequence selection displays synchronously with the ‘current sequence list
window’. When a sequence is selected in the graph, the corresponding item in the list window is
highlighted and brought into view automatically, which is useful for a user to check the detail
information about the selected sequence. Conversely, sequence items in the list window are also
clickable and selectable, when an item is selected, the corresponding vertex in the graph will be
highlighted automatically and the drawing window will be scrolled if necessary to make a view of
10
putting the vertex circle in the center. This is very useful for a user to find out the vertex of a
specific sequence in the graph from the detail list.
Category-Category graph drawing
The intra-category graph shows sequences and their relationships within one category.
Another undirected graph is provided in SRD in the ‘inter-category drawing window’, with each
category as a vertex, to depict category-category relationships.
The category-category graph is somewhat different from the intra-category one, although
both of them are undirected graphs. Firstly, the fact that a category linked to another only denotes
that there exists some relationships between the sequences within the two categories, so we
needn’t define a category-category relationship value and therefore no value will be labeled on the
connection lines in the category-category graph. Moreover, when drawing an intra-category graph
to illustrate sequence relationships within the current category, at a larger scale, the user will want
Figure 11H. A category-category graph.
to see whether and how her current category are related to someone else. At this scale,
category-category graph, it should be straightforward to display edges that only linked
current category, while other edges should be omitted at the moment for clarity.
In SRD, when the current category is selected by clicking the corresponding hot spot
Categories Map, an intra-category graph is generated and simultaneously, edges linked
11
in the
to the
in the
to the
current category are displayed as several red lines in the ‘inter-category drawing window’. At the
same time, the ‘foreign sequence list window’is also filled with some sequences, which are called
“Foreign sequences” since these sequences listed here denote that each of them is related at least
to one of the sequences within the “Current Category”. The relationship values can be shown in
the ‘foreign relationship window’when a foreign sequence is clicked in this window. It is useful to
get a detail list of related sequences in other categories while visualizing an intra-category
relationship.
There is also a mechanism to get extra-connections separately, i.e. to get extra-connections
only linked to the selected one sequence in the current category rather than all of them. This can
be simply done by selecting one sequence by clicking on the corresponding vertex in the
‘intra-category drawing window’or clicking the corresponding item in the ‘current sequence list
window’. As mentioned in previous section, this will lead to the selected sequence vertex to be
highlighted and connection lines displayed separately in the intra-category graph. At the same time,
this will also affect extra-connections. Category-category edges and foreign sequence list will also
be altered automatically according to this selection. Once again, how extra-connections are
displayed depends on a user’s selection. Combining this feature with intra-category graph provides
a macroscopic understanding of sequence relationships.
12
Extra-category graph drawing
Continue with the previous section, when a user sees several red lines in the ‘inter-category
drawing window’, hot spots of all linked categories are assigned a new functional property. With
mouse moving onto the hot spots, users will find that the ToolTip has been changed by being
added a new line of text: “Right click to depict sequences in related category”, which can not be
found on normal category hot spots. If a user right-clicks one of them, the extra-category drawing
window will be animated from small to big to become visible in the main GUI. The animation
indicates the opening of the right-clicked category. An extra-category graph has been generated in
this window, in which sequences and the relationships between them in the right-clicked category
are illustrated, just similar as that in an intra-category one. This is a particularly important point
for interactive graphic displays, which is useful for a user to visualize the detail foreign sequences
and relationships in another related category.
An extra-category graph has most the same characteristics as an intra-category one, such as
circular vertices, connection lines, hot spots, etc. Sequence vertices are also clickable to draw
connection lines separately. A special characteristic of an extra-category graph is that vertices of
all foreign sequences in this graph are filled with a particular color, which denotes that there are
some relationships between them and the current selected one. Furthermore, SIDs of related
sequences and relationship values can be displayed in the prompt ToolTip text when mouse
moving onto the foreign sequences vertices, which allows a user to quickly get the information
about which a colored sequence is linked to and how about the relationship values.
Alternatively, another way to open the ‘extra-category drawing window’is to click one of the
13
Figure 15H. An extra-category graph.
items list in the ‘foreign sequence list window’. In this way, the drawing window will scroll
Figure 16H. Cursor gives the linking information when mouse moves onto a foreign
sequence vertex.
automatically to make the selected sequence into view.
Moreover, this window is a floating window, which is always placed above and can be
dragged to anywhere in the main GUI of SRD. It can be closed at any time by clicking the “close”
button at the top-right of the window. Animation is used again when the window disappears as it
returns to its corresponding category.
Recursion extra-intra categories
As mentioned above, it is easy to view category-category relationships and to generate an
extra-category graph. However, although clicking a sequence in an extra-category graph can
control edges displaying separately, there is no effect on category-category relationships and
foreign sequences, which is different from selecting a sequence in an intra-category graph. This is
14
because there can be only one “current category” at a time, and category-category relationships
and foreign sequences are relative to the “current category”. But sometimes, one may concern
about the category-category relationships and foreign sequences relative to the extra-category,
rather than “current category”, when he is looking at an extra-category graph.
The proposed software adopts an “extra-intra category transferring” technique, which have
combined these three perspectives to create a highly integrated multi-window visualization in the
SRD environment. This can be simply done by another mouse action—double click. A double
click on one vertex in the extra-category graph leads to a “current category transferring”. The
‘extra-category drawing window’is animated from big to small again but to disappear at the
middle of the ‘intra-category drawing window’, which indicates that the current category now has
become the one previously in the extra-category window. The double-clicked sequence is then
automatically selected in the now ‘intra-category graph’. All other windows are changed according
to the new current category and the new selected sequence.
One may right-click a related category again to open the ‘extra-category drawing
window’and double-click a sequence in this window to make a second extra-intra transferring.
Then right-click another category, and transfer again … This recursion is helpful to trace a
sequence relationship path between different categories, especially in investigating a revolutionary
path between different organisms or investigating a disease transmission path between different
places.
Fully customizable interface
To cater to the broadest array of biological scientists users, the program is fully customizable
for categories definition, category-category map picture, all vertices locations and even help
document.
Categories definition
To make categories definition, click the ‘Set Category-Category Layout’command in the
‘File’Menu. A category list will be shown at the right bottom in the displayed dialog. Click the
‘Add’or ‘Delete’button to add a new category or delete the selected category in the list.
Set Categories Map
To customize a category-category map, click ‘Set Categories Map’command in the
‘File’Menu. Choose a picture as the map. Any picture with bmp, jpg, gif format is supported.
In the example, we choose a China map as the category-category map; because we partition
15
all the sequences to several Chinese provinces.
Re-layout objects in each intra-category graph
Click ‘Set Intra-category layout’command in the ‘File’Menu to open ‘Set intra-category
graph layout’dialog.
Then choose the dataset (DstID) and the category in the two drop down menus bellow. The
dialog presents the sequence list in the selected category and illustrates the undirected graph to
users graphically. All objects coordinates can then be adjusted by loading layout files generated by
other tools or by user’s mouse-dragging in this graph. Click ‘save’button to save all the changes to
the database.
Figure 18H gives an example of dragging objects to set layout. Figure 19H gives an example
of import layout generated by Cytoscape.
16
Re-layout category-category graph
Click the ‘Set Category-Category Layout’command in the ‘File’Menu. Select a category in the list
at the right of the dialog displayed. Then click mouse at somewhere in the picture map at the left
to draw a proper circle to set the hot spot range for the category.
17
User-defined help document
SRD allows importing a user-defined available RTF (Rich Text Format) file into the system as a
help document, in which information appears as color-coded text. The RTF file can be generated
by most word-processing software, such as Microsoft Word, Windows WordPad, Open Office, etc,
and saved as a RTF file. The RTF format help file can then be further imported using the ‘Import
Figure 21H. A Help document displaying as RTF format.
18
help document’function in the help menu. The help document can be displayed in another window
by clicking the ‘help’function in the help menu or press Ctrl+F1.
Splitting sub-windows in different views
The main GUI of SRD composed of several sub-windows. Users are enabled to drag the
common border of each two adjacent windows to resize each other. If the dragging horizontal
border up and down, or dragging vertical border left and right, the border's orientation can be
changed from horizontal to be vertical, or vice versa. This can be used to re-arrange the
sub-windows layout of SRD.
19
20
Results Export
Finally, for the purpose of input to other applications or the purpose of further analysis, the
capacity to output results is essential. The output layer is able to directly write contents in all list
windows to files, copy any graphs into the clipboard and save pictures as BMP (bitmap image
format) files. These can be done by a simple mouse right-click in most windows of the main GUI,
and choosing the corresponding functions in the pop-up menu.
To efficiently view the results generated by SRD, text output is also supported as
complementary to the graphical drawings. A text file can be generated to describe current graphs
by clicking the ‘Output Text Information’function in the ‘edit’menu. The text file is structured so
as to be usable by human readers as well as by computer programs. It is composed of different
types of lines, each with its own format, which are used to record the various types of data. Some
files will not contain all of the line types, and some line types may occur many times in another
file, this depends on the user’s selection in graph drawing window.
A terminator line (//) designates the end of the file.
A text file generated by SRD is composed of different types of lines.
Types of lines
Description
DD
CM
DT
CG
SH
Current dataset ID (DstID).
Comments.
Date and time when generate this file.
Current category.
Sequence header (a sequence description followed by lines of sequence
data).
Lines of sequence data.
The links is related to all sequence or to the selected sequence.
SQ
LS
21
LH
LK
//
Link header (a link description followed link information)
Link Information including the pair of two sequences with their relationship
value.
End of file.
22