1
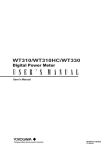
6.7
Bar Graph Display
1
The bar graph display shows harmonic measurement data for each harmonic order in a bar graph.
The bar graph window can be displayed when the WT is equipped with the harmonic measurement
option (/G5).
2
3
4
5
Harmonic orders
6
Displaying Measured Data
Detail Setting Dialog Box
Right-click the bar graph window to display the detail setting dialog box of the window. This is not
possible when measured data collection is in progress.
7
Shows or hides all bar graphs at once
8
9
Start and End
10
Select the harmonic order of the numeric data to display.
• Start harmonic order: 0 to 40
• End harmonic order: 10 to 50
The difference between the start and end harmonic orders must at least be 10.
Index
Function
Select the bar graph to display using the check boxes.
The bar graph is displayed for the combination of the functions and elements that you select.
Up to three bar graphs can be displayed.
Element
Select which element to display the bar graph of.
1. Click an Element cell. A combo box appears.
2. Select the element.
IM 760121-02E
6-21