1
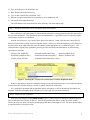
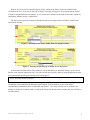
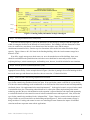
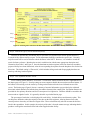
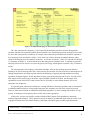
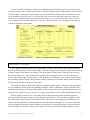
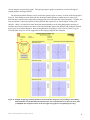
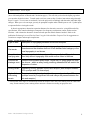
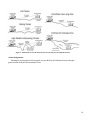
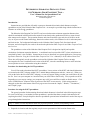
DETERMINING SEPARATION DISTANCES USING
THE NEBRASKA ODOR FOOTPRINT TOOL:
User’s Manual for the Spreadsheet Tool
Rick Stowell and Crystal Powers
Extension Engineers
Introduction:
Instructions are provided that will enable a person to determine directional setback distances using the
spreadsheet version of the Nebraska Odor Footprint Tool. An example is provided along with the instructions to
illustrate use of the Excel spreadsheet.
The Nebraska Odor Footprint Tool (NOFT) can be used to determine minimum separation distances that
should be maintained in different directions around livestock and poultry production facilities to meet selected
odor annoyance-free targets. The separation distances take into account the types and sizes of facilities on the
site, use of proven odor control technology, historical weather records, risk-avoidance levels for odor annoyance,
and local terrain. For background information on the Nebraska Odor Footprint Tool, directional setback
distances, and odor footprints, the reader is directed to the publication Odor Footprints and Odor Footprint Tools:
An Overview.
The spreadsheet version of the Nebraska Odor Footprint Tool is designed to simplify and expedite
calculations of minimum separation distances. A worksheet-based version of the NOFT, where calculations are
completed by hand, is also available. Instructions on its use are described in a separate publication, Determining
Separation Distances Using the Nebraska Odor Footprint Tool: User’s Manual for the Worksheet-Based Tool.
Those who will regularly use the spreadsheet version of the Nebraska Odor Footprint Tool are strongly
encouraged to first use a worksheet-based version of the NOFT, since the contributing factors to odor emissions
on an operation are more evident when using the worksheet.
Procedure for downloading the NOFT spreadsheet:
You will first need to download the NOFT spreadsheet. Latest versions of the NOFT and related information
are located on the NOFT webpage within UNL‟s Animal Manure Management website, <insert url>. When you
click on the link to the file on the NOFT webpage, a screen will appear asking you what you would like to do with
the file. Save it on your computer in a location where you will be able to find it easily. Next, open the saved file.
Depending on your security settings, your computer may ask if you would like to enable or disable macros. Click
on the “Enable Macros” button to allow all portions of the NOFT to run correctly. If this setting cannot be
changed, use the tabs at the bottom of the Excel page to move between the “Inputs,” “Results,” “Calculations,”
and “Graphs” pages.
Procedure for using the NOFT spreadsheet:
The general procedure for determining directional setback distances is described in the following nine steps.
For several of the steps, a screenshot from the spreadsheet is provided that shows example information for the
step being described. It may be helpful to have the spreadsheet open and enter information for each of the steps as
you go through these instructions.
Step 1: Gather essential information about the proposed operation, facilities, and planning criteria.
To use the Nebraska Odor Footprint Tool, you will need to have information available on the:
1) Proposed site location and what region(s) may be most representative of this location climate-wise;
Draft -- This document is being reviewed.
1
2) Type of facility(ies) to be built on the site;
3) Basic dimensions of the facility(ies);
4) Type of odor control being considered, if any;
5) Desired or required annoyance-free frequency(ies) to be maintained; and
6) The terrain surrounding the facility.
This information will be entered into the white info-entry cells of the Inputs page.
Step 2. Provide a title and fill in basic information about the operation.
Enter a descriptive title and identify for whom setback information is being prepared in the info-entry cells at
the top of the spreadsheet. This information assists in documentation. A good title will prove especially helpful
when multiple scenarios are considered.
Note the site location (i.e. city, county) in the space below the title. On the line below this, choose the city
that best represents this location in terms of regional climate. Select a city from the dropdown list by clicking on
the down arrow to the right of the info-entry cell and then on the appropriate city, as shown in Figure 1. The
Nebraska Odor Footprint Tool spreadsheet presently provides directional setback distances for the following
representative locations:
Alliance (Neb. Panhandle)
Ainsworth (north-central Neb.)
Norfolk (northeast Neb.)
North Platte (southwest Neb.)
Grand Island (south-central Neb.)
Beatrice (southeast Neb.)
Lincoln (airport salt flats)
Scottsbluff (North Platte River valley)
Figure 1. Selecting the "Location for weather data" from the dropdown menu.
It may be appropriate to determine separation distances using information from two or more adjacent regions.
In such situations, calculate and keep a record of setback distances for each region.
It‟s a good idea to document who prepared the setback information, as well as the date the information was
prepared. Enter this information in the info-entry cells to the right of the location information.
Step 3. Choose the type of facilities.
In the lines following the heading BASE PLAN (Figure 2), choose a general descriptor from the dropdown
lists for each odor source facility on the site. Consider all pertinent odor sources on the site, where feasible.
When you revise one input, you may be prompted to update other related inputs as well. Be sure to update inputs
as requested before viewing the results.
Draft -- This document is being reviewed.
2
Data for dry lots as well as anaerobic lagoons will be coming in the future, but are not included in the
calculations for now. If you choose this type of facility a message will appear to let you know that the facility
will not be included in further calculations. A very conservative estimate can be made for anaerobic lagoons by
substituting “Manure storage - earthen basin”.
The types of beef open lots common in Nebraska do not have enough research available to estimate odor
emissions at this time.
Figure 2. Selecting an odor source facility from the dropdown menu.
Figure 3. Selecting the specific type of facility for an odor source.
If two or more facilities will be nearly identical, you can indicate this as described in Step 6, so you do not
need to create separate columns for each. For each selected source facility, choose from the dropdown list in the
next line down the specific type of facility to be built (Figure 3).
Step 4. Enter the number of animals.
For each source facility, enter the number of animals housed within or served by that facility (Figure 4). This
information is not essential for the Nebraska Odor Footprint Tool, but tends to be very useful when
communicating information relative to individual odor sources. Also, when a facility size is not known, the
number of animals to be housed within / served by the facility can often be used to estimate the size of facility, as
needed in Step 5.
Draft -- This document is being reviewed.
3
Step 4
Step 5
Step 6
Figure 4. Entering facility information in Steps 4 through 6.
Step 5. List the plan dimensions of each facility.
In the next line down (Figure 4), specify the dimensions of each facility by filling in either the length and
width of rectangular facilities or the diameter of circular facilities. For buildings, enter the dimensions of floor
areas; for outdoor lots, enter the top-view dimensions of the lot surface areas; and for manure
containment/treatment facilities, enter the top-view dimensions of the surface area when filled to the design
capacity. Figure 4 shows a 40‟x 200‟ barn for the finishing building, while the circular manure storage has a
diameter of 300‟.
If an office, supply storage room, break room, etc. are to be attached to one of the buildings, these areas
should be excluded from the plan dimensions since these areas should not be noteworthy sources of odor.
Adjoining hallways, animal treatment pens, and handling areas, however, should be included in most situations.
Step 6. Note the presence of identical facilities, if any.
If multiple nearly identical facilities are to be used, choose the total number from the dropdown list under the
appropriate source facility. In the example shown in Figure 4, the farm is putting in four swine finishing facilities
that are the same type and dimensions; therefore, the user can select “4” identical facilities.
Step 7. Select the odor control being implemented/considered.
The spreadsheet is designed to facilitate comparisons of odor control alternatives (Figure 5). First choose the
type of odor control being considered for the base plan. If no special odor control is utilized for a given facility,
or if the odor control technology under consideration is not listed and its effectiveness has not been independently
confirmed, choose “No supplemental odor control implemented.” In the typical scenario, no special odor control
is included the base plan. Determining setback distances for a base plan without implementing odor control
technology provides the user with information on the operation‟s expected baseline odor impact and opportunity
to evaluate the benefit of odor control in terms of reduced setback distances and impact area. Next, choose the
type of odor control being considered in the “Alternate Plan.” Figure 5 shows a scenario where the options of
using a biofilter on cool season airflow on the building and placing straw 2” thick over the manure storage is
being considered. Limiting odor control to one or two technologies better illustrates the impact of individual
selections and better represents most realistic applications.
Draft -- This document is being reviewed.
4
Step 7
Step 7
Step 8
Figure 5. Choosing odor control for the Base Plan and the Alternate Plan. Finally, choose the terrain.
Step 8. Indicate the type of terrain around the facility.
Terrain is an optional entry and should only be used when very distinct terrain feature present between a
livestock facility and an existing receptor. Terrain adjustments should be considered a special case. Currently,
only flat terrain will be used to calculate setback distances in the NOFT. However, it is valuable to record the
terrain for future reference. Match up the terrain in each direction with the most appropriate description and
illustration from Table 1 and Figure 9. Once the dominant terrain descriptions in the four directions around the
proposed facility have been determined, select the corresponding descriptions from the dropdown lists for the four
directions. The default setting is “Flat terrain”, which includes rolling terrain and all topography that does not
match up with the given descriptions.
Step 9. View separation distance results.
To see resulting setback distances, click on the “View Results” button located in the lower right-hand area of
the Inputs page (see Figure 5). Security settings on some computers disable the macros that run these buttons. If
the button is not working view the results by clicking on the Results tab in the lower left hand corner of the
screen. The Results page (Figure 6) shows a summary of essential information you provided, plus calculated
directional setback distances for both the base plan and the alternate [odor control] plan. Separation distances are
provided for four primary directions and for five annoyance-free frequencies. Distances should be rounded to the
nearest tenth or eighth of a mile. It is generally advisable to print the Results page.
The percentage of total odor is also displayed for each facility, for both the base and alternative plans. This
can help users determine where the majority of the odor on the farm originates, allowing them to focus odor
control practices where they will have the largest effect. These calculations only take into account the facilities
listed in the spreadsheet. In this example, the majority of the odor is from the manure storage, indicating that the
producer would get the most benefit from odor control applied to that facility.
Draft -- This document is being reviewed.
5
Figure 6. Example Results page for directional setback distances.
The „odor annoyance-free frequency‟ values represent the minimum proportion of hours during which a
residence situated at or beyond the setback distance should be free from being exposed to annoying levels of odor.
For 96% odor annoyance-free conditions, for example, odors within the specified distance would be expected to
be at annoying levels more than 4% (100% - 96%) of the time, while at locations beyond this distance, odors
should be at annoying levels less than 4% of the time. As a frame of reference, 1 hour over a period of 4 full days
is a frequency of about 1%. A location at the 96% odor annoyance-free distance, then, is expected to experience
annoying odor levels for 4 hours over a four-day period, on average, which equates to an hour a day or 30 hours a
month.
The odor annoyance-free frequency selected has a dramatic effect on the resulting separation distances.
Wanting to be free of annoying odors 99% of the time may be unrealistic for some areas due to limited options for
finding enough land to meet large required setbacks and challenges of applying this high standard to existing
operations wanting to expand. On the other hand, in many areas having annoying odor levels 6-10% (94 or 90%
odor annoyance-free) of the time is unrealistic if good neighbor relations are desired. An advantage of the
spreadsheet version of the NOFT is that it allows the user to readily see odor setback distances for several
annoyance-free frequencies.
As a general guide, when local residents have a strong affiliation with animal agriculture and are accustomed
to modern production practices, using an odor annoyance-free frequency near 94% may suit the local needs.
However, when most residents are unaffiliated with animal agriculture, or when avoiding odor conflicts is a top
priority, an annoyance-free frequency closer to 98% may be more appropriate.
At this point, you have successfully used the Nebraska Odor Footprint Tool spreadsheet to determine
minimum separation distances. Three optional steps may be taken to get additional detail about the results, look
at graphical illustrations of the setback distances, and return to the Inputs page to modify input information.
Optional Step 1. View calculations.
Draft -- This document is being reviewed.
6
Click on the “Show Calculations” button (lower right-hand portion of Results page) if you are interested in
seeing intermediate values used during calculations. Security settings on some computers disable the macros that
run these buttons. If the button is not working, view the calculations by clicking on the Calculations tab in the
lower left hand corner of the screen. For a discussion of the various terms and where some of the values are
found, refer to the publication, Determining Separation Distances Using the Nebraska Odor Footprint Tool:
User’s Manual for the Worksheet-Based Tool. From the Calculations page, you can navigate to other pages by
clicking on the buttons at the bottom.
Figure 7. Example Calculations page.
Optional Step 2. View graphs.
To see separation distances shown to scale graphically, click the “View Graphs” button (lower right-hand
portions of Results, Inputs, and Calculations pages). Security settings on some computers disable the macros that
run these buttons. If the button is not working, view the graphs by clicking on the Graphs tab in the lower left
hand corner of the screen. Then, locate the box with five numbers ranging from 90% to 99% in the top left
portion of the Graphs page, as shown Figure 8. The „annoyance-free frequency‟ values selected again represent
the minimum proportion of hours during which a residence situated at or beyond the setback distance should be
free from being exposed to annoying levels of odor.
The checkboxes control which setback distances are displayed in the graphs. Choose the values appropriate
to your situation by clicking on the corresponding checkboxes. When a checkmark is displayed, then the odor
annoyance-free frequency is displayed in the graphs. It may be beneficial to view separation distances for a few
annoyance-free frequencies at the same time, so a range of odor setbacks can be readily compared and assessed.
Now the graphs are ready to view. The points shown on the graphs represent the minimum separation
distances (directional setback distances) in each of the primary directions. The left column of graphs is for the
Base Plan, and the right column is for the Alternate Plan. This side-by-side arrangement should illustrate the
amount of benefit obtained by implementing the selected odor control technology(ies). As you move down the
page, the graphs show the same setback distances at reduced scales, increasing the graph area shown from one
mile in each direction from the source up to five miles. For many typical scenarios, setback distances can be
Draft -- This document is being reviewed.
7
viewed using the top [one-mile] graphs. The larger-perspective graphs are needed to view the full range of
setback distances for larger facilities.
The directional setback distances can be visualized as quarter circles or arrows, as shown in the first graph of
Figure 8. Each 90-degree sector defined by the directional setback distances contains the area in the given
direction that is expected to be impacted by annoying odors more often than the selected frequency. Together, the
four areas define a conservative picture of the risk-based odor impact area or „odor footprint‟ for the given
facilities. Often, it is beneficial to show directional setback distances on an aerial photograph or plat map to
illustrate where local residences are relative to the risk-based odor impact area (dubbed „odor footprint‟) defined
by the given set of setback distances. Refer to the publication Evaluating Livestock Facility Plans Using the
Nebraska Odor Footprint Tool for suggestions on developing simplified odor footprints.
Figure 8. Example Graphs page showing checkboxes for desired odor annoyance-free percentages and resulting
setback distances for the Base Plan and Alternate Plan. The setback distances are shown at three scales.
[A simplified odor footprint is shown on the first, upper-left graph for conceptual purposes only].
Draft -- This document is being reviewed.
8
Optional Step 3. Revise inputs.
To revise the inputs and determine new directional setback distances, click the “Return to Inputs” button
(lower left-hand portions of Results and Calculations pages). This will take you back to the Inputs page where
you can make desired revisions. To make major revisions, return to Step 2 in these instructions and go through
Steps 3-9 again. To revise one or two details, revise the project title accordingly and then make individual input
changes. When you revise one input, you may be prompted to update other related inputs as well. Update inputs
as requested before viewing the results.
It often is appropriate to determine separation distances for alternative scenarios - using different facility
specifications, odor control technologies, annoyance-free frequency combinations, and/or weather station
locations – and evaluate the alternative scenarios based upon the setback distances needed. Refer to the
publication Evaluating Livestock Facility Plans Using the Nebraska Odor Footprint Tool for suggestions on
scenarios to compare and example comparisons.
Table 1. Terrain adjustment factors.
Type of area
Description of topography between source and receptors
Flat terrain
Default scenario. Minimal change in topography exits.
Use whenever the situation does not fit into another listed category or the
local topography is not known.
Unconfined,
low-lying area
Receptors are located down-slope of the source (below 2% grade line
from site) without topography that would confine odors in the area.
Confined air
drainage zone
Receptors are situated down-slope - below the 2% falling grade line from
the source – within a valley having confining sidewalls that will restrict the
dispersion of odors.
Rolling terrain
Undulating country between source and receptor (with receptor between
10% up-slope and 2% down-slope)
High relief or
intervening
terrain
Receptor is at a higher elevation than the source (greater than 10%
upslope from site) or significant hills and valleys are present between the
site and receptor)
* Value depends on the degree of confinement presented: the steepness of the valley and confining walls, the width of the
valley, and the continuity of the confining features should be considered in selecting an appropriate value.
Draft -- This document is being reviewed.
9
Figure 9. Illustrations of terrain characteristics for selecting terrain adjustment factor.
Acknowledgements:
Funding for development of this material was provided by the Nebraska Lottery through a
grant from the Nebraska Environmental Trust.
10