Download UCTT 8901A User Manual
Transcript
UCTT 8901A User Manual Rev E 2/2013 Contents 1. Getting Started.........................................................................7 1.1 Quick Start Process..............................................................7 1.2 Unpacking.............................................................................7 2. Physical Properties . ...............................................................8 2.1 Front Panel...........................................................................8 2.1.1 Power Button.....................................................................8 2.1.2 Keypad and Selection Wheel............................................9 2.1.2.1 Saving and Recalling Measurement Results................10 2.1.2.2 Saving a Screen Capture.............................................10 2.1.2.3 Adjusting Screen Brightness.........................................10 2.4 Connector Panel.................................................................11 2.2 Flip-out Stand.....................................................................12 2.3 Battery Pack ......................................................................12 2.3.1 Battery Status Indicators.................................................12 2.3.2 Battery Calibration...........................................................12 2.3.3 Battery Removal..............................................................13 2.3.4 Battery Installation...........................................................13 3. UCTT Menu Scheme and Navigation...................................14 4. System Configuration Menus ..............................................16 4.1 System Mode......................................................................16 4.2 General Menu.....................................................................16 4.2.1 Set Time and Date.........................................................16 4.2.2 Set Display Color Scheme.............................................16 4.2.3 Set Center Frequency Configuration.............................16 4.2.4 Set Full Screen Mode Configuration..............................17 4.2.5 Set Measurement Units.................................................17 4.2.6 Set System Power Mode...............................................17 4.2.7 Managing User Configurations......................................18 4.2.8 Remote Control Menu....................................................18 4.2.9 IP Configuration.............................................................19 4.2.10 UCTT Remote Commands...........................................19 4.2.11 GPS & Timing Reference Configuration.......................22 4.2.12 Touchscreen Calibration...............................................22 4.3 File Menu . .........................................................................23 4.3.1 Exporting Files...............................................................23 4.3.2 Deleting Files.................................................................23 4.3.3 Upgrading Software.......................................................24 4.3.4 Exporting System Logs..................................................24 4.4 Instrument Options Menu...................................................24 5. RF Measurements .................................................................25 Sage Instruments • UCTT User Manual Rev E 2/2013 Page 2 Quick Start Guide These links provide a quick overview of the UCTT operation and menus. This information allows most users to start running tests on the UCTT with a minimum of reading. Step 1: Descriptions of User Controls Step 2: Menus and Screen Navigation Step 3: RF Measurements Topics of Interest User Control Description Menu System Overview Battery Replacement Managing Options Remote Control Commands System Admin Menus Upgrading Software PC Utilities Contents 5.1 Measurement Menus, Soft Keys and Display Controls.....25 5.1.1 Menus and Soft Keys.....................................................25 5.1.2 Zoom and Full Screen Display Control..........................25 5.2 UCTT Marker Menus.........................................................26 5.2.1 Marker Manipulation Soft Keys......................................26 5.2.2 Marker Math Soft Key....................................................26 5.3 Open, Short, Load Calibration Procedure......................27 5.4 Spectrum Analyzer Application.......................................28 5.4.1 Spectrum Analyzer Frequency Menu.............................28 5.4.2 Spectrum Analyzer Amplitude Menu..............................29 5.4.3 Spectrum Analyzer Bandwidth Menu.............................30 5.4.4 Spectrum Analyzer Marker Menu...................................33 5.4.5 Manual Attenuator Adjustment.......................................33 5.5 Power Meter Application..................................................34 5.5.1 Power Meter Frequency Menu.......................................34 5.5.2 Power Meter Amplitude Menu........................................35 5.5.3 Power Meter Bandwidth Menu.......................................36 5.5.4 Marker Menu..................................................................37 5.6 Return Loss Application..................................................38 5.6.1 Return Loss Setup Menu...............................................38 5.6.2 Return Loss Results Menu.............................................39 5.6.3 Return Loss Marker Menu.............................................39 5.7 Distance to Fault Application..........................................40 5.7.1 Distance to Fault Setup Menu........................................40 5.7.2 Distance to Fault View Menu.........................................41 5.7.3 Distance to Fault Faults Menu.......................................42 5.7.4 Distance to Fault Marker Menu......................................42 5.8 VSWR Application...........................................................43 5.8.1 VSWR Setup Menu........................................................43 5.8.2 VSWR Results Menu.....................................................44 5.8.3 VSWR Marker Menu......................................................44 5.9 One Port Insertion Loss Application..............................45 5.9.1 One Port Insertion Loss Setup Menu.............................45 5.9.2 One Port Insertion Loss Results Menu..........................46 5.9.3 One Port Loss Marker Menu..........................................47 Sage Instruments • UCTT User Manual Rev E 2/2013 Page 3 Contents 5.10 Two Port VNA Application.............................................47 5.10.1 Two Port VNA Setup Menu..........................................47 5.10.2 Two Port VNA Results Menu........................................49 5.10.3 Two Port VNA Marker Menu.........................................49 5.11 Signal Locator Application............................................50 5.11.1 Signal Locator Frequency Menu..................................50 5.11.2 Signal Locator Amplitude Menu....................................51 5.11.3 Signal Locator Bandwidth Menu...................................52 5.11.4 Signal Locator Marker Menu........................................53 5.11.5 Signal Locator Map Menu............................................53 5.12 Signal Coverage Application.........................................55 5.12.1 Signal Coverage Frequency Menu..............................55 5.12.2 Signal Coverage Amplitude Menu................................56 5.12.3 Signal Coverage Bandwidth Menu...............................57 5.12.4 Signal Coverage Marker Menu....................................58 5.12.5 Signal Coverage Logging Menu...................................58 5.12.6 Signal Coverage Map Menu........................................59 5.13 GSM Application.............................................................61 5.13.1 GSM RF Setup Menu...................................................61 5.13.1.1 GSM Frequency Parameter Soft Keys......................61 5.13.2 GSM Screen Selection and Setup Menu.....................62 5.13.2.1 GSM RF Analysis Screen.........................................63 5.13.2.3 Burst Analysis Screen...............................................64 5.13.2.4 Modulation Screen....................................................64 5.13.2.5 Mask Analysis Screen...............................................64 5.13.3 GSM Logging Menu.....................................................65 5.14 CDMA Application..........................................................66 5.14.1 CDMA RF Setup Menu................................................66 5.14.1.1 CDMA Frequency Parameter Soft Keys...................66 5.14.2 CDMA Screen Selection and Setup Menu...................67 5.14.2.1 RF Spectrum Screen................................................68 5.14.2.2 CDMA Summary Screen...........................................68 5.14.2.3 EVDO Summary Screen...........................................69 5.14.2.4 Zoom Screen............................................................69 5.14.2.5 Multipath Screen.......................................................70 5.14.2.6 Scanner Screen........................................................70 5.14.2.7 EVDO Time Slots Screen..........................................71 5.14.2.8 CDMA Pass/Fail Screen...........................................71 5.14.2.9 EVDO Pass/Fail Screen............................................72 5.14.3 CDMA/EVDO Logging Menu.......................................72 Sage Instruments • UCTT User Manual Rev E 2/2013 Page 4 Contents 5.15 WCDMA Application.......................................................73 5.15.1 WCDMA RF Setup Menu.............................................73 5.15.1.1 WCDMA Frequency Parameter Soft Keys................73 5.15.2 WCDMA Screen Selection and Setup Menu................74 5.15.2.1 WCDMA RF Spectrum Screen..................................75 5.15.2.2 WCDMA Summary Screen.......................................75 5.15.2.3 WCDMA Zoom Screen..............................................76 5.15.2.4 WCDMA Codogram Screen......................................76 5.15.2.5 WCDMA Modulation Screen.....................................77 5.15.2.6 WCDMA Scanner Screen.........................................78 5.15.2.7 WCDMA Pass/Fail Screen........................................78 5.15.2.8 WCDMA Spectral Emissions Mask Screen...............79 5.15.2.9 WCDMA Uplink Screen.............................................79 5.15.3 WCDMA Logging Menu...............................................80 5.16 LTE (FDD and TDD) Application....................................81 5.16.1 LTE RF Setup Menu....................................................81 5.16.1.1 LTE Frequency Parameter Soft Keys.......................81 5.16.2 LTE Screen Selection and Setup Menu......................82 5.16.2.1 LTE RF View Screen................................................83 5.16.2.2 LTE Bandwidth Soft Key...........................................83 5.16.2.4 LTE Configuration Menu...........................................83 5.16.2.5 LTE Pass/Fail Screen...............................................84 5.16.2.6 LTE Frame Summary Screen....................................84 5.16.2.7 LTE Cell-ID Scanner Screen.....................................85 5.16.2.8 LTE MIMO Scanner Screen......................................85 5.16.2.9 MIMO Setup Menu....................................................85 5.16.2.10 LTE Frame View Screen.........................................86 5.16.2.11 LTE Power vs Time Screen.....................................86 5.16.2.12 Subcarrier Soft Key.................................................86 5.16.2.14 LTE Subcarrier View Screen...................................87 5.16.2.17 LTE Modulation Screen...........................................87 5.16.2.19 LTE Multi-Path Screen............................................88 5.16.2.20 LTE Spectral Screen..............................................88 5.16.3 LTE Logging Menu.......................................................89 5.16.4 LTE Measurements Technical Description...................90 5.17 WiMAX Application.........................................................90 5.18 Adjacent Channel Power Application...........................91 5.18.1 Adjacent Channel Power Frequency Menu..................91 5.18.2 Adjacent Channel Power Amplitude Menu...................91 5.18.3 Logging Menu..............................................................93 Sage Instruments • UCTT User Manual Rev E 2/2013 Page 5 Contents 5.19 Spectrogram Application...............................................94 5.19.1 Spectrogram Frequency Menu....................................94 5.19.2 Spectrogram Amplitude Menu......................................95 5.19.3 Spectrogram Bandwidth Menu.....................................96 5.19.5 Spectrogram Marker Menu..........................................99 5.20 Channel Scanner Application......................................100 5.20.1 Channel Scanner Frequency Menu...........................100 5.20.2 Channel Scanner Amplitude Menu............................100 5.20.3 Logging Menu............................................................101 5.21 Vector Signal Generator Application..........................103 5.21.1 Vector Signal Generator Menu...................................103 5.21.2 Vector Signal Generator Transmitter Control.............104 6. Backhaul Tests.....................................................................105 6.1 Ethernet Application ......................................................105 6.1.1 Ethernet Setup Menus.................................................105 6.1.2 Test Setup Menus........................................................107 6.1.3 Test Results Screens...................................................109 6.1.4 Test Tools Menu........................................................... 111 6.2 DS1/E1 BERT Application..............................................112 6.2.1 DS1 BERT Results Menu.............................................112 6.2.2 T1/E1 PCM Configuration Menu..................................112 6.2.4 BERT Configuration Menu...........................................114 7. PC Software Utilities............................................................116 7.1 Post Test Analysis Tool (PTAT).....................................116 7.2 UCTT Mapper Utility.......................................................119 7.3 UCTT Remote Display Client.........................................120 8. UCTT Specifications............................................................121 9. UCTT Warranty.....................................................................124 Sage Instruments • UCTT User Manual Rev E 2/2013 Page 6 1. Getting Started Introduction The UCTT is a powerful multi-functional test instrument containing a comprehensive set of measurement resources for the cellular industry. While the UCTT combines several complex instruments into one package, the menu and user interface has a simple consistency that allows intuitive operation for most users familiar with cellular testing and maintenance practices. The following section highlights the portions of the manual that should be reviewed to get started testing with the UCTT. 1.1 Quick Start Process The material required to get up and testing with the UCTT is listed below. The other remaining sections of the manual describe the menus and general system maintenance in more detail. User Control Section: An overview of the front panel controls and their functions. Menus and Screen Navigation Section: Describes the common menu scheme that is used by the UCTT. RF Measurements Section: An overview of the measurement menus and methods followed by a detailed description of each measurement application. 1.2 Unpacking When your new UCTT test instrument arrives from the factory, the shipping box should contain the following components: Packing List • SAGE UCTT 8901A Cellular Test Unit • Power Cord • Charger/Power Supply • Calibration Cord • SAGE UCTT User Manual, supplied on CD in printable PDF format. ��������� �������� ��� ��������� ��� ��������� ��� ��������� ��� ����� ��� Remove the components from the shipping carton and inspect contents. Notify SAGE Instruments immediately of any damage. Sage Instruments • UCTT User Manual Rev E 2/2013 Page 7 
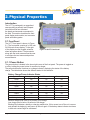
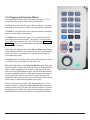
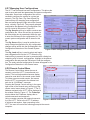
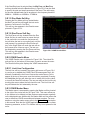
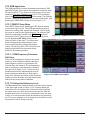
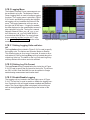
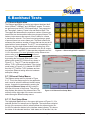
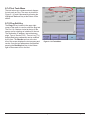
2. Physical Properties Introduction The UCTT is packaged in a ruggedized case providing a powerful and compact test solution that can withstand the harsh environments encountered in the field. This section describes the front panel display and controls, test connector panel and battery packs. 2.1 Front Panel The UCTT front panel is shown in Figure 2.1. The front panel consists of a 10.4 inch SVGA touch screen display. To the right of the display are the keypad, selection wheel and power button. These controls along with the touch screen allow the user to configure the test menus and perform measurements. Figure 2.1 UCTT Front Panel 2.1.1 Power Button The power button is located in the lower right corner of the front panel. The power is toggled on or off by holding the power button for a second or longer. The power button also functions as a charge indicator, displaying the status of the battery charge. The table below shows the different states for this indicator. Battery Charge/Power Indicator States Charge Indicator Battery Charge UUCT Power State External Power Green Full On Yes Blinking Green Medium On Yes Blinking Amber Low On Yes Green Full On No Green Medium On No Amber Low On No Amber Full Off Yes Amber Medium Off Yes Blinking Amber Low Off Yes Medium charge level is 88 to 18 percent of full charge. Low charge level is below 18 percent of full charge. Blinking Red indicates a battery or charging malfunction. If this occurs turn off the unit, remove and reinstall the battery(s) and power up the unit again. If the battery status indicator continues to blink red contact Sage for assistance. Sage Instruments • UCTT User Manual Rev E 2/2013 Page 8 2.1.2 Keypad and Selection Wheel The keypad and selection wheel are shown in Figure 2.2. The numeric keys are used to enter values into the menus. The Esc key is located to the right of the blue shift key. It is used to escape or cancel text or numeric values entered into data fields. The Back key is used to clear text or numeric entries a character at a time, and to back out of menus. The Mode button is circled in Figure 2.2. It is used to switch between different instrument modes. This button is of central importance in the menu scheme of the UCTT. Refer to the Menu and Navigation section for more information on the Mode button and the UCTT menu scheme. To the right of the Mode button is the Up and Down arrow buttons. These navigation buttons are used to move up or down through a list of menu items, or to increment or decrement a currently selected parameter value. The Enter button to the right of the Up and Down buttons is used to confirm an entry or to select an item from a list. Below the Mode button is the Selection Wheel control. This multifunction control combines the functions of the Up, Down and Enter buttons. When navigating a list of items, rotating the knob clockwise moves the highlight down the list, counter clockwise rotation moves the highlight up the list. When performing numeric entries, rotating the knob clockwise increases the value, while counter clockwise rotation decreases the value. Pushing the knob will confirm the entry or select the highlighted item in a list. Figure 2.2 UCTT Keypad and Controls Some of the numeric keys also have alternate functions. These can be accessed by pressing the blue shift key then the desired alternate function key. The menu bar at the top of the LCD screen will display the word Shift when the shift key has been pressed and alternate functions can be selected. The alternate functions Sage Instruments • UCTT User Manual Rev E 2/2013 Page 9 available are Save, Recall, Prt Sc and Display. 2.1.2.1 Saving and Recalling Measurement Results The Save function key is located in the #6 button in Figure 2.3. This key is used to save a snapshot of the results for the currently running test. When the Shift, Save key is pressed, the UCTT will prompt the user for a file name and user comment for the results. The File Name Menu pictured in Figure 2.4 is used to enter a file name. The last file name entered appears in the file name text box. The user can append to the name by typing or deleting characters. Additionally, the user can touch the file name and a list of previously entered file names will be presented to select from. These stored results can be displayed along with the file name and comment as an overlay for other tests, or the results file can be exported for analysis. The results file contains test data points in a CSV (Comma Separated Value) format. The Recall function key is located in the #9 button. This key can be used during a test to recall a stored result overlay. When the Shift, Recall button is pressed the UCTT will prompt the user to select among the stored result files. For information on exporting test results to an external system see the Exporting Files section of the manual. Figure 2.3 UCTT Keypad 2.1.2.2 Saving a Screen Capture The Prt Sc function key is located in the #3 button in Figure 2.3. This key is used to take a screen capture image of the LCD display. When the Shift, Prt Sc key is pressed, the UCTT will prompt the user for a file name for the screen capture. The file name is entered using the File Name Menu pictured in Figure 2.4. The screen capture files are stored in the PNG (Portable Network Graphics) format. For information on exporting screen capture files see the Exporting Files section of the manual. Figure 2.4 File Name Menu 2.1.2.3 Adjusting Screen Brightness The Disp function key is located in the #8 button in Figure 2.3. This key is used to change the display brightness. Pressing the Shift, Disp key will bring up the Adjust Brightness Menu shown in Figure 2.5. The screen brightness can be changed by pressing one of the brightness buttons circled in Figure 2.5. Note that the battery life will be reduced if high brightness levels are selected. The recommended brightness setting for good visibility and battery life is 60%. Figure 2.5 Brightness Control Sage Instruments • UCTT User Manual Rev E 2/2013 Page 10 2.4 Connector Panel Ethernet/Pcm2 Ethernet/Pcm1 GPS Ant. RF Out 10/100 Base T RF In External Ref Even Second Accessory Conn USB - B Power Conn USB - A PCM/Ethernet 2 Connector - RJ-45 connector used to connect to a DS-1 or Ethernet backhaul circuit to the UCTT. GPS Antenna Connector - Used to connect a GPS antenna to provide an accurate external timing reference and location for UCTT measurements. PCM/Ethernet 1 Connector - RJ-45 connector used to connect to a DS-1 or Ethernet backhaul circuit to the UCTT. RF Out Connector - 50 Ohm Female Type N connector for transmitting RF signals. RF In Connector - 50 Ohm Female Type N connector for receiving RF signals. 10/100 Base T Connector - Ethernet connection for remote control. Even Second Connector - Used to supply the even second clock reference signal used for long duration measurements. External Reference Connector - Used as an external timing reference for UCTT measurements. USB Type B Connector - Used for connecting a computer to the UCTT. Accessory Connector - Used for attaching external adapters, applications include audio headset connection, and VGA output for an external monitor or projector. Contact the factory for availability. USB Type A Connector - used to attach memory storage devices for retrieving test result, log or screen capture files from the UCTT. For more information on exporting files from the UCTT see the Exporting Files section of the manual. This USB connector may also be used to upgrade the system software. For more information on upgrading the system software see the Upgrading Software section of the manual. Power Connector - used to connect the external supply/battery charger to the UCTT. Warning, only use the Sage provided charger/power adapter. Using other adapters may pose a hazard to the user or may damage the UCTT. Sage Instruments • UCTT User Manual Rev E 2/2013 Page 11 2.2 Flip-out Stand Figure 2.6 shows the stand that flips out of the rear of the unit and allows the UCTT to sit at a comfortable viewing angle while sitting on a desktop or other horizontal surface. 2.3 Battery Pack The UCTT contains rechargeable battery packs. The standard unit comes with one battery pack, an additional battery pack can be purchased and installed in the unit to provide longer operating life. Battery life varies depending upon operating conditions; however typical battery life in Spectrum Analyzer mode with Max Power Save mode on and the display brightness set to 60% is over 3 hours for one battery pack. The batteries are hot swapable and can be replaced while the unit is powered up. Note that external power should be connected to the UCTT if all batteries are to be removed while the unit is powered up. Figure 2.6 Flip-Out Stand 2.3.1 Battery Status Indicators The battery status indicators are circled in the System Mode General menu pictured in Figure 2.7. The upper indicator in the menu bar displays a graphical representation of the remaining charge in the battery. It also indicates external power connection by displaying a graphic of a plug over the battery. This battery status indicator is present in all UCTT menus. If the status indicator displays a ! or ?, then there is a problem with the battery. If this occurs, remove any external power and remove the battery(s). Re install the battery, if the problem persists, contact the factory. The Battery Status text boxes, circled in the lower portion of the menu, display the percentage of battery charge remaining in each battery. If no battery is installed, the battery status message is “Not Detected”. 2.3.2 Battery Calibration Figure 2.7 General Menu - Battery Status Indicators The UCTT battery packs have advanced charge detection circuitry that accurately predicts the percentage of battery charge remaining. Battery charge capacity can change as the battery ages or is subjected to unusual usage patterns. In order to maintain accuracy, the battery packs must be periodically re-calibrated. The UCTT will indicate a need for battery calibration by displaying the (Calibration Required) message in the Battery Status text box circled in Figure 2.7. For more information on the General menu refer to the System Mode section of the manual. When the Calibration Required message is displayed, the battery pack(s) are recali- Sage Instruments • UCTT User Manual Rev E 2/2013 Page 12 brated by first allowing the battery(s) to fully discharge. This can be accomplished by leaving the unit on under battery power till the battery(s) are fully discharged, and the UCTT powers itself off. Then connect the charger to the UCTT and charge the batteries until they are full, this completes the battery calibration procedure. 2.3.3 Battery Removal The battery packs are located on the left side of the unit. There are lower and upper battery compartments. The following procedure describes assessing the upper battery compartment. The lower battery compartment is accessed in a similar manner. The batteries are accessed by first removing the rubber corner protector as shown in Figure 2.8. The battery compartment door is pictured in Figure 2.9. The door is opened by unscrewing the circled thumb screw. Once the battery compartment is opened, grasp the tab on the end of the battery and withdraw the battery pack as shown in Figure 2.10. Figure 2.8 Removing Corner Protector 2.3.4 Battery Installation The battery packs are installed by sliding them into the battery compartment as shown in Figure 2.10. Each battery pack has a slot on one side that should face down toward the bottom of the UCTT. Press the battery firmly into the UCTT battery compartment to engage the connector between the battery and the UCTT. Then close the battery cover and replace the rubber corner protector. Note that the corner protectors are not interchangeable. To facilitate reassembly, the protectors are numbered and correspond to the numbers stamped on the bottom panel of unit. Figure 2.9 Opening Battery cover Figure 2.10 Removing/Inserting Battery Sage Instruments • UCTT User Manual Rev E 2/2013 Page 13 3. UCTT Menu Scheme and Navigation 3.1 Test Mode Selection The UCTT combines the functionality of several conventional test sets ie Spectrum Analyzer, Fault Locator, Bert Analyzer etc. into one package. The menus for controlling this functionality are organized by instrument type, these are referred to as instrument “modes”. Figure 3.1 shows the Mode Selection Soft Keys used to select the different instrument modes. The mode selection soft keys are the main or root menu for the UCTT. These soft keys are accessed by pressing the circled mode button pictured in Figure 3.2. The desired mode is selected by pressing the corresponding soft key. Alternatively the selection wheel can be used to highlight and select the desired mode. The Mode button can be pressed at any time to bring up the Mode selection soft keys. Note that any test that is running will be terminated when the instrument mode is changed. Once a mode is selected, the menus associated with the test application are displayed and the user can configure and run tests. For example, Figure 3.3 shows the menus that are associated with the Spectrum Analyzer mode. These menus allow the user to configure the spectrum analyzers frequency, amplitude and bandwidth parameters as well as specifying reference marker locations on the results graph. In addition to test modes, the UCTT has a system configuration mode that is accessed by pressing the Syst Figure 3.1 Mode Selection Soft Keys Figure 3.2 Mode Button ��������� �������� ��� ��������� ��� ��������� ��� ��������� ��� Figure 3.3 Spectrum Analizer Menus Sage Instruments • UCTT User Manual Rev E 2/2013 Page 14 ����� ��� soft key. The System mode menus are used to perform system administration tasks. Refer to the System Mode section of the manual for more details on the System menus. 3.2 Menu Description The UCTT uses a common menu format for all its test and configuration menus. Figure 3.4 shows the Spectrum Analyzer Marker menu. The circled menu bar at the top of the menu displays the following information from left to right, current instrument mode, time and date, battery condition and current menu name. Note that the Instrument Mode and Menu name are useful indicators when navigating the UCTT menus. The soft keys along the bottom of the display are used for selecting among the menus for the test mode. In Figure 3.4 the instrument mode is Spectrum Analyzer, so the soft keys along the bottom of the screen are labeled Frequency, Amplitude, Bandwidth and Marker which correspond with the Spectrum Analyzer menus. The highlighted menu soft key indicates which menu is selected, in this case it is the Marker menu. Menu Bar Menu SoftKeys Menu Selection Keys Figure 3.4 Typical UCTT Menu Layout Each menu includes soft keys that appear along the right side of the screen as shown in Figure 3.4. These buttons are generally used to enter values or other configuration information into the test menu, or to back out of the current menu. Sage Instruments • UCTT User Manual Rev E 2/2013 Page 15 4. System Configuration Menus 4.1 System Mode The System Mode is used to perform system administration and general configuration of the UCTT. These tasks include managing results, log and configuration files, setting Time and Date, managing purchased options, software and setting up Remote Control. Pressing the mode button and pressing the Syst soft key circled in Figure 4.1 will place the UCTT in the System Mode, and display the General Menu. In the System mode, the menu selection soft keys along the bottom of the screen are labeled General, File and Options. These correspond to the different configuration menus available. The Calibration soft key is for factory use and does not have an associated menu. 4.2 General Menu The General menu is the default menu displayed when the System mode is entered. This menu allows setting Time and Date, checking GPS receiver state, managing user configuration files and initiating remote control. The General menu is shown in Figure 4.2. From the System mode, this menu can be selected by pressing the lower left soft key labeled General. Figure 4.1 System Mode Selection 4.2.1 Set Time and Date The Set Time and Set Date buttons are located in the General menu. These buttons are circled in Figure 4.2. Pressing the Set Time or Date button will bring up dialog boxes for setting the time and date for the UCTT. The system time and date are used to timestamp log and result files. 4.2.2 Set Display Color Scheme The display color scheme can be changed to a high contrast mode to make measurement graphs easier to read in bright light conditions. The Color Scheme selection box is located to the left of the circled buttons in figure 4.2. The default setting is labeled Normal. To change to the high contrast display mode press the down arrow button in the Color Scheme selection box and press the High Contrast item in the displayed list. Select the Normal item form the list to return to the default display mode. 4.2.3 Set Center Frequency Configuration Figure 4.2 General Menu - Set Time & Date The center frequency configuration can be changed by pressing Sage Instruments • UCTT User Manual Rev E 2/2013 Page 16 the down arrow key in the Cent Freq selection box circled in figure 4.3. This parameter determines if the same center frequency specified in the Spectrum analyzer and related measurements are also used in the demodulated measurements (Tied to Spec Analyzer), or if the center frequencies for the demodulated measurements are independent of the spectrum analyzer center frequency (Demod Specific). The default configuration is Tied to Spec Analyzer. 4.2.4 Set Full Screen Mode Configuration The full screen mode allows the user to expand the measurement window to the full screen. This configuration is selected in the Full Screen selection box circled in Figure 4.4. Pressing the down arrow button in the box allows the selection of No Full Screen, On-Demand or Timeout 3,5 or 10 seconds. When On-Demand is selected, the user can touch the screen area circled in Figure 4.5 in any measurement screen to activate the full screen view. Touching anywhere on the screen will turn off the full screen view. If the Timeout 3,5 or 10 is selected, the measurement screen will automatically display the full screen view if no buttons are press after the selected timeout of 3, 5 or 10 seconds. Touching the screen anywhere will turn off the full screen view. Figure 4.3 Center Frequency 4.2.5 Set Measurement Units The measurement units can be changed to English or Metric by pressing the down arrow key in the Units selection box circled in figure 4.4. 4.2.6 Set System Power Mode Figure 4.4 Full Screen, Units & Power Mode The power mode allows the user to select between maximum battery life or fastest system response. The power mode is selected by pressing the down arrow key in the Power Mode selection box circled in Figure 4.4. Two power modes are available, Max Power Save and Fast DSP Boot. The Max Power Save mode conserves battery life by only initializing the the measurement circuitry that is currently being used. This means that when the user switches to the system menu or changes from radio to DS1 or ethernet measurements there is a pause while the system initializes the measurement circuitry. In Fast DSP Boot mode all circuits are initialized and there is no pause when switching between measurement types or the system menu. Figure 4.5 Enable Full Screen View Sage Instruments • UCTT User Manual Rev E 2/2013 Page 17 4.2.7 Managing User Configurations The UCTT can store and load user configurations. This allows the user to save and recall test parameters and system configuration information. Saved user configuration files can be recalled to configure the system for a given test scenario. The Cfg: Save, Cfg: Save As and Cfg: Load soft keys for managing user configuration files are located along the right side of the General menu, circled in Figure 4.6. The currently selected configuration file appears in the Configuration Status box circled in the center of Figure 4.6. The Cfg: Save As soft key is used to create a new configuration file. When this soft key is pressed, a file name dialog box is presented to allow the user to enter the file name for the configuration file. The current system configuration will be stored in this file. The Cfg: Save soft key is used to update the currently selected configuration file. Any configuration changes will be written into the file displayed in the Configuration Status box of the General System Figure 4.6 User Configuration Soft Keys and Status menu. The Cfg: Load soft key is used to select and load a new configuration file into the UCTT. When the Cfg: Load soft key is pressed, the user is presented with a dialog box containing a list of stored configurations. Highlight to the desired configuration file and press the OK button to load the configuration. The newly selected configuration file name will appear in the Configuration Status box in the General menu. 4.2.8 Remote Control Menu The Remote Control Menu allows the user to remotely control the UCTT via an ethernet connection. The local keyboard/touchscreen display cannot be used while in the remote control mode. To initiate a remote control session, first ensure that the UCTT is connected to the ethernet network via its 10/100BaseT connector. Pressing the Remote Control soft key in the upper right corner of the General menu will bring up the remote control menu shown in Figure 4.7. The IP Address assigned to the UCTT will be displayed in the window circled in Figure 4.7. The Transcript window below the IP Address displays the received commands and responses. Using a remote computer with network connectivFigure 4.7 Remote Control Menu ity to the UCTT, Telnet to the UCTT IP address to initiate a test session. Upon connecting to the UCTT, the user will receive the following prompt at the remote computer: Sage Instruments • UCTT User Manual Rev E 2/2013 Page 18 Welcome to the Sage Instruments Telnet Service on VGX > The Prev Screen soft key is used to exit the remote control menu, if this key is pressed while a remote session is active, the session will be terminated. The File or Option Soft Keys can also be used to exit the remote menu and session. 4.2.9 IP Configuration The IP interface used for remote control of the UCTT can be configured by the user. The IP configuration menu is selected by pressing the Cfg IP Address Soft Key found in the upper right corner of the Remote Control menu shown in Figure 4.7. The IP Configuration Menu is shown in Figure 4.8. The IP configuration values can be changed by pressing on the desired value. When a parameter is pressed, a text or numeric entry dialog box will be presented for data entry. The Network Name parameter is used to identify the UCTT in the network. The UCTT can be assigned a static or dynamic Figure 4.8 IP Configuration Menu IP address. Checking the Obtain an IP Address Automatically via DHCP check box will cause the UCTT to have a dynamic IP address. In this case the address is assigned by the DHCP server on the network. If the Obtain IP Address check box is not checked, a static IP address can be manually specified in the Manual IP Address section of the IP configuration menu shown in Figure 4.8. 4.2.10 UCTT Remote Commands UCTT remote control commands can be entered at the > prompt. The following is a list of valid commands. Entering the help command at the prompt will bring up a list of valid commands. Entering help followed by a command will display the help for the selected command. Administrative Commands: cal ceq exit help temp version For Sage Factory use only For Sage Factory use only. Exits the command interpreter and closes associated network resources Allows all users to access help on the various built-in commands Displays the radio temperatures Displays the command interpreter version Test Commands: idle Controls the current radio Tx & Rx status freqOff Calculate the frequency offset of a single tone. rfrl Measures the average return loss in the specified band rfst Measures the freq/offset/level of a single tone within +/- 50kHz of Center Frequency rfsa Detects the highest amplitude signal in the specified frequency span Sage Instruments • UCTT User Manual Rev E 2/2013 Page 19 sgen tune Controls the radio Transmitter Tunes the radio (Tx/Rx) The following text describes each command in detail. Note that the command parameters show the proper units, IE Mhz or Hz, in parenthesis after the parameter description. Command parameters enclosed in square brackets are optional parameters. Default values will be used if these parameters are omitted. No spaces or tabs are allowed in parameters. idle The idle command is used to turn off the radio transmitter or receiver. The idle command should be issued before using the transmitter or receiver. This ensures that the transmitter or receiver is placed in a known state before measurements are made. idle [-tx] [-rx] This command defaults to turning off both the receiver & transmitter. The flags can be used to turn off just the current receiver task or the current transmitter task. [-tx] Idle Tx Only (Optional) [-rx] Idle Rx Only (Optional) No spaces or tabs allowed in parameters. freqOff The freqOff command is used to measure the frequency offset of a single tone from the center frequency. The center frequency must be specified with the tune command before freqOff is used. rfrl The rfrl command is used to measure the average return loss in the specified band. rfrl [-b] [-nav] [-sp] [-z] This test is a single-shot test, it executes, returns the measurement data, then unregisters itself, unless the z flag is specified. Note that # avg papameter will cause a increasing delay in response. [-b] [-nav] [-sp] [-z] Band: 0=All (default) 1=PCS+ISM, 2=Cell+PCS, 3=Cell, 4=AWS+PCS, 5=ISM (Optional) 0 to 5 # Avg (default=1) (Optional) 1 to 1000 Return Spectrum Data (Optional) Zombie - don’t shut down test (Optional) No spaces or tabs allowed in parameters. rfst The rfst command measures the frequency, level and offset from center frequency of a single tone. The center frequency must be specified with the tune command before rfst is used. rfsa The rfsa command is used to request a radio measurement. The radio must be configured using the tune command before issuing the rfsa command. The rfsa command will return a frequency and level measurement corresponding to the highest amplitude peak detected in the requested frequency span. Additionally, the -sp option will cause the command to return multiple measurements over the specified frequency span. This test is a single-shot, it runs, retrieves the data, then unregisters itself. Sage Instruments • UCTT User Manual Rev E 2/2013 Page 20 Results Bandwidth (rbw) cannot be specified manually if span is less than 5 MHz. rfsa [-w] [-rbw] [-nav] [-sp] Span . Use the ‘tune’ command for tuning... [-w] Window Type: 0=Uniform 1=KAISER (default) 2=HANNING 3=HAMMING 4=GAUSS (Optional) 0 to 4 [-rbw] Results BW (default=auto) (Optional) 100 to 50000 [-nav] # Avg (default=1) (Optional) 1 to 1000 [-sp] Return Spectrum Data (Optional) Span (Hz): 10000-640000000, range 10kHz-640Mhz No spaces or tabs allowed in parameters. sgen The sgen command causes the radio transmitter to generate a single frequency signal. The command parameters specify the level and frequency of the generated signal. sgen [-rsvd1] Center_Frequency Level. [-rsvd1] Reserved: CAL Only! 12 bit DAC Value: 0-4095 Center_Frequency (MHz): 700 to 2200, range 700-1000 Mhz, 1.6-2.2 GHz Level (dB): 0 to -60 No spaces or tabs allowed in parameters. tune The tune command sets the center frequency of the radio receiver. This command must be issued before the rfsa command can be sent. The individual attenuator settings are derived from the desired level. The preamp will be off unless the flag is specified. tune [-p] [-rsvd1] [-rsvd2] Center_Frequency Attenuation [-p] Preamp On (default off) (Optional) [-rsvd1] Reserved: CAL Only! 2 * IF1 Atten (dB): 0-31 (Optional) 0 to 31 [-rsvd2] Reserved: CAL Only! ATTN_Names value (Optional) 0 to 9 Center_Frequency (Hz): 698000000-2700000000, range 700-1000 Mhz, 1.6-2.2 GHz Attenuation (dB): 0-61 No spaces or tabs allowed in parameters. Sage Instruments • UCTT User Manual Rev E 2/2013 Page 21 4.2.11 GPS & Timing Reference Configuration The internal frequency reference of the UCTT can be synchronized and trained to several external timing sources. These are GPS timing, an external frequency reference or an external even second timing source. Additionally the GPS receiver in the UCTT can be used to provide location data for its measurements. This section covers the GPS and timing configuration screen for the UCTT. For more information on the UCTT GPS antenna and external timing source connectors refer to the connector panel section of this manual. The GPS and timing screen is accessed by pressing the circled GPS soft key in the General System menu pictured in Figure 4.9. The circled indicator at the top edge of the GPS screen in Figure 4.10 indicates the type and status of the Figure 4.9 General System Menu GPS Soft Key external timing source. The options are GPS, Ext or Even depending on the timing source connected. If more than one timing source is connected, the UCTT will give first priority to an external source, followed by Even seconds then GPS. If no timing sources are connected there will be no indicators present. Furthermore the indicators will be green when a valid timing signal is present or yellow when there is a problem with the signal or if the GPS receiver has not acquired all the necessary satellites. These indicators are also present in the other measurement screens to indicate the external timing and location status. The circled status boxes in the upper left corner of the screen in Figure 4.10 are the GPS Lock and the External Even Seconds indicators. The GPS Lock indicator is checked when the GPS receiver has acquired sufficient satellites to provide accurate timing and location reference. The Ext Even Second indicator is checked when an external valid even second signal is detected. The 1PPS (one pulse per second) status box is Figure 4.10 GPS & Timing Configuration Screen circled in the upper right corner of Figure 4.10. This indicator will display Yes or No when the external timing source is acquired and the UCTT is generating an accurate one pules per second reference from the source. Below the 1PPS indicator is the Ext. Freq indicator that displays the frequency of the external frequency source if connected. The Time and Date indicators display UTC time. The Latitude and longitude indicators display the current position when GPS lock indicator is checked. The Delta F (PPB) indicator circled in the bottom left corner of figure 4.10 displays in parts per billion the frequency difference between the external timing reference and the internal reference of the UCTT. If the Delta F indicator displays -- then the frequency difference is greater than 50 ppb. 4.2.12 Touchscreen Calibration The touchscreen can be calibrated by pressing the circled soft key in Figure 4.11. Once the button is pressed, on screen prompts direct the user to touch the screen at various points to perform the calibration. At the end of the calibration sequence the user has the option of using the Sage Instruments • UCTT User Manual Rev E 2/2013 Page 22 Figure 4.11 Calibrate Touchscreen new calibration values, or keeping the old ones. To maximize the accuracy of the touch screen sensors a non scratching blunt stylus should be used for the calibration procedure. 4.3 File Menu The File menu is used to export various types of files from the UCTT, manage options and upgrade system software. An external thumb drive attached to the USB-A connector of the UCTT is used to transfer files and upgrade software. Exportable files include screen captures, Data and Log files. In the System mode, the File menu is selected by pressing the File Menu key circled in Figure 4.11. The File menu is shown in Figure 4.12. The two radio buttons circled at the top of Figure 4.12 allow the user to switch between viewing Screen Figure 4.11 File Menu Softkey Capture files or Data/Log files stored in the UCTT. Below the list of files is a text box displaying the status of the external thumb drive. If no thumb drive is connected, the status displays “Not Present”. 4.3.1 Exporting Files Screen Captures or Data/Log files can be exported from the UCTT individually, or all files may be exported at once. To export a single file, touch the file to highlight it and press the Copy to Ext soft key located in the upper right corner of the File System menu shown in Figure 4.12. This action will cause the selected file to be copied to the external thumb drive. To export all files press the Copy All to Ext soft key and all the displayed files will be copied to the thumb drive. 4.3.2 Deleting Files The Delete Local soft key circled on the right side of the Figure 4.12, is used to delete Screen Captures or Data/Log files from the UCTT’s memory. To delete a file, highlight the desired file and press the Delete Local soft key. The Delete All Local soft key located under the Delete Local soft key can be used to delete all displayed log or data files from the UCTT. Figure 4.12 File Menu Sage Instruments • UCTT User Manual Rev E 2/2013 Page 23 4.3.3 Upgrading Software The UCTT system software can be field upgraded. The upgrade files are first loaded onto a USB thumb drive. The thumb drive is then inserted into the USB-A connector of the UCTT. Pressing the Upgrade soft key circled in figure 4.13 will cause the UCTT to initiate the software upgrade process using the upgrade files stored on the thumb drive. Once the Upgrade soft key is pressed, the upgrade process will proceed automatically. 4.3.4 Exporting System Logs The UCTT maintains several error and event log files. If the UCTT malfunctions, these logs can be exported to facilitate trouble shooting and diagnostic activities. To export the UCTT log files, first insert a USB thumb drive into the USB-A connector of the UCTT. From the File menu pictured in Figure 4.13, press the Copy Syslogs soft key located in the lower right corner of the screen to copy the UCTT log files to the USB thumb drive. Figure 4.13 Upgrade Software Soft Key 4.4 Instrument Options Menu The UCTT has software option activation keys that control the availability of the different measurement features such as spectrum analysis, DS1 BERT, Distance to Fault etc, These options can be viewed and managed via the Option menu. Pressing the Option key circled in Figure 4.14 will bring up the Option menu shown in Figure 4.15. The checked options correspond to options that are currently installed. Unchecked options can be enabled by obtaining an activation key for the desired option from Sage. Pressing the Activate Key softkey circled in Figure 4.15 will bring up the Activate Options dialog box. The alphanumeric activation key obtained from Sage is then entered into the dialog box to activate the desired option. Figure 4.14 UCTT Option Menu Soft Key Figure 4.15 UCTT Option Menu Sage Instruments • UCTT User Manual Rev E 2/2013 Page 24 5. RF Measurements 5.1 Measurement Menus, Soft Keys and Display Controls All measurements in the UCTT use a similar format for menus and data entry described here. For more information on the basic menu operation and navigation refer to the front panel controls or the menus and navigation sections of this manual. 5.1.1 Menus and Soft Keys The Spectrum analyzer menu is shown in Figure 5.1.1 this is a typical UCTT measurement screen and will be used here as an example. The soft keys along the bottom of the screen are used to select among the different menus for the application, notice that the curFigure 5.1.1 Measurement Menu & Soft Keys rent parameter values are also displayed on these soft keys. The Frequency soft Key in the lower left corner of Figure 5.1.1 is highlighted indicating the Frequency menu is selected, the corresponding frequency parameters soft keys are displayed along the right edge of the screen. The Center Freq soft key in the upper right corner is highlighted and the current center frequency is displayed in red indicating that this parameter can be adjusted. Most menus unless otherwise noted allow selected parameters to be changed by turning the selection wheel, pressing the front panel up or down arrow buttons or by entering the desired value on the keypad. When the keypad is used the soft keys on the right side will change as shown on Figure 5.1.2. In this case the MHz key label is red indicating the default entry units are in MHz. Pressing the front panel enter key or the selection wheel will enter the value in the default units. Figure 5.1.2 Zoom Selection and Units Soft Keys Any soft key on the right of the screen can also be used to enter the value, in this case the units will correspond to the label on the soft key that was pressed. Additionally some parameters can be changed by pressing anywhere on the measurement screen, this will change the parameter to the value on the x or y axis where the screen was touched. For example touching the screen in the circled area in Figure 5.1.1 will shift the center frequency of the instrument as shown in Figure 5.1.2. 5.1.2 Zoom and Full Screen Display Control Most measurement displays can show a magnified view by simply drawing a diagonal line across the desired area on the screen, forming a selection rectangle as shown in Figure 5.1.2 The display will magnify the selected area as shown in Figure 5.1.3. Additionally, a full screen view can be selected by pressing the circled area in Figure 5.1.2. In both cases, Figure 5.1.3 Zoom View Sage Instruments • UCTT User Manual Rev E 2/2013 Page 25 tapping anywhere on the screen will reset the view to normal. Refer to the Set Full Screen Mode section of this manual for more information on setting up and using the various full screen control modes. 5.2 UCTT Marker Menus The marker menu shown in Figure 5.2.1 is used to display and manipulate markers on the measurement screen. These markers can be used to make precise readings of frequency and level at user specified points on the displayed trace. Furthermore, differences in frequency and levels between markers can be displayed. Figure 5.2.2 shows an expanded view of the marker information displayed on the screen. The currently selected marker is displayed on top, followed by the currently defined markers labeled M1 and M2. The marker frequency and levels are also displayed. Marker 1 has a math function defined and is showing the frequency and level difference between marker1 and marker2. The UCTT supports up to 6 markers. These markers are directly tied to DSP measurements, not static Figure 5.2.1 Marker Menu screen locations so the measurements may vary with each displayed DSP trace. The marker readings can be stabilized by increasing the averaging parameter if the normal trace mode is used, or by pausing the measurement. 5.2.1 Marker Manipulation Soft Keys The six marker soft keys in the upper right corner of Figure 5.2.1 are used to turn on or off the markers. The marker soft keys also indicate the state of the marker, On or Off and also indicate the selected marker by turning the maker state label red. When a marker soft key is initially pressed, the marker is turned on and the marker number and frequency are displayed in the upper left corner of the screen. The user can change the marker location using the keypad, selection Figure 5.2.2 Displayed Marker Details wheel, front panel up or down arrow keys, or by simply touching the screen where the marker should be located. Additionally there are four marker manipulation soft keys circled in Figure 5.2.1 that allow moving the selected marker or center frequency. The CF to Marker soft key is used to change the center frequency parameter to the current marker location. The Marker to Peak soft key will move the selected marker to the highest value on the measurement trace. The Next Peak and Prev Peak soft keys will move the selected marker to the next or previous peak in the measurement trace. 5.2.2 Marker Math Soft Key The Marker Math soft key located in the lower right corner of Figure 5.2.1 is used to manage the display of markers as well as defining math Sage Instruments • UCTT User Manual Rev E 2/2013 Page 26 functions between marker locations. Pressing the Marker Math soft key will cause the Marker management menu shown in Figure 5.2.3 to be displayed. The currently setup markers are indicated by the check boxes labeled 1 thru 6. Pressing one of the checked boxes will turn off the marker on the display, including any associated math. If a user un-checks a marker the UCTT will remember the marker location, so when the marker is checked by pressing on the check box next to the marker label, the marker will reappear in its original location. The six selection boxes on the right side of the menu are used to calculate the frequency and level differences between markers. Pressing the down arrow button in a markers selection box will cause a drop down list of all markers to be displayed. Press on the desired marker number in the list to setup the marker math function between markers. Once the selection is finished, press the Done button at the bottom of the screen to close the menu. 5.3 Open, Short, Load Calibration Procedure Figure 5.2.3 Marker Management Menu In order to perform accurate antenna and cable measurements, the RF output and any additional cables and connectors that are used to connect the UCTT to the antenna or cable system under test must be calibrated using open, short and load standards. These calibration standards are available from Sage, contact your sales representative if you need to purchase calibration standards. The Return Loss, Distance to Fault and VWSR applications require this calibration procedure. The UCTT displays the calibration date, in the upper right portion of the screen as shown in Figure 5.3.1. To perform the calibration press the Calibrate soft key located in the bottom right corner of the screen. The UCTT will display the words “Connect Load to RF Out”. Connect the 50 Ohm load standard to the RF output or cables if applicable then press the Next soft key located in the upper right corner of the display. The UCTT will briefly display “Wait -- Calibrating Load”, then it will display “Connect Open to RF Out”. At this point, remove the 50 Ohm load standard and replace it with and Open standard then press the Next soft key. The UCTT will Display the mesFigure 5.3.1 Open, Short, Load Calibration sage “Calibrating” followed by the message “Connect Short to RF Out”. At this point remove the open standard and replace with the short standard then press the Next soft key. The UCTT will display the message “Calibrating followed by “Calibrated (mm/dd/yyy)”. where mm/dd/yyyy is the current date. Remove the short standard, the calibration procedure is complete. Note that temperature extremes can affect the calibration accuracy, so it is recommended to perform the calibration procedure if the environmental temperature changes by more than 20°C. Sage Instruments • UCTT User Manual Rev E 2/2013 Page 27 5.4 Spectrum Analyzer Application The spectrum analyzer plots produced by the UCTT are superior to those produced by other swept tuned analyzers. This is because the UCTT uses a Fast Fourier Transform (FFT) algorithm which allows real time analysis of the signal. The FFT takes a snapshot containing all frequency components simultaneously while the swept analyzer looks at each frequency separately at different points in time. This means that time variant, intermittent and modulated signals will not be clearly displayed by swept tuned analyzers due to the frequency sampling nature of their measurements. Spectrum Analyzer measurements are performed by connecting the antenna or cable to be tested to the RF input of the UCTT, refer to the Connector Panel section of this manual for the location of the RF input connector. The spectrum analyzer application is accessed by pressing the front panel Mode button, then pressing the SA soft key circled in figure 5.4.1. The Spectrum Analyzer screen shown in Figure 5.4.2 will be displayed. The soft keys along the bottom of the screen are for selecting the different Spectrum Analyzer menus. The current center frequency is displayed in red in the upper left corner and the start and stop frequencies are circled at the bottom. Figure 5.4.1 Spectrum Analyzer Soft Key 5.4.1 Frequency Menu The spectrum analyzer frequency menu is accessed by pressing the Frequency soft key in the lower left corner of the screen in Figure 5.4.2. The soft keys along the right side of the screen are used for entering the frequency menu parameters described in the following sections. 5.4.1.1 Frequency Parameters Soft Keys Figure 5.4.2 Spectrum Analyzer Frequency Menu There are three methods for setting up the spectrum analyzer frequency parameters, specifying center frequency and span or by specifying the start and stop frequencies, or by specifying the Channel Plan and Channel. The corresponding pairs of soft keys for each method are circled in Figure 5.4.2. In the first case the center frequency and the display span are entered using the Center Freq and Span soft keys. The UCTT will automatically set the start and stop frequencies based on the center frequency and span parameters. The other method for setting the spectrum analyzer frequency parameters is to enter the stop and start frequencies using the Start Freq and Stop Freq soft keys. In this case the UCTT will determine the center frequency and span based on the entered start and stop frequencies. The third method for setting the frequency parameters is to use the Channel Plan and Channel soft keys. In this case the center frequency and span are automatically determined based on the channel plan and channel selected. Pressing the Channel Plan soft key will bring up the channel plan selection menu shown in Figure 5.4.3. This list contains the channel plan names and frequency ranges for each Sage Instruments • UCTT User Manual Rev E 2/2013 Page 28 Figure 5.4.3 Channel Plan Menu plan. Pressing the RF Standard or Frequency buttons circled in Figure 5.4.3 will sort the list based on channel plan name or by frequency range. Additionally at the bottom of the channel plan selection screen is a list of valid channels for the selected plan. To select a plan press the desired channel plan followed by the OK button at the bottom of the menu. To leave the Channel Plan mode simply press one of the Center Freq, Span, Start or Stop frequency soft keys. The Span soft key can also be used to toggle the Zero Span display mode. In this mode the analyzer displays the time domain plot of the desired frequency much like an oscilloscope trace. 5.4.1.2 Freq Step Soft Key The Freq Step soft key circled in Figure 5.4.4 is used to specify the frequency step for each detent in the selection wheel. In the automatic mode each detent is one hundredth of the span frequency. For example a 100 Mhz span would have frequency steps of 1 Mhz. The desired frequency step can be changed from the Auto mode by pressing the Freq Step soft key and entering a new value. When this is done the frequency step value will be displayed in the Freq Step soft key. 5.4.1.3 Run/Pause Soft Key The Run/Pause soft key at the bottom of Figure 5.4.4 is used to start and stop the signal analyzer measurements, this is useful for freezing the screen. The current run/pause state is indicated on the lower portion of the soft key. Figure 5.4.4 Frequency Soft Keys 5.4.2 Spectrum Analyzer Amplitude Menu The spectrum analyzer amplitude menu is selected by pressing the circled soft key in Figure 5.4.5. The soft keys along the right edge of the screen are used to modify the amplitude parameters. 5.4.2.1 Setting the Reference Level The Ref Level soft key is used to adjust the reference level of the analyzer, this will have the effect of shifting the signal trace up or down on the screen. Once the key is pressed the user can enter a value, or touch the screen where the reference level should be set. Pressing the Auto Scale soft key will cause the UCTT to automatically determine the reference level based on the current signal power level. 5.4.2.2 Setting the Display Scale The Scale soft key is used to adjust the scale of the display in dB per division. The current scale value is displayed on the Scale soft key as well as the Amplitude menu key circled in Figure 5.4.5. Figure 5.4.5 Spectrum Analyzer Amplitude Menu 5.4.2.3 Setting Offset Level The Ref Lvl Offset soft key is used to apply a fixed offset to the signal. This is useful when viewing high power signals where an attenuator is connected between the UCTT and the signal source. The applied offset value is displayed on the Ref Lvl Offset soft key as well as the Amplitude menu soft key circled in Figure 5.4.5. Sage Instruments • UCTT User Manual Rev E 2/2013 Page 29 5.4.2.4 Controlling the Preamp The Preamp soft key is used to control the state of the internal preamplifier in the UCTT. The default setting for the preamplifier is off. The preamplifier is useful for increasing the signal to noise ratio for low level signals less than -50 dB. Note that turning on the preamplifier when higher signal levels are present can cause instability and erroneous measurements to occur. 5.4.3 Spectrum Analyzer Bandwidth Menu The UCTT utilizes a DSP based Fourier transform to create the measurement display presented to the user. Thousands of measurements per second are recorded. The Bandwidth menu pictured in Figure 5.4.6, provides several options for controlling the measurement resolution as well as the filtering and averaging of the multiple measurements to create the displayed trace. The Bandwidth soft key circled in Figure 5.4.6 indicates some of the Bandwidth menu parameters as well as the frames per second (FPS) that measurements are made or displayed. The FPS indicator depends on the state of the Trace Mode parameters and will be explained in that section. 5.4.3.1 Resolution Bandwidth Soft Key The Res BW soft key is used to set the resolution of the DSP’s individual measurements that create a trace. The default setting for this parameter is automatic. In the autonatic mode the UCTT sets the resolution bandwidth at one one thousandth of the span frequency, thus giving 1000 measurements for the frequency span. Pressing the Res BW soft key located in the upper right corner of Figure 5.4.6 will allow the user to manually set the resolution bandwidth. When the resolution bandwidth is increased, the DSP measurement can take longer to process. The maximum resolution bandwidth setting is 100 Hz. 5.4.3.2 # Average Soft Key The # Avg will set the number of traces that will be averaged together to form the displayed trace. Averaging traces produces a more stable Figure 5.4.6 Spectrum Analyzer Bandwidth Menu display, however averaging will make spurious signals less visible. The averaging parameter only applies when the Trace Mode parameter is set to Normal otherwise it is ignored by the UCTT. Pressing the # Avg soft key will allow the user to enter a new value, pressing the soft key twice will turn off averaging. 5.4.3.3 Trace Mode Soft Key The UCTT has several trace modes that are useful for for detecting various Sage Instruments • UCTT User Manual Rev E 2/2013 Page 30 signal conditions. When the Trace Mode soft key is pressed the Change Trace Mode menu is presented as shown in Figure 5.4.7. There are six trace modes to select from. Pressing the desired trace mode, followed by the OK button in the lower left corner of the menu will change the trace mode parameter. In the Normal trace mode, the DSP records and averages, if applicable, the multiple traces into one displayed trace. In this mode, the Frames Per Second (FPS) indicator displays the number of times the display is updated (about 20 FPS), unless the resolution bandwidth is so great that the DSP frame rate is less than the display frame rate, in this case the DSP frame rate is displayed. In the Peak Hold trace mode the DSP creates a trace from the maximum values measured at each frequency point for successive measurements. These maximum values are retained for the duration of the test, or are reset when the front panel ESC key is pressed. In this mode the DSP measurement frame rate is displayed in the FPS indicator on the Bandwidth soft key. Figure 5.4.7 Change Trace Mode Menu In the Continuous Peak trace mode, the DSP creates a trace from the maximum values measured at each frequency point for successive measurements. These maximum values are displayed, and then reset each time the trace is presented to the user which is approximately 20 times per second. In this mode the DSP measurement frame rate is displayed in the FPS indicator on the Bandwidth soft key. In the Max Burst trace mode, the DSP saves the trace with the maximum total power. This trace is displayed until a trace with more power is detected, or the user resets the test by pressing the ESC key. In this mode the DSP measurement frame rate is displayed in the FPS indicator on the Bandwidth soft key. Note that due to DSP measurement limitations, the Max Burst trace mode cannot be selected when the frequency span parameter is greater than 15 MHz. In the Continuous Burst trace mode, the DSP saves the trace with the maximum total power. This maximum power trace is displayed, and then reset each time the trace is presented to the user which is approximately 20 times per second. In this mode the DSP measurement frame rate is displayed in the FPS indicator on the Bandwidth soft key. Note that due to DSP measurement limitations, the Continuous Burst trace mode cannot be selected when the frequency span parameter is greater than 15 MHz. Sage Instruments • UCTT User Manual Rev E 2/2013 Page 31 In the Color Histogram trace mode the UCTT displays a histogram of each measurement point with the color of each point representing the number of times the same measurement value has been detected. This display mode is pictured in Figure 5.4.8. The red colored points show where the signal has been detected most often, while the blue colored points show where the signal was detected least often. In this mode the DSP measurement frame rate is displayed in the FPS indicator on the Bandwidth soft key. When the Color Histogram trace mode is selected, the Hist % soft Key circled on the right side of Figure 5.4.8 is enabled which allows the user to adjust the mapping of multiple measurement point occurrences to the colors. When this parameter is set to 100 % most all displayed points are blue. When the parameter is set to 1% all the display points are red. The default value for this parameter is 45%. Figure 5.4.8 Color Histogram Display 5.4.3.4 Window Type Soft Key The Window Type parameter determines the type of filter that is used by the DSP prior to making its measurements. When the Window Type soft key is pressed, the Select Window Function menu shown in Figure 5.4.9 is displayed. The user can select a window function by pressing the desired window function followed by the OK button in the lower left corner. The default window function is Kaiser. Note refer to the Manual Attenuator Adjustment section of the manual if Uniform or Blackman window functions are selected. 5.4.3.5 Overlay Soft Key The Overlay soft key located below the circled soft key on the right side of Figure 5.4.8 is used to display a previously stored measurement trace on top of the currently displayed measurement trace. Before using the Overlay soft key a previously stored trace must be recalled. Refer to the Saving and Recalling Measurement Results section of the manual for more information on storing and recalling display traces. Once a stored trace is recalled, pressing the Overlay soft key will cause the recalled trace to be displayed over the current measurement trace. In addition to the recalled trace, the file name, any user comments and the test parameters for the overlay are also displayed at the bottom of the screen. Figure 5.4.9 Select Window Function Menu Sage Instruments • UCTT User Manual Rev E 2/2013 Page 32 5.4.4 Spectrum Analyzer Marker Menu The Marker Menu is assessed by pressing the Marker soft key circled at the bottom of Figure 5.4.8. This menu is used to display and manipulate markers on the measurement screen. These markers can be used to make precise readings of frequency and level at user specified points on the displayed trace. Furthermore, differences in frequency and levels can be calculated between markers. Refer to the UCTT Marker Menus section of this manual for more information on the marker menus. 5.4.5 Manual Attenuator Adjustment In normal operations the UCTT employs an automatic attenuator to maximize the dynamic Figure 5.4.10 Bandwidth Menu Window Function Soft Key range of its measurement circuits. This automatic attenuator sets the optimal input level based on the input signal energy. In some measurement environments the user may find it useful to disable the automatic attenuator and manually control the attenuator settings. This section describes how to manually control the attenuator settings in the spectrum analyzer application. In the Bandwidth Menu, press the window type soft key circled in Figure 5.4.10 and select the Blackman or Uniform window function. This will set the UCTT in the manual attenuation mode. The internal attenuators are now controlled by the Ref Level soft key in the amplitude menu circled in Figure 5.4.11. The amount of attenuation applied is equal to the Ref Level plus 20dB. The valid range for Ref Level is +40dB to -20dB. This corresponds to 60dB to 0dB of attenuation. For example setting the Ref Level to -10dB results in 10dB of attenuation, while a Ref Level of +10dB results in 30dB of attenuation. Figure 5.4.11 Amplitude Menu Ref Level Soft Key Sage Instruments • UCTT User Manual Rev E 2/2013 Page 33 5.5 Power Meter Application The Power Meter application displays the spectrum analyzer trace along with the measured power. Measurements are performed by connecting the antenna or cable to be tested to the RF input of the UCTT, refer to the Connector Panel section of this manual for the location of the RF input connector. The Power Meter application is accessed by pressing the front panel Mode button, then pressing the Pwr Meter soft key circled in figure 5.5.1. The Power Meter screen shown in Figure 5.5.2 will be displayed. The total power measured in the selected frequency span is displayed in large type format in the bottom half of the screen. Power is displayed in both dBm and nWatts. 5.5.1 Power Meter Frequency Menu The Power Meter frequency menu is accessed by pressing the Frequency soft key in the lower left corner of the screen in Figure 5.5.2. The soft keys along the right side of the screen are used for entering the frequency menu parameters described in the following sections. Figure 5.5.1 Power Meter Selection 5.5.1.1 Power Meter Frequency Parameters Soft Keys There are three methods for setting up the Power Meter frequency parameters, specifying center frequency and span or by specifying the start and stop frequencies, or by specifying the Channel Plan and channel. The corresponding pairs of soft keys for each method are circled on the right side of Figure 5.5.2. In the first method for setting the frequency parameters the center frequency and frequency span values are entered using the Center Freq and Span soft keys. The UCTT will automatically set the start and stop frequencies based on the center frequency and span parameters. The other method for setting the frequency parameters is to enter the stop and start frequencies using the Start Freq and Stop Freq soft keys. In this case the UCTT will determine the center frequency and span based on the entered start and stop frequencies. The third method for setting the frequency parameters is to use the Channel Plan and Channel soft keys. In this case the center frequency and span are Figure 5.5.2 Power meter Frequency Menu automatically determined by the UCTT based on the channel plan and channel selected. Pressing the Channel Plan soft key will bring up the channel plan selection menu shown in Figure 5.5.3. This list contains the channel plan names and frequency ranges for each plan. Pressing the RF Standard or Frequency buttons circled in Figure 5.5.3 will sort the list based on channel plan name or by frequency range. Additionally at the bottom of the channel plan selection screen is a list of valid channels for the selected plan. To select a plan press the desired channel plan followed by the OK button at the bottom of Sage Instruments • UCTT User Manual Rev E 2/2013 Page 34 the menu. To leave the Channel Plan mode simply press one of the Center Freq, Span, Start or Stop frequency soft keys. 5.5.1.2 Freq Step Soft Key The Freq Step soft key is used to specify the frequency step for each detent in the selection wheel. In the automatic mode each detent is one hundredth of the span frequency. For example a 100 Mhz span would have frequency steps of 1 Mhz. The desired frequency step can be changed from the Auto mode by pressing the Freq Step soft key and entering a new value. When this is done the frequency step value will be displayed in the Freq Step soft key. 5.5.1.3 Run/Pause Soft Key The Run/Pause soft key at the bottom right corner of Figure 5.5.2 is used to start and stop the power meter measurements, this is useful for freezing the screen. The current run/pause state is indicated on the lower portion of the soft key. 5.5.2 Power Meter Amplitude Menu Figure 5.5.3 Channel Plan Selection Menu The Power Meter amplitude menu is pictured in Figure 5.5.4 and is selected by pressing the circled Amplitude menu soft key. The soft keys along the right edge of the screen are used to modify the amplitude parameters. 5.5.2.1 Setting the Reference Level The Ref Level soft key located in the upper right corner of Figure 5.5.4 is used to adjust the reference level of the display, this will have the effect of shifting the signal trace up or down on the screen but will not affect the power measurement. Once the key is pressed the user can enter a value, or touch the screen where the reference level should be set. The reference level is also used in the Audio Beep feature described in the bandwidth menu. The current Reference level is displayed on the Ref Level soft key as well as the Amplitude menu key. 5.5.2.2 Setting the Display Scale The Scale soft key located below the Ref Level key in Figure 5.5.4 is used to adjust the scale of the display in dB per division. The current scale value is displayed on the Scale soft key as well as the Amplitude menu key. Figure 5.5.4 Power Meter Amplitude Menu Sage Instruments • UCTT User Manual Rev E 2/2013 Page 35 5.5.2.3 Setting Offset Level The Ref Lvl Offset soft key is circled in Figure 5.5.5 is used to apply a fixed offset to the signal. This is useful when viewing high power signals where an attenuator is connected between the UCTT and the signal source. The applied offset value is displayed on the Ref Lvl Offset soft key as well as the Amplitude menu soft key. The reference level offset will affect the power measurement. 5.5.2.4 Controlling the Preamp The Preamp soft key located below circled key in Figure 5.5.5 is used to control the state of the internal preamplifier in the UCTT. The default setting for the preamplifier is off. The preamplifier Figure 5.5.5 Ref Level Offset Soft Key is useful for increasing the signal to noise ratio for low level signals less than -50 dB. The gain of the preamp will not affect the power measurement. Note that turning on the preamplifier when higher signal levels are present can cause instability and erroneous measurements to occur. 5.5.3 Power Meter Bandwidth Menu The Bandwidth menu pictured in Figure 5.5.6, allows setting the measurement averaging as well as the Audio Beep feature. The Bandwidth soft key circled in Figure 5.5.6 indicates some of the Bandwidth menu parameters as well as the measurement rate expressed in frames per second (FPS). 5.5.3.1 # Average Soft Key The # Avg will set the number of traces that will be averaged together to form the displayed trace. Averaging traces produces a more stable display, however averaging will make spurious signals less visible. Pressing the # Avg soft key will allow the user to enter a new value, pressing the soft key twice will turn off averaging. 5.5.3.2 Audio Beep Soft Key The audio beep feature provides an audible indication of received power level. There are two modes of operation, the variable cadence beep and the varying pitch tone. In the variable cadence beep mode when the signal power is low there is a slow or low duty cycle series of beeps that increase in duty cycle as the received power level increases. When the power level approaches Figure 5.5.6 Power Meter Bandwidth Menu the maximum power threshold, the interval between beeps decreases until it becomes a constant tone. In the variable pitch mode, when the signal power is low Sage Instruments • UCTT User Manual Rev E 2/2013 Page 36 there is a constant low pitch tone that increases in frequency as the received power increases. The user selects the variable cadence beep mode by setting an even value for the Average soft key. The variable pitch beep is selected by setting an odd value for the Average soft key. The Audio Beep soft key and the Ref Level soft key in the Amplitude menu are used to control the sensitivity of the Audio Beep feature. The Ref Level soft key circled in Figure 5.5.5 is used to set the reference level for the audio beep feature. It should be set to the maximum power level that will be measured. The Audio Beep soft key located in the lower right corner of Figure 5.5.6 is used to set the range of the audio beep feature. The range value is subtracted from the reference level to give the minimum power level that the audio beep feature will respond to. The Audio Beep soft key is also used to enable or disable the audio beeps. Figure 5.5.7 Power Meter Marker Menu 5.5.4 Marker Menu The Power Meter Marker Menu pictured in Figure 5.5.7 is used to display and manipulate markers on the measurement screen. These markers can be used to make precise readings of frequency and level at user specified points on the displayed trace. Furthermore, differences in frequency and levels can be calculated between markers. This menu is accessed by pressing the circled Marker soft key in Figure 5.5.7. For more information on the Marker Menu refer to the Marker Menu section of this manual. Sage Instruments • UCTT User Manual Rev E 2/2013 Page 37 5.6 Return Loss Application The return loss measurements are performed by connecting the antenna cable to the RF output of the UCTT, refer to the Connector Panel section of this manual for the location of the RF output connector. The Return Loss application is accessed by pressing the front panel Mode button, then pressing the RL soft key circled in figure 5.6.1. 5.6.1 Return Loss Setup Menu The Return Loss Setup menu is pictured in Figure 5.6.2. The menu can be accessed by pressing the highlighted soft key in the lower left corner of the menu. 5.6.1.1 Open, Short, Load Calibration Soft Key The Calibration soft key is located in the bottom right corner of Figure 5.6.2. In order to perform accurate antenna and cable measurements, the RF output and any additional cables and connectors that are used to connect the UCTT to the antenna or cable system under test must be calibrated using open, short and load standards. Refer to the Open, Short, Load Calibration Procedure section of this manual for more information. Figure 5.6.1 Return Loss Selection 5.6.1.2 # Avg Soft Key The # Avg soft key located in the upper right corner of Figure 5.6.2 is used to determine how many measurements will be averaged together to make the return loss measurement. The default value is to turn off averaging. Pressing the # Avg soft key will allow the user to enter a new value, pressing the soft key twice will turn off averaging. 5.6.1.3 Overlay Soft Key The Overlay soft key located above the circled soft key in Figure 5.6.2 is used to display a previously stored measurement trace on top of the currently displayed measurement trace. Before using the Overlay soft key a previously stored trace must be recalled. Refer to the Saving and Recalling Measurement Results section of the manual for more information on storing and recalling display traces. Once a stored trace is recalled, pressing the Overlay soft key will cause the recalled trace to be displayed over the current measurement trace. In addition to the recalled trace, the file name, any user comments and the test parameters for the overlay are also displayed at the bottom of the screen. Figure 5.6.2 Return Loss Setup Menu 5.6.1.4 Frequency Band Configuration The Band soft key circled in Figure 5.6.2 is used to specify the frequency band used for the return loss test. Pressing the Band soft key will bring up the Change RF Band Menu shown in Figure 5.6.3. The user can press the desired band followed by Sage Instruments • UCTT User Manual Rev E 2/2013 Page 38 Figure 5.6.3 Change RF Band Menu the OK button to complete the selection. The first four bands have fixed start and stop frequencies, while the Start/Stop band can have user defined start and stop frequencies. If the Start/Stop band is selected than the Min Freq and Max Freq soft keys located below the circled Band soft key in Figure 5.6.2 can be used to specify the start and stop frequencies of the band. The valid range for the user defined band can be anywhere in the frequency bands of 698MHz - 1000MHz or 1600MHz - 2700MHz. 5.6.1.5 Run Mode Soft Key Pressing the Run Mode soft key located below the Max Freq soft key will toggle the test mode between continuous or One Shot. This soft key also appears in the Results menu. 5.6.1.6 Run/Pause Soft Key Figure 5.6.4 Return Loss Results Menu The Run/Pause soft key located below the Run Mode Soft key is used to start or pause the test. In the continuous run mode the run/pause soft key will allow the test to run continuously until the user pauses it by pressing the Run/Pause soft key. In the Single Shot run mode the test will start then pause when it has ran once. The test can be restarted by pressing the Run/Pause soft key. This soft key also appears in the Results menu. 5.6.2 Return Loss Results Menu The Return Loss Results menu is pictured in Figure 5.6.4 and is accessed by pressing the circled Results soft key. The Results soft key also displays the average return loss measurement for the test. 5.6.2.1 Pass/Fail Limits The limit line soft key located in the upper right corner of Figure 5.6.4 is used to set or disable the Pass/Fail limit for the return loss test. Pressing the Limit Line soft key will allow the user to modify the limit line value, or turn off the Pass/ Fail limit. The user can also set the limit line by touching the screen where the limit line should be located. The Limit Line soft key will indicate the limit value selected by the user. When the test is completed, the display will show Pass or Fail the top of the screen if the Limit Line is enabled. Figure 5.6.5 Return Loss Marker Menu at 5.6.3 Return Loss Marker Menu The Marker menu is pictured in Figure 5.6.5. It is accessed by pressing the circled Marker soft key. This menu allows up to six markers to be defined to make precise measurements anywhere on the displayed trace. Additionally, the Marker Math soft key allows the user to determine level and frequency measurements between markers. For more details on using the marker menu refer to the Marker Menu description in this manual. Note that the return loss application does not have a center frequency parameter, so the CF to Marker soft key is not present in this menu. Sage Instruments • UCTT User Manual Rev E 2/2013 Page 39 5.7 Distance to Fault Application Distance to Fault measurements are performed by connecting the cable to be tested to the RF output of the UCTT, refer to the Connector Panel section of this manual for the location of the RF output connector. The Distance to Fault application is accessed by pressing the front panel Mode button, then pressing the DTF soft key circled in figure 5.7.1. 5.7.1 Distance to Fault Setup Menu The Distance to Fault Setup menu is pictured in Figure 5.7.2. The menu can be accessed by pressing the highlighted soft key in the lower left corner of the screen. 5.7.1.1 Distance to Fault Calibration The Calibrate soft key is located in the bottom right corner of the Setup menu pictured in 5.7.2. This soft key is also present in the View and Faults menus. Refer to the Open, Short, Load Calibration Procedure section of this manual for more information on the calibration procedure. Figure 5.7.1 Distance to Fault Selection 5.7.1.2 Averaging Soft Key The # Avg soft key located in the upper right corner of Figure 5.7.2 is used to determine how many measurements will be averaged together to make the Distance to Fault measurement. The default value is to turn off averaging. Pressing the # Avg soft key will allow the user to enter a new value, pressing the soft key twice will turn off averaging. 5.7.1.3 Cable Type Soft Key The Cable Type soft key circled in Figure 5.7.2 is Figure 5.7.2 Distance to Fault Setup Menu used to select the type of cable that is being tested. Pressing this soft key will bring up the Cable Type Selection Menu pictured in Figure 5.7.3. This is a list of different types of cables along with their unique propagation and attenuation characteristics. The Circled Manufacturer and Cable Type buttons can be used to sort the list by cable manufacturer name or by cable type. The user can select a cable by pressing on the desired cable and pressing the OK button. In addition to the predefined cable types, There are four user definable cable types labeled User1 to User4. These can be used to define custom cable types that are not in the predefined list. To create a new user defined cable type, press one of the User cable types and press the Edit button at the botton of the menu. The User Defined Cable Type Menu pictured in Figure 5.7.4 will appear, and can be used to enter the cable type, propagation and attenuation characteristics of the cable. Entering the appropriate values and pressing the OK button at the bottom of the menu will create the user defined Figure 5.7.3 Cable Type Selection Menu cable type. Sage Instruments • UCTT User Manual Rev E 2/2013 Page 40 5.7.1.4 Frequency Band Configuration The Band soft Key located below the circled key in Figure 5.7.2 is used to specify the frequency band used for the Distance to Fault test. Pressing the Band soft key will bring up the Change RF Band Menu shown in Figure 5.7.5. The user can press the desired band followed by the OK button to complete the selection. The first six bands have fixed start and stop frequencies, while the Start/Stop band can have user defined start and stop frequencies. If the Start/Stop band is selected than the Min Freq and Max Freq soft keys located below the Band soft key in Figure 5.7.2 can be used to specify the start and stop frequencies of the band. The valid range for the user defined band can be anywhere in the frequency bands of 698MHz - 1000MHz or 1600MHz - 2700MHz. Note that for maximum distance to fault accuracy, the Min Max frequency values should be as far apart as possible. Figure 5.7.4 User Defined Cable Type Menu 5.7.1.5 Run Mode Soft Key Pressing the Run Mode soft key located below the Max Freq soft key will toggle the test mode between Continuous or One Shot. This soft key also appears in the View and Faults menus. 5.7.1.6 Run/Pause Soft Key The Run/Pause soft key located below the Run Mode Soft key is used to start or pause the test. In the continuous run mode the run/pause soft key will allow the test to run continuously until the user pauses it by pressing the Run/Pause soft key. In the Single Shot run mode the test will run then pause when it has ran once. The test can be restarted by pressing the Run/Pause soft key. This soft key also appears in the View and Faults menus. Figure 5.7.5 Change RF Band Menu 5.7.2 Distance to Fault View Menu The Distance to Fault View menu is pictured in Figure 5.7.6. The circled View soft key in the bottom of the screen is used to access the menu. The View soft key also displays the Minimum and Maximum distance parameters for the test. 5.7.2.1 Min Max Distance and Zoom Soft Keys The Min Dist and Max Dist soft keys circled in the right side Figure 5.7.6 are used to set the minimum and maximum distances that are displayed in the measurement window. These values only control what is presented on the display and do not change the actual test. Pressing the Zoom Out soft key located below the Max Dist key will cause the entire measurement range to be displayed and will change the Min and Max distance soft key values. Figure 5.7.6 Distance to Fault View Menu Sage Instruments • UCTT User Manual Rev E 2/2013 Page 41 5.7.2.2 Overlay Soft Key The Overlay soft key is used to display a previously stored measurement trace on top of the currently displayed measurement trace. Before using the Overlay soft key a previously stored trace must be recalled. Refer to the saving and recalling measurement results section of the manual for more information on storing and recalling display traces. Once a stored trace is recalled, pressing the Overlay soft key will cause the recalled trace to be displayed over the current measurement trace. In addition to the recalled trace, the file name, any user comments and the test parameters for the overlay are also displayed at the bottom of the screen. 5.7.3 Distance to Fault Faults Menu Figure 5.7.7 Distance to Fault Faults Menu The Distance to Fault Faults menu is pictured in Figure 5.7.7. The circled Faults soft key in the bottom of the screen is used to access the menu. The Faults soft key also displays up to four detected faults along with the level and distance for each fault. 5.7.3.1 Fault Limit Configuration The limit line soft key located in the upper right corner of Figure 5.7.7 is used to set or disable the threshold for fault detection. Additionally if enabled the limit line will cause the words Pass or Fail to appear at the top of the screen once the test has completed. Pressing the Limit Line soft key will allow the user to modify the limit line value, or turn off the fault detection and Pass/ Fail indicator. The Limit Line soft key will indicate the limit selected by the user. Any measurements greater than the limit line value are declared faults and will appear in the Faults soft key circled in Figure 5.7.7. 5.7.4 Distance to Fault Marker Menu The Marker menu is pictured in Figure 5.7.8. It is accessed by pressing the circled Marker soft key. This menu allows up to six markers Figure 5.7.8 Distance to Fault Marker Menu to be defined to make precise measurements anywhere on the displayed trace. Additionally, the Marker Math soft key allows the user to determine level and distance measurements between markers. For more details on using the marker menu refer to the Marker Menu description in this manual. Note that the distance to fault application does not have a center frequency parameter, so the CF to Marker soft key is not present in this menu. Sage Instruments • UCTT User Manual Rev E 2/2013 Page 42 5.8 VSWR Application The VSWR measurements are performed by connecting the cable to be tested to the RF output of the UCTT, refer to the Connector Panel section of this manual for the location of the RF output connector. The VSWR application is accessed by pressing the front panel Mode button, then pressing the VSWR soft key circled in figure 5.8.1. 5.8.1 VSWR Setup Menu The VSWR Setup menu is pictured in Figure 5.8.2. The menu can be accessed by pressing the highlighted soft key in the lower left corner of Figure 5.8.2. 5.8.1.1 VSWR Calibration The Calibrate soft key is located in the bottom right corner of the Setup menu pictured in 5.8.2. This soft key is also present in the Results menu. Refer to the Open, Short, Load Calibration Soft Key section of this manual for more information on the calibration procedure. Figure 5.8.1 VSWR Application Selection 5.8.1.2 Averaging Soft Key The # Avg soft key located in the upper right corner of Figure 5.8.2 is used to determine how many measurements will be averaged together to make the VSWR measurement. The default value is to turn off averaging. Pressing the # Avg soft key will allow the user to enter a new value, pressing the soft key twice will turn off averaging. 5.8.1.3 Overlay Soft Key The Overlay soft key is used to display a previously stored measurement trace on top of the currently displayed measurement trace. Before using the Overlay soft key a previously stored Figure 5.8.2 VSWR Setup Menu trace must be recalled. Refer to the saving and recalling measurement results section of the manual for more information on storing and recalling display traces. Once a stored trace is recalled, pressing the Overlay soft key circled in Figure 5.8.2 will cause the recalled trace to be displayed over the current measurement trace. In addition to the recalled trace, the file name, any user comments and the test parameters for the overlay are also displayed at the bottom of the screen. 5.8.1.4 Frequency Band Configuration The Band soft Key located below the circled key in Figure 5.8.2 is used to specify the frequency band used for the VSWR test. Figure 5.8.3 VSWR Band Configuration Pressing the Band soft key will bring up the Change RF Band Menu shown in Figure 5.8.3. The user can press the desired band followed by the OK button to complete the selection. The first four bands have fixed start and stop frequencies, while the Start/ Stop band can have user defined start and stop frequencies. Sage Instruments • UCTT User Manual Rev E 2/2013 Page 43 If the Start/Stop band is selected than the Min Freq and Max Freq soft keys located below the Band soft key in Figure 5.8.2 can be used to specify the start and stop frequencies of the band. The valid range for the user defined band can be anywhere in the frequency bands of 698MHz - 1000MHz or 1600MHz - 2700MHz. 5.8.1.5 Run Mode Soft Key Pressing the Run Mode soft key located below the Max Freq soft key will toggle the test mode between Continuous or One Shot. This soft key also appears in the Results menu pictured in Figure 5.8.4.. 5.8.1.6 Run/Pause Soft Key The Run/Pause soft key located below the Run Mode Soft key is used to start or pause the test. In the continuous run mode the run/pause soft key will allow the test to run continuously until the user pauses it by pressing the Run/Pause soft key. In the Single Shot run mode the test will run then pause when it has ran once. The test can be restarted by pressing the Run/Pause soft key. This soft key also appears in the Results menu pictured in Figure 5.8.4. Figure 5.8.4 VSWR Results Menu 5.8.2 VSWR Results Menu The VSWR Results menu is pictured in Figure 5.8.4. The circled Results soft key in the bottom of the screen is used to access the menu. The Results soft key also displays the VSWR measurement. 5.8.2.1 Limit Line Configuration The limit line soft key located in the upper right corner of Figure 5.8.4 is used to set or disable the VSWR Pass/Fail measurement limit. Additionally if enabled the limit line will cause the words Pass or Fail to appear at the top of the screen once the test has completed. Pressing the Limit Line soft key will allow the user to modify the limit line value, or turn off the Pass/Fail indicator. The user can also set the limit line by touching the screen where the limit should be set. The Limit Line soft key will indicate the limit selected by the user. . 5.8.3 VSWR Marker Menu The Marker menu is accessed by pressing the Marker soft key located to the right of the circled soft key in Figure 5.8.4. This menu allows up to six markers to be defined to make precise measurements anywhere on the displayed trace. Additionally, the Marker Math soft key allows the user to determine VSWR measurements between markers. For more details on using the marker menu refer to the Marker Menu description in this manual. Note that the VSWR application does not have a center frequency parameter, so the CF to Marker soft key is not present in this menu. Sage Instruments • UCTT User Manual Rev E 2/2013 Page 44 5.9 One Port Insertion Loss Application The One Port Insertion Loss measurements are performed by connecting the cable or circuit to be tested to the RF output of the UCTT, refer to the Connector Panel section of this manual for the location of the RF output connector. The One Port Insertion Loss application is accessed by pressing the front panel Mode button, then pressing the 1-Port Loss soft key circled in figure 5.9.1. 5.9.1 One Port Insertion Loss Setup Menu The One Port Insertion Loss Setup menu is pictured in Figure 5.9.2. The menu can be accessed by pressing the highlighted soft key in the lower left corner of the menu. 5.9.1.1 Open, Short, Load Calibration Soft Key Figure 5.9.1 One Port Insertion Loss Selection The Calibration soft key is located in the bottom right corner of Figure 5.9.2. In order to perform accurate antenna and cable measurements, the RF output and any additional cables and connectors that are used to connect the UCTT to the antenna or cable system under test must be calibrated using open, short and load standards. Refer to the Open, Short, Load Calibration Procedure section of this manual for more information. 5.9.1.2 # Avg Soft Key The # Avg soft key located in the upper right corner of Figure 5.9.2 is used to determine how many measurements will be averaged together to make the one port insertion loss measurement. The default value is to turn off averaging. Pressing the # Avg soft key will allow the user to enter a new value, pressing the soft key twice will turn off averaging. 5.9.1.3 Overlay Soft Key The Overlay soft key circled in Figure 5.9.2 is used to display a previously stored measurement trace on top of the currently displayed measurement trace. Before using the Overlay soft key a previously stored trace must be recalled. Refer to the Saving and Recalling Measurement Results section of the manual for more information on storing and recalling display traces. Once a Figure 5.9.2 One Port Insertion Loss Setup Menu stored trace is recalled, pressing the Overlay soft key will cause the recalled trace to be displayed over the current measurement trace. In addition to the recalled trace, the file name, any user comments and the test parameters for the overlay are also displayed at the bottom of the screen. 5.9.1.4 Frequency Band Configuration The Band soft key located below the circled Overlay key in Figure 5.9.2 is used to specify the frequency band used for the one port insertion loss test. Pressing the Band soft key will bring up the Change RF Band Sage Instruments • UCTT User Manual Rev E 2/2013 Page 45 Menu shown in Figure 5.9.3. The user can press the desired band followed by the OK button to complete the selection. The first four bands have fixed start and stop frequencies, while the Start/Stop band can have user defined start and stop frequencies. If the Start/Stop band is selected than the Min Freq and Max Freq soft keys located below the Band soft key in Figure 5.9.2 can be used to specify the start and stop frequencies of the band. The valid range for the user defined band can be anywhere in the frequency bands of 698MHz - 1000MHz or 1600MHz - 2700MHz. 5.9.1.5 Run Mode Soft Key Pressing the Run Mode soft key located below the Max Freq soft key will toggle the test mode between continuous or One Shot. This soft key also appears in the Results menu. 5.9.1.6 Run/Pause Soft Key The Run/Pause soft key located below the Run Mode Soft key is used to start or pause the test. In the continuous run mode the run/pause soft key will allow the test to run continuously until the user pauses it by pressing the Run/Pause soft key. In the Single Shot run mode the test will start then pause once it has ran once. The test can be restarted by pressing the Run/ Pause soft key. This soft key also appears in the Results menu. Figure 5.9.3 RF Band Selection Menu 5.9.2 One Port Insertion Loss Results Menu The One Port Insertion Loss Results menu is pictured in Figure 5.9.4 and is accessed by pressing the circled Results soft key. The Results soft key also indicates the average One Port Insertion Loss measurement for the test. 5.9.2.1 Pass/Fail Limits The limit line soft key located in the upper right corner of Figure 5.9.4 is used to set or disable the Pass/Fail limit for the One Port Insertion Loss test. Pressing the Limit Line soft key will allow the user to modify the limit line value, or turn off Figure 5.9.4 One Port Insertion Loss Results Menu the Pass/Fail limit. The user can also set the limit line by touching the screen where the limit line should be located. The Limit Line soft key will indicate the limit value selected by the user. When the test is completed, the display will show Pass or Fail at the top of the screen if the Limit Line is enabled. Sage Instruments • UCTT User Manual Rev E 2/2013 Page 46 5.9.3 One Port Loss Marker Menu The Marker menu is pictured in Figure 5.9.5. It is accessed by pressing the circled Marker soft key. This menu allows up to six markers to be defined to make precise measurements anywhere on the displayed trace. Additionally, the Marker Math soft key allows the user to determine level and distance measurements between markers. For more details on using the marker menu refer to the Marker Menu description in this manual. Note that the One Port Loss application does not have a center frequency parameter, so the CF to Marker soft key is not present in this menu. Figure 5.9.5 One Port Insertion Loss Marker Menu 5.10 Two Port VNA Application The Two Port VNA (Vector Network Analyzer) measurements are performed by connecting the cable or circuit to be tested to the RF Input and output connectors of the UCTT, refer to the Connector Panel section of this manual for the location of the RF input and output connectors. The Two Port VNA application is accessed by pressing the front panel Mode button, then pressing the 2-Port VNA soft key circled in figure 5.10.1. 5.10.1 Two Port VNA Setup Menu The Two Port VNA Setup menu is pictured in Figure 5.10.2. The menu can be accessed by pressing the highlighted soft key in the lower left corner of the menu. Figure 5.10.1 Two Port VNA Selection 5.10.1.1 Calibration Soft Key In order to perform accurate measurements, the RF Input output and any additional cables and connectors that are used to connect the UCTT to the antenna or cable system under test must be calibrated together. The Calibration soft key is located in the bottom right corner of Figure 5.10.2. Press the Calibrate soft key, the screen will display the message Cross-Connect RF In/Out. Connect the RF in to the RF out and press the Next soft key located in the upper right corner. The screen will briefly display ‘Wait -- Calibrating...’ followed by ‘Calibrated (mm/dd/yyyy)’. This completes the calibration procedure. Note that temperature extremes can affect the calibration accuracy, so it is recommended to perform the calibration procedure if the environmental tempera- Figure 5.10.2 Two Port VNA Setup Sage Instruments • UCTT User Manual Rev E 2/2013 Page 47 ture changes by more than 20°C. 5.10.1.2 # Avg Soft Key The # Avg soft key located in the top of Figure 5.10.3 is used to determine how many measurements will be averaged together to make the Two Port VNA measurement. The default value is to turn off averaging. Pressing the # Avg soft key will allow the user to enter a new value, pressing the soft key twice will turn off averaging. 5.10.1.3 Overlay Soft Key The Overlay soft key circled in Figure 5.10.3 is used to display a previously stored measurement trace on top of the currently displayed measurement trace. Before using the Overlay soft key a previously stored trace must be recalled. Refer to the Saving and Recalling Measurement Results section of the manual for more information on storing and recalling display traces. Once a stored trace is recalled, pressing the Overlay soft key will cause the recalled trace to be displayed over the current measurement trace. In addition to the recalled trace, the file name, any user comments and the test parameters for the overlay are also displayed at the bottom of the screen. 5.10.1.4 Frequency Band Configuration The Band soft key located below the circled Overlay key in Figure 5.10.3 is used to specify the frequency band used for the Two Port VNA test. Pressing the Band soft key will bring up the Change RF Band Menu shown in Figure 5.10.4. The user can press the desired band followed by the OK button to complete the selection. The first four bands have fixed start and stop frequencies, while the Start/Stop band can have user defined start and stop frequencies. If the Start/Stop band is selected than the Min Freq and Max Freq soft keys located below the Band soft key in Figure 5.10.3 can be used to specify the start and stop frequencies of the band. The valid range for the user defined band can be anywhere in the frequency bands of 698MHz - 1000MHz or 1600MHz - 2700MHz. Figure 5.10.3 Two Port VNA Setup Soft Keys 5.10.1.5 Run Mode Soft Key Pressing the Run Mode soft key located below the Max Freq soft key in Figure 5.10.3 will toggle the test mode between continuous or One Shot. This soft key also appears in the Results menu. 5.10.1.6 Run/Pause Soft Key The Run/Pause soft key located below the Run Mode Soft key in Figure 5.10.3 is used to start or pause the test. In the continuous run mode the run/pause soft key will allow the test to run continuously until the user pauses it by pressing the Run/Pause soft key. In the Single Shot run mode the test will start then pause when it has ran once. The test can be restarted by pressing the Run/Pause soft key. This soft key also appears in the Results menu. Sage Instruments • UCTT User Manual Rev E 2/2013 Page 48 Figure 5.10.4 RF Band Selection Menu 5.10.2 Two Port VNA Results Menu The Two Port VNA Results menu is pictured in Figure 5.10.5 and is accessed by pressing the circled Results soft key. The Results soft key also indicates the average 2 Port VNA measurement for the test. 5.10.2.1 Pass/Fail Limits The limit line soft key located in the upper right corner of Figure 5.10.5 is used to set or disable the Pass/Fail limit for the 2 Port VNA test. Pressing the Limit Line soft key will allow the user to modify the limit line value, or turn off the Pass/Fail limit. The user can also set the limit line by touching the screen where the limit line should be located. The Limit Line soft key will indicate the limit value selected by the user. When the test is completed, the display will show Pass or Fail at the top of the screen if the Limit Line is enabled. Figure 5.10.5 Two Port VNA Results Menu 5.10.3 Two Port VNA Marker Menu The Marker menu is pictured in Figure 5.10.6. It is accessed by pressing the circled Marker soft key. This menu allows up to six markers to be defined to make precise measurements anywhere on the displayed trace. Additionally, the Marker Math soft key allows the user to determine level and distance measurements between markers. For more details on using the marker menu refer to the Marker Menu description in this manual. Note that the 2 Port VNA application does not have a center frequency parameter, so the CF to Marker soft key is not present in this menu. Figure 5.10.6 Two Port VNA Marker Menu Sage Instruments • UCTT User Manual Rev E 2/2013 Page 49 5.11 Signal Locator Application The signal locator application is used to locate interference and other signal sources. The user connects a directional antenna (Yagi) to the RF Input of the UCTT. The direction of the signal source is determined by moving the antenna while listening to the audio feedback (Audible Beep) or observing the displayed power reading. The signal direction can be plotted on map displayed on the UCTT. Users should go to three weigh points and make level and direction measurements of the signal. For best results, the weigh points should be selected such that they make a triangle around the suspected single source location. Accurate and stable level measurements are key to success. Users must take into account false measurements caused by reflections or signals tunneling through glass buildings. The Signal Locator Application is selected by pressing the front panel Mode button, then pressing the circled Sig Loc soft key circled in Figure 5.11.1. Figure 5.11.1 Signal Locator Selection 5.11.1 Signal Locator Frequency Menu The Signal Locator Frequency menu is pictured in Figure 5.11.2. The menu can be accessed by pressing the highlighted Frequency soft key in the lower left corner of the menu. 5.11.1.1 Signal Locator Frequency Parameters Soft Keys There are three methods for setting up the Signal Locator frequency parameters, specifying center frequency and span or by specifying the start and stop frequencies, or by specifying the Channel Plan, Channel and Channel Bandwidth. The corresponding sets of soft keys for each method are circled on the right side of Figure 5.11.2. In the first method for setting the frequency parameters the center frequency and frequency span values are entered using the Center Freq and Span soft keys. The UCTT will automatically set the start and stop frequencies based on the cenFigure 5.11.2 Signal Locator Frequency Menu ter frequency and span parameters. The other method for setting the frequency parameters is to enter the stop and start frequencies using the Start Freq and Stop Freq soft keys. In this case the UCTT will determine the center frequency and span based on the entered start and stop frequencies. The third method for setting the frequency parameters is to use the Channel Plan, Channel and Ch BW soft keys. In this case the center frequency and span are automatically determined by the UCTT based on the channel plan and channel selected. Pressing the Channel Plan soft key will bring up the channel plan selection menu shown in Figure 5.11.3. This list contains the channel plan names and frequency ranges for each plan. Pressing the RF Standard or Frequency buttons circled in Figure 5.11.3 will sort the list based on channel plan name or by frequency range. Additionally at the bottom of the channel plan selection screen is a list of valid channels for the selected plan. To select a plan press the desired channel plan followed by the OK button at the bottom of the menu. To Sage Instruments • UCTT User Manual Rev E 2/2013 Page 50 leave the Channel Plan mode simply press one of the Center Freq, Span, Start or Stop frequency soft keys. 5.11.1.2 Run/Pause Soft Key The Run/Pause soft key located in the lower right corner of Figure 5.11.2 is used to start and stop the measurements, this is useful for freezing the screen. The current run/pause state is indicated on the lower portion of the soft key. 5.11.2 Signal Locator Amplitude Menu The Signal Locator amplitude menu is pictured in Figure 5.11.4 and is selected by pressing the circled Amplitude menu soft key. The soft keys along the right edge of the screen are used to modify the amplitude parameters. 5.11.2.1 Setting the Reference Level The Ref Level soft key located in the upper right corner of Figure 5.11.4 is used to adjust the reference level of the display, this will have the effect of shifting the signal trace up or down on the screen but will not affect the Figure 5.11.3 Channel Plan Selection Menu measurement levels. Once the key is pressed the user can enter a value, or touch the screen where the reference level should be set. The reference level is also used in the Audio Beep feature described in the bandwidth menu. The current Reference level is displayed on the Ref Level soft key as well as the Amplitude menu key. 5.11.2.2 Setting the Display Scale The Scale soft key located below the Ref Level key in Figure 5.11.4 is used to adjust the scale of the display in dB per division. The current scale value is displayed on the Scale soft key as well as the Amplitude menu key. 5.11.2.3 Setting Offset Level The Ref Lvl Offset soft key located below the Scale key in Figure 5.11.4 is used to apply a fixed offset to the signal. This is useful when viewing high power signals where an attenuator is connected between the UCTT and the signal source. The applied offset value is displayed on the Ref Lvl Offset soft key as well as the Amplitude menu soft key. The reference level offset will affect the power measurement. Figure 5.11.4 Signal Locator Amplitude Menu 5.11.2.4 Controlling the Preamp The Preamp soft key located on the bottom right in Figure 5.11.4 is used to control the state of the internal preamplifier in the UCTT. The default setting for the preamplifier is off. The preamplifier is useful for increasing the signal to noise ratio for low level signals Sage Instruments • UCTT User Manual Rev E 2/2013 Page 51 less than -50 dB. The gain of the preamp will not affect the power measurement. Note that turning on the preamplifier when higher signal levels are present can cause instability and erroneous measurements to occur. 5.11.3 Signal Locator Bandwidth Menu The Bandwidth menu pictured in Figure 5.11.5, allows setting the measurement averaging, the Overlay display and the Audio Beep feature. The Bandwidth soft key circled in the bottom of Figure 5.11.5 is used to select the Bandwidth menu and also indicates some of the Bandwidth menu parameters. 5.11.3.1 # Average Soft Key Figure 5.11.5 Signal Locator Bandwidth Menu The # Avg located in the upper right of Figure 5.11.5 will set the number of traces that will be averaged together to form the displayed trace. Averaging traces produces a more stable display, however averaging will make spurious signals less visible. Pressing the # Avg soft key will allow the user to enter a new value, pressing the soft key twice will turn off averaging. 5.11.3.2 Overlay Soft Key The Overlay soft key circled in Figure 5.11.5 is used to display a previously stored measurement trace on top of the currently displayed measurement trace. Before using the Overlay soft key a previously stored trace must be recalled. Refer to the Saving and Recalling Measurement Results section of the manual for more information on storing and recalling display traces. Once a stored trace is recalled, pressing the Overlay soft key will cause the recalled trace to be displayed over the current measurement trace. In addition to the recalled trace, the file name, any user comments and the test parameters for the overlay are also displayed at the bottom of the screen. 5.11.3.3 Audio Beep Soft Key The audio beep feature provides an audible indication of received power level. There are two modes of operation, the variable cadence beep and the varying pitch tone. In the variable cadence beep mode when the signal power is low there is a slow or low duty cycle series of beeps that increase in duty cycle as the received power level increases. When the power level approaches the maximum power threshold, the interval between beeps decreases until it becomes a constant tone. In the variable pitch mode, when the signal power is low there is a constant low pitch tone that increases in frequency as the received power increases. The user selects the variable cadence beep mode by setting an even value for the Average soft key. The variable pitch beep is selected by setting an odd value for the Average soft key. The Audio Beep soft key and the Ref Level soft key in the Amplitude menu are used to control the sensitivity of the Audio Beep feature. The Ref Level soft key located in the upper right corner of Figure 5.11.6 is used to set the reference level for the audio beep feature. It should be set to the maximum power level that will be measured. The Audio Beep soft key located in the lower right corner of Figure 5.11.5 is used to set the range of the audio beep feature. The range value is subtracted from the reference level to give the minimum power level that the audio beep feature will respond to. The Audio Sage Instruments • UCTT User Manual Rev E 2/2013 Page 52 Beep soft key is also used to enable or disable the audio beeps. 5.11.4 Signal Locator Marker Menu The Marker menu is accessed by pressing the circled Marker soft key at the bottom of Figure 5.11.6. This menu allows up to six markers to be defined to make precise measurements anywhere on the displayed trace. Additionally, the Marker Math soft key allows the user to determine level and distance measurements between markers. For more details on using the marker menu refer to the Marker Menu description in this manual. Figure 5.11.6 Signal Locator Ref Level Soft Key 5.11.5 Signal Locator Map Menu The map menu pictured in Figure 5.11.7 allows the user to view the current location and plot triangulation lines to help determine the signal location. When the GPS indicator at the top of the screen is green, the current location will be indicated by the green cross hairs circled in Figure 5.11.7. If GPS cannot determine the present location there will be a red question mark in the center of the map. For more information on the GPS setup and configuration refer to the GPS Configuration section of this manual. A map of the area of interest must be loaded into the UCTT prior to using the Signal Locator. The user can create map files for the UCTT using the PC based UCCTMapper application and Google Earth, refer to the UCTT Mapper Utility section of this manual for more information. The map displays at a fixed resolution so several map views may be useful to provide an overview as well as detailed views of the area of interest. The signal Locator Map Menu pictured in Figure 5.11.7 can be accessed by pressing the circled map button at the top of Figure 5.11.6. This map button Figure 5.11.7 Signal Locator Map Menu is available in all the Signal Locator menus. Additionally there is a corresponding RF button in the upper corner of the Map Menu in Figure 5.11.7 that will switch the display mode to RF power and spectrum trace. 5.11.5.1 Import Map Key The Import Map soft key circled in Figure 5.11.7 is used to move map files from an external USB memory device into the UCTT. For more information about connecting a USB device to the UCTT refer to the Connector Panel section of this manual. Pressing the Sage Instruments • UCTT User Manual Rev E 2/2013 Page 53 Import Map soft key will bring up a list of map files stored on the USB device. The user can select files from the menu and they will be loaded into the UCTT. 5.11.5.2 Map File Selection Key The Map File soft key located in the upper right corner of Figure 5.11.9 is used to select a stored map to display. Pressing the Map File key will bring up the Load Map File Menu shown in Figure 5.11.8. The user can select a map from the list to be displayed on the Signal Locator screen. 5.11.5.3 Adding a Line to the Map Using the directional antenna and audio or visual feedback of the received signal strength, the user determines the signal direction. A line can be placed on the displayed map to represent the signal direction. Pressing the Add Line soft key circled in Figure 5.11.9 will allow the user to add a line to the map by touching anywhere on the screen. The line will originate from the current location, (green cross hairs) and extend through the point touched on the screen as shown in Figure 5.11.9. Additional lines are added by taking measurements at several locations. The intersection of the lines is the location of the signal source. The Save key can be used to save or recall maps with direction lines added. For more information on saving and recalling files for display refer to the section on Saving and Recalling Test Result Files in this manual. 5.11.5.4 Deleting Lines from the Map Figure 5.11.8 Map File Selection Menu Figure 5.11.9 Adding a Line To the Map The Del Line soft key located below the circled Add Line key is used to remove lines from the map. Pressing the Del Line soft key will bring up the Delete a Line menu pictured in Figure 5.11.10. An individual line or all lines can be deleted using this menu. Figure 5.11.10 Deleting a Line From the Map Sage Instruments • UCTT User Manual Rev E 2/2013 Page 54 5.12 Signal Coverage Application The Signal Coverage application is used to make signal level surveys at discrete points or along a driven route. The user can set up to 4 different thresholds for received signal level. The results are displayed graphically on a map with the received signal strength indicated by different colors. The signal coverage data can be exported to the Post Test Analysis Tool (PTAT) for further analysis. For more information refer to the PTAT section of the manual. The Signal Coverage Application is selected by pressing the front panel Mode button, then pressing the circled Sig Cov soft key circled in Figure 5.12.1. 5.12.1 Signal Coverage Frequency Figure 5.12.1 Signal Coverage Selection Menu The Signal Coverage Frequency menu is pictured in Figure 5.12.2. The menu can be accessed by pressing the highlighted Frequency soft key in the lower left corner of the menu. 5.12.1.1 Signal Coverage Frequency Parameters Soft Keys There are three methods for setting up the Signal Coverage frequency parameters, specifying center frequency and span or by specifying the start and stop frequencies, or by specifying the Channel Plan, Channel and Channel Bandwidth. The corresponding sets of soft keys for each method are circled on the right side of Figure 5.12.2. In the first method for setting the frequency parameters the center frequency and frequency span Figure 5.12.2 Signal Coverage Frequency Menu values are entered using the Center Freq and Span soft keys. The UCTT will automatically set the start and stop frequencies based on the center frequency and span parameters. The other method for setting the frequency parameters is to enter the stop and start frequencies using the Start Freq and Stop Freq soft keys. In this case the UCTT will determine the center frequency and span based on the entered start and stop frequencies. The third method for setting the frequency parameters is to use the Channel Plan, Channel and Ch BW soft keys. In this case the center frequency and span are automatically determined by the UCTT based on the channel plan and channel selected. Pressing the Channel Plan soft key will bring up the channel plan selection menu shown in Figure 5.12.3. This list contains the channel plan names and frequency ranges for each plan. Pressing the RF Standard or Frequency buttons circled in Figure 5.12.3 will sort the list based on channel plan name or by frequency range. Additionally at the bottom of the channel plan selection screen Figure 5.12.3 Channel Plan Selection Menu is a list of valid channels for the selected plan. To select a plan press the desired channel plan followed by the OK button at the bottom of the menu. To leave the Channel Plan mode Sage Instruments • UCTT User Manual Rev E 2/2013 Page 55 simply press one of the Center Freq, Span, Start or Stop frequency soft keys. 5.12.1.2 Run/Pause Soft Key The Run/Pause soft key located in the lower right corner of Figure 5.12.2 is used to start and stop the measurements, this is useful for freezing the screen. The current run/pause state is indicated on the lower portion of the soft key. 5.12.2 Signal Coverage Amplitude Menu The Signal Coverage amplitude menu is pictured in Figure 5.12.4 and is selected by pressing the circled Amplitude menu soft key. The soft keys along the right edge of the screen are used to modify the amplitude parameters. Figure 5.12.4 Signal Coverage Amplitude Menu 5.12.2.1 Setting the Reference Level The Ref Level soft key located in the upper right corner of Figure 5.12.4 is used to adjust the reference level of the display, this will have the effect of shifting the signal trace up or down on the screen but will not affect the measurement levels. Once the key is pressed the user can enter a value, or touch the screen where the reference level should be set. The reference level is also used in the Audio Beep feature described in the bandwidth menu. The current Reference level is displayed on the Ref Level soft key as well as the Amplitude menu key. 5.12.2.2 Setting the Display Scale The Scale soft key located below the Ref Level key in Figure 5.12.4 is used to adjust the scale of the display in dB per division. The current scale value is displayed on the Scale soft key as well as the Amplitude menu key. 5.12.2.3 Setting Offset Level The Ref Lvl Offset soft key located below the Scale key in Figure 5.12.4 is used to apply a fixed offset to the signal. This is useful when viewing high power signals where an attenuator is connected between the UCTT and the signal source. The applied offset value is displayed on the Ref Lvl Offset soft key as well as the Amplitude menu soft key. The reference level offset will affect the power measurement. 5.12.2.4 Controlling the Preamp The Preamp soft key located on the bottom right in Figure 5.12.4 is used to control the state of the internal preamplifier in the UCTT. The default setting for the preamplifier is off. The preamplifier is useful for increasing the signal to noise ratio for low level signals less than -50 dB. The gain of the preamp will not affect the power measurement. Note that turning on the preamplifier when higher Sage Instruments • UCTT User Manual Rev E 2/2013 Page 56 signal levels are present can cause instability and erroneous measurements to occur. 5.12.3 Signal Coverage Bandwidth Menu The Bandwidth menu pictured in Figure 5.12.5, allows setting the measurement averaging, the Overlay display and the Audio Beep feature. The Bandwidth soft key circled in the bottom of Figure 5.12.5 is used to select the Bandwidth menu and also indicates some of the Bandwidth menu parameters. 5.12.3.1 # Average Soft Key The # Avg located in the upper right of Figure 5.12.5 will set the number of traces that will be averaged together to form the displayed trace. Figure 5.12.5 Signal Coverage Bandwidth Menu Averaging traces produces a more stable display, however averaging will make spurious signals less visible. Pressing the # Avg soft key will allow the user to enter a new value, pressing the soft key twice will turn off averaging. 5.12.3.2 Audio Beep Soft Key The audio beep feature provides an audible indication of received power level. There are two modes of operation, the variable cadence beep and the varying pitch tone. In the variable cadence beep mode when the signal power is low there is a slow or low duty cycle series of beeps that increase in duty cycle as the received power level increases. When the power level approaches the maximum power threshold, the interval between beeps decreases until it becomes a constant tone. In the variable pitch mode, when the signal power is low there is a constant low pitch tone that increases in frequency as the received power increases. The user selects the variable cadence beep mode by setting an even value for the Average soft key. The variable pitch beep is selected by setting an odd value for the Average soft key. The Audio Beep soft key and the Ref Level soft key in the Amplitude menu are used to control the Audio Beep feature. The Ref Level soft key located in the upper right corner of Figure 5.12.4 is used to set the reference level for the audio beep feature. It should be set to the maximum power level that will be measured, or the power level that will cause the beep to be a constant tone. The Audio Beep soft key located in the lower right corner of Figure 5.12.5 is used to set the range of the audio beep feature. The range value is subtracted from the reference level to give the minimum power level that the audio beep feature will respond to, or the power level at which the duty cycle of the audio beeps will start to increase. The Audio Beep soft key is also used to enable or disable the audio beeps. 5.12.4 Signal Coverage Marker Menu Sage Instruments • UCTT User Manual Rev E 2/2013 Page 57 The Marker menu is accessed by pressing the circled Marker soft key at the bottom of Figure 5.12.6. This menu allows up to six markers to be defined to make precise measurements anywhere on the displayed trace. Additionally, the Marker Math soft key allows the user to determine level and distance measurements between markers. For more details on using the marker menu refer to the Marker Menu description in this manual. 5.12.5 Signal Coverage Logging Menu The UCTT can log measurements to a file. The Signal Coverage Logging Menu is used to configure logging functions. The Logging menu is pictured in Figure 5.12.7 and is accessed by pressing the Logging soft key located below the circled Marker key in Figure 5.12.6. The logging parameter soft keys are on the right side of the menu. These soft keys are also available in the Map menu. Figure 5.12.6 Signal Coverage Marker Soft Key 5.12.5.1 Setting Logging Units and Interval The Log Units soft key circled in Figure 5.12.7 is used to specify the logging units. The options are Feet, Seconds or Results. This causes logging to occur every N feet, N seconds or N results where N is set by the Log Every soft key located above the circled Log Units key. The Log Every soft key is also used to enable or disable the logging function. 5.12.5.2 Setting Log File Format The Log Format soft key located below the circled key in Figure 5.12.7 is used to specify the file format for the log file. The choices are CSV Figure 5.12.7 Signal Coverage Logging Menu or KML. Note that KML files can be displayed in Google earth showing power measurements at each logging interval along the map. Log files for the signal coverage application are named Signal Coverage_ mm_dd_yyyy_n.csv/kml. Where mm_dd_yyyy is the date and n is a counter that starts at zero. For more information on exporting log files from the UCTT refer to the exporting files section of this manual. Sage Instruments • UCTT User Manual Rev E 2/2013 Page 58 5.12.6 Signal Coverage Map Menu The map menu pictured in Figure 5.12.8 allows the user to configure the logging parameters as well as viewing the RSSI survey on a map. The map in Figure 5.12.8 shows a typical RSSI survey. Each green balloon along the route represents a logging data point, pressing on a balloon will display the location, RSSI Channel and frequency parameters for the measurement as shown in Figure 5.12.9. Additionally, the logging function creates a data file that can be plotted using the UCTT’s post-test analysis utility software (PTAT – RSSI Chart) or re-drawn geographically using Google Earth. When the GPS indicator at the top of the screen is green, the current location will be indicated by the green cross hairs. If GPS cannot determine the present Figure 5.12.8 Signal Coverage Map Menu location there will be a red question mark in the center of the map and the logging will be disabled. For more information on the GPS setup and configuration refer to the GPS Configuration section of this manual. A map of the area of interest must be loaded into the UCTT prior to using the Signal Coverage application. The user can create map files for the UCTT using the PC based UCCTMapper application and Google Earth, refer to the UCTT Mapper Utility section of this manual for more information. The map displays at a fixed resolution so several map views may be useful to provide an overview as well as detailed views of the area of interest. The Signal Coverage Map Menu pictured in Figure 5.12.8 can be accessed by pressing the circled map button in Figure 5.12.10. This map button is available in all the Signal Coverage menus. Additionally there is a corresponding button labled RF in the upper corner of Figure 5.12.9 Map Logging Event Datapoint the Map Menu in Figure 5.12.8 that will switch the display mode to RF power and spectrum trace. 5.12.6.1 Import Map Key The Import Map soft key circled in Figure 5.12.8 is used to move map files from an external USB memory device into the UCTT. For more information about connecting a USB device to the UCTT refer to the Connector Panel section of this manual. Pressing the Import Map soft key will bring up a list of map files stored on the USB device. The user can select files from the menu and they will be loaded into the UCTT. 5.12.6.2 Map File Selection Key The Map File soft key located in the upper right corner of Figure 5.12.8 is used to select a stored map to display. Pressing the Map File key will bring up the Load Map File Menu shown in Figure 5.12.11. The Figure 5.12.10 Map File Selection Menu Sage Instruments • UCTT User Manual Rev E 2/2013 Page 59 user can select a map from the list to be displayed on the Signal Coverage screen. 5.12.6.3 Configuring Logging Parameters The four soft keys circled in Figure 5.12.12 are for configuring the logging function. The first three keys Log Every, Log Units and Log Format are covered in the Logging Menu description section of this manual. The CFG Symbols soft key allows the user to modify the map symbols displayed on the coverage map. These map symbols have four colors to represent the four signal level thresholds, Excellent, Good, Fair and Poor. The signal level and displayed color can be set by the user in the Define Map Symbols Menu. Pressing the CFG Symbols soft key will bring up the Define Map Symbols Menu pictured in Figure 5.12.13. The user can use this menu to specify the power levels and colors for each of the 4 thresholds. Figure 5.12.11 Load Map File Menu Figure 5.12.12 Logging Parameters Soft Keys Sage Instruments • UCTT User Manual Rev E 2/2013 Page 60 Figure 5.12.13 Define Map Symbol Menu 5.13 GSM Application The GSM application is used to demodulate and analyze GSM and EDGE signals. The signal to be analyzed is connected to the RF Input of the UCTT. An antenna is used for over the air measurements. For more information on the UCTT RF connectors refer to the Connector Panel section of this manual. The GSM Application is selected by pressing the front panel Mode button, then pressing the GSM EDGE soft key circled in Figure 5.13.1. 5.13.1 GSM RF Setup Menu The GSM RF Setup menu, displaying the RF Analysis screen is pictured in Figure 5.13.2. The GSM application has several screens for viewing GSM signals and channels. The RF analysis screen is used for basic signal analysis. The different GSM screens are described in detail in the GSM Setup section of this manual. The RF Setup menu can be accessed by pressing the highlighted RF Setup soft key in the lower left corner of the menu. The Setup menu allows configuring the center frequency and levels as well as scaling, offsets and preamp control. The soft keys for the RF Setup menu are along the right side of the menu and are described in the following sections. Figure 5.13.1 GSM/EDGE Application Selection 5.13.1.1 GSM Frequency Parameter Soft Keys There are two methods for setting up the center frequency of the GSM demodulator, specifying center frequency directly or by specifying the Channel Plan, and Channel. The corresponding sets of soft keys for each method are circled on the right side of Figure 5.13.2. Note that some measurements like the Mask Analysis have different parameters depending on what band is being used, therefore for correct results the center frequency should be setup using the channel plan method so the proper band is identified. Figure 5.13.2 GSM Frequency Menu 5.13.1.2 Setting the Reference Level The Ref Level soft key located below the circled Center Freq key in the upper right corner of Figure 5.13.2 is used to adjust the reference level of the display, this will have the effect of shifting the signal trace up or down on the screen but will not affect the measurement levels. Once the key is pressed the user can enter a value, or touch the screen where the reference level should be set. The current reference level is displayed on the Ref Level soft key as well as the RF Setup menu key. Sage Instruments • UCTT User Manual Rev E 2/2013 Page 61 5.13.1.3 Auto Scale Soft Key The Auto Scale soft key circled in Figure 5.13.3 is used to automatically adjust the reference level based on the signal power. This will cause the trace to be centered in the screen. When the key is pressed, the UCTT will modify the reference level. 5.13.1.4 Setting Offset Level The Ref Lvl Offset soft key located below the Auto Scale key in Figure 5.13.3 is used to apply a fixed offset to the signal. This is useful when viewing high power signals where an attenuator is connected between the UCTT and the signal source. The applied offset value is displayed on the Ref Lvl Offset soft key. 5.13.1.5 Controlling the Preamp The Preamp soft key located below the Ref Lvl Offset key in Figure 5.13.3 is used to control the state of the internal preamplifier in the UCTT. The default setting for the preamplifier is off. The preamplifier is useful for increasing the signal to noise ratio for low level signals less than -50 dB. The gain of the preamp will not affect the power measurement. Note that turning on the preamplifier when higher signal levels are present can cause instability and erroneous measurements to occur. Figure 5.13.3 GSM Frequency Menu Keys 5.13.1.6 Run/Pause Soft Key The Run/Pause soft key located at the bottom of Figure 5.13.3 is used to start and stop the measurements, this is useful for freezing the screen. The current run/pause state is indicated on the lower portion of the soft key. This soft key is present in the RF Setup and GSM Setup as well as all the GSM screens described in the following section. 5.13.2 GSM Screen Selection and Setup Menu The GSM Setup menu displaying the RF Analysis screen is pictured in Figure 5.13.4 and is selected by pressing the highlighted GSM Setup menu soft key located at the bottom of the menu. The soft keys for the menu are located along the right edge of the screen. The GSM setup menu allows the user to select among various GSM measurement screens, some of these screens have dedicated soft keys for specifying measurement parameters. Notice that the current screen name is indicated in GSM Setup and GSM Screen soft keys. The GSM Screen soft key circled in figure 5.13.4 is used to select different screens. Pressing this key will bring up the Screen Selection menu pictured in Figure 5.13.5. Figure 5.13.4 GSM Setup Menu Sage Instruments • UCTT User Manual Rev E 2/2013 Page 62 5.13.2.1 GSM RF Analysis Screen The RF Analysis screen is pictured in Figure 5.13.6. This screen is used to perform basic analysis of the GSM signal. This includes, verifying that the center frequency is correct, and that the signal being received has a valid GSM format. There are two trace views displayed. The upper trace is the time domain view of the demodulated channel. The lower trace is the frequency domain view of the RF signal. The upper and lower traces are color coded to indicate the burst type. The legend that indicates the colors for each burst type is located along the center of the display. At the top of the screen are indicators for the received Training Sequence Code (TSC) and the Session Border Controller number as well as Frequency offset and I/Q offsets. The Phase Error is displayed in both Peak and RMS values in the upper right of the display. The Phase Error Peak indicator is red for any values greater than 20 degrees, while the RMS indicator is red for any values greater than 5 degrees. Figure 5.13.5 GSM Setup Menu 5.13.2.2 Burst Type Soft Key The Burst Type soft key located in the upper right corner of Figure 5.13.6 is used to select the burst type to analyze. This soft key is present in most of the GSM screens. Pressing the Burst Type soft key will bring up the Burst Type selection Menu pictured in Figure 5.13.7. Once a burst type is selected, the UCTT will display any occurrences of the received signals on the upper and lower displays. Note that the display may update slowly if the selected burst type occurs intermittently. If the Any Burst Type is selected, the UCTT will display the burst with the greatest activity during the sample period. Figure 5.13.6 GSM RF Analysis Screen Figure 5.13.7 GSM Burst Type Selection Sage Instruments • UCTT User Manual Rev E 2/2013 Page 63 5.13.2.3 Burst Analysis Screen The burst analysis screen pictured in Figure 5.13.8 is used to compare the burst signals against the GSM mask for power versus time. The Burst Type soft key located in the upper right corner can be used to select the burst type to monitor. The mask is colored red while the burst trace will be color coded according to the burst type. The legend for the burst type color coding is at the bottom of the screen. 5.13.2.4 Modulation Screen The GSM modulation screen pictured in Figure 5.13.9 is used to view the constellation of the demodulated data for the selected burst type. The Burst Type soft key located in the upper right corner is used to select the burst type. The Training Sequence Code(TSC), Session Boundary Controller(SBC), Base Station Identity Code (BSIC) and current Frame number are displayed in the upper left of the screen. Note that the BSIC is a six bit code the first three bits are the Network Color Code (NCC) followed by the three bit Base Station Color Code (BCC). Below these indicators are Frequency Offset, I/Q Offset and Phase Error measurements. The burst type indicator in the lower left corner of the screen displays the type of burst being monitored. Figure 5.13.8 GSM Burst Analysis Screen 5.13.2.5 Mask Analysis Screen The GSM Mask Analysis screen pictured in Figure 5.13.10 is used to view the RF power versus frequency of the base station transmitter. In most cases the UCTT will be connected to the transmitter via an attenuator, directional coupler or air interface. In order for the UCTT to apply the proper mask, the Ref Lvl Offset parameter in the Frequency Setup menu should be set to compensate for any loss due to the connection arrangement. The screen displays the measured signal trace and the applicable ETSI mask. At the top of the screen is a Pass Fail indicator for the tests. At the bottom of the screen is channel power. The ETSI Table soft key circled in Figure 5.13.10 is used to select among the applicable ESTI tables for different GSM configurations. The currently selected table is displayed in the soft key. The ETSI Power soft key located below the ETSI Table key, is used to manually change the apparent power effectively shifting the mask up or down relative to the signal trace. Sage Instruments • UCTT User Manual Rev E 2/2013 Page 64 Figure 5.13.9 GSM Modulation Screen Figure 5.13.10 GSM Mask Analysis Screen 5.13.3 GSM Logging Menu The Logging Menu is used to configure logging functions for the GSM RF Analysis screen. All measurements displayed on screen including the RSSI of the detected burst types are included in the log file. The file name is titled GSM Analyzer_mm_dd_yyy.cvs or .kml. For more information on exporting log files from the UCTT refer to the Exporting Files section of the manual. The Logging menu is pictured in Figure 5.13.11 and is accessed by pressing the highlighted Logging soft key located at the bottom of Figure 5.13.11. The logging parameter soft keys are on the right side of the menu. 5.13.3.1 Setting Logging Units and Figure 5.13.11 GSM Logging Menu Interval The Log Units soft key circled in Figure 5.13.11 is used to specify the logging units. The options are Seconds or Results. This causes logging to occur every N seconds or N results where N is set by the Log Every soft key located above the circled Log Units key. The labels on the Log Units and Log Every soft keys indicate the number and units selected. 5.13.3.2 Setting Log File Format The Log Format soft key located below the circled key in Figure 5.13.11 is used to specify the file format for the log file. The choices are CSV or KML. Note that KML files can be opened in Google earth showing measurement and location data. 5.13.3.3 Enable/Disable Logging The Logging soft key is located in the lower right corner of Figure 5.13.11. This soft key is used to enable or disable the logging function. Pressing the key will toggle between enabled and disabled states. The current logging state is displayed in this soft key as well as the highlighted Logging menu key at the bottom of the screen. Sage Instruments • UCTT User Manual Rev E 2/2013 Page 65 5.14 CDMA Application The CDMA application is used to demodulate and analyze CDMA , CDMA 200 and EVDO signals. The UCTT will automatically detect and configure itself for CDMA, CDMA 200 and EVDO signals. There are different screens displayed for CDMA and EVDO signals. The signal to be analyzed is connected to the RF Input of the UCTT. An antenna is used for over the air measurements. For more information on the UCTT RF connectors refer to the Connector Panel section of this manual. The CDMA Application is selected by pressing the front panel Mode button, then pressing the CDMA EVDO soft key circled in Figure 5.14.1. 5.14.1 CDMA RF Setup Menu The CDMA RF Setup menu, displaying the RF Spectrum screen is pictured in Figure 5.14.2. The CDMA application has several screens for viewing CDMA signals and channels. The RF spectrum screen is used for basic signal analysis. The different CDMA screens are described in detail in the CDMA Setup Menu section of this manual. The RF Setup menu can be accessed by pressing the highlighted RF Setup soft key in the lower left corner of the menu. The Setup menu allows configuring the center frequency and levels as well as scaling, offsets and preamp control. The soft keys for the RF Setup menu are along the right side of the menu and are described in the following sections. Figure 5.14.1 CDMA Application Selection 5.14.1.1 CDMA Frequency Parameter Soft Keys There are two methods for setting up the center frequency of the CDMA demodulator, specifying center frequency directly or by specifying the Channel Plan, and Channel. The corresponding sets of soft keys for each method are circled on the right side of Figure 5.14.2. Note that some Figure 5.14.2 CDMA RF Setup Menu measurements like the Spectral Emissions Mask have different parameters depending on what band is being used, therefore for correct results these tests center frequency should be setup using the channel plan method so the proper band is identified. 5.14.1.2 Setting the Reference Level The Ref Level soft key located below the circled Center Freq key in the upper right corner of Figure 5.14.2 is used to adjust the reference level of the display, this will have the effect of shifting the signal trace up or down on the screen but will not affect the measurement levels. Once the key is pressed the user can enter a value, or touch the screen where the reference level should be set. The current reference level is displayed on the Ref Level soft key as well as the RF Setup menu key. Sage Instruments • UCTT User Manual Rev E 2/2013 Page 66 5.14.1.3 Auto Scale Soft Key The Auto Scale soft key circled in Figure 5.14.3 is used to automatically adjust the reference level based on the signal power. This will cause the trace to be centered in the screen. When the key is pressed, the UCTT will modify the reference level. 5.14.1.4 Setting Offset Level The Ref Lvl Offset soft key located below the Auto Scale key in Figure 5.14.3 is used to apply a fixed offset to the signal. This is useful when viewing high power signals where an attenuator is connected between the UCTT and the signal source. The applied offset value is displayed on the Ref Lvl Offset soft key. 5.14.1.5 Controlling the Preamp The Preamp soft key located below the Ref Lvl Offset key in Figure 5.14.3 is used to control the state of the internal preamplifier in the UCTT. The default setting for the preamplifier is off. The preamplifier is useful for increasing the signal to noise ratio for low level signals less than -50 dB. The gain of the preamp will not affect the power measurement. Note that turning on the preamplifier when higher signal levels are present can cause instability and erroneous measurements to occur. Figure 5.14.3 CDMA RF Menu Soft Keys 5.14.1.6 Run/Pause Soft Key The Run/Pause soft key located at the bottom of Figure 5.14.3 is used to start and stop the measurements, this is useful for freezing the screen. The current run/pause state is indicated on the lower portion of the soft key. This soft key is present in the RF Setup and CDMA Setup as well as all the CDMA screens described in the following section. 5.14.2 CDMA Screen Selection and Setup Menu Figure 5.14.4 CDMA Setup Menu The CDMA Setup menu is pictured in Figure 5.14.4 and is selected by pressing the highlighted CDMA Setup menu soft key located at the bottom of the menu. The soft keys for the menu are located along the right edge of the screen. The CDMA setup menu allows the user to select among various CDMA measurement screens, some of these screens have dedicated soft keys for specifying measurement parameters. Notice that the current screen name is indicated in CDMA Setup and CDMA Screen soft keys. The CDMA Screen soft key circled in figure 5.14.4 is used to select different screens. Pressing this key will bring up the Screen Selection menu pictured in Figure 5.14.5. 5.14.5 CDMA Screen Selection Menu Figure Sage Instruments • UCTT User Manual Rev E 2/2013 Page 67 5.14.2.1 RF Spectrum Screen The RF Spectrum screen is pictured in Figure 5.14.6. This screen is used to perform basic analysis of the CDMA signal. This includes, verifying that the center frequency is correct, and that the signal being received has a valid CDMA or EVDO format. There are two traces displayed, the yellow trace shows the raw unfiltered section of the frequency spectrum while the blue trace shows the signal as viewed through a CDMA filter. Additionally the text at the top of the screen will display CDMA or EVDO when a valid signal is present, or CDMA/ EVDO Signal NOT Detected when there is no valid signal present. Indicators at the bottom of the screen show frequency offset, frequency span, signal power and occupied bandwidth. 5.14.2.2 CDMA Summary Screen Figure 5.14.6 CDMA RF Spectrum Screen The Summary screen for CDMA/CDMA 2000 signals is pictured in Figure 5.14.7. This screen displays a summary of the activity of the most powerful sector received. Activity in the sector is displayed at the top of the screen in bar graph form. The X-axis is the walsh codes, the Y-axis is the level. Each code channel is displayed, color coded according to the legend in the lower left corner of the screen. Code channels containing data are colored orange. The horizontal red line shows the threshold for detecting channel activity. In the default mode, the threshold is set automatically. Threshold soft key circled in Figure 5.15.7 can be used to manually set the threshold for detecting channel activity. The Walsh Codes soft key located above the Threshold key is used to select between 64 and 128 walsh codes. The Total Power, Frequency Offset, Figure 5.14.7 CDMA Summary Screen Waveform Quality (Rho), I/Q offset measurements are displayed below the graph. The levels for the sync, paging and pilot channels are displayed in the bottom left of the screen. The buttons circled in the lower left of Figure 5.14.7 allow selection of the measurement units for these levels. Absolute power level in dBm or Watts as well as power relative to the total channel power can be selected. If an even second timing source is available (GPS or External Input) the PN statistics for the sector will be displayed. The PN Stats box in the lower right corner of the screen contains the Even Seconds Trigger check box which indicates the presence of the even second clock, the Tau, or signal delay and PN offset for the sector. The Even Second soft key located in the upper right corner of the screen is used to enable the external even seconds source to be used for timing measurements. Sage Instruments • UCTT User Manual Rev E 2/2013 Page 68 5.14.2.3 EVDO Summary Screen The UCTT uses a different summary screen for EVDO signals. It will automatically detect the EVDO signal and present the screen shown in Figure 5.14.8. The measurements in the lower portion of the screen are similar to the CDMA screen. The EVDO MAC code channels are displayed on the upper graph while I and Q values for the EVDO data channels are displayed on the lower graph. Figure 5.14.8 EVDO Summary Screen 5.14.2.4 Zoom Screen The zoom screen is pictured in Figure 5.14.9. This screen allows detailed analysis of the code channel activity. The upper graph displays all the walsh codes, while the lower graph shows a magnified view of the codes. The user can move the magnified view by touching anywhere on the upper graph. If a EVDO signal is detected, the MAC code channels are displayed on the upper and lower graphs. Figure 5.14.9 Zoom Screen Sage Instruments • UCTT User Manual Rev E 2/2013 Page 69 5.14.2.5 Multipath Screen The multipath screen pictured in Figure 5.14.10 is used to analyze multipath signals. This screen displays the time domain plot of energy around the center frequency. The phase spreading from multi-path interference causes the apex of the plot to become wider, indicating more interference. The channel power and multipath signal power are indicated at the bottom of the screen. Figure 5.14.10 Multipath Screen 5.14.2.6 Scanner Screen The scanner screen pictured in Figure 5.14.11 displays all detected PNs. The upper graph displays the level and offset for each PN. Piolot dominance, pilot power relative to channel power, PN delay and total channel power are displayed at the lower portion of the screen. Figure 5.14.11 Scanner Screen Sage Instruments • UCTT User Manual Rev E 2/2013 Page 70 5.14.2.7 EVDO Time Slots Screen The EVDO time slots screen pictured in Figure 5.14.12 provides a graphical display of the EVDO time slot activity. The yellow trace is a time domain plot of the levels of the EVDO half slots, the blue trace is the average half slot level. The MAC channels are located in the center of the plot while the data channels are on the left and right. Total, pilot, MAC and data power measurements as well as channel activity are displayed at the bottom of the screen. Figure 5.14.12 EVDO Time Slots Screen 5.14.2.8 CDMA Pass/Fail Screen The CDMA Pass/Fail screen is pictured in Figure 5.14.13. This screen allows the user to define Pass/Fail thresholds for different sector measurements. Each measurement can be independently enabled or disabled. The thresholds are established using a target value and a tolerance value for each measurement. The UCTT will perform the specified tests, displaying the measured value and the pass/fail status for each measurement as well as for the entire test. Pressing a value in one of the circled columns in Figure 5.14.13 will allow the user to enable/disable or modify the thresholds for each test. Figure 5.14.13 CDMA Pass/Fail Screen Sage Instruments • UCTT User Manual Rev E 2/2013 Page 71 5.14.2.9 EVDO Pass/Fail Screen The EVDO Pass/Fail screen is pictured in Figure 5.14.14. The screen has different parameters for EVDO signals. 5.14.3 CDMA/EVDO Logging Menu The Pass/Fail screen results can be saved to a log file. The Logging Menu is used to configure logging functions. The Logging menu is pictured in Figure 5.14.15 and is accessed by pressing the highlighted Logging soft key located at the bottom of screen. The logging parameter soft keys are on the right side of the menu. 5.14.3.1 Setting Logging Units and Interval Figure 5.14.14 EVDO Pass/Fail Screen The Log Units soft key circled in Figure 5.14.15 is used to specify the logging units. The options are Seconds or Results. This causes logging to occur every N seconds or N results where N is set by the Log Every soft key located above the circled Log Units key. The labels on the Log Units and Log Every soft keys indicate the number and units selected. 5.14.3.2 Setting Log File Format The Log Format soft key located below the circled key in Figure 5.14.15 is used to specify the file format for the log file. The choices are CSV or KML. Note that KML files can be opened in Google earth showing measurement and location data. The log file is named CDMA PassFail_mm_dd_yyy_n.csv.kml. Where mm_dd_yyyy is the date and n is a counter that starts at zero. For more information on exporting log files from the UCTT refer to the exporting files section of the manual. 5.14.3.3 Enable/Disable Logging Figure 5.14.15 CDMA/EVDO Logging Menu The Logging soft key is located in the lower right corner of Figure 5.14.15. This soft key is used to enable or disable the logging function. Pressing the key will toggle between enabled and disabled states. The current logging state is displayed in this soft key as well as the highlighted Logging menu key at the bottom of the screen. Sage Instruments • UCTT User Manual Rev E 2/2013 Page 72 5.15 WCDMA Application The WCDMA application is used to demodulate and analyze WCDMA and HSPA signals. The signal to be analyzed is connected to the RF Input of the UCTT. An antenna is used for over the air measurements. For more information on the UCTT RF connectors refer to the Connector Panel section of this manual. The WCDMA Application is selected by pressing the front panel Mode button, then pressing the WCDMA HSPA soft key circled in Figure 5.15.1. 5.15.1 WCDMA RF Setup Menu The WCDMA RF Setup menu, displaying the RF Spectrum screen is pictured in Figure 5.15.2. The WCDMA application has several screens for viewing WCDMA signals and channels. The RF spectrum screen is used for basic signal analysis. The different WCDMA screens are described in detail in the WCDMA Setup menu section of this manual. The RF Setup menu can be accessed by pressing the highlighted RF Setup soft key in the lower left corner of the menu. The Setup menu allows configuring the center frequency and levels as well as scaling, offsets and preamp control. The soft keys for the RF Setup menu are along the right side of the menu and are described in the following sections. Figure 5.15.1 WCDMA Selection 5.15.1.1 WCDMA Frequency Parameter Soft Keys There are two methods for setting up the center frequency of the WCDMA demodulator, specifying center frequency directly or by specifying the Channel Plan, and Channel. The corresponding sets of soft keys for each method are circled on the right side of Figure 5.15.2. Note that some Figure 5.15.2 WCDMA RF Setup Menu measurements like the Spectral Emissions Mask have different parameters depending on what band is being used, therefore for correct results these tests center frequency should be setup using the channel plan method so the proper band is identified. 5.15.1.2 Setting the Reference Level The Ref Level soft key located below the circled Center Freq key in the upper right corner of Figure 5.15.2 is used to adjust the reference level of the display, this will have the effect of shifting the signal trace up or down on the screen but will not affect the measurement levels. Once the key is pressed the user can enter a value, or touch the screen where the reference level should be set. The current reference level is displayed on the Ref Level soft key as well as the RF Setup menu key. Sage Instruments • UCTT User Manual Rev E 2/2013 Page 73 5.15.1.3 Auto Scale Soft Key The Auto Scale soft key circled in Figure 5.15.3 is used to automatically adjust the reference level based on the signal power. This will cause the trace to be centered in the screen. When the key is pressed, the UCTT will modify the reference level. 5.15.1.4 Setting Offset Level The Ref Lvl Offset soft key located below the Auto Scale key in Figure 5.15.3 is used to apply a fixed offset to the signal. This is useful when viewing high power signals where an attenuator is connected between the UCTT and the signal source. The applied offset value is displayed on the Ref Lvl Offset soft key. 5.15.1.5 Controlling the Preamp The Preamp soft key located below the Ref Lvl Offset key in Figure 5.15.3 is used to control the state of the internal preamplifier in the UCTT. The default setting for the preamplifier is off. The preamplifier is useful for increasing the signal to noise ratio for low level signals less than -50 dB. The gain of the preamp will not affect the power measurement. Note that turning on the preamplifier when higher signal levels are present can cause instability and erroneous measurements to occur. Figure 5.15.3 RF Setup Soft Keys 5.15.1.6 Run/Pause Soft Key The Run/Pause soft key located at the bottom of Figure 5.15.3 is used to start and stop the measurements, this is useful for freezing the screen. The current run/pause state is indicated on the lower portion of the soft key. This soft key is present in the RF Setup and WCDMA Setup as well as all the WCDMA screens described in the following section. 5.15.2 WCDMA Screen Selection and Setup Menu Figure 5.15.4 WCDMA Setup Menu The WCDMA Setup menu is pictured in Figure 5.15.4 and is selected by pressing the highlighted WCDMA Setup menu soft key located at the bottom of the menu. The soft keys for the menu are located along the right edge of the screen. The WCDMA setup menu allows the user to select among various WCDMA measurement screens, some of these screens have dedicated soft keys for specifying measurement parameters. Notice that the current screen name is indicated in WCDMA Setup and WCDMA Screen soft keys. The WCDMA Screen soft key circled in Figure 5.15.4 is used to select different screens. Pressing this key will bring up the Screen Selection menu pictured in Figure 5.15.5. Figure 5.15.5 WCDMA Screen Selection Sage Instruments • UCTT User Manual Rev E 2/2013 Page 74 5.15.2.1 WCDMA RF Spectrum Screen The RF Spectrum screen is pictured in Figure 5.15.6. This screen is used to perform basic analysis of the WCDMA signal. This includes, verifying that the center frequency is correct, and that the signal being received has a valid WCDMA format. There are two traces displayed, the yellow trace shows the raw unfiltered section of the frequency spectrum while the blue trace shows the signal as viewed through a WCDMA filter. Additionally the text at the top of the screen will display WCDMA when a valid signal is present, or WCDMA Signal NOT Detected when there is no valid signal present. Indicators at the bottom of the screen show frequency offset, measurement span and signal power. Figure 5.15.6 WCDMA RF Spectrum Screen 5.15.2.2 WCDMA Summary Screen The Summary screen is pictured in Figure 5.15.7. This screen displays a summary of the activity of the most powerful sector received. Activity in the sector is displayed at the top of the screen. The code channels are color coded by OVSF codes and channel type. The scramble code, frequency offset, channel power, Error Vector Magnitude (EVM) and Waveform Quality (Rho) are displayed below the graph. The levels for the sync, paging and control channels of the sector are displayed at the bottom of the screen. The Units buttons circled in Figure 5.15.7 allow selection of the measurement units for received levels. Abs displays the absolute power level, while the Rel displays the level relative to the channel power level. Figure 5.15.8 shows an expanded view of the code channel data. The x axis is the channel number assuming 512 codes per channel while Figure 5.15.7 WCDMA Summary Screen the y axis is the power level. The white trace through the center of the screen shows the actual measurement value while the red line shows the threshold for detecting channel activity. In the default mode, the threshold is set automatically. The Threshold soft key circled in Figure 5.15.7 can be used to manually set the threshold for detecting channel activity. Channel activity is indicated by colored bars that are proportional in height to the level in the channel. The colors of the bars correspond to the OVSF code assigned to the channel. Refer to the OVSF color legend below Figure 5.15.8 Summary Screen Demodulated Channel the graph. Additionally the following Sage Instruments • UCTT User Manual Rev E 2/2013 Page 75 control and pilot channels are displayed in their respective colors; CPICH, Blue, P-CCPCH, red, S-CCPCH, green and PICH, lite blue. 5.15.2.3 WCDMA Zoom Screen The Zoom screen is pictured in Figure 5.15.9. Activity in the sector is displayed at the top of the screen. The bottom of the screen displays a magnified view of the channel activity. Touching anywhere on the upper screen will cause the selected area to be magnified in the lower screen. Figure 5.15.9 WCDMA Zoom Screen 5.15.2.4 WCDMA Codogram Screen The Codogram screen is pictured in Figure 5.15.10. Activity in the demodulated channel is displayed at the top of the screen. The bottom of the screen displays a histogram of the demodulated channel over time. Figure 5.15.10 WCDMA Codograph Screen Sage Instruments • UCTT User Manual Rev E 2/2013 Page 76 5.15.2.5 WCDMA Modulation Screen The Modulation screen is pictured in Figure 5.15.11. Activity in the sector is displayed at the top of the screen. The rest of the screen except for the Total window displays measurements for a demodulated channel. By default the UCTT will locate and display the channel with the lowest OVSF and highest power in a given sample. The monitored channel is circled in Figure 5.15.11. There will be an A displayed for automatic selection and an M for manual selection. The user can manually select a channel by touching anywhere on the signal trace, or by pressing the Ch List soft key circled in Figure 5.15.11 and selecting a channel from the list pictured in Figure 5.15.12. The graph on the lower left of Figure 5.15.11 Figure 5.15.11 WCDMA Modulation displays the constellation of the demodulated data Screen for the selected channel. The Channel window to the right displays the information and measurements for the selected channel. This includes the Channel number and OVSF code assignment, note that the channel number is tied to the OVSF code IE OVSF 16 has 16 total channels while OVSF 512 has 512 total channels. Other displayed measurements include the channel power and the Error Vector Magnitude for the channel as well as the format of the channel. The Total window below the Channel window displays the Frequency offset as well as the Error Vector Magnitude for the common pilot channel. Figure 5.15.12 Channel Modulation List Sage Instruments • UCTT User Manual Rev E 2/2013 Page 77 5.15.2.6 WCDMA Scanner Screen The Scanner screen is pictured in Figure 5.15.13. The scanner screen displays the received sectors for the given center frequency. The bar graph at the top of the screen displays the total channel power and the pilot power for each sector detected. The scramble codes for each sector are listed on the x axis of the graph. Below the graph are the power measurements for the received sectors. The Pilot Dominance is the ratio of the strongest pilot to one of the other received pilots. The EC/IO is the measurement of the pilot power relative to the channel power. The OTA measurement at the bottom of the screen displays the total power from all sectors detected. Figure 5.15.13 WCDMA Scanner Screen 5.15.2.7 WCDMA Pass/Fail Screen The Pass/Fail screen is pictured in Figure 5.15.14. This screen allows the user to define Pass/Fail thresholds for different sector measurements. Each measurement can be independently enabled or disabled. The thresholds are established using a target value and a tolerance value for each measurement. The UCTT will perform the specified tests, displaying the measured value and the pass/fail status for each measurement as well as for the entire test. Pressing a value in one of the circled columns in Figure 5.15.14 will allow the user to enable/disable or modify the thresholds for each test. Figure 5.15.14 Pass/Fail Screen Sage Instruments • UCTT User Manual Rev E 2/2013 Page 78 5.15.2.8 WCDMA Spectral Emissions Mask Screen The spectral emissions mask screen is used to evaluate the output signal of a base station transmitter against ETSI Spectral Emissions tables. In most cases the UCTT will be connected to the transmitter via an attenuator, directional coupler or air interface. In order for the UCTT to apply the proper mask, the Ref Lvl Offset parameter in the Frequency Setup menu should be set to compensate for any loss due to the connection arrangement. The Spectral Emissions Mask screen is pictured in Figure 5.15.15. The screen displays the measured signal trace and the applicable ETSI mask. In the upper right corner of the screen is the Pass/Fail indicator for the test. At the bottom of the screen is the channel power Figure 5.15.15 Spectral Emissions Mask Screen level as well as the number of the ETSI table used for the mask. The UCTT automatically applies the proper ETSI table depending on the received signal power level and the UTMS band specified in the Channel Plan menu. By pressing the ETSI Power soft key circled in Figure 5.15.15, the user can manually change the apparent power to select a different ETSI table for the mask. 5.15.2.9 WCDMA Uplink Screen The uplink screen is used to display activity on the uplink. The uplink screen is pictured in Figure 5.15.16. The bar graph in the center of the screen displays the uplink channel activity. Below the bar graph the frequency offset and power for the channel are displayed. The user enters the Uplink parameters using the three Uplink soft keys circled in Figure 5.15.16. The first key labeled Uplink # Pilots is used to specify the number of the Pilot bit pattern as described in Tables 3 and 4 of ETSI TS 125 211. Valid values for this parameter are 3 to 8. The Uplink Scr Code key is used to enter the uplink scramble code. Valid values for this parameter are 0 to 16777215. The Uplink OVSF key is used to set the spreading factor. When the user press this key a list of OVSF codes is presented to select from. Figure 5.15.16 Uplink Screen Sage Instruments • UCTT User Manual Rev E 2/2013 Page 79 5.15.3 WCDMA Logging Menu The UCTT can log measurements to a file from the RF Spectrum and Pass/Fail screens. The WCDMA Logging Menu is used to configure logging functions. The Logging menu is pictured in Figure 5.15.17 and is accessed by pressing the highlighted Logging soft key located at the bottom of the screen. The logging parameter soft keys are on the right side of the menu. 5.15.3.1 Setting Logging Units and Interval The Log Units soft key circled in Figure 5.15.17 is used to specify the logging units. The options are Seconds or Results. This causes logging to occur every N seconds or N results where N is set by the Log Every soft key located above the circled Log Units key. The labels on the Log Units and Log Every soft keys indicate the number and units selected. Figure 5.15.17 WCDMA Logging Menu 5.15.3.2 Setting Log File Format The Log Format soft key located below the circled key in Figure 5.15.17 is used to specify the file format for the log file. The choices are CSV or KML. Note that KML files can be opened in Google earth showing measurement and location data. The log files are named WCDMA RF_mm_dd_yyyy_n.csv/kml and WCDMA PassFail_mm_dd_yyyy_n.csv/kml. Where mm_dd_yyyy is the date, and n is a counter that starts at zero. For more information on exporting files from the UCTT refer to the exporting files section of the manual. 5.15.3.3 Enable/Disable Logging The Logging soft key is located in the lower right corner of Figure 5.15.17. This soft key is used to enable or disable the logging function. Pressing the key will toggle between enabled and disabled states. The current logging state is displayed in this soft key as well as the highlighted Logging menu key at the bottom of the screen. Sage Instruments • UCTT User Manual Rev E 2/2013 Page 80 5.16 LTE (FDD and TDD) Application The LTE application is used to demodulate and analyze LTE signals. For a detailed description of how the UCTT performs LTE measurements and data extraction refer to the LTE Measurements Technical Description section of this manual. The signal to be analyzed is connected to the RF Input of the UCTT. An antenna is used for over the air measurements. For more information on the UCTT RF connectors refer to the Connector Panel section of this manual. The LTE Application is selected by pressing the front panel Mode button, then pressing the one of the circled LTE FDD or LTE TDD soft keys shown in Figure 5.16.1. 5.16.1 LTE RF Setup Menu The LTE RF Setup menu, displaying the RF Spectrum screen is pictured in Figure 5.16.2. The LTE application has several screens for viewing LTE signals and channels. The RF spectrum screen is used for basic signal analysis. The different LTE screens are described in detail in the LTE Setup menu section of this manual. The RF Setup menu can be accessed by pressing the highlighted RF Setup soft key in the lower left corner of the menu. The Setup menu allows configuring the center frequency and levels as well as scaling, offsets and preamp control. The soft keys for the RF Setup menu are along the right side of the menu and are described in the following sections. Figure 5.16.1 LTE Application Selection 5.16.1.1 LTE Frequency Parameter Soft Keys There are two methods for setting up the center frequency of the LTE demodulator, specifying center frequency directly or by specifying the Channel Plan, and Channel. The corresponding sets of soft keys for each method are circled Figure 5.16.2 LTE RF Setup Menu on the right side of Figure 5.16.2. Note that some measurements like the Spectral Emissions Mask have different parameters depending on what band is being used, therefore for correct results these tests center frequency should be setup using the channel plan method so the proper band is identified. 5.16.1.2 Setting the Reference Level The Ref Level soft key located below the circled Center Freq key in the upper right corner of Figure 5.16.2 is used to adjust the reference level of the display, this will have the effect of shifting the signal trace up or down on the screen but will not affect the measurement levels. Once the key is pressed the user can enter a value, or touch the screen where the reference level should be set. The current reference level is displayed on the Ref Level soft key as well as the RF Setup menu key. Sage Instruments • UCTT User Manual Rev E 2/2013 Page 81 5.16.1.3 Auto Scale Soft Key The Auto Scale soft key circled in Figure 5.16.3 is used to automatically adjust the reference level based on the signal power. This will cause the trace to be centered in the screen. When the key is pressed, the UCTT will modify the reference level. 5.16.1.4 Setting Offset Level The Ref Lvl Offset soft key located below the Auto Scale key in Figure 5.16.3 is used to apply a fixed offset to the signal. This is useful when viewing high power signals where an attenuator is connected between the UCTT and the signal source. The applied offset value is displayed on the Ref Lvl Offset soft key. 5.16.1.5 Controlling the Preamp The Preamp soft key located below the Ref Lvl Offset key in Figure 5.16.3 is used to control the state of the internal preamplifier in the UCTT. The default setting for the preamplifier is off. The preamplifier is useful for increasing the signal to noise ratio for low level signals less than -50 dB. The gain of the preamp will not affect the power measurement. Note that turning on the preamplifier when higher signal levels are present can cause instability and erroneous measurements to occur. Figure 5.16.3 LTE RF Setup Soft Keys 5.16.1.6 Run/Pause Soft Key The Run/Pause soft key located in the lower right corner of Figure 5.16.3 is used to start and stop the measurements, this is useful for freezing the screen. The current run/pause state is indicated on the lower portion of the soft key. This soft key is present in the RF Setup and LTE Setup as well as all the LTE screens described in the following section. Figure 5.16.4 LTE Setup Menu 5.16.2 LTE Screen Selection and Setup Menu The LTE Setup menu is pictured in Figure 5.16.4 and is selected by pressing the highlighted LTE Setup menu soft key located at the bottom of the menu. The soft keys for the menu are located along the right edge of the screen. The LTE setup menu allows the user to select among various LTE measurement screens, some of these screens have dedicated soft keys for specifying measurement parameters. Notice that the current screen name, RF View, is indicated in LTE Setup and LTE Screen soft keys. The LTE Screen soft key circled in figure 5.16.4 is used to select different screens. Pressing the key will bring up the Screen Selection menu pictured in Figure 5.15.5. Sage Instruments • UCTT User Manual Rev E 2/2013 Page 82 Figure 5.16.5 LTE Screen Selection Menu 5.16.2.1 LTE RF View Screen The RF View screen is pictured in Figure 5.16.6. This screen is used to perform basic analysis of the LTE signal. This includes, verifying that the center frequency and bandwidth are correct, and that the signal being received has a valid LTE format. There are two traces displayed, the yellow trace shows the raw unfiltered section of the frequency spectrum while the blue trace shows the signal as viewed through a LTE filter. Additionally the text at the top of the screen will display ‘LTE’ when a valid signal is present, or ‘LTE Signal NOT Detected’ when there is no valid signal present. Indicators at the bottom of the screen show frequency offset, measurement span and signal power. Figure 5.16.6 LTE RF View Screen 5.16.2.2 LTE Bandwidth Soft Key The LTE Bandwidth soft key is used to specify the bandwidth of the LTE signal that is being monitored. Pressing the LTE Bandwidth key located in the upper right corner of Figure 5.16.6 will cause the change LTE bandwidth menu pictured in Figure 5.16.7 to be presented. Select the appropriate bandwidth by pressing on the menu item followed by the OK button. 5.16.2.3 Antenna Port Soft Key The Antenna Port soft key is used to switch between antenna signals when MIMO is used. In most circumstances, the soft key is used when directly connecting to the different antenna ports of the base station. Antenna port 0 should be selected for most over the air tests. Figure 5.16.7 Bandwidth Selection Menu 5.16.2.4 LTE Configuration Menu The LTE Configuration soft key is used to specify additional LTE parameters specific to the system being monitored. Pressing the LTE Config soft key will cause the LTE configuration menu pictured in Figure 5.16.8 to be presented. Configuration items include the Cyclic Prefix length, PHICH Group Number, PDCCH Channel Format, PDCCH number of symbols, PDSCH Modulation Format and the LTE pass/fail configuration file. The Pass/Fail file is used to specify the pass/ fail limits for the Pass/Fail screen described in the next section. The four soft keys circled in Figure 5.16.8 are used to select, rename, import and export LTE pass/Fail files. The default name for the limits file is LTEPFLimits.sge. This file is automatically created by the UCTT based on the pass fail limits set in the LTE Pass/Fail Screen. Figure 5.16.8 LTE Configuration Menu Sage Instruments • UCTT User Manual Rev E 2/2013 Page 83 Pressing the Load Pass/Fail soft key will present a list of limit files from the internal memory of the UCTT, the user can select a file from the list to set the pass fail limits. Pressing the P/F Save As soft key will allow the current file to be saved under a different name. Pressing the P/F Export soft key will export the current file to an external USB memory device. While the P/F Import soft key will allow the user to select a Pass/Fail limits file from an external USB memory device. For more information on attaching a USB memory device to the UCTT refer to the connector panel section of this manual. 5.16.2.5 LTE Pass/Fail Screen The LTE Pass/Fail screen is pictured in Figure 5.16.9. This screen allows the user to define Figure 5.16.9 LTE Pass/Fail Screen Pass/Fail thresholds for different sector measurements. Each measurement can be independently enabled or disabled. The thresholds are established using a target value and a tolerance value for each measurement. The UCTT will perform the specified tests, displaying the measured value and the pass/fail status for each measurement as well as for the entire test. Pressing a value in one of the circled columns in Figure 5.16.9 will allow the user to enable/disable or modify the thresholds for each test. The UCTT maintains a Pass/Fail limits file that captures the limits set on this screen. Refer to the previous section for more information managing the pass/fail limits file. 5.16.2.6 LTE Frame Summary Screen The LTE Frame Summary screen is pictured in Figure 5.16.10. This screen displays a summary of the signal strength for a received sector. Additionally, the signal level and Error Vector Magnitude for the physical signals and channels of the sector are also displayed. Note that the levels for Figure 5.16.10 LTE Frame Summary Screen the physical signals and channels are expressed in dBm/RE which is the signal level per resource element. If the sector uses MIMO, then the Antenna Port soft key can be used to display the signals from each of the up to four antennas (if applicable) labeled 0 to 3. Sage Instruments • UCTT User Manual Rev E 2/2013 Page 84 5.16.2.7 LTE Cell-ID Scanner Screen The LTE Cell-ID scanner screen is pictured in Figure 5.16.11. This screen displays a list of all the sectors detected at the given center frequency. The grid in the upper portion of the screen can display up to nine received sectors. The strongest sector is at the top of the list. The synchronization signal power, delay and dominance are displayed for each sector. The broadcast channel and resource signals for the strongest sector are displayed In the lower portion of the screen. Note that all levels are in dBm per Resource Element units. The signal to noise ratio is determined by measuring the ratio of the synchronization signals to the adjacent guard band energy. Figure 5.16.11 LTE Cell-ID Scanner Screen 5.16.2.8 LTE MIMO Scanner Screen The LTE MIMO Scanner screen is pictured in Figure 5.16.12 The MIMO scanner screen displays the reference signal measurements for up to four antenna ports if applicable. The power, error vector magnitude, dominance and delay for the reference signals from each antenna port are displayed in the Reference Signal window at the top of the screen. The synchronization signals and broadcast channel measurements for the sector are displayed along with the total power, resource utilization, signal to noise and frequency offset are displayed in the lower portion of the screen. Figure 5.16.12 LTE MIMO Scanner Screen 5.16.2.9 MIMO Setup Menu The MIMO Setup soft key circled in Figure 5.16.12 is used to set the maximum valid EVM and minimum valid Dominance thresholds for detecting valid signals. When an EVM measurement is more than the EVM minimum, the display will indicate --. When a dominance measurement is less then the minimum Dominance threshold then the Dominance measurement is displayed in red, otherwise it is green. Sage Instruments • UCTT User Manual Rev E 2/2013 Page 85 5.16.2.10 LTE Frame View Screen The LTE Frame View screen is pictured in Figure 5.16.13 The Frame View screen displays a graphical representation of time slots versus resource blocks for an entire frame. The first time slot row is displayed in bar graph form at the bottom of the screen. The colored legend on the y axis of the bottom graph is used as the activity indicator for the upper portion of the display. Additionally, at the top of the screen are signal measurements for the sector. 5.16.2.11 LTE Power vs Time Screen The LTE Power vs Time screen is pictured in Figure 5.16.13 LTE Frame View Screen Figure 5.16.14. This screen displays the subcarriers versus symbol number. The subcarrires are the individual bars that are proportional in height to the signal strength. On the x axis are the OFDM symbol numbers labeled 0 to 139 for normal CP and 0 to 119 for extended CP. Additionally, at the top of the screen are signal measurements for the sector. 5.16.2.12 Subcarrier Soft Key The Subcarrier soft key circled on the right side of Figure 5.16.14 is used to select the subcarriers to display. The options are to average all the subcarriers, or to select individual subcarriers to view. Pressing the Subcarrier soft key will toggle between the Average all mode and the individual subcarrier display mode. Note that subcarrier numbers vary depending on the LTE Bandwidth for example the 1.4 Mhz channel has 72 subcarriers while the 20 Mhz channel has 1200 subcarriers. 5.16.2.13 Marker Soft Key The Marker menu is accessed by pressing the circled Marker soft key at the bottom of Figure Figure 5.16.14 LTE Power vs Time Screen 5.16.14. This menu allows two markers to be defined to make precise measurements anywhere on the displayed, additionally the Marker soft key indicates the differences between the x and y values for the two markers. For more information on using markers refer to the Marker section of this manual. Sage Instruments • UCTT User Manual Rev E 2/2013 Page 86 5.16.2.14 LTE Subcarrier View Screen The LTE Subcarrier View screen is pictured in Figure 5.16.15. This screen displays the subcarriers for a given symbol number. The y xais is the signal amplitude and the x axis is the subcarrier number. Additionally, at the top of the screen are signal measurements for the sector. 5.16.2.15 Symbol Number Soft Key The Symbol # soft key circled right edge of Figure 5.16.15 is used to select the OFDM symbol number to display subcarriers for. Pressing the Symbol key will allow the user to enter a symbol number. Valid symbol numbers are 0 to 139 for normal CP and 0 to 119 for extended CP. 5.16.2.16 Marker Soft Key Figure 5.16.15 LTE Subcarrier View Screen The Marker menu is accessed by pressing the circled Marker soft key at the bottom of Figure 5.16.15. This menu allows two markers to be defined to make precise measurements anywhere on the displayed, additionally the Marker soft key indicates the differences between the x and y values for the two markers. For more information on using markers refer to the Marker section of this manual. 5.16.2.17 LTE Modulation Screen The LTE Modulation screen is pictured in Figure 5.16.16. This screen displays the modulation constellations for the different physical channels in the LTE signal. Additionally, at the left side of the screen are signal measurements for the sector. 5.16.2.18 Physical Channel Soft Key Figure 5.16.16 LTE Modulation Screen The Phy Channel soft key circled in Figure 5.16.15 is used to select the physical channel to display on the modulation window. Pressing the Phy Channel soft key will bring up the Physical Channel Selection menu pictured in Figure 5.16.17. The user can select a phusical channel by pressing the desired menu item followed by the OK button. Figure 5.16.17 Physical Channel Selection Sage Instruments • UCTT User Manual Rev E 2/2013 Page 87 5.16.2.19 LTE Multi-Path Screen The LTE Multi-Path screen is pictured in Figure 5.16.18. This screen displays the time domain plot of energy around the center frequency. The plot indicates the amount of multipath interference. The phase spreading from multi-path interference causes the apex of the plot to become wider, indicating more interference. 5.16.2.20 LTE Spectral Screen The spectral emissions mask screen is used to evaluate the output signal of a base station transmitter against 3GPP TS104 emission limit tables. In most cases the UCTT will be connected to the transmitter via an attenuator, directional coupler or air interface. In order for the UCTT to apply the proper mask, the Ref Lvl Offset parameter in the Frequency Setup menu should be set to compensate for any loss due to the connection arrangement. The Spectral Emissions Mask screen is pictured in Figure 5.16.19. The screen displays the measured signal trace and the applicable ETSI mask. In the upper right corner of the screen is the Pass/Fail indicator for the test. At the bottom of the screen is the channel power level as well as the number of the ETSI table used for the mask. The UCTT automatically applies the proper ETSI table depending on the frequency band and signal power. Figure 5.16.18 LTE Multi-Path Screen Figure 5.16.19 LTE Spectral Emissions Mask Screen Figure 5.16.20 Base Station Type/Cat Selection Sage Instruments • UCTT User Manual Rev E 2/2013 Page 88 5.16.2.21 Base Station Type/Category Soft Key Pressing the SEM Table soft key circled in Figure 5.16.19 will bring up the the Base Station type and category selection menu. 5.16.2.22 Optional Table Selection Soft Key The Addl Reqts soft key located below the circled key in Figure 5.16.19 is used to select additional requirements tables for the spectral emissions mask. Pressing the soft key will bring up the optional table selection menu pictured in Figure 5.16.21. The user can select additional tables from this menu. 5.16.3 LTE Logging Menu The LTE Logging Menu is used to configure logging functions. The Logging menu is pictured in Figure 5.16.22 and is accessed by pressing the highlighted Logging soft key located at the bottom of the menu. The logging parameter soft keys are on the right side of the menu. The logging function is available for the PASS/Fail, RF View, Frame Summary, Cell ID and MIMO Scanner screens. If logging is enabled, the data displayed on the measurement screen is also captured to a log file. The file names are LTE RF_mm_dd_yyyy_n.csv.kml, LTE Summary_mm_dd_yyyy_n.csv.kml, LTE Scanner_mm_dd_yyyy_n.csv/kml and LTE Pass-Fail_ mm_dd_yyyy_n.csv/kml. Where mm_dd_yyyy is the date and n is a counter that starts at zero. For more information on retrieving log files from the UCTT refer to the exporting log and data files section of the manual. 5.16.3.1 Setting Logging Units and Interval 5.16.21 Optional Table Selection Menu Figure Figure 5.16.22 LTE Logging Menu The Log Units soft key circled in Figure 5.16.22 is used to specify the logging units. The options are Seconds or Results. This causes logging to occur every N seconds or N results where N is set by the Log Every soft key located above the circled Log Units key. The labels on the Log Units and Log Every soft keys indicate the number and units selected. 5.16.3.2 Setting Log File Format The Log Format soft key located below the circled key in Figure 5.16.22 is used to specify the file format for the log file. The choices are CSV or KML. Note that KML files can be opened in Google earth showing measurement and location data. 5.16.3.3 Enable/Disable Logging The Logging soft key is located in the lower right corner of Figure 5.16.22. This soft key is used to enable or disable the logging function. Pressing the key will toggle between enabled and disabled states. The current logging state is displayed in this soft key as well as the highlighted Logging menu key at the bottom of the screen. Sage Instruments • UCTT User Manual Rev E 2/2013 Page 89 5.16.4 LTE Measurements Technical Description All LTE metrics (power level, frequency offset and EVMs etc) are measured and averaged across the whole 10 ms frame. At each measurement cycle, the UCTT captures a new frame of signal. It uses the PSS and SSS (Primary and Secondary Sync Signals) to establish the proper frame boundary and decode the cell ID. The reference signals from an antenna port selected by the user are used to estimate the carrier frequency offset. The frequency offset correction is then applied to all the symbols within the 10 ms frame. The reference signals are also used to further refine the symbol-timing boundary. Next, all REs (Resource Elements) carrying the reference signals from each antenna port are extracted to construct the respective channel response from that transmit antenna using least-squares method. The number of TX antenna ports (1, 2 or 4) are automatically detected. The estimated channel responses and the detected number of TX antenna ports information are then used to “deconvolve” the signals from different TX antennas and restore the “original” modulation symbols prior to layer mapping and precoding. The estimated channel response is first used to equalize the reference signal itself. The modulation quality measurement (EVM) is then performed on the equalized reference signal. The SNR measurement is also derived from the equalized reference signal. The deconvolution process is then applied to all downlink channels. More specifically, all PBCH, PCFICH, PHICH and PDCCH channels within the whole 10 ms frame are extracted, deconvolved, measured and averaged. However, the user-data-carrying PDSCH channel is treated differently. In a realistic world, the PDSCH channel within the whole 10 ms frame may contain a lot of dynamic variations. It may contain data from multiple users with varying power levels and varying modulation patterns (from QPSK, to QAM16 and QAM64) and even varying MIMO schemes (from TX diversity to Spatial Multiplexing or single antenna port transmission). To combat such dynamic variations, Sage UCTT measures the PDSCH signals per each 1 ms subframe. The subframe in which the PDSCH channel has the best modulation quality is then presented. This is why the PDSCH channel’s EVM is generally better than the other control channels. Higher modulation density (QAM16 and 64 versus QPSK) also tends to yield lower EVM value since EVM is a power-normalized measurement. The PSS and SSS are measured in their “raw” form. That is, the channel response obtained from the reference signal is not used to equalize the PSS and SSS signals. The PSS and SSS signals do not necessarily come from the same antenna port that transmits the reference signals. So, generally, the PSS and SSS’s quality may appear worse than the other channels. This measurement more closely predicts how a UE device (an LTE modem or phone) would perceive the signals. The PSS and SSS signals are the first thing that a UE must detect before it can grasp the reference signals and forms a channel response estimation. The PSS and SSS signals occur twice within the 10 ms frame (once every 5 ms). In real world deployment, it was found that the two instances of the PSS/SSS signals may have dramatically different power levels (may differ by more than 10 dB). UCTT selects the instance with higher power and presents the quality and power metrics of that instance only. All control channels (PBCH, PCFICH, PHICH and PDCCH) are transmitted via transmit diversity when 2 or 4 TX antenna ports are utilized. UCTT can always decode and deconvolve these channels with no issue. However, the PDSCH channel sometimes can be transmitted via spatial multiplexing scheme. To decode such signal requires multiple RX antennas. Since current version of UCTT only has one RX antenna, the PDSCH signal transmitted in this scheme will then be presented as undeconvolvable cloudy random signals, resulting in momentary high EVM value (higher than 25%, typically). 5.17 WiMAX Application As of the publication date of this manual the WiMAX application is not currently completed. Contact Sage for more information about the availability of this feature. Sage Instruments • UCTT User Manual Rev E 2/2013 Page 90 5.18 Adjacent Channel Power Application The Adjacent Channel Power application is used to analyze the out of band power generated by a transmitter. The signal to be analyzed is connected to the RF Input of the UCTT, this is not an over the air test. For more information on the UCTT RF connectors refer to the Connector Panel section of this manual. The Adjacent Channel Power Application is selected by pressing the front panel Mode button, then pressing the circled ACP soft key shown in Figure 5.18.1. 5.18.1 Adjacent Channel Power Frequency Menu The Adjacent Channel Power frequency menu is accessed by pressing the Frequency soft key in the lower left corner of the screen in Figure 5.18.2. The soft keys along the right side of the screen are used for entering the frequency menu parameters described in the following sections. Figure 5.18.1 ACP Application Selection 5.18.1.1 Frequency Parameters Soft Keys In the Adjacent Channel Power application, the channel plan and channels are used to set the frequency of the scanner. The three soft keys on the lower right side of Figure 5.18.2 are used to set the channel plane, channel and channel bandwidth. Pressing the Channel Plan soft key will bring up the channel plan selection menu shown in Figure 5.18.3. This list contains the channel plan names and frequency ranges for each plan. Pressing the RF Standard or Frequency buttons circled in Figure 5.18.3 will sort the list based on channel plan name or by frequency range. Additionally at the bottom of the channel plan selection screen is a list of valid channels Figure 5.18.2 ACP Frequency Menu for the selected plan. To select a plan press the desired channel plan followed by the OK button at the bottom of the menu. The Channel soft key is used to enter the channel which will set the center frequency. If an LTE channel plan is selected, the channel bandwidth can be specified using the Ch BW soft key located in the bottom right of Figure 5.18.2. The bandwidth settings are 1.4, 3, 5, 10 and 20 MHz. 5.18.2 Adjacent Channel Power Amplitude Menu The Adjacent Channel Power amplitude menu is selected by pressing the circled soft key at the bottom of Figure 5.18.2. The menu is shown in Figure 5.18.4. The soft keys Figure 5.18.3 Channel Plan Selection Menu Sage Instruments • UCTT User Manual Rev E 2/2013 Page 91 along the right edge of the screen are used to modify the amplitude parameters. 5.18.2.1 Setting the Reference Level The Ref Level soft key located in the upper right corner of Figure 5.18.4 is used to adjust the reference level of the analyzer, this will have the effect of shifting the signal trace up or down on the screen. Once the key is pressed the user can enter a value, or touch the screen where the reference level should be set. Pressing the Auto Scale soft key will cause the UCTT to automatically determine the reference level based on the current signal power level. 5.18.2.2 Setting the Display Scale The Scale soft key is used to adjust the scale of the display in dB per division. The current scale value is displayed on the Scale soft key as well as the Amplitude menu key. Figure 5.18.4 ACP Amplitude Menu 5.18.2.3 Setting Offset Level The Ref Lvl Offset soft key is used to apply a fixed offset to the signal. This is useful when viewing high power signals where an attenuator is connected between the UCTT and the signal source. The applied offset value is displayed on the Ref Lvl Offset soft key. 5.18.2.4 Controlling the Preamp The Preamp soft key is used to control the state of the internal preamplifier in the UCTT. The default setting for the preamplifier is off. The preamplifier is useful for increasing the signal to noise ratio for low level signals less than -50 dB. Note that turning on the preamplifier when higher signal levels are present can cause instability and erroneous measurements to occur. Sage Instruments • UCTT User Manual Rev E 2/2013 Page 92 5.18.3 Logging Menu The Adjacent Channel Power measurements can be recorded to a log file. The Adjacent Channel Power Logging Menu is used to configure logging functions. The Logging menu is pictured in Figure 5.20.5 and is accessed by pressing the highlighted Logging soft key located at the bottom of the menu. The logging parameter soft keys are on the right side of the menu. If logging is enabled, the data displayed on the measurement screen is also captured to a log file. The log file is named Adjacent Channel Power_mm_dd_yyyy_n.csv/ kml. Where mm_dd_yyyy is the date and N is a counter that starts at zero. For more information on retrieving log files from the UCTT refer to the exporting log and data files section of the manual. Figure 5.18.5 ACP Logging Menu 5.18.3.1 Setting Logging Units and Interval The Log Units soft key circled in Figure 5.18.5 is used to specify the logging units. The options are Seconds, Meters or Results. This causes logging to occur every N seconds, N meters or N results where N is set by the Log Every soft key located above the circled Log Units key. The labels on the Log Units and Log Every soft keys indicate the number and units selected. 5.18.3.2 Setting Log File Format The Log Format soft key located below the circled key in Figure 5.18.5 is used to specify the file format for the log file. The choices are CSV or KML. Note that KML files can be opened in Google earth showing measurement and location data. 5.18.3.3 Enable/Disable Logging The Logging soft key located in the lower right corner of Figure 5.18.5. This soft key is used to enable or disable the logging function. Pressing the key will toggle between enabled and disabled states. The current logging state is displayed in this soft key as well as the highlighted Logging menu key at the bottom of the screen. Sage Instruments • UCTT User Manual Rev E 2/2013 Page 93 5.19 Spectrogram Application The Spectrogram application is used to display the frequency spectrum of a signal over time. This signal is displayed in a histogram format. The signal to be analyzed is connected to the RF Input of the UCTT. An antenna is used for over the air measurements. For more information on the UCTT RF connectors refer to the Connector Panel section of this manual. The Spectogram Application is selected by pressing the front panel Mode button, then pressing the circled SpecGram soft key shown in Figure 5.19.1. 5.19.1 Spectrogram Frequency Menu The Spectrogram frequency menu is accessed by pressing the Frequency soft key in the lower left corner of the screen in Figure5.19.2. The soft keys along the right side of the screen are used for entering the frequency menu parameters described in the following sections. 5.19.1.1 Frequency Parameters Figure 5.19.1 Spectrogram Application Selection There are three methods for setting up the Spectrogram frequency parameters, specifying center frequency and span or by specifying the start and stop frequencies, or by specifying the Channel Plan and Channel. The corresponding pairs of soft keys for each method are circled in Figure 5.19.2. In the first case the center frequency and the display span are entered using the Center Freq and Span soft keys. The UCTT will automatically set the start and stop frequencies based on the center frequency and span parameters. The other method for setting the Spectrogram frequency parameters is to enter the stop and start frequencies using the Start Freq and Stop Freq soft keys. In this case the UCTT will deterFigure 5.19.2 Spectrogram Frequency Menu mine the center frequency and span based on the entered start and stop frequencies. The third method for setting the frequency parameters is to use the Channel Plan and Channel soft keys. In this case the center frequency and span are automatically determined based on the channel plan and channel selected. Pressing the Channel Plan soft key will bring up the channel plan selection menu shown in Figure 5.19.3. This list contains the channel plan names and frequency ranges for each plan. Pressing the RF Standard or Frequency buttons circled in Figure 5.19.3 will sort the list based on channel plan name or by frequency range. Additionally at the bottom of the channel plan selection screen is a list of valid channels for the selected plan. To select a plan press the desired channel plan followed by the OK button at the bottom of the menu. To leave the Channel Plan mode simply press one of the Center Freq, Span, Start or Stop frequency soft keys. The Span soft key can also be used to toggle the Zero Span Figure 5.19.3 Channel Plan Selection Menu display mode. In this mode the analyzer displays the time domain plot of the desired frequency much like an oscilloscope trace. Sage Instruments • UCTT User Manual Rev E 2/2013 Page 94 5.19.1.2 Freq Step Soft Key The Freq Step soft key circled in Figure 5.19.4 is used to specify the frequency step for each detent in the selection wheel. In the automatic mode each detent is one hundredth of the span frequency. For example a 100 Mhz span would have frequency steps of 1 Mhz. The desired frequency step can be changed from the Auto mode by pressing the Freq Step soft key and entering a new value. When this is done the frequency step value will be displayed in the Freq Step soft key. 5.19.1.3 Run/Pause Soft Key The Run/Pause soft key at the bottom of Figure 5.19.4 is used to start and stop the Spectrogram measurements, this is useful for freezing the screen. The current run/pause state is indicated on the lower portion of the soft key. 5.19.2 Spectrogram Amplitude Menu The Spectrogram amplitude menu is selected by pressing the circled soft key in Figure 5.19.5. The soft keys along the right edge of the screen are used to modify the amplitude parameters. Figure 5.19.4 Frequency Parameters Soft Keys 5.19.2.1 Setting the Reference Level The Ref Level soft key is used to adjust the reference level of the analyzer, this will have the effect of shifting the signal trace up or down on the screen. Once the key is pressed the user can enter a value, or touch the screen where the reference level should be set. Pressing the Auto Scale soft key will cause the UCTT to automatically determine the reference level based on the current signal power level. 5.19.2.2 Setting the Display Scale The Scale soft key is used to adjust the scale of the display in dB per division. The current scale value is displayed on the Scale soft key as well as the Amplitude menu key circled in Figure 5.19.5. Figure 5.19.5 Spectrogram Amplitude Menu 5.19.2.3 Setting Offset Level The Ref Lvl Offset soft key is used to apply a fixed offset to the signal. This is useful when viewing high power signals where an attenuator is connected between the UCTT and the signal source. The applied offset value is displayed on the Ref Lvl Offset soft key as well as the Amplitude menu soft key circled in Figure 5.19.5. 5.19.2.4 Controlling the Preamp The Preamp soft key is used to control the state of the internal preamplifier in the UCTT. The default setting for the preamplifier is off. The preamplifier is useful for increasing the signal to noise Sage Instruments • UCTT User Manual Rev E 2/2013 Page 95 ratio for low level signals less than -50 dB. Note that turning on the preamplifier when higher signal levels are present can cause instability and erroneous measurements to occur. 5.19.3 Spectrogram Bandwidth Menu The UCTT utilizes a DSP based Fourier transform to create the measurement display presented to the user. Thousands of measurements per second are recorded. The Bandwidth menu pictured in Figure 5.19.6, provides several options for controlling the measurement resolution as well as the filtering and averaging of the multiple measurements to create the displayed trace. The Bandwidth soft key circled in Figure 5.19.6 indicates some of the Bandwidth menu parameters as well as the frames per second (FPS) that measurements are made or displayed. The FPS indicator depends on the state of the Trace Mode parameters and will be explained in that section. 5.19.3.1 Resolution Bandwidth Soft Key The Res BW soft key is used to set the resolution of the DSP’s individual measurements that create a trace. The default setting for this parameter is automatic, where the UCTT sets the resolution bandwidth at one one thousandth of the span frequency, thus giving 1000 measurements for the Figure 5.19.6 Spectrogram Bandwidth Menu frequency span. Pressing the Res BW soft key located in the upper right corner of Figure 5.19.6 will allow the user to manually set the resolution bandwidth. When the resolution bandwidth is increased, the DSP measurement can take longer to process. The maximum resolution bandwidth setting is 100 Hz. 5.19.3.2 # Average Soft Key The # Avg will set the number of traces that will be averaged together to form the displayed trace. Averaging traces produces a more stable display, however averaging will make spurious signals less visible. The averaging parameter only applies when the Trace Mode parameter is set to Normal otherwise it is ignored by the UCTT. Pressing the # Avg soft key will allow the user to enter a new value, pressing the soft key twice will turn off averaging. Sage Instruments • UCTT User Manual Rev E 2/2013 Page 96 5.19.3.3 Trace Mode Soft Key The UCTT has several trace modes that are useful for for detecting various signal conditions. When the Trace Mode soft key is pressed the Change Trace Mode menu is presented as shown in Figure 5.19.7. There are five trace modes to select from. Pressing the desired trace mode, followed by the OK button in the lower left corner of the menu will change the trace mode parameter. In the Normal trace mode, the DSP records and averages, if applicable, the multiple traces into one displayed trace. In this mode, the Frames Per Second (FPS) indicator displays the number of times the display is updated (about 20 FPS), unless the resolution bandwidth is so great that the DSP frame rate is less than the display frame rate, in this case the DSP frame rate is displayed. In the Peak Hold trace mode the DSP creates a trace from the maximum values measured at each frequency point for successive measurements. These maximum values are retained for the duration of the test, or are reset when the front panel ESC key is pressed. In this mode the DSP measurement frame rate is displayed in the FPS indicator on the Bandwidth soft key. Figure 5.19.7 Spectrogram Trace Mode Menu In the Continuous Peak trace mode, the DSP creates a trace from the maximum values measured at each frequency point for successive measurements. These maximum values are displayed, and then reset each time the trace is presented to the user which is approximately 20 times per second. In this mode the DSP measurement frame rate is displayed in the FPS indicator on the Bandwidth soft key. In the Max Burst trace mode, the DSP saves the trace with the maximum total power. This trace is displayed until a trace with more power is detected, or the user resets the test by pressing the ESC key. In this mode the DSP measurement frame rate is displayed in the FPS indicator on the Bandwidth soft key. Note that due to DSP measurement limitations, the Max Burst trace mode cannot be selected when the frequency span parameter is greater than 15 MHz. In the Continuous Burst trace mode, the DSP saves the trace with the maximum total power. This maximum power trace is displayed, and then reset each time the trace is presented to the user which is approximately 20 times per second. In this mode the DSP measurement frame rate is displayed in the FPS indicator on the Bandwidth soft key. Note that due to DSP measurement limitations, the Continuous Burst trace mode cannot be selected when the frequency span parameter is greater than 15 MHz. Sage Instruments • UCTT User Manual Rev E 2/2013 Page 97 5.19.3.4 Window Type Soft Key The Window Type parameter determines the type of filter that is used by the DSP prior to making its measurements. When the Window Type soft key circled on the right edge of Figure 5.19.9 is pressed, the Select Window Function menu shown in Figure 5.19.8 is displayed. The user can select a window function by pressing the desired window function followed by the OK button in the lower left corner. The default window function is Kaiser. Note refer to the Manual Attenuator Adjustment section of the manual if Uniform or Blackman window functions are selected. Figure 5.19.8 Spectrogram Window Function Menu 5.19.3.5 Overlay Soft Key The Overlay soft key located below the circled soft key on the right side of Figure 5.19.9 is used to display a previously stored measurement trace on top of the currently displayed measurement trace. Before using the Overlay soft key a previously stored trace must be recalled. Refer to the Saving and Recalling Measurement Results section of the manual for more information on storing and recalling display traces. Once a stored trace is recalled, pressing the Overlay soft key will cause the recalled trace to be displayed over the current measurement trace. In addition to the recalled trace, the file name, any user comments and the test parameters for the overlay are also displayed at the bottom of the screen. 5.19.4 Spectrogram Record/Playback Soft Key Figure 5.19.9 Spectrogram Window Function Menu The Record/Playback soft key is located in the upper right corner of the Bandwidth menu pictured in Figure 5.19.9. The record playback function allows recording of the spectrogram trace to a file. Recorded traces can also be played back. Pressing the Record/Playback soft key will bring up the Record/Playback menu shown in Figure 5.19.10. The circled buttons at the top of the menu are used to switch between record and playback modes. In the record mode, touching the file entry box will bring up a keyboard so the new file name can be entered. In the playback mode, touching the file entry box will bring up a list of recorded files if applicable. In the record mode, the Record frequency and duration can be specified by touching the labeled text entry boxes. Recording or playback is started by pressing the Start Now soft key in the lower left of the menu. Figure 5.19.10 Record/Playback Menu Sage Instruments • UCTT User Manual Rev E 2/2013 Page 98 5.19.5 Spectrogram Marker Menu The Marker Menu is pictured in Figure 5.19.11, it is accessed by pressing the highlighted Marker soft key located at the bottom of the menu. This menu is used to display and manipulate markers on the measurement screen. These markers can be used to make precise readings of frequency and level at user specified points on the displayed trace. Furthermore, differences in frequency and levels can be calculated between markers. Refer to the UCTT Marker Menus section of this manual for more information on the marker menus. 5.19.6 Manual Attenuator Adjustment In normal operations the UCTT employs an automatic attenuator to maximize the dynamic range of its measurement circuits. This automatic atFigure 5.19.11 Spectogram Marker Menu tenuator sets the optimal input level based on the input signal energy. In some measurement environments the user may find it useful to disable the automatic attenuator and manually control the attenuator settings. Refer to the Manual Attenuator Adjustment section of this manual for more information on this topic. Sage Instruments • UCTT User Manual Rev E 2/2013 Page 99 5.20 Channel Scanner Application The Channel Scanner application is used to display the energy in selected channels in a slice of spectrum. This channel power is displayed in a bar graph format. The signal to be analyzed is connected to the RF Input of the UCTT. An antenna can be used for over the air measurements. For more information on the UCTT RF connectors refer to the Connector Panel section of this manual. The Channel Scanner Application is selected by pressing the front panel Mode button, then pressing the circled ChanScan soft key shown in Figure 5.20.1. 5.20.1 Channel Scanner Frequency Menu The Channel Scanner frequency menu is accessed by pressing the Frequency soft key in the lower left corner of the screen in Figure 5.20.2. The soft keys along the right side of the screen are used for entering the frequency menu parameters described in the following sections. Figure 5.20.1 Channel Scanner Selection 5.20.1.1 Frequency Parameters Soft Keys In the Channel Scanner application, the channel plan and channels are used to set the frequency of the scanner. The circled soft keys on the right side of Figure 5.20.2 are used to set the channel plane and channel. Pressing the Channel Plan soft key will bring up the channel plan selection menu shown in Figure 5.20.3. This list contains the channel plan names and frequency ranges for each plan. Pressing the RF Standard or Frequency buttons circled in Figure 5.20.3 will sort the list based on channel plan name or by frequency range. Additionally at the bottom of the channel plan selection screen is a list of valid channels for the selected plan. To select a plan press the desired channel plan followed by the OK button at the bottom of the menu. The Channel soft key is used to enter a list or range of channels to scan. A maximum of 20 channels can be scanned at a time. Figure 5.20.2 Channel Scanner Frequency Menu 5.20.2 Channel Scanner Amplitude Menu The Channel Scanner amplitude menu is selected by pressing the circled soft key at the bottom of Figure 5.20.2. The menu is shown in Figure 5.20.4. The soft keys along the right edge of the screen are used to modify the amplitude parameters. Figure 5.20.3 Channel Plan Selection Menu Sage Instruments • UCTT User Manual Rev E 2/2013 Page 100 5.20.2.1 Setting the Reference Level The Ref Level soft key located in the upper right corner of Figure 5.20.4 is used to adjust the reference level of the analyzer, this will have the effect of shifting the signal trace up or down on the screen. Once the key is pressed the user can enter a value, or touch the screen where the reference level should be set. Pressing the Auto Scale soft key will cause the UCTT to automatically determine the reference level based on the current signal power level. 5.20.2.2 Setting the Display Scale The Scale soft key is used to adjust the scale of the display in dB per division. The current scale value is displayed on the Scale soft key as well as the Amplitude menu key. 5.20.2.3 Setting Offset Level Figure 5.20.4 Channel Scanner Amplitude Menu The Ref Lvl Offset soft key is used to apply a fixed offset to the signal. This is useful when viewing high power signals where an attenuator is connected between the UCTT and the signal source. The applied offset value is displayed on the Ref Lvl Offset soft key. 5.20.2.4 Controlling the Preamp The Preamp soft key is used to control the state of the internal preamplifier in the UCTT. The default setting for the preamplifier is off. The preamplifier is useful for increasing the signal to noise ratio for low level signals less than -50 dB. Note that turning on the preamplifier when higher signal levels are present can cause instability and erroneous measurements to occur. 5.20.3 Logging Menu The Channel Scanner measurements can be saved to a log file. The Channel Scanner Logging Menu is used to configure logging functions. The Logging menu is pictured in Figure 5.20.5 and Figure 5.20.5 Channel Scanner Logging Menu is accessed by pressing the highlighted Logging soft key located at the bottom of the menu. The logging parameter soft keys are on the right side of the menu. If logging is enabled, the data displayed on the measurement screen is also captured to a log file. The file name is Channel Scanner_mm_dd_yyyy_n.csv/kml. Where mm_dd_yyyy is the date and n is a counter that starts at zero. For more information on retrieving log files from the UCTT refer to the exporting log and data files section of the manual. Sage Instruments • UCTT User Manual Rev E 2/2013 Page 101 5.20.3.1 Setting Logging Units and Interval The Log Units soft key circled in Figure 5.20.5 is used to specify the logging units. The options are Seconds, Meters or Results. This causes logging to occur every N seconds, N meters or N results where N is set by the Log Every soft key located above the circled Log Units key. The labels on the Log Units and Log Every soft keys indicate the number and units selected. 5.20.3.2 Setting Log File Format The Log Format soft key circled in Figure 5.20.6 is used to specify the file format for the log file. The choices are CSV or KML. Note that KML files can be opened in Google earth showing measurement and location data. Figure 5.20.6 Channel Scanner Logging Menu 5.20.3.3 Enable/Disable Logging The Logging soft key located in the lower right corner of Figure 5.20.5. This soft key is used to enable or disable the logging function. Pressing the key will allow the user to toggle between enabled and disabled states. The current logging state is displayed in this soft key as well as the highlighted Logging menu key at the bottom of the screen. Sage Instruments • UCTT User Manual Rev E 2/2013 Page 102 5.21 Vector Signal Generator Application The Vector Signal Generator (VSG) application is used to generate RF signals. The RF Output of the UCTT is connected to the circuit under test. Unlike other applications, the VSG can run in the background while other test applications are running, providing a test signal for other measurements. The VSG Application is selected by pressing the front panel Mode button, then pressing the circled VSG soft key shown in Figure 5.21.1. 5.21.1 Vector Signal Generator Menu The VSG menu is shown in Figure 5.21.2. The Frequency and Level soft keys in the upper right corner are used to specify the frequency and level of the signal. The current center frequency, channel level and modulation settings are displayed at the top of the screen. Note that the center frequency can be set in a previous application such as the spectrum analyzer. If the center frequency is set in another application using the Channel Plan and Channel method, the VSG application will inherit the center frequency and channel number when it is started. The Modulation soft key circled in Figure 5.21.2 is used to specify the type of modulation to apply to the signal. Pressing the Modulation key will bring up the Modulation menu pictured in Figure 5.21.3. The user can select the desired modulation from the list. Note that the WiMAX modulation is not implemented. Also the CDMA, LTE and WCDMA signals are spectrally correct, however due to hardware limitations the framing is incomplete having only an 8 ms period. Figure 5.21.1 VSG Application Selection Figure 5.21.2 VSG Menu Figure 5.21.3 VSG Modulation Menu Sage Instruments • UCTT User Manual Rev E 2/2013 Page 103 5.21.2 Vector Signal Generator Transmitter Control The VSG transmitter is controlled with the Run/ Stop soft key located in the lower right corner of the menu. When the transmitter is turned on the transmitter status indicator in the center of the screen indicates On. This status is also indicated in the Control and Rnu/Stop soft keys at the bottom of the screen. The transmitter on status is also indicated by the VSG Lock ON! message circled at the top of Figure 5.21.4. This message appears at the top of all UCTT menu screens when the transmitter is running in the background to remind the user of its status. The transmitter consumes a significant amount of power, so it should be turned off when not in use to conserve battery life. Sage Instruments • UCTT User Manual Rev E 2/2013 Page 104 Figure 5.21.4 VSG Transmitter On 6. Backhaul Tests 6.1 Ethernet Application The Ethernet application is used to test ethernet backhaul facilities at 10BaseT, 100BaseT and 1000BaseT speeds. The tests are performed per the RFC 2544 specification. Tests supported are Throughput, Latency, Frame Loss and Back-to-Back. The Throughput test determines the maximum number of frames per second that can be transmitted without any dropped frames. The Latency test measures the amount of time it takes for a frame to traverse the network. The Frame loss test produces a graph of percent frame loss versus frame rate. The Back to Back test measures the maximum number of frames that can be sent at full speed with no frames dropped. The UCTT can automatically run the tests using the eight recommended frame sizes from 64 to 1518 bytes. The test signals are connected to the RJ-45 connectors labeled ENT 1 and ENT 2, these are also referred to as Port 1 & 2 in the menus. For more information on the Ethernet connectors refer to the Connector Panel section of this manual. The Ethernet application is selected by pressing the front panel Mode button, then pressing the circled RFC 2544 soft key shown in Figure 6.1.1. The UCTT can be equipped with ether a T1/E1 or Ethernet interfaces. If the circled mode button in Figure 6.2.1 is labeled DS1 BERT then the UCTT has the T1/E1 hardware and cannot perform Ethernet testing without a hardware and option change. Figure 6.1.1 Ethernet Application Selection 6.1.1 Ethernet Setup Menus The Ethernet setup menu is pictured in Figure 6.1.2. This is the startup menu for the application and is used to select the different interface setup menus. It can also be accessed by pressing the highlighted Ethernet Setup soft key located in the lower left corner of the screen. This soft key also displays the status of the ethernet links. The soft keys on the right edge of the menu are used to select among the different setup menus. Figure 6.1.2 Ethernet Port Setup Menu 6.1.1.1 Port Setup Menu The highlighted Port soft key in the upper right corner of Figure 6.1.12 is selected and the Port setup menu is displayed. The two buttons circled at the top of the screen are used to select between the ethernet ports. Below the Port selection buttons is the interface status indicator. This shows the status of the selected interface. Valid states are OK and No Link, the Sage Instruments • UCTT User Manual Rev E 2/2013 Page 105 speed and duplexing are also displayed here in short hand form. The Speed selection box allows the user to select the interface speed. Pressing the down arrow button in the Speed text box will bring up a list of speeds to select from. The UCTT supports 10BaseT, 100BaseT and 1000BaseT at both full and half duplex. There is also an auto speed option where the UCTT will automatically determine the interface speed. 6.1.1.2 Network Setup Menu Pressing the Network soft key located below the Port key will bring up the network setup menu pictured in Figure 6.1.3. This menu is used to setup the IP address for the interfaces. The Port 1 & 2 buttons at the top of the screen are used for selecting between the two interfaces. The Figure 6.1.3 Ethernet Network Setup Menu circled check box near the top of the screen should be checked if the network uses DHCP to assign addresses. Otherwise the IP address, netmask, gateway and DNS server if applicable can be entered below. In the bottom right of the screen is the MAC address for the network connection. 6.1.1.3 VLAN Setup Menu Pressing the circled VLAN soft key will bring up the VLAN Setup menu pictured in Figure 6.1.4. This menu is used for configuring Virtual LAN connections. If a virtual lan connection is required then press the circled Use Virtual LAN check box and enter the values for the Priority and ID Tag, otherwise leave the checkbox unchecked. 6.1.1.4 Saving and Recalling Ethernet Configurations. The ethernet configuration parameters can be saved to a file and recalled later to simplify the Figure 6.1.4 Ethernet VLAN Setup Menu test setup. Pressing the Save Cfg soft key located below the VLAN key will bring up the file entry menu. This menu will allow the user to enter a file name for the configuration file and create the file. Pressing the Load Cfg soft key located below the Save key will bring up a list of saved configuration files. The user can select and load the desired configuration file from the list. Sage Instruments • UCTT User Manual Rev E 2/2013 Page 106 6.1.2 Test Setup Menus The test setup menu displaying the Global setup screen is pictured in Figure 6.1.5. The test setup menus are used to setup global and individual test parameters. This menu is selected by pressing the highlighted Test Setup soft key located at the bottom of the screen. Soft keys for the different sub menus are located along the right edge of the screen. 6.1.2.1 Global Setup Menu In Figure 6.1.5 the Global Softkey is highlighted indicating the Global sub menu is selected. The Frame Size box at the top of the screen contains a check box tabled Auto/RFC. Checking this box will allow the UCTT to automatically run the requested test at all 8 frame sizes from 64 to 1518 bytes. If the box is unchecked, the test will run at the frame size specified in the User-Defined text box. The buttons in the Combine the Following Tests box are used to select the different tests to run. In the bottom right of the screen is the 2 Port Test check box. This check box is used to setup single ended or port to port test configurations. If this box is unchecked the test will be single port where the farend is a loopback. If the box is checked, the test will performed between two interfaces. Figure 6.1.5 Global Test Setup Menu 6.1.2.2 Destination Setup Menu Pressing the Setup Dest soft key will bring up the Setup Destination menu pictured in Figure 6.1.6. This menu is used to setup the destination parameters if applicable. If the test is running in single port mode, then the farend loopback IP address and MAC are entered at the top of the screen. Figure 6.1.6 Test Destination Setup Menu 6.1.2.3 Throughput Setup Menu Pressing the Throughput soft key will bring up the Throughput Setup menu pictured in Figure 6.1.7. This menu is used to specify the parameters for the throughput test. The circled text boxes allow the user to specify the number of Packets and number of times the test is run (Validations). These are the only parameters for this test. Figure 6.1.7 Throughput Test Setup Menu Sage Instruments • UCTT User Manual Rev E 2/2013 Page 107 6.1.2.4 Frame Loss Setup Menu Pressing the Frame Loss soft key will bring up the Frame Loss setup menu pictured in Figure 6.1.8. The circled # Packets box is used to specify the number of packets for the test. Note that this parameter is shared with the throughput test so modifying the value in one place will change it in the other. This is the only parameter for this test. 6.1.2.5 Latency Setup Menu Pressing the Latency soft key will bring up the Latency test setup menu pictured in Figure 6.1.9. The circled # Validations text box is used to specify the number of times the test is run. Note that this parameter is shared with the throughput and back-t-back tests so modifying the value in one place will change it in the others. This is the only parameter for this test. Figure 6.1.8 Frame Loss Test Setup Menu 6.1.2.6 Back-to-Back Setup Menu Pressing the Back-to-Back soft key will bring up the Back-to-Back test setup menu pictured in Figure 6.1.10. The circled # Validations text box is used to specify the number of times the test is run. Note that this parameter is shared with the throughput, and latency tests so modifying the value in one place will change it in the others. This is the only parameter for this test. Figure 6.1.9 Latency Test Setup Menu Figure 6.1.10 Back-to-Back Test Setup Menu Sage Instruments • UCTT User Manual Rev E 2/2013 Page 108 6.1.3 Test Results Screens The test result screens are used to display the progress and results for the tests. There is a summary screen as well as a results screen for each test type. The Test results menu showing the summary screen is pictured in Figure 6.1.11. The menu is selected by pressing the highlighted Test Results soft key located at the bottom of the screen. Soft keys for viewing the different results screens are located along the right edge of the menu. Note that when tests are running, pressing any of the other test soft keys (Throughput, Frame Loss, Latency and Back-to-Back) will cause the current test to be terminated. Once tests are stopped pressing one of the test result soft keys will cause the results for the test to be displayed. Figure 6.1.11 Test Results Summary Screen 6.1.3.1 Summary Results Screen In Figure 6.1.11 the Summary soft key is highlighted indicating the Summary sub menu is selected. The Summary screen displays the RFC 2544 section number and test description for the test in the Test text box at the top of the screen. Below the Test box is the Status indicator. This is the status for the test, valid states are Stopped and Running. If the test cannot run an error message is displayed for the status. Below the status is the Iteration # indicator. This displays the current iteration and the total number of iterations for the test. Below the iteration number are the Frame Size and # Packets indicators. The Packets box in the lower portion of the screen contains indicators for various packet and delay measurements for the test. These include the number of transmitted and received packets, Figure 6.1.12 Throughput Test Results Screen number of dropped packets, the percentage of packet loss, the percent load for the Ethernet link as well as the minimum, maximum, average and standard deviation for the transmission delay. The Run/ Stop soft key in the lower right corner is used to start and stop the selected test. Note that this key is also present in the other results screens. 6.1.3.2 Throughput Results Screen Pressing the Throughput soft key on the right edge of the screen will bring up the Throughput Test Results screen pictured in Figure 6.1.12. This screen displays the results for the throughput test. The test description, status, Iteration number and frame size are displayed in the upper portion of the screen. The throughput results are displayed in the lower portion of the screen on the Results box. There is a set of results for each of the eight frame sizes if applicable. The results are arranged in three columns labeled Theoretical, Actual and Average. The theoretical values represent the channels maximum potential for moving data assuming no blockage. The actual values are the measured throughput values with no errors. The average values are an average of all the measurements for the test. The circled buttons in Figure 6.1.12 are used to select the units for the displayed results. The user can Sage Instruments • UCTT User Manual Rev E 2/2013 Page 109 switch between percentages, Mega bits per second or frames per second. 6.1.3.3 Frame Loss Results Screen Pressing the Frame Loss soft key on the right edge of the screen will bring up the Frame Loss test results screen pictured in Figure 6.1.13. This screen is used to display the results for the Frame Loss test. The Test description, Status, iterations and frame size are displayed at the top of the screen. The Frame Loss results are displayed in graphical format in the lower portion of the screen. There are results for each frame size if applicable. The circled buttons are used to select the results for each of the eight frame sizes. The graphs display the percentage of lost frames versus the percentage of maximum transmission rate. Figure 6.1.13 Frame Loss Test Results Screen 6.1.3.4 Latency Results Screen Pressing the Latency soft key on the right edge of the screen will bring up the Latency test results screen pictured in Figure 6.1.14. This screen is used to display the results for the Latency test. The Test description, Status, iterations and frame size are displayed at the top of the screen. The results are displayed for each frame size if applicable. The latency results are displayed in three columns labeled Rate, Latency and Average. The Rate column is rate that the test is run, which is the rate determined by the throughput test. The Latency column is the latency measurement indicating the time it takes for the test data to traverse the network. The Average column displays the average of all the iterations of the test. The circled buttons in Figure 6.1.14 are used to select the units for the displayed results. The user can switch between percentages, Mega bits per second or frames per second. Figure 6.1.14 Latency Test Results Screen 6.1.3.5 Back-to-Back Results Screen Pressing the Back-to-Back soft key on the right edge of the screen will bring up the Back-to-Back test results screen pictured in Figure 6.1.15. This screen is used to display the results for the Back-to-Back test. The Test description, Status, iterations and frame size are displayed at the top of the screen. The results are displayed for each frame size if applicable. The number of packets transmitted back to back at full rate with no errors is displayed in the #Packets column. The average column displays the average for all iterations of the test. Figure 6.1.15 Back-to-Back Test Results Screen Sage Instruments • UCTT User Manual Rev E 2/2013 Page 110 6.1.4 Test Tools Menu The test tools menu contains network diagnostic tools such as Ping. The menu is pictured in Figure 6.1.16 and is accessed by pressing the highlighted Tools soft key at the bottom of the screen. 6.1.5 Ping Soft Key The Ping soft key located in the upper right corner of the menu is used to select the ping test. The Port 1 & 2 buttons circled at the top of the screen are for selecting an interface for the test. The Destination IP address, interval between pings, Type of Service(TOS) , Time to Live(TTL) and payload bytes parameters can be modified by the user. The Results text box at the bottom of the screen displays the test progress and results. Once the test parameters are specified pressing the Run/Stop soft key in the bottom right of the screen will run the test. Figure 6.1.16 Tools Menu Sage Instruments • UCTT User Manual Rev E 2/2013 Page 111 6.2 DS1 BERT Application The DS1 BERT application is used to test T1/E1 backhaul facilities. The test signals are connected to the RJ-45 PCM connectors labeled PCM 1 and PCM 2 these are also referred to as Span 1 & 2 in the menus. For more information on the PCM connectors refer to the Connector Panel section of this manual. The DS1 BERT application is selected by pressing the front panel Mode button, then pressing the circled BERT DS1 soft key shown in Figure 6.2.1. The UCTT can be equipped with ether a T1/E1 or Ethernet interfaces. If the circled mode button in Figure 6.2.1 is labeled RFC 2544 then the UCTT has the Ethernet hardware and cannot perform T1/E1 testing without a hardware and option change. 6.2.1 DS1 BERT Results Menu Figure 6.2.1 DS1 BERT Application The DS1 Bert Results menu is pictured in Figure 6.2.2. This is the Selection startup menu for the BERT application and can be accessed by pressing the circled Results soft key at the bottom of the screen. This menu is used to control the test and view results for each interface. The PCM1 and PCM2 soft keys in the lower left of the screen are used to select between the two PCM interfaces. The highlighted PCM soft key as well as the text at the top of the screen identifies which PCM interface is selected. The soft keys along the right edge of the screen are used to control the test and configure the PCM and BERT parameters. The Test Cfg text box near the top of the screen displays the configuration parameters for the PCM interface as well as the BERT test. Below the test configuration box is the Span Status indicator. This indicates the status of the DS1/E1 signal, valid states are Signal Loss, Frame Loss and No Errors. Below the Span Status are the BERT test results. On the lower right portion of the screen are the DS1 and Bert Current/History indicators. Green colored indicators in the current column indicate a valid condition while red colored indicators indicate a loss of signal or alarm condition. In the history column, red indicators show a loss of signal or alarm condition that occurred in the past. The three soft keys in the upper right of the screen are used for test control. The Run/Stop soft key is used to start and stop the test. The Run/Stop status is indicated in the Tx State and Rx State text boxes circled in Figure 6.2.2. The valid states for these indicators are Tx Stopped, Tx Pattern.., Rx Stopped, Attempting Sync and Figure 6.2.2 DS1 BERT Results Menu In Sync. The Reset Stats soft key can be used to reset the BERT test results as well as the history indicators. The Inject Error soft key is used to inject a single bit error into the transmitted signal. 6.2.2 T1/E1 PCM Configuration Menu The DS1/E1 PCM parameters can be modified by pressing the Cfg PCM soft key circled in the right side of Figure 6.2.2. This will cause the Sage Instruments • UCTT User Manual Rev E 2/2013 Page 112 Configure PCM menu pictured in Figure 6.2.3 to be displayed. The configuration parameters for each PCM interface are displayed in the center of the screen. The Highlighted PCM soft keys at the bottom of the screen indicate which interface is being modified and can be used to switch between interfaces. The soft keys on the right edge of the screen are used to modify the interface configuration parameters which include PCM type, Connection mode, framing, line coding, equipment type and clock source. When attaching the UCTT to monitor jacks the Connection mode should be set to Monitor otherwise the mode should be set to Terminate. If an E1 interface type is selected, the PCM configuration soft keys along the right of the menu change to reflect E1 parameter values as shown in Figure 6.2.4. Additional PCM parameters are selected by pressing the Next soft key located in the lower right corner of the screen. This will bring up the additional parameters menu, the soft keys for this menu are pictured in Figure 6.2.5. These parameters include transmit attenuation, transmitter line build out (LBO), receiver sensitivity and equalization (long/short haul), and termination impedance. Figure 6.2.3 T1 PCM Configuration Menu 6.2.3 PCM Waveform Screen Pressing the circled PCM Waveform soft key pictured in Figure 6.2.5 will bring up the PCM Figure 6.2.4 E1 PCM Configuration Menu Figure 6.2.5 Additional PCM Configuration Keys Sage Instruments • UCTT User Manual Rev E 2/2013 Page 113 waveform screen pictured in Figure 6.2.6. This screen displays the PCM signal waveform in a time verses voltage format. Additionally the clock frequency and error as well as the average mark and space voltage levels are displayed at the bottom of the screen. 6.2.4 BERT Configuration Menu Pressing the Cfg BERT soft key circled in Figure 6.2.7 will bring up the BERT configuration menu pictured in Figure 6.2.8. This menu is used to modify the BERT test parameters. The soft keys along the right edge of the screen are used to modify the test duration, pattern and direction as well as sending loopback codes. The Selected Span text box at the top of the screen indicates which span is selected, The PCM soft keys in the lower left of the display can be used to switch between spans. Once the parameters are specified, pressing the Prev Screen or Cfg PCM soft keys will exit the menu. Figure 6.2.6 PCM Waveform Screen 6.2.5 Span Alarm Monitor Screen The Span Alarm Monitor screen is accessed by pressing the Span Mon soft key located in the lower right corner of the BERT Results menu pictured in Figure 6.2.7. This soft key also indicates the status of the Span Alarm logging function. Figure 6.2.7 BERT Results Menu Figure 6.2.8 BERT Configuration Menu Sage Instruments • UCTT User Manual Rev E 2/2013 Page 114 The Span Alarm screen is pictured in Figure 6.2.9. This screen displays counters for alarms, errors and availability for each span. Error ratios and rates are also displayed for each monitored condition. The circled Span1 and Span2 buttons in the top of the menu are used to select between the spans. Below the selection buttons is the Span Status text box. This indicates the status of the span, valid states are Signal Loss, Frame Loss and No Errors. Below Span Status are Signal loss (dB) and Signal level (Millivolts) indicators for the selected PCM signal. The Reset button located in the lower left corner of the menu can be used to reset the counters. 6.2.5.1 Span Alarm Monitor Logging The Span Alarm monitor has a logging function that will log the alarm status to a file. Pressing the Logging button located in the bottom center of Figure 6.2.9 will bring up the logging menu pictured in Figure 6.2.10. The three buttons circled in the top of the menu are used to enable the logging function and select between log entry modes. Using these buttons the logging can be setup to make a log entry every time an error or event changes, or to make a log entry at fixed time intervals. If logging is enabled, the file name can be entered or modified by pressing the to File text box. The maximum file size for the log file can be specified at the bottom of the screen. Refer to the exporting log and data files section of this manual for more information on exporting log files from the UCTT. 6.2.6 BERT Test Events Menu Figure 6.2.9 BERT Alarm Monitor Menu Figure 6.2.10 Alarm Monitor Logging Menu Bert Test Events menu is pictured in Figure 6.2.11. This menu is used to view a log of BERT test events for each interface. The PCM soft keys at the bottom left of the screen are used to select between the two interfaces. Each test event is displayed as it occurs in sequential order, events are time and date stamped. Figure 6.2.11 BERT Test Events Menu Sage Instruments • UCTT User Manual Rev E 2/2013 Page 115 7. PC Software Utilities 7.1 Post Test Analysis Tool (PTAT) The PTAT software provides the user with a PC based tool that can be used to display and analyze measurement data generated by the UCTT Spectrum Analysis, Return loss, Distance to Fault, VSWR and signal coverage applications. Multiple plots can be displayed, and markers defined showing measurements and geo location data for each data point. This allows in depth analysis and comparison of field coverage, signal strength and antenna measurements. The PTAT is a PC application that requires Windows XP SP2 or Windows 7 or 8 to run. The PTAT menu screen is shown in Figure 7.1.1 7.1.1 Trace Display The measurement plot is in the center of the screen. The y axis is the measurement value while the x axis is the logging event starting from zero, or the measurement frequency depending on the UCTT application. The mode indicator at the top of the screen displays the type of measurement performed by the UCTT. Figure 7.1.1 PTAT Menu 7.1.2 Adding and Deleting Traces Traces are added to the display by clicking on the circled Add Trace button shown in Figure 7.1.1. The colored button to the right of the Add Trace button is used to set the color of the added trace. The desired color should be selected before clicking the Add Trace button. Once the button is pressed a file selection dialog is presented as shown in Figure 7.1.2. At the bottom of the dialog box is the file type selection. Select CSV or KML files, note that KML file types include geo location data, while the CSV files do not. The UCTT applications can be configured to generate either file type. Select the file type and the desired file Figure 7.1.2 PTAT File Types Sage Instruments • UCTT User Manual Rev E 2/2013 Page 116 to display. Figure 7.1.3 shows multiple traces displayed on the screen. The circled Trace ID selection box is used to delete traces. Individual traces can be selected in the box. The Delete button located to the right of the circled Trace ID box in Figure 7.1.3 can be used to delete the selected trace from the display. In the lower left corner is a list of displayed traces along with a color key to identify each trace. 7.1.3 Adding Markers Markers are available to highlight and display geo location and measurement data at any point on the trace or between multiple traces. Markers defined in the UCTT applications will be automatically imported and displayed on the measurement trace, or markers can be added to the trace using the PTAT software. Figure 7.1.4 shows a trace with 3 markers defined. The circled marker buttons are used to add, delete and name new markers. The Name text box is used to name a newly created marker. Pressing the + button will cause a new marker to be created, it will be labeled with the text from the Name text box. The - button is used to delete markers from the display. Typing a markers label in the Name text box and clicking the - button will cause the selected marker to be deleted from the display. The CLR ALL button will remove all markers from the display. Figure 7.1.3 PTAT Multiple Trace Display 7.1.4 Managing Markers The defined markers are displayed on the trace and in the marker management panel to the right of the circled marker buttons in Figure 7.1.4. An expanded view of the marker Figure 7.1.4 PTAT Trace Markers Sage Instruments • UCTT User Manual Rev E 2/2013 Page 117 management controls are shown in Figure 7.1.5. The marker names and corresponding colors are displayed along with the x axis value and the measurement value. The selection box in the upper left corner is used to scroll through the list of markers displayed if more than four markers are defined. The circled buttons on the right side of Figure 7.1.5 are used to select individual markers. Once markers are selected they can be moved individually, or as a group, using the arrow keys located in the upper right corner of Figure 7.1.5. Figure 7.1.5 PTAT Marker Management Buttons 7.1.5 Zooming Between Markers When two markers are selected, the display can show a zoom view of the trace between the markers. The circled zoom buttons on the left side of Figure 7.1.5 are used to zoom in and out. These buttons are only enabled if two markers are selected. 7.1.6 Saving and Printing Traces Displayed traces and markers can be saved or printed. Clicking on the File menu as shown in Figure 7.1.6 allows the user to save or print the displayed traces and markers. Figure 7.1.6 PTAT File Save and Print Sage Instruments • UCTT User Manual Rev E 2/2013 Page 118 7.2 UCTT Mapper Utility The UCTT Mapper is a Windows utility used to create maps for the UCTT Signal Coverage and Signal Location applications. The UCTT Mapper utility requires Windows XP SP2 or Windows 7 or 8. The created maps are transferred from the PC to the UCTT using a USB storage device. Refer to the Signal Coverage and Signal Location sections of this manual for more information on importing map files into the UCTT. Load the ucttmapper.exe file into your PC. Double click on the file to start the program. 7.2.1 Selecting a Map The UCTT Mapper utility is pictured in Figure 7.2.1. The map location is controlled by clicking and dragging on the map with the curser to move the map in the window. Alternately the directional arrows control in the upper left corner can be used to move the map in the window. The circled zoom control in the figure is used to zoom in or out on the map. Figure 7.2.1 UCTT Mapper Utility 7.2.2 Changing the Map View The Map and Satellite buttons in the upper right corner of the display are used to change from a map to a satellite picture view. Each button has an additional option. The Map button has a terrain check box that when checked will display a topological map of the selected ares. The Satellite button has a check box that allows labels of roads and other points of interest to be displayed on top of the satellite picture. Figure 7.2.2 UCTT Mapper File Save Dialog 7.2.3 Exporting a Map Once the desired map and view are displayed, the map can be exported by clicking on the Export Map button located in the upper right portion of the screen. The save file dialog box pictured in Figure 7.2.2 is presented to allow naming of the map file. The file will be saved in the same directory that the UCTTmapper.exe file is located, the saved file will have a .map file extension. Sage Instruments • UCTT User Manual Rev E 2/2013 Page 119 7.3 UCTT Remote Display Client The remote display client is a PC utility that allows remote control and display of the UCTT. The utility displays a graphic of the front panel controls and screen. This utility can act as a passive display where the user interacts with the UCTT front panel and screen and the PC client displays the screen and measurement activity, or the user can completely control the UCTT from the PC client. 7.3.1 Connect the UCTT to a Network The remote display client communicates with the UCTT via an ethernet interface. The client is designed to be used on local, vpn or other private network. The UCTT will need an IP address, depending on the requirements of your network the address can be assigned via DHCP, or can Figure 7.3.1 Remote Display Client Address Dialog be manually entered into the UCTT. Connect the ethernet cable to the 10/100Base T connector of the UCTT. For more information on the UCTT connectors refer to the connector panel section of this manual. Once the cable is connected go to the system mode on the UCTT and press the Remote Control soft key in the upper right corner. The currently assigned IP address will be displayed on the UCTT. If the IP address is manually assigned or if DHCP needs to be enabled on the UCTT, then press the CFG IP Address soft key in the upper right corner of the screen. For more information on IP setup refer to the remote control description in the System Mode section of this manual. 7.3.2 Connect PC Client to UCTT Start the Remotedisplayclient.exe file on the PC. Upon startup, the program will present the address dialog box pictured in Figure 7.3.1. Enter the IP address of UCTT and click on OK. The program may then ask to upgrade the software, click on the Don’t Upgrade button. The client will be connected to the UCTT. The front panel graphic shown in Figure 7.3.2 will be displayed. Figure 7.3.2 Remote Display Client 7.3.3 Viewing and Controlling the UCTT The client display will mirror the UCTT display. If the UCTT is being locally controlled via its front panel, the UCTT screens including soft keys will be displayed on the PC client. The user can control the remote UCTT via the PC client by simply clicking on the front panel buttons or soft keys. Any changes in the UCTT display will be shown on the PC client display. To exit the program click the x in the upper right corner of the screen. Sage Instruments • UCTT User Manual Rev E 2/2013 Page 120 8. UCTT Specifications SPECTRUM ANALYZER • Range: 698 MHz to 2.7 GHz* • Frequency Span: 10 KHz to 2GHz, Zero Span, 1000 Data Points • Resolution Bandwidth: 100 Hz to 2.7 MHz, Auto • Trace Update Rate: Max 20 Fr/sec, Typ 10 Fr/sec • Trace Detect: Peak & Continuous Hold, Max 250 Frames/sec • Spectra Averaging: 1 to 1000 • Windowing: Uniform, [Kaiser,] Han ning, Hamming, Gaus, Blackman • Reference Level Range: -100 dBm to +60 dBm • Measurement Range: DANL to +30 dBm • Input Attenuation: 0 to 55 dB, Auto • Preamp: +20 dB (Manual/Auto) • Absolute Amplitude Accuracy: ±0.25 Rf in > -60dBm) • Simultaneous Dynamic Range: 90 dB • SSB Phase Noise: -85 dBc/Hz max at 20 kHz offset • Spurious Responses: Residual ( 50 Ω Term): < -120 dBm Signal Related (2-tones, -26 dBm, 100 KHz space,Preamp Off): > 70 dBc • Displayed Average Noise Level (DANL): -144 dBm, Preamp On @ 100 Hz RBW(Equiv to -164 dBm/Hz) • RF Input VSWR: 1.8:1 typical • Display Range: 1 to 15 dB/div in 1 dB steps. Ten divisions displayed INTERFERENCE ANALYSIS • Peak Hold, Peak Continuous, Max 250 Frames/sec @ Span 15 MHz • Spectrogram: Captures Spectrum Activity for up to 100 hours CABLE AND ANTENNA ANALYZER • Frequency Range: 698 MHz to 2.7 GHz* • Frequency Resolution: 10 KHz & 1 MHz • Interference Immunity: On-Channel: 18 dBm @ > 1.0 MHz from carrier On-Frequency: + 10 dBm within 100 KHz of carrier • Insertion Loss: One Port & Two Port VNA • Insertion Loss Range: <80 dB Accuracy: ± .5 dB, ≥ 80 dB Accuracy: ±5 dB, Scale: 0-60 dB • RFout +5 dBm • Distance-to-Fault Range: 200 M Data Points: 1024 Accuracy: Typical ± 8 cm Measurement Speed: Max < 1 sec • Return Loss: Range: 0 to 100 dB Resolution: 0.01 dB • Accuracy: RL ≤, 25 dB, ± 1.0 dB • 25 dB < RL ≤, 60 dB, ± 3 dB • RL ≥ 60 dB, ± 5 dB • VSWR: Range: 1 to 3.5 Resolution: 0.01 dB POWER METER • Frequency Range: 698 MHz to 2.7 GHz* • Display Range: -80 dBm to +80 dBm • Measurement Range: -60 dBm to +30 dBm Offset Range: 0 to +60 dB • Accuracy: ± 0.25 dB (RFin > -20 dBm) • VSWR: < 1.8:1 typical • Maximum Power: +30 dBm (1W) without external attenuator • Attenuation Offset Range: -20 to +80 dB ADJACENT CHANNEL POWER • Frequency Range: 698 MHz to 2.7 GHz* • Measurement Range: +30 dBm to -144 dBm • Channel Power Accuracy: ±1.0 dB • Adjacent Channel Power Accuracy: ±0.50 dBc • Occupied Bandwidth Accuracy: ±100 kHz CHANNEL SCANNER • Simultaneous Channels: 1 to 20 • Frequency Range: 68 MHz to 2.7 GHz* • Level Accuracy ± 0.5 dB (RFin > -60 dBm) • Level Range: - 30 dBm to 120 dBm GSM/EDGE ANALYZER GSM/EDGE Modulation Quality • RMS Phase Measurement Accuracy: ±1 deg • Peak Phase Measurement Accuracy: ±1 deg • Residual Error (GSMK): 1 deg • Frequency Offset Accuracy: ±1 Hz • TSC: 0-7 • SBC: 0-2 • Burst Type Capture: Frequency Correction, Dummy, Normal, Synchronization, Access • (EVM) Measurement Accuracy: ±1.5% • Residual Error (8PSK): 2.5% • Frequency Offset Accuracy: ±1 Hz GSM/EDGE Constellation • IQ Diagram • Burst Type Decode • Frame Number Decode • BSIC Number Decode GSM/EDGE BURST ANALYZER • TimeSlot Mask per 3GPP-TS-05.05 GSM Mask • Support for all Mask Templates per Annex B • Reference Power Level: -90 dBm to +58 dBm WCDMA/HSPA ANALYZER Sage Instruments • UCTT User Manual Rev E 2/2013 Page 121 Demodulator Summary • Code Domain Diagram • Scrambling Detection: Manual, [Auto] • Active Code Channel Detection Threshold: • Manual, [Auto] • OVSF: 2, 4, 8, 16, 32, 64, 128, 256, 512 • Scrambling Code • Frequency Offset • Channel Power • EVM • Rho • PSCH • SSCH • CPICH • P-CCPCH • S-CCPCH • PICH • IQ Offset • Peak CD Error • Noise Floor • EVM Accuracy • PBCH Signal Level (dBm) and EVM • PMCH Signal Level (dBm) and EVM • PCFICH Signal Level (dBm) and EVM • PDCCH Signal Level (dBm) and EVM • PHICH Signal Level (dBm) and EVM • Frequency Offset (Hz) • Total Average Channel Power (dBm) • Carrier feed through (dB) • Carrier frequency offset (Hz) • Occupied Bandwidth Scrambling Code Scanner • Displays Up to 7 Scrambling Code Pilots • Pilot Dominance • Ec/Io • Total Channel Power Measurement Screens: Summary, Symbol Power (Resource Block Selection), Sub-Carrier Spectrogram, IQ Modulation Diagram WCDMA Constellation • IQ Multi-Stage Constellation Diagram Spectral Emission Mask CDMA One/CDMA 2000/EVDO Analyzer • RF Spectrum (Rev 0,A,B & C) • CDMA Signal Type Auto Detection • Filtered Signal Trace • Channel Power • Frequency Error • Occupied Bandwidth CDMAOne/CDMA2000 Summary • Walsh Codes: 62, 128 • Code Doman Diagram • Total Power • Rho • IQ Offset • Frequency Offset • Code Channel Utilization (%) • Tau EVDO Summary • Walsh Codes: 62, 128 • MAC Code Domain Diagram • Data Channel IQ Power Diagram • Data Activity • Modulation Type • Pilot Power & Rho • MAC Power & Rho • Data Power & Rho • Overall Power & Rho • Frequency Offset • IQ Offset (dBc) • Noise Floor dB) • Pilot Ec/Io (dB) • PN Offset • Tau Multipath Analyzer • Main Power • Multipath Power • Displays 32 Chip PN Scanner • Pilot • Pilot Dominance • Ec/Io • PN Delay (Chips offset) • Total Channel Power LTE ANALYZER • Channel Bandwidth: 1.4, 3, 5, 10, 15*, 20* MHz • Cell ID, Sector ID, Group ID. • RS Signal Level (dBm) and correlation Coefficient • P-SS Signal level (dBm) and Correlation Coefficient • S-SS Signal level (dBm) and Correlation Coefficient • PDSCH Signal Level (dBm) and EVM Sage Instruments • UCTT User Manual Rev E 2/2013 Page 122 WiMax Analyzer Channel Bandwidth: 1.25, 1.5, 1.75, 2.5, 3, 3.5, 5, 5.5, 6, 7, 8.75, 10, 12*, 14*, 15*, 17.5*, 20* MHz • Base Station ID • Channel Power (dBm) • Burst Power (dBm) • Preable Power (dBm) • Occupied Bandwidth • EVM (RMS, Peak) • Frequency Error (Hz,ppm) • Relative Constellation Error (RMS, Peak) * Requires Option 0231 Measurement Screens: Summary, IQ Modulation Diagram, Spectrum (Time/Freq Domain) Protocol Analyzers GSM ABIS MONITOR • Codec Type: GSM, AMR, ACELP • TRAU FRAME Decode • LAPD Decode Backhaul Analyzers T1/E1 Analyzer • Fractional T1/E1 and Sub-channels(DS0) • Line Coding: AMI, B8ZS • Framing Modes: D4 (Superframe), ESF (Extended Superframe) • Connection Configurations: Terminate (100 O) Bridge (100K O) Monitor (100 O) Drop&Insert (100 O) • Receiver Sensitivity: Terminate +6 dB to -36 dB Bridge +6 dB to -36 dB Monitor 20 dB flat gain Drop&Insert +6 dB to -36 dB • Transmit Level: 0 dB, -7.5 dB, and -15 dB • Clock Sources: External Bits clock • Internal: 1.544 Mb/s ±5 ppm / 2.048 Mb/s / ±5 ppm • Pulse Shapes: Conform to ANSI T1.403 and ITU G.703 • Pattern Generation and Detection: • PRBS: 2-9, 2-11, 2-15, 2-20, 2-23 Inverted and non-inverted QRSS, 1-in-8 (1-in-7), 2-in-8, 3-in-24, All ones, All zeros, T1-Daly, User defined (128 bits) • Pulse Capture • Circuit Status Reports: Carrier present, Frame ID and Sync., Pattern ID and Sync. • Alarm Detection: AIS, RAI • Error Detection: Frame Bits, Bit, BER, BPV, CRC, Error Sec • Error Insertion: Bit, BPV, Framing Bits, RAI, AIS • Error Events Log and Time Stamp • Loopback Modes: Self loop, CSU, NIU, User defined, Inband or Data Link • Level Measurements: Vp-p (±5%), can also display in dBdsx • Data Log: Continuous, up to 48 hrs • T1 Frequency Measurement: ±5 ppm • DS0 Channel Access Testing: Tone Generator Frequency: 100 Hz to 3000 Hz • Level: -30 to 0 dBm, with 1 dB steps • VF Measurement: Frequency: 100 Hz to 3000 Hz, ±1 Hz USB Slave: Type-A USB Host: Type-B • Environmental: MIL-STD-810-F Operating: -20 °C to 55 °C, humidity 85% Storage: -51-C to 71° C Altitude: 5000m (16,404 ft) • Safety: EN 61010-1, portable equipment • Electromagnetic Compatibility: CE • Power: 1 or 2 Lithium Batteries • Battery Life: One Battery 3-4 hr, Two Batteries 7-8 hrs • Size: 300 x 216 x 114 mm (13.0 x 8.5 x 4.5 in.) • Weight: +One Bat: 6.03 Kg (13.3 lbs) +Two Bat: 6.58 (14.5 lbs) +Bumpers: 0.59 Kg (1.3 lbs) Level: -40.0 to +3.0 dBm, ±0.2 dBm • Audio Monitor: Manually select channel 1 to 24 • ITU G.826 Analysis & G.821 Error Reporting: Errored seconds, error free seconds, severely errored seconds, unavailable seconds, available seconds, degraded minutes Ethernet Analyzer • Physical Layer 10/100/1000 Base T • RFC 2544 /ITU-T Y.156am • (Throughput, Latency & Packet Loss Rate)Cable Testing (TDR) Note: * Non Contiguous Range 1.0 GHz - 1.6 GHz To maintain stated accuracies, Sage recommends calibrating every 18 months. ARBITRARY RF SIGNAL GENERATOR • Frequency Range: 698 MHz to 2.7 GHz * • Power Output: 0 dBm, ± 1dB • Phase Noise: 85 dBc • Waveforms: AMPS, TDMA, GSM, CDMA, WDCMA, LTE, WiMax GENERAL SPECIFICATIONS • Uplink/Downlink Channel Plans: AMPS, CDMA, GSM, UMTS, LTE (EUTRA) BANDS • Maximum Continuous Input: +30 dBm • Maximum Continuous Input without Damage: +33 dBm • Turning Resolution: 1 Hz • Frequency Accuracy: Internal Time Base Accuracy: ± 0.1 ppm after warm up Internal Time Base Aging: ± 0.1 ppm/ year GPS Lock: ±1.0 ppb (25° C), Hold-over < 50 ppb (72 hrs) • Frequency and Time Reference: InternalReference: GPS derived 1 pps External: One Pulse Per Second, Even Second Clock Multiples of 1 MHz to 20 MHz Multiples of 1.2288 MHz to 19.6608 MHz 2.048 MHz • Remote Control: Command Line & GUI Emulation • Interfaces: RF Out Port: Type-N F (50Ω) RFin Port: Type-N F (50Ω) • Ext Ref: BNC • Even Sec/Ext Trig: BNC • GPS Antenna: SMB • On-board Memory: 4 GB • Dual E1/T1: RJ-45 • Dual 10/100/1000: RJ-45 10/100 Base T Ethernet: RJ-45 • Ext DC Input: MIL-57D Circular • Audio: MIL-STD Circular (Acc) *Non-Contiguous range 1.0 GHz - 1.6 GHz Sage Instruments • UCTT User Manual Rev E 2/2013 Page 123 9. UCTT Warranty Product Warranty Sage Instruments products are warranted to be free from defects in materials or workmanship for a period of one year from the date of shipment. Sage Instruments further warrants that each product will execute its software programming instructions. During the one year warranty period, Sage will, at its option and expense, either repair or replace products which prove to be defective. Limitation Of Warranty This warranty does not cover repairs for damages from accident, misuse (including modification to or addition of software), tampering, improper maintenance, repair by anyone not authorized by Sage Instruments, or shipment in unapproved packaging. Out ofwarranty repairs performed by Sage Instruments are billed to the customer. Sage Instruments does not warrant that the operation of its products will be continuous or error free. Exclusive Remedies The remedies provided in this warranty are available exclusively to the original buyer of the Sage Instruments product. Sage Instruments is not liable for consequential damages or damages to any party other than the original buyer. Sage Instruments specifically disclaims any implied warranty of merchantability or fitness for a particular purpose. No other warranty is expressed or implied. Repaired Products Warranty Sage Instruments products that are repaired during the initial one year warranty period by Sage Instruments or its authorized representative are further warranted for a period of 90 days from the date of shipment from the repair facility. All out-of-warranty repairs performed by Sage Instruments are warranted for a period of 90 days. Shipping Instructions To exercise the Sage Instruments warranty, contact a Sage Instruments customer service representative and obtain a returned material authorization number RNA. Include a detailed description of the problem and the conditions and circumstances under which the symptoms occurred. Ship the product in its original packaging, or in packaging approved by Sage Instruments. If unapproved packaging is used, this warranty is void. Shipping charges, duties, and taxes must be prepaid. Return shipping to the customer is paid by Sage Instruments. Sage Instruments • UCTT User Manual Rev E 2/2013 Page 124