1
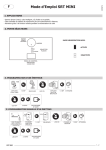
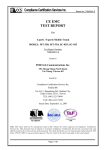
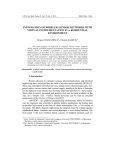
RADIO TEST REPORT
ETSI EN 300 328 V1.7.1 (2006-10)
Product: Wireless AP
Trade Name: N/A
Model Name: WNP-RP-002
Serial Model: WT-U26, JWA-N2308
Report No.: NTEK-2013NT0905144R-01
Prepared for
Gembird Europe B.V.
Wittevrouwen 56, 1358 CD, Almere Haven, The Netherlands
Prepared by
Shenzhen NTEK Testing Technology Co., Ltd.
1/F, Building E, Fenda Science Park, Sanwei Community,Xixiang Street
Bao’an District, Shenzhen P.R. China
Tel.: +86-0755-61156588 Fax.: +86-0755-61156599
Website:www.ntek.org.cn
Page 3 of 50
Report No.: NTEK-2013NT0905144R-01
Table of Contents
1 . SUMMARY OF TEST RESULTS
Page
5
1.1 TEST FACILITY
6
1.2 MEASUREMENT UNCERTAINTY
6
2 . GENERAL INFORMATION
7
2.1 GENERAL DESCRIPTION OF EUT
7
2.2 TEST CONDITIONS AND CHANNEL
8
2.3 DESCRIPTION OF TEST CONDITIONS
9
2.4 DESCRIPTION OF SUPPORT UNITS
10
2.5 EQUIPMENTS LIST FOR ALL TEST ITEMS
11
3 . EFFECTIVE RADIATED POWER
3.1 APPLIED PROCEDURES / LIMIT
3.1.1 MEASURING INSTRUMENTS AND SETTING
3.1.2 TEST PROCEDURES
3.1.3 TEST SETUP LAYOUT
3.1.4 EUT Operation during Test
3.1.5 TEST RESULTS
4 . PEAK POWER DENSITY
4.1 APPLIED PROCEDURES / LIMIT
4.1.1 MEASURING INSTRUMENTS AND SETTING
4.1.2 TEST PROCEDURES
4.1.3 TEST SETUP LAYOUT
4.1.4 EUT OPERATION DURING TEST
4.1.5 TEST RESULTS
5 . FREQUENCY RANGE
5.1 APPLIED PROCEDURES / LIMIT
5.1.1 MEASURING INSTRUMENTS AND SETTING
5.1.2 TEST PROCEDURES
5.1.3 TEST SETUP LAYOUT
5.1.4 EUT OPERATION DURING TEST
5.1.5 TEST RESULTS
6 . SPURIOUS EMISSIONS – TRANSMITTER (30- 1000MHZ)
6.1 APPLIED PROCEDURES / LIMIT
6.1.1 MEASURING INSTRUMENTS AND SETTING
6.1.2 TEST PROCEDURES
6.1.3 TEST SETUP LAYOUT
6.1.4 EUT OPERATION DURING TEST
6.1.5 TEST RESULTS (30MHz ~ 1000MHz)
12
12
12
12
12
12
13
15
15
15
15
16
16
17
33
33
33
34
34
34
35
37
37
37
37
38
38
39
Page 4 of 50
Report No.: NTEK-2013NT0905144R-01
Table of Contents
7 . SPURIOUS EMISSIONS – TRANSMITTER (ABOVE 1000MHZ)
Page
40
7.1 APPLIED PROCEDURES / LIMIT
7.1.1 MEASURING INSTRUMENTS AND SETTING
7.1.2 TEST PROCEDURES
7.1.3 TEST SETUP LAYOUT
7.1.4 EUT OPERATION DURING TEST
7.1.5 TEST RESULTS
40
40
41
41
42
43
8 . SPURIOUS EMISSIONS – RECEIVER (30-1000MHZ)
45
8.1 APPLIED PROCEDURES / LIMIT
8.1.1 MEASURING INSTRUMENTS AND SETTING
8.1.2 TEST PROCEDURES
8.1.3 TEST SETUP LAYOUT
8.1.4 EUT OPERATION DURING TEST
8.1.5 TEST RESULTS (30MHz-1000MHz)
45
45
45
45
45
46
9 . SPURIOUS EMISSIONS – RECEIVER (ABOVE 1000MHZ)
9.1 APPLIED PROCEDURES / LIMIT
9.1.1 MEASURING INSTRUMENTS AND SETTING
9.1.2 TEST PROCEDURES
9.1.3 TEST SETUP LAYOUT
9.1.4 EUT OPERATION DURING TEST
9.1.5 TEST RESULTS (ABOVE 1000MHZ)
10 .MEDIUM ACCESS PROTOCOL
10.1 APPLIED PROCEDURES / LIMIT
10.1.1 TEST RESULTS
11 . EUT TEST PHOTO
APPENDIX-PHOTOGRAPHS OF EUT CONSTRUCTIONAL DETAILS
47
47
47
47
47
47
48
49
49
49
50
Page 5 of 50
Report No.: NTEK-2013NT0905144R-01
1. SUMMARY OF TEST RESULTS
Test procedures according to the technical standards:
ETSI EN 300 328 V1.7.1
Clause
Test Item
Limit
Frequency
Range
(MHz)
Applicable
(Yes/No)
4.2.1
4.3.4
TRANSMITTER PARAMETERS
Number of hopping
>=15
channel
Hopping channel carrier the 20dB bandwidth of the
2400-2483.5
frequency separated
hopping channel
Average time of
< = 0.4 sec
occupancy
N
4.3.1
Effective radiated power
2400-2483.5
Y
2400-2483.5
N
2400-2483.5
Y
2400-2483.5
N
2400-2483.5
Y
4.3.2
4.3.3
4.3.6
4.3.6
Peak power density
Frequency range
Spurious emissions
(conducted)
Spurious emissions
(radiated)
AV: -10 dBW(20 dBm)
FHSS
N/A
DSSS/OFDM, Other
modulation
10 mW/MHz
FHSS / e.i.r.p.
-80dBm/Hz
Other modulation / e.i.r.p.
-80dBm/Hz
Operating: -36dBm
Standby: -57dBm
Operating: -30dBm
Standby: -47dBm
Operating: -47dBm
Standby: -47dBm
Operating: -36dBm
Standby: -57dBm
Operating: -30dBm
Standby: -47dBm
Operating: -47dBm
Standby: -47dBm
-47dBm
4.3.5
30-1000
1000-12750
N
1800-1900
5150-5300
30-1000
1000-12750
1800-1900
5150-5300
Y
1000-12750
MEDIUM ACCESS PROTOCOL
Y
RECEIVER PARAMETERS
4.3.7
Spurious emissions
(conducted)
Spurious emissions
(radiated)
-57dBm
30-1000
-47dBm
1000-12750
-57dBm
30-1000
N
Y
Page 6 of 50
Report No.: NTEK-2013NT0905144R-01
1.1 TEST FACILITY
NTEK Testing Technology Co., Ltd.
Add. : 1/F, Building E, Fenda Science Park, Sanwei Community, Xixiang Street, Bao'an District,
Shenzhen P.R. China
FCC Registered No.: 238937 IC Registered No.:9270A-1
CNAS Registration No.:L5516
1.2 MEASUREMENT UNCERTAINTY
The reported uncertainty of measurement y ± U,where expended uncertainty U is based on a
standard uncertainty multiplied by a coverage factor of k=2,providing a level of confidence of
approximately 95 %。
No.
Item
Uncertainty
1
Conducted Emission Test
±1.38dB
2
RF power,conducted
±0.16dB
3
Spurious emissions,conducted
±0.21dB
4
All emissions,radiated(<1G)
±4.68dB
5
All emissions,radiated(>1G)
±4.89dB
6
Temperature
±0.5°C
7
Humidity
±2%
Page 7 of 50
Report No.: NTEK-2013NT0905144R-01
2. GENERAL INFORMATION
2.1 GENERAL DESCRIPTION OF EUT
Equipment
Wireless AP
Brand Name
N/A
Model Name.
WNP-RP-002
Serial Model
WT-U26, JWA-N2308
All the model are the same circuit and RF module,except
the mode names.
The EUT is Wireless AP
Operation
802.11b/g/n(20MHz): 2412~2472MHz
Frequency:
802.11n(40MHz):2422~2462MHz
Modulation Type: CCK/OFDM/DBPSK/DAPSK
Bit Rate of
802.11b:11/5.5/2/1 Mbps
Transmitter
802.11g:54/48/36/24/18/12/9/6Mbps
Model Difference
802.11n(20MHz):150/144.44/130/1
17/115.56/104/86.67/78/52/6.5Mbps
802.11n(40MHz):300/270/240/18
0/150/120/108/90/54 Mbps
Product Description
Number Of
Channel
Antenna
Designation:
Antenna
Gain(Peak)
EIRP Power:
13CH .Please see Note 2.
FPCB Antenna
1.0dBi
802.11b: 15.67 dBm (Max.)
802.11g: 14.83 dBm (Max.)
802.11n(20M) : 13.87 dBm (Max.)
802.11n (40M): 11.65 dBm (Max.)
Based on the application, features, or specification
exhibited in User's Manual, the EUT is considered as an
ITE/Computing Device. More details of EUT technical
specification, please refer to the User's Manual.
Channel List
Refer to below
Adapter
N/A
Battery
N/A
Hardware Version
N/A
Software Version
N/A
Page 8 of 50
Report No.: NTEK-2013NT0905144R-01
Note:
1. For a more detailed features description, please refer to the manufacturer’s specifications
or the User's Manual.
2.
Channel List
Channel
Frequency
(MHz)
Channel
Frequency
(MHz)
Channel
Frequency
(MHz)
01
02
03
04
2412
2417
2422
2427
05
06
07
08
2432
2437
2442
2447
09
10
11
12
2452
2457
2462
2467
Channel
Frequency
(MHz)
13
2472
2.2 TEST CONDITIONS AND CHANNEL
Temperature
Relative Humidity
Supply Voltage
Normal Test Conditions
15°C - 35°C
20% - 75%
DC 3.7V
Extreme Test Conditions
-20°C ~ 55°C Note: (1)
N/A
DC 3.5V – DC 4.2V Note: (2)
11B/11G/11N(20M)
Test Channel
lowest
middle
highest
EUT Channel
CH01
CH07
CH13
Test Frequency (MHz)
2412
2442
2472
11G/11N(40M)
Test Channel
lowest
middle
highest
EUT Channel
CH03
CH07
CH11
Test Frequency (MHz)
2422
2442
2462
Note:
(1) The HT 55°C and LT -20°C was declarated by manufacturer, The EUT couldn’t be operate
normally with higher or lower temperature.
(2) The High Voltage 4.2V and Low Voltage 3.5V was declarated by manufacturer, The EUT
couldn’t be operate normally with higher or lower voltage.
(3) The measurements are performed at the highest, middle, lowest available channels.
Page 9 of 50
Report No.: NTEK-2013NT0905144R-01
2.3 DESCRIPTION OF TEST CONDITIONS
E-2
Notebook
AC Plug
C-2
E-1
EUT
Page 10 of 50
Report No.: NTEK-2013NT0905144R-01
2.4 DESCRIPTION OF SUPPORT UNITS
The EUT has been tested as an independent unit together with other necessary accessories or
support units. The following support units or accessories were used to form a representative test
configuration during the tests.
Item
Equipment
Brand
Model/Type No.
Series No.
Note
E-1
Wireless AP
N/A
WNP-RP-002
N/A
EUT
E-2
Notebook
DELL
PP10L
N/A
Ferrite Core
Length
NO
80cm
Item Shielded Type
C-1
NO
Note
Note:
(1)
(2)
The support equipment was authorized by Declaration of Confirmation.
For detachable type I/O cable should be specified the length in cm in『Length』column.
Page 11 of 50
Report No.: NTEK-2013NT0905144R-01
2.5 EQUIPMENTS LIST FOR ALL TEST ITEMS
Item
1
2
3
4
5
6
7
8
9
10
11
12
13
Kind of
Manufactur
Type No.
Equipment
er
Spectrum
Agilent
E4407B
Analyzer
Test
R&S
ESPI
Receiver
Bilog
TESEQ CBL6111D
Antenna
50Ω Coaxial
Anritsu
MP59B
Switch
Spectrum ADVANTES
R3132
Analyzer
T
Horn
EM-AH-20
EM
Antenna
180
Schwarzbec BBHA
Horn Ant
k
9170
Amplifier
EM
EM-30180
Loop
PLA-2030/
ARA
Antenna
B
Power
R&S
NRVS
Meter
Signal
R&S
SMT 06
Generator
Temperatur
e&
GIANT
GTH-056P
FORCE
Humitidy
Chamber
Power
R&S
URV5-Z4
Sensor (AV)
Serial No.
Last
calibration
Calibrated
until
Calibration
period
160400005
2013.07.06 2014.07.05
1 year
101318
2013.07.06 2014.07.05
1 year
31216
2013.07.06 2014.07.05
1 year
6200264416 2013.07.06 2014.07.05
1 year
150900201
2013.07.06 2014.07.05
1 year
2011071402 2013.07.06 2014.07.05
1 year
9170-181
2013.07.06 2014.07.05
1 year
060538
2013.07.06 2014.07.05
1 year
1029
2013.07.06 2014.07.05
1 year
100696
2013.07.06 2014.07.05
1 year
832080/007 2013.07.06 2014.07.05
1 year
GF-94454-1 2013.07.06 2014.07.05
1 year
0395.1619.05 2013.07.06 2014.07.05
1 year
Page 12 of 50
Report No.: NTEK-2013NT0905144R-01
3. EFFECTIVE RADIATED POWER
3.1 APPLIED PROCEDURES / LIMIT
Clause
Test Item
4.3.1
Effective radiated power
Limit
AV: -10 dBW (20 dBm)
3.1.1 MEASURING INSTRUMENTS AND SETTING
Please refer to section 4.1.1 in this report. The following table is the setting of the power meter.
Power Meter Parameter
Setting
Filter No.
Auto
Measurement time
0.135 s ~ 26 s
Used Average Sensor
URV5-Z4
3.1.2 TEST PROCEDURES
a. Since a temporary antenna connector can be attached on the RF output port, so conducted
measurement method was used in this case.
b. A wide band power meter with a matched thermocouple detector was used to directly measure
the output power from the RF output port of the EUT in continuously transmitting mode.
c. The EIRP = A+G+10*log(1/x), where A is the power measured in (1), G is the gain of the
antenna of the EUT in dBi and x is the duty cycle of the EUT in continuously transmitting mode.
d. The measurement shall be repeated at the lowest, the Wireless AP dle, and the highest channel
of the stated frequency range. These measurements shall also be performed at normal and
extreme test conditions.
3.1.3 TEST SETUP LAYOUT
3.1.4 EUT Operation during Test
The EUT was programmed to be in continuously transmitting mode.
Page 13 of 50
Report No.: NTEK-2013NT0905144R-01
3.1.5 TEST RESULTS
EUT:
Temperature:
Pressure:
Test Mode :
Model Name :
Wireless AP
WNP-RP-002
26°C
Relative Humidity: 60 %
Test Voltage :
1012 hPa
DC3.7V(NORMAL)
TX 11B Mode CH1 / CH7 / CH13
Average EIRP Power ( dBm )
CH1
CH7
CH13
TEST CONDITIONS
T nom (°C)
20
T min (°C)
-20
T max (°C)
55
EUT:
Temperature:
Pressure:
Test Mode :
V nom (V)
3.7
15.67
15.63
15.24
V max (V)
4.2
15.58
15.12
15.37
V min (V)
3.5
15.44
15.45
15.31
V max (V)
4.2
15.38
15.49
15.46
V min (V)
3.5
15.41
15.50
15.25
Max Peak Power
15.67dBm
Limits
20dBm (-10dBW)
Result
Complies
Model Name :
Wireless AP
WNP-RP-002
26°C
Relative Humidity: 60 %
Test Voltage :
1012 hPa
DC3.7V(NORMAL)
TX 11G Mode CH1 / CH7 / CH13
Average EIRP Power ( dBm )
CH1
CH7
CH13
TEST CONDITIONS
T nom (°C)
20
T min (°C)
-20
T max (°C)
55
V nom (V)
3.7
14.53
14.66
14.75
V max (V)
4.2
14.76
14.83
14.53
V min (V)
3.5
14.65
14.76
14.55
V max (V)
4.2
14.37
14.57
11.55
V min (V)
3.5
14.64
14.86
14.57
Max Peak Power
14.83 dBm
Limits
20dBm (-10dBW)
Result
Complies
Page 14 of 50
EUT:
Temperature:
Pressure:
Test Mode :
Model Name :
Wireless AP
WNP-RP-002
26°C
Relative Humidity: 60 %
Test Voltage :
1012 hPa
DC3.7V(NORMAL)
TX 11N Mode CH1 / CH7 / CH13/20MHz
Average EIRP Power ( dBm )
CH1
CH7
CH13
TEST CONDITIONS
T nom (°C)
20
T min (°C)
-20
T max (°C)
55
EUT:
Temperature:
Pressure:
Test Mode :
Report No.: NTEK-2013NT0905144R-01
V nom (V)
3.7
13.87
13.58
13.74
V max (V)
4.2
13.69
13.71
13.66
V min (V)
3.5
13.75
13.68
13.42
V max (V)
4.2
13.64
13.70
13.62
V min (V)
3.5
13.72
13.54
13.55
Max Peak Power
13.87 dBm
Limits
20dBm (-10dBW)
Result
Complies
Model Name :
Wireless AP
WNP-RP-002
26°C
Relative Humidity: 60 %
Test Voltage :
1012 hPa
DC3.7V(NORMAL)
TX 11N Mode CH3 / CH7 / CH11/40MHz
Average EIRP Power ( dBm )
CH3
CH7
CH11
TEST CONDITIONS
T nom (°C)
20
T min (°C)
-20
T max (°C)
55
V nom (V)
3.7
11.63
11.22
11.65
V max (V)
4.2
11.45
11.37
11.25
V min (V)
3.5
11.38
11.40
11.36
V max (V)
4.2
11.59
11.36
11.41
V min (V)
3.5
11.43
11.53
11.32
Max Peak Power
11.65 dBm
Limits
20dBm (-10dBW)
Result
Complies
Page 15 of 50
Report No.: NTEK-2013NT0905144R-01
4. PEAK POWER DENSITY
4.1 APPLIED PROCEDURES / LIMIT
Clause
Test Item
4.3.2
Peak power density
Limit
FHSS
N/A
DSSS/OFDM, Other modulation
10 mW/MHz
4.1.1 MEASURING INSTRUMENTS AND SETTING
Please refer to section 5.1.1 in this report. The following table is the setting of the power meter.
Power Meter Parameter
Setting
Filter No.
Auto
Measurement time
0.135 s ~ 26 s
Used Average Sensor
URV5-Z4
4.1.2 TEST PROCEDURES
Step 1:
Connect the UUT to the spectrum analyser and use the following settings:
• Centre Frequency: The centre frequency of the channel under test.
• Resolution BW: 1 MHz.
• Video BW: 1 MHz.
• Span: Wide enough to cover the complete power envelope of the signal of the UUT.
• Detector: Peak.
• Trace Mode: Max Hold.
Step 2:
When the trace is complete, find the peak value of the power envelope and record the frequency.
Step 3:
Make the following changes to the settings of the spectrum analyser:
• Centre Frequency: Equal to the frequency recorded in step 2.
• Span: 3 MHz.
• Resolution BW: 1 MHz.
• Video BW: 1 MHz.
• Sweep time: 1 minute.
• Detector: Average (see note).
• Trace Mode: Max Hold.
Note: The detector mode "Average" is often referred to as "RMS Average" or "Sample" but do not
use Video Average.
Page 16 of 50
Report No.: NTEK-2013NT0905144R-01
Step 4:
When the trace is complete, capture the trace, for example using the "View" option on the
spectrum analyser. Find the peak value of the trace and place the analyser marker on this peak.
This level is recorded as the highest mean power (spectral power density) D in a 1 MHz band.
Alternatively, where a spectrum analyser is equipped with a facility to measure spectral power
density, this facility may be used to display the spectral power density D in dBm/MHz.
Step 5:
The maximum e.i.r.p. spectral density is calculated from the above measured power density (D),
the observed duty cycle x (see clause 5.7.2.2, step 1), and the applicable antenna assembly gain
"G" in dBi, according to the formula below. If more than one antenna assembly is intended for this
power setting, the gain of the antenna assembly with the highest gain shall be used.
• PD = D + G + 10 log (1/x);
• PD shall be recorded in the test report.
4.1.3 TEST SETUP LAYOUT
`
4.1.4 EUT OPERATION DURING TEST
The EUT was programmed to be in continuously transmitting mode.
Page 17 of 50
Report No.: NTEK-2013NT0905144R-01
4.1.5 TEST RESULTS
EUT:
Temperature:
Pressure:
Test Mode :
Model Name :
Wireless AP
WNP-RP-002
26°C
Relative Humidity: 60 %
Test Voltage :
1012 hPa
DC3.7V(NORMAL)
TX 11B Mode CH1 /CH7/ CH13
Reading
Antenna
Frequency
Power Density
Limit
(dBm/MHz)
(dBm/MHz)
10 log(1/x)
(dBm/MHz)
Gain (dBi)
2412
-1.339
0
-0.339
10
2442
-1.206
1.0
1.0
0
-0.209
10
2472
-1.825
1.0
0
-0.825
10
10 log (1/x) = 0, X=duty cycle=Ton/Tp, Ton= 100 ms, Tp= 100 ms
Low Channel
Page 18 of 50
Middle Channel
Report No.: NTEK-2013NT0905144R-01
Page 19 of 50
High Channel
Report No.: NTEK-2013NT0905144R-01
Page 20 of 50
Report No.: NTEK-2013NT0905144R-01
Page 21 of 50
EUT:
Temperature:
Pressure:
Test Mode :
Report No.: NTEK-2013NT0905144R-01
Model Name :
Wireless AP
WNP-RP-002
26°C
Relative Humidity: 60 %
Test Voltage :
1012 hPa
DC3.7V(NORMAL)
TX 11G Mode CH1 /CH7/ CH13
Reading
Antenna
Frequency
Power Density
Limit
(dBm/MHz)
(dBm/MHz)
10 log(1/x)
(dBm/MHz)
Gain (dBi)
2412
-5.707
1.0
0
-4.707
10
2442
-4.522
1.0
0
-3.522
10
2472
-3.516
1.0
0
-2.516
10
10 log (1/x) = 0, X=duty cycle=Ton/Tp, Ton= 100 ms, Tp= 100 ms
Low Channel
Page 22 of 50
Middle Channel
Report No.: NTEK-2013NT0905144R-01
Page 23 of 50
High Channel
Report No.: NTEK-2013NT0905144R-01
Page 24 of 50
Report No.: NTEK-2013NT0905144R-01
Page 25 of 50
EUT:
Temperature:
Pressure:
Test Mode :
Report No.: NTEK-2013NT0905144R-01
Model Name :
Wireless AP
WNP-RP-002
26°C
Relative Humidity: 60 %
Test Voltage :
1012 hPa
DC3.7V(NORMAL)
TX 11N Mode CH1 /CH7/ CH13/20MHz
Reading
Antenna
Frequency
Power Density
Limit
(dBm/MHz)
(dBm/MHz)
10 log(1/x)
(dBm/MHz)
Gain (dBi)
2412
-7.168
1.0
0
-6.168
10
2442
-7.222
1.0
0
-6.222
10
2472
-6.731
1.0
0
-5.731
10
10 log (1/x) = 0, X=duty cycle=Ton/Tp, Ton= 100 ms, Tp= 100 ms
Low Channel
Page 26 of 50
Middle Channel
Report No.: NTEK-2013NT0905144R-01
Page 27 of 50
High Channel
Report No.: NTEK-2013NT0905144R-01
Page 28 of 50
Report No.: NTEK-2013NT0905144R-01
Page 29 of 50
EUT:
Temperature:
Pressure:
Test Mode :
Report No.: NTEK-2013NT0905144R-01
Model Name :
Wireless AP
WNP-RP-002
26°C
Relative Humidity: 60 %
Test Voltage :
1012 hPa
DC3.7V(NORMAL)
TX 11N Mode CH3 /CH7/ CH11/40MHz
Reading
Antenna
Frequency
Power Density
Limit
(dBm/MHz)
(dBm/MHz)
10 log(1/x)
(dBm/MHz)
Gain (dBi)
2422
-10.18
1.0
0
-9.18
10
2442
-10.69
1.0
0
-9.69
10
2462
-11.36
1.0
0
-10.36
10
10 log (1/x) = 0, X=duty cycle=Ton/Tp, Ton= 100 ms, Tp= 100 ms
Low Channel
Page 30 of 50
Middle Channel
Report No.: NTEK-2013NT0905144R-01
Page 31 of 50
High Channel
Report No.: NTEK-2013NT0905144R-01
Page 32 of 50
Report No.: NTEK-2013NT0905144R-01
Page 33 of 50
Report No.: NTEK-2013NT0905144R-01
5. FREQUENCY RANGE
5.1 APPLIED PROCEDURES / LIMIT
Clause
Test Item
4.3.3
Frequency range
Limit
-80dBm/Hz
The frequency range of the equipment is determined by the lowest and highest frequencies
occupied by the power envelope. fH is the highest frequency of the power envelope: it is the
frequency furthest above the frequency of maximum power where the output power drops
below the level of -80 dBm/Hz e.i.r.p. spectral power density (-30 dBm if measured in a 100 kHz
bandwidth). fL is the lowest frequency of the power envelope; it is the frequency furthest below
the frequency of maximum power where the output power drops below the level equivalent to
-80 dBm/Hz e.i.r.p. spectral power density (or -30 dBm if measured in a 100 kHz bandwidth).
The frequency range is determined by the lowest value of fL and the highest value of fH
resulting from the adjustment of the equipment to the lowest and highest operating frequencies.
For all equipment, the frequency range shall lie within the band 2.4 GHz to 2,4835 GHz (fL > 2.4
GHz and fH < 2.4835 GHz).
5.1.1 MEASURING INSTRUMENTS AND SETTING
Please refer to section 6.1.1 in this report. The following table is the setting of Spectrum Analyzer.
Spectrum Analyzer
Setting
Attenuation
20~30dB
Span Frequency
40MHz
RB
100 kHz
VB
100 kHz
Detector
Average
Sweep time
≥ 60s
Trace
Average 50 sweeps
Page 34 of 50
Report No.: NTEK-2013NT0905144R-01
5.1.2 TEST PROCEDURES
a. The transmitter output (antenna port) was connected to the spectrum analyzer.
b. Added [x] dBi of antenna gain was on the spectrum analyzer.
c. Place the spectrum analyzer in detector averaging mode with a minimum of 50 sweeps selected
and activate transmitter with modulation applied.
d. Select lowest operating frequency of the equipment under test.
e. Find lowest frequency below the operating frequency at which spectral power density drops
below -80 dBm/Hz e.i.r.p. (-30 dBm if measured in a 100 kHz bandwidth). This frequency shall
be recorded (fL).
f. Select the highest operating frequency of the equipment under test.
g. Find the highest frequency at which the spectral power density drops below-80 dBm/Hz e.i.r.p.
(-30 dBm if measured in a 100 kHz bandwidth). This frequency shall be recorded (fH).
h. These measurements shall also be performed at normal and extreme test conditions.
5.1.3 TEST SETUP LAYOUT
5.1.4 EUT OPERATION DURING TEST
The EUT was programmed to be in continuously transmitting mode.
Page 35 of 50
Report No.: NTEK-2013NT0905144R-01
5.1.5 TEST RESULTS
EUT:
Temperature:
Pressure:
Test Mode :
Model Name :
WNP-RP-002
Relative Humidity: 60 %
Test Voltage :
DC3.7V(NORMAL)
Wireless AP
26 °C
1012 hPa
TX 11B Mode CH1 / CH13
Frequency range ( MHz )
TEST CONDITIONS
T nom (°C)
20.00
T min (°C)
-20.00
T max (°C)
55.00
fL CH1
fH CH13
V nom (V)
3.7
2401.4125
2482.4352
V max (V)
4.2
2401.4348
2482.6524
V min (V)
3.5
2401.3546
2482.5457
V max (V)
4.2
2401.4278
2482.5654
V min (V)
3.5
2401.2255
2482.5656
Min. fL / Max. fH Band Edges
2401.3217
2482.4454
EU / Australia / NZ Limits
fL > 2400.0 MHz
fH < 2483.5 MHz
Result
EUT:
Temperature:
Pressure:
Test Mode :
Complies
Model Name :
WNP-RP-002
Relative Humidity: 60 %
Test Voltage :
DC3.7V(NORMAL)
Wireless AP
26 °C
1012 hPa
TX 11G Mode CH1 / CH13
Frequency range ( MHz )
TEST CONDITIONS
T nom (°C)
20.00
T min (°C)
-20.00
T max (°C)
55.00
fL CH1
fH CH13
V nom (V)
3.7
2401.4341
2482.5634
V max (V)
4.2
2401.3458
2482.5441
V min (V)
3.5
2401.4554
2482.5627
V max (V)
4.2
2401.5642
2482.5642
V min (V)
3.5
2401.6542
2482.5678
Min. fL / Max. fH Band Edges
2401.3464
2482.2865
Other EU / Australia / NZ Limits
fL > 2400.0 MHz
fH < 2483.5 MHz
Result
Complies
Page 36 of 50
EUT:
Temperature:
Pressure:
Test Mode :
Model Name :
WNP-RP-002
Relative Humidity: 60 %
Test Voltage :
DC3.7V(NORMAL)
Wireless AP
26 °C
1012 hPa
TX 11N Mode CH1 / CH13
Frequency range ( MHz )
TEST CONDITIONS
T nom (°C)
20.00
T min (°C)
-20.00
T max (°C)
55.00
Report No.: NTEK-2013NT0905144R-01
fL CH1
fH CH13
V nom (V)
3.7
2401.5652
2482.5348
V max (V)
4.2
2401.5221
2482.5640
V min (V)
3.5
2401.5414
2482.5147
V max (V)
4.2
2401.4537
2482.5669
V min (V)
3.5
2401.4514
2482.5147
Min. fL / Max. fH Band Edges
2401.3456
2482.1832
Other EU / Australia / NZ Limits
fL > 2400.0 MHz
fH < 2483.5 MHz
Result
EUT:
Temperature:
Pressure:
Test Mode :
Complies
Model Name :
Wireless AP
WNP-RP-002
26 °C
Relative Humidity: 60 %
Test Voltage :
1012 hPa
DC3.7V(NORMAL)
TX 11N Mode CH3 / CH11/40MHz
Frequency range ( MHz )
TEST CONDITIONS
T nom (°C)
20.00
T min (°C)
-20.00
T max (°C)
55.00
fL CH3
fH CH11
V nom (V)
3.7
2401.4575
2482.4211
V max (V)
4.2
2401.5382
2482.5742
V min (V)
3.5
2401.5422
2482.5395
V max (V)
4.2
2401.5487
2482.5478
V min (V)
3.5
2401.6345
2482.4289
Min. fL / Max. fH Band Edges
2401.4521
2482.6692
Other EU / Australia / NZ Limits
fL > 2400.0 MHz
fH < 2483.5 MHz
Result
Complies
Page 37 of 50
Report No.: NTEK-2013NT0905144R-01
6. SPURIOUS EMISSIONS – TRANSMITTER (30- 1000MHZ)
6.1 APPLIED PROCEDURES / LIMIT
Clause
Test Item
Spurious emissions
4.3.6
Frequency(MHz)
30-1000
1000-12750
(radiated)
1800-1900
5150-5300
Limit
Operating
Standby
Operating
Standby
Operating
Standby
-36dBm
-57dBm
-30dBm
-47dBm
-47dBm
-47dBm
6.1.1 MEASURING INSTRUMENTS AND SETTING
Please refer to section 7.1.1 in this report. The following table is the setting of the Spectrum
Analyzer.
Spectrum Analyzer
Setting
Attenuation
Auto
Start Frequency
30 MHz
Stop Frequency
1000 MHz
Detector
Positive Peak
Span
100 MHz
Sweep Time
1s
RB / VB
100 kHz / 30 kHz
6.1.2 TEST PROCEDURES
a. The EUT was placed on the top of the turntable in open test site area.
b. The test shall be made in the transmitting mode. The turntable was rotated by 360 degrees to
determine the position of the highest radiation.
c. This measurement shall be repeated with the transmitter in standby mode where applicable.
d. For 30~1000MHz spurious emissions measurement, the broad band bi-log receiving antenna
was placed 3 meters far away from the turntable.
e. The broadband receiving antenna was fixed on the same height with the EUT to find each
suspected emissions of both horizontal and vertical polarization. Each recorded suspected
value is indicated as Read Level (Raw).
f. Replace the EUT by standard antenna and feed the RF port by signal generator.
g. Adjust the frequency of the signal generator to the suspected emission and slightly rotate the
turntable to locate the position with maximum reading.
h. Adjust the power level of the signal generator to reach the same reading with Read Level
(Raw).
i. The level of the spurious emission is the power level of (8) plus the gain of the standard antenna
in dBi and minus the loss of the cable used between the signal generator and the standard
antenna.
j. If the level calculated in (9) is higher than limit by more than 6dB, then lower the RBW of the
spectrum analyzer to 30KHz. If the level of this emission does not change by more than 2dB,
then it is taken as narrowband emission, otherwise, wideband emission.
k. The measurement shall be repeated at the lowest and the highest channel of the stated
frequency range.
H. EUT Orthogonal Axis:
“X” - denotes Laid on Table; ”Y” - denotes Vertical Stand; ”Z” - denotes Side Stand.
Page 38 of 50
Report No.: NTEK-2013NT0905144R-01
6.1.3 TEST SETUP LAYOUT
(A) Radiated Emission Test Set-Up Frequency Below 1 GHz
6.1.4 EUT OPERATION DURING TEST
The EUT was programmed to be in continuously transmitting mode.
For the initial investigation on the highest, middle, lowest frequency in 30-1000MHz, no significant
differences in spurious emissions were observed between these 3 modes. The worst test data was
shown
Page 39 of 50
Report No.: NTEK-2013NT0905144R-01
6.1.5 TEST RESULTS (30MHz ~ 1000MHz)
EUT:
Temperature:
Pressure:
Test Mode :
Model Name :
WNP-RP-002
Relative Humidity: 54%
Test Power :
DC3.7V
Wireless AP
24 ℃
1010 hPa
TX
Polar
(H/V)
Frequency
Meter Reading
Factor
Emission
Level
Limits
Margin
(MHz)
(dBm)
(dB)
(dBm)
(dBm)
(dB)
V
V
V
H
H
H
68.6310
207.8497
554.8251
45.6948
135.0319
595.1326
-74.06
-77.64
-90.03
-78.95
-79.49
-87.62
5.76
9.14
22.43
10.25
11.99
20.92
-68.3
-68.5
-67.6
-68.7
-67.5
-66.7
-57
-57
-57
-57
-57
-57
-11.3
-11.5
-10.6
-11.7
-10.5
-9.7
Remark:
Absolute Level= ReadingLevel+ Factor, Margin= Absolute Level - Limit
Detector
Type
peak
peak
peak
peak
peak
peak
Page 40 of 50
Report No.: NTEK-2013NT0905144R-01
7. SPURIOUS EMISSIONS – TRANSMITTER (ABOVE 1000MHZ)
7.1 APPLIED PROCEDURES / LIMIT
Clause
Test Item
Spurious emissions
4.3.6
Frequency(MHz)
30-1000
1000-12750
(narrowband)
1800-1900
5150-5300
Limit
Operating
Standby
Operating
Standby
Operating
Standby
-36dBm
-57dBm
-30dBm
-47dBm
-47dBm
-47dBm
7.1.1 MEASURING INSTRUMENTS AND SETTING
Please refer to section 7.1.1 in this report. The following table is the setting of the Spectrum
Analyzer.
Spectrum Analyzer
Setting
Attenuation
Auto
Start Frequency
1000 MHz
Stop Frequency
12750 MHz
Detector
Positive Peak
Span
100 MHz
Sweep Time
1s
RB / VB
100 kHz / 30 kHz
Page 41 of 50
Report No.: NTEK-2013NT0905144R-01
7.1.2 TEST PROCEDURES
a. The EUT was placed on the top of the turntable in open test site area.
b. The test shall be made in the transmitting mode. The turntable was rotated by 360 degrees to
determine the position of the highest radiation.
c. This measurement shall be repeated with the transmitter in standby mode where applicable.
d. For 30~1000MHz spurious emissions measurement, the broad band bi-log receiving antenna
was placed 3 meters far away from the turntable.
e. The broadband receiving antenna was fixed on the same height with the EUT to find each
suspected emissions of both horizontal and vertical polarization. Each recorded suspected
value is indicated as Read Level (Raw).
f. Replace the EUT by standard antenna and feed the RF port by signal generator.
g. Adjust the frequency of the signal generator to the suspected emission and slightly rotate the
turntable to locate the position with maximum reading.
h. Adjust the power level of the signal generator to reach the same reading with Read Level
(Raw).
i. The level of the spurious emission is the power level of (8) plus the gain of the standard antenna
in dBi and minus the loss of the cable used between the signal generator and the standard
antenna.
j. If the level calculated in (9) is higher than limit by more than 6dB, then lower the RBW of the
spectrum analyzer to 30KHz. If the level of this emission does not change by more than 2dB,
then it is taken as narrowband emission, otherwise, wideband emission.
k. The measurement shall be repeated at the lowest and the highest channel of the stated
frequency range.
H. EUT Orthogonal Axis:
“X” - denotes Laid on Table; ”Y” - denotes Vertical Stand; ”Z” - denotes Side Stand.
7.1.3 TEST SETUP LAYOUT
Page 42 of 50
Report No.: NTEK-2013NT0905144R-01
7.1.4 EUT OPERATION DURING TEST
The EUT was programmed to be in continuously transmitting mode.
Page 43 of 50
Report No.: NTEK-2013NT0905144R-01
7.1.5 TEST RESULTS
802.11b
Polar
(H/V)
Frequency
Meter Reading
(MHz)
(dBm)
V
V
V
H
H
H
2414.629
3620.034
4830.532
1559.486
2410.307
3620.034
-35.87
-41.05
-48.7
-39.47
-40.5
-44.23
Normal Voltage
Emission
Factor
Level
(dB)
(dBm)
operation frequency:2412
-1.32
-37.19
3.02
-38.03
8.54
-40.16
-5.61
-45.08
-1.31
-41.81
3.02
-41.21
Limits
Margin
(dBm)
(dB)
-30
-30
-30
-30
-30
-30
-7.19
-8.03
-10.16
-15.08
-11.81
-11.21
peak
peak
peak
peak
peak
peak
Limits
Margin
(dBm)
(dB)
Detector
Type
-30
-30
-30
-30
-30
-30
-16.78
-11.41
-10.07
-11.12
-13.14
-16.36
peak
peak
peak
peak
peak
peak
Limits
Margin
(dBm)
(dB)
Detector
Type
-30
-30
-30
-30
-30
-30
-11.38
-13.41
-13.59
-9.02
-13.41
-13.59
Detector
Type
Remark:
Absolute Level= ReadingLevel+ Factor, Margin= Absolute Level - Limit
802.11b
Polar
(H/V)
Frequency
Meter Reading
(MHz)
(dBm)
V
V
V
H
H
H
1246.558
2462.692
4369.367
2462.692
4369.367
5625.198
-43.37
-40.09
-46.81
-39.8
-49.88
-54.11
Normal Voltage
Emission
Factor
Level
(dB)
(dBm)
operation frequency:2472
-3.41
-46.78
-1.32
-41.41
6.74
-40.07
-1.32
-41.12
6.74
-43.14
7.75
-46.36
Remark:
Absolute Level= ReadingLevel+ Factor, Margin= Absolute Level - Limit
802.11g
Polar
(H/V)
Frequency
Meter Reading
(MHz)
(dBm)
V
V
V
H
H
H
1166.597
3239.42
4059.89
1080.091
3239.42
4059.89
-36.19
-44.66
-49.69
-31.73
-44.66
-49.69
Normal Voltage
Emission
Factor
Level
(dB)
(dBm)
operation frequency:2412
-5.19
-41.38
1.25
-43.41
6.10
-43.59
-7.29
-39.02
1.25
-43.41
6.10
-43.59
Remark:
Absolute Level= ReadingLevel+ Factor, Margin= Absolute Level - Limit
peak
peak
peak
peak
peak
peak
Page 44 of 50
Report No.: NTEK-2013NT0905144R-01
802.11g
Polar
(H/V)
Frequency
Meter Reading
(MHz)
(dBm)
V
V
V
H
H
H
1332
2188.024
3959.316
1410.604
2414.629
4865.277
-49.35
-54.14
-53.82
-46.72
-46.87
-57.43
Normal Voltage
Emission
Factor
Level
(dB)
(dBm)
operation frequency:2472
-3.17
-52.52
-0.39
-54.53
5.59
-48.23
-3.17
-49.89
-1.32
-48.19
8.52
-48.91
Limits
Margin
(dBm)
(dB)
-30
-30
-30
-30
-30
-30
-22.52
-24.53
-18.23
-19.89
-18.19
-18.91
peak
peak
peak
peak
peak
peak
Limits
Margin
(dBm)
(dB)
Detector
Type
-30.00
-30.00
-30.00
-30.00
-30.00
-30.00
-11.00
-18.36
-17.8
-11.00
-21.00
-19.96
peak
peak
peak
peak
peak
peak
Limits
Margin
(dBm)
(dB)
Detector
Type
-30.00
-30.00
-30.00
-30.00
-30.00
-30.00
-15.14
-20.48
-18.23
-15.00
-16.04
-18.23
Detector
Type
Remark:
Absolute Level= ReadingLevel+ Factor, Margin= Absolute Level - Limit
802.11n/20MHz
Polar
(H/V)
Frequency
Meter Reading
(MHz)
(dBm)
V
V
V
H
H
H
1162.424
3245.229
4804.636
1162.424
1996.946
3620.034
-35.62
-49.63
-56.27
-35.62
-50.00
-52.98
Normal Voltage
Emission
Factor
Level
(dB)
(dBm)
operation frequency:2412
-5.38
-41.00
1.27
-48.36
8.47
-47.8
-5.38
-41.00
-1.00
-51.00
3.02
-49.96
Remark:
Absolute Level= ReadingLevel+ Factor, Margin= Absolute Level - Limit
802.11n/20MHz
Polar
(H/V)
Frequency
Meter Reading
(MHz)
(dBm)
V
V
V
H
H
H
1625.096
3119.795
4865.277
1499.209
3620.034
4865.277
-39.76
-51.14
-56.75
-40.62
-49.06
-56.75
Normal Voltage
Emission
Factor
Level
(dB)
(dBm)
operation frequency:2472
-5.38
-45.14
0.66
-50.48
8.52
-48.23
-4.38
-45.00
3.02
-46.04
8.52
-48.23
Remark:
Absolute Level= ReadingLevel+ Factor, Margin= Absolute Level - Limit
peak
peak
peak
peak
peak
peak
Page 45 of 50
Report No.: NTEK-2013NT0905144R-01
8. SPURIOUS EMISSIONS – RECEIVER (30-1000MHZ)
8.1 APPLIED PROCEDURES / LIMIT
Clause
Test Item
Spurious emissions
4.3.5
(radiated)
Frequency(MHz)
30-1000
1000-12750
Limit
-57dBm
-47dBm
8.1.1 MEASURING INSTRUMENTS AND SETTING
Please refer to section 8.1.1 in this report. The following table is the setting of the Spectrum
Analyzer.
Spectrum Analyzer
Setting
Attenuation
Auto
Start Frequency
30 MHz
Stop Frequency
1000 MHz
Detector
Positive Peak
Span
100 MHz
Sweep Time
1s
RB / VB
100 kHz / 30 kHz
8.1.2 TEST PROCEDURES
a. The EUT was placed on the top of the turntable in open test site area.
b. The test shall be made in the receiving mode. The turntable was rotated by 360 degrees to
determine the position of the highest radiation.
c. For 30~1000MHz spurious emissions measurement, the broad band bi-log receiving antenna
was placed 3 meters far away from the turntable. .
d. The broadband receiving antenna was fixed on the same height with the EUT to find each
suspected emissions of both horizontal and vertical polarization. Each recorded suspected
value is indicated as Read Level (Raw).
e. Replace the EUT by standard antenna and feed the RF port by signal generator.
f. Adjust the frequency of the signal generator to the suspected emission and slightly rotate the
turntable to locate the position with maximum reading.
g. Adjust the power level of the signal generator to reach the same reading with Read Level
(Raw).
h. The level of the spurious emission is the power level of (7) plus the gain of the standard
antenna in dBi and minus the loss of the cable used between the signal generator and the
standard antenna.
i. The measurement shall be repeated at the lowest and the highest channel of the stated
frequency range.
H. EUT Orthogonal Axis:
“X” - denotes Laid on Table; ”Y” - denotes Vertical Stand; ”Z” - denotes Side Stand.
8.1.3 TEST SETUP LAYOUT
This test setup layout is the same as that shown in section 6.1.4
8.1.4 EUT OPERATION DURING TEST
The EUT was programmed to be in continuously receiving mode.
Page 46 of 50
Report No.: NTEK-2013NT0905144R-01
8.1.5 TEST RESULTS (30MHz-1000MHz)
EUT:
Wireless AP
Model Name :
Temperature:
26°C
Relative Humidity:53 %
Pressure:
1012 hPa
Test Power :
Test Mode :
RX
WNP-RP-002
DC3.7V
Polar
(H/V)
Frequency
Meter Reading
Factor
Emission
Level
Limits
Margin
(MHz)
(dBm)
(dB)
(dBm)
(dBm)
(dB)
V
V
V
V
H
H
H
H
33.6802
57.5939
262.8955
554.8254
31.2893
129.4677
256.5211
614.2142
-83.97
-84.78
-89.18
-89.66
-96.05
-95.15
-93.79
-93.72
28.66
17.79
26.81
35.53
29.88
24.32
26.59
35.6
-55.31
-66.99
-62.37
-54.13
-66.17
-70.83
-67.2
-58.12
-36
-36
-36
-36
-36
-36
-36
-36
-19.31
-30.99
-26.37
-18.13
-30.17
-34.83
-31.2
-22.12
Remark:
Absolute Level= ReadingLevel+ Factor, Margin= Absolute Level - Limit
Detector
Type
peak
peak
peak
peak
peak
peak
peak
peak
Page 47 of 50
Report No.: NTEK-2013NT0905144R-01
9. SPURIOUS EMISSIONS – RECEIVER (ABOVE 1000MHZ)
9.1 APPLIED PROCEDURES / LIMIT
Clause
Test Item
Spurious emissions
4.3.5
(narrowband)
Frequency(MHz)
30-1000
1000-12750
Limit
-57dBm
-47dBm
9.1.1 MEASURING INSTRUMENTS AND SETTING
Please refer to section 9.1.1 in this report. The following table is the setting of the Spectrum
Analyzer.
Spectrum Analyzer
Setting
Attenuation
Auto
Start Frequency
1000 MHz
Stop Frequency
12750 MHz
Detector
Positive Peak
Span
100 MHz
Sweep Time
1s
RB / VB
100 kHz / 30 kHz
9.1.2 TEST PROCEDURES
a. The EUT was placed on the top of the turntable in open test site area.
b. The test shall be made in the receiving mode. The turntable was rotated by 360 degrees to
determine the position of the highest radiation.
c. For 30~1000MHz spurious emissions measurement, the broad band bi-log receiving antenna
was placed 3 meters far away from the turntable. .
d. The broadband receiving antenna was fixed on the same height with the EUT to find each
suspected emissions of both horizontal and vertical polarization. Each recorded suspected
value is indicated as Read Level (Raw).
e. Replace the EUT by standard antenna and feed the RF port by signal generator.
f. Adjust the frequency of the signal generator to the suspected emission and slightly rotate the
turntable to locate the position with maximum reading.
g. Adjust the power level of the signal generator to reach the same reading with Read Level
(Raw).
h. The level of the spurious emission is the power level of (7) plus the gain of the standard
antenna in dBi and minus the loss of the cable used between the signal generator and the
standard antenna.
i. The measurement shall be repeated at the lowest and the highest channel of the stated
frequency range.
H. EUT Orthogonal Axis:
“X” - denotes Laid on Table; ”Y” - denotes Vertical Stand; ”Z” - denotes Side Stand.
9.1.3 TEST SETUP LAYOUT
This test setup layout is the same as that shown in section 7.1.3
9.1.4 EUT OPERATION DURING TEST
The EUT was programmed to be in continuously receiving mode.
Page 48 of 50
Report No.: NTEK-2013NT0905144R-01
9.1.5 TEST RESULTS (ABOVE 1000MHZ)
EUT:
Wireless AP
Model Name :
Temperature:
26°C
Relative Humidity:53 %
Pressure:
1012 hPa
Test Power :
Test Mode :
RX
WNP-RP-002
DC3.7V
Polar
(H/V)
Frequency
Meter Reading
Factor
Emission
Level
Limits
Margin
(MHz)
(dBm)
(dB)
(dBm)
(dBm)
(dB)
V
V
H
H
H
5406.25
9225.00
5318.125
7932.5
9724.375
-66.02
-67.04
-65.97
-65.05
-65.18
7.87
11.22
7.37
9.95
10.38
-58.15
-55.82
-58.6
-55.1
-54.8
-47
-47
-47
-47
-47
-11.15
-8.82
-11.6
-8.1
-7.8
Remark:
Absolute Level= ReadingLevel+ Factor, Margin= Absolute Level - Limit
Detector
Type
peak
peak
peak
peak
peak
Page 49 of 50
Report No.: NTEK-2013NT0905144R-01
10.MEDIUM ACCESS PROTOCOL
10.1 APPLIED PROCEDURES / LIMIT
A medium access protocol is a mechanism designed to facilitate spectrum sharing with other
devices in a wireless network.
A medium access protocol shall be implemented by the equipment.
10.1.1 TEST RESULTS
The EUT is accord with medium access protocol.
Page 50 of 50
Report No.: NTEK-2013NT0905144R-01
11. EUT TEST PHOTO
Spurious Emissions Measurement Photos