1
CuteReport
User Manual
version 1.1
© Mikhalov Alexander
Table of Contents
Introduction............................................................................................................................................................................3
Licensing.............................................................................................................................................................................. 4
Designer...................................................................................................................................................................................5
Report Editor module........................................................................................................................................................ 6
Page Editor module............................................................................................................................................................ 9
Script Editor module........................................................................................................................................................ 12
Dataset Editor module.................................................................................................................................................... 14
Preview module................................................................................................................................................................ 16
Designer Options............................................................................................................................................................. 18
Creating Report template..................................................................................................................................................19
Report objects.................................................................................................................................................................. 20
"Hello World" report example........................................................................................................................................21
Memo object..................................................................................................................................................................... 22
Rotating....................................................................................................................................................................... 22
HTML tags................................................................................................................................................................... 23
Expressions.................................................................................................................................................................. 23
Text flowing................................................................................................................................................................. 24
Memo Helper............................................................................................................................................................... 25
Formatting................................................................................................................................................................... 27
Bands................................................................................................................................................................................. 28
Storages............................................................................................................................................................................ 29
File System storage (Standard::Filesystem)............................................................................................................29
GIT storage (Standard::GIT).......................................................................................................................................29
Resource storage (Standard::Resource)...................................................................................................................29
SQL Storage (Standard::SQL)....................................................................................................................................29
Datasets............................................................................................................................................................................ 31
"Customer List" example................................................................................................................................................. 32
Image object..................................................................................................................................................................... 35
Report with Images......................................................................................................................................................... 36
Multi-lined text display.................................................................................................................................................... 38
Text wrap of objects........................................................................................................................................................ 41
Complex wrapping...................................................................................................................................................... 42
Label printing................................................................................................................................................................... 45
Multi-page report............................................................................................................................................................. 48
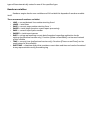
Script Engine.........................................................................................................................................................................49
Script objects.................................................................................................................................................................... 50
Script variables................................................................................................................................................................. 51
Local variables............................................................................................................................................................ 51
Global variables.......................................................................................................................................................... 51
Renderer variables...................................................................................................................................................... 52
Formatting........................................................................................................................................................................ 53
Script Signals.................................................................................................................................................................... 55
Using in custom application..............................................................................................................................................57
Project setting up............................................................................................................................................................. 58
Embedded library....................................................................................................................................................... 58
Standalone framework.............................................................................................................................................. 58
Simple example................................................................................................................................................................ 60
Custom application example.......................................................................................................................................... 62
Datasets............................................................................................................................................................................ 63
Model Dataset............................................................................................................................................................ 64
Introduction
CuteReport is a report solution based on Qt4 framework and it can be easily used with
any Qt application. In general, CuteReport consists of two parts: core library and template
designer. Both are totally modular and theirs functionality can be easily extended by writing
additional modules. It's totally abstract of used data and can use as storage: file system,
database, version control system, etc. The project's goal is to provide powerful, but yet simple
to use for inexperienced users and report designers, report solution.
Key features:
•
A number of data sources: SQL database, Text, File System, external data model
(QAbstractItemModel);
•
Various types of storage to keep report templates and report objects such as picture,
database, template: File System, GIT, SQL database, embedded storage;
•
Plain text or HTML support;
•
Variety of drawing elements to construct great looking reports: Memo, Image, Barcode,
Arc, Chart, Chord, Ellipse, Line, Pie, Rectangle;
•
Picture sources: static, dataset, storage
•
Unlimited number of detail bands within one report;
•
Report Title and Summary;
•
Page Header and Footer;
•
Element grouping;
•
Aggregate functions: count, min, max, avg, sum;
•
Plugin system to support extending of any functionality;
•
External parameters;
•
Entire application full featured scripting engine to manage any aspect of report
rendering;
•
Measure units: Millimeters, Inches, Pixels;
•
Standalone WYSIWYG template designer with ability to extend of any functionality by
using custom plugin;
•
Some pre-installed Designer plugins: Report Property editor, Page editor, Script editor,
Dataset editor, Preview;
•
Multi-platform;
Licensing
CuteReport is distributed in 2 version:
•
Community version under GNU/GPLv3 license to help open source developers to add
reporting functionality to theirs open source projects. Core Library is provided under
LGPLv2 and can be dynamically linked to proprietary products. CuteReport Designer is
provided under GPLv3 and it can not be compiled in to proprietary products. Read
GPL/LGPLv2 license description for more information;
•
Professional version under commercial license to provide high level support and highest
priority of bug fixing and feature implementing. Also commercial package provides
some CuteReport extensions that open source version does not have. In this
documentation such features are marked as "Professional version only". To review
commercial licenses visit project's web site
http://cute-report.com/en/article/licenses;
Designer
CuteReport solution comes with a standalone designer which helps to manage
CuteReport templates. CuteReport Designer itself has only few basic functions and provides
API to support modules. Modules are used to provide and extend any current or future
designer's functionality. Module can provide user interface elements (GUI modules). Some of
the basic GUI modules are: Report Editor, Page Editor, Script Editor, Dataset Editor, and
Preview. Each module provides its own functionality and can be dependent of the other
module(s). Also any module can be replaced by another one with extended functionality.
Lets take a look at the some of these modules.
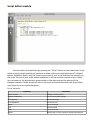
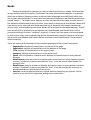
Report Editor module
Key to report editor features:
1.
2.
3.
4.
5.
main menu
modules bar
open reports tab
report parameters
embedded report modules
Report Editor is the first module on the designer tab bar. It is responsible for managing
report objects and providing such report operations as: load, save, create, delete, etc. These
operations are presented by controls on the Report Editor widget and also they are exported
to the application's main menu. This module can support a number of open reports at the same
time and switch between them. Also Report Editor manages embedded report modules like:
storage, renderer, and printer. If there is no embedded object of storage, renderer or printer
then the global one will be used. If you need special options for storage, renderer, or printer,
you should add object of required type to the report object and set desired object's options.
Report Editor has a table with global report variables and their values. These values are used in
rendering report process and can be set manually by using this table or directly by an external
application. You will often use this table to set default values for report parameters on testing
stage before integrating it to your external application. We will review how to manage report
by you program later. For now we will focus on managing report by using Designer application.
There all open reports are shown on the left bar (#3). Use it to switch between report
templates. Main module view contains some fields: URL, name, author, description. URL is set
automatically and shows path where report is stored. “Name” field contains report name.
“Author” field contains report author. And description, as you can guess, contains report
description. You can use these fields depending of you needs. They are not used by report
engine. On the right side (#4), as we mentioned above, there is parameters table. Parameters
are variables with an easy access from an external application. Parameter-variable appears
there automatically if it is mentioned somewhere in scripting expression within string property
of report's objects.. To test this behavior switch to the “Script” tab and type there “${test}”
without brackets. We will review Script module later. For now we can switch back to the Report
Editor module and see how new variable “test” appears in the parameter table. Now you can
assign any value to the parameter. You are also able to change this value directly from your
application. Usually, you need to assign any temporary value to all variables to be able to test
report template separately from your application.
Next is Options. This frame shows all embedded objects of storage, printer or renderer
type along with theirs parameters. You might want to use embedded objects in case your
report template is used on some computers with different access or settings or to avoid user
interaction. For example, you create report template for a special printer and you do not want
to show printing dialog and provide ability to user to change printer settings. Use embedded
printer object with all predefined parameters. Or you might want to integrate company logo
directly into report template instead of loading it from disk every time report is rendered. In
this case you can add Resource storage and save your logo in there. It can be helpful to
distribute CuteReport templates along with all theirs resources in one file.
There are some buttons for each list type: add object, remove object, set object as
default, clear defaults, rename selected object. As you can guess “add” and “remove” are
responsible for adding and removing object to/from report template. Default object of any
type means it will be used if you do not specify object name. For example, you can load object
into your report using full URL like “file:/home/user/images/logo.png” or just using
“/home/user/images/logo.png” if you have set default storage. Bear in mind that you will have
an error if you do not specify object name and do not have created default object.
Should be mentioned that object type specified by module name which object was
generated by and has representation as “SuiteName::ModuleName”. Standard module suite is
“Standard”. Commercial version has suite name “Extended”. You can have third party suites as
well with theirs own names. For example, standard SQL storage has name “Standard::SQL”. At
the same time extended SQL storage could have name “Extended::SQL”.
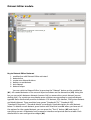
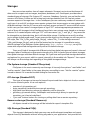
Page Editor module
Key to Page Editor features:
1. module bar with Page Editor activated
2. page bar
3. page tool bar
4. drop-down list of bands
5. drop-down list of items
6. zooming buttons
7. magnets enabling/disabling
8. rise/lower item
9. font editor
10. alignment editor
11. border editor
12. object inspector
13. property editor
14. property description
15. workspace
Page Editor module is responsible for making report page template. It provides tools for
managing page bands and items. To activate Page Editor press the "Pages" tab on the modules
bar (#1). Page bar (#2)shows all pages in the report. You can use it to switch between pages
(mouse left-click) or to rename current selected page (mouse left double-click). There are some
buttons on the page tool bar (#3) to provide some basic actions for a page: create new page,
delete current page, and clone current page. Next go 2 buttons with drop-down lists. First one
is for band selection and the second one is for item selection. After that you can see some
buttons for zoom operations and the next 4 buttons for enabling/disabling page magnets. If
magnets are enabled, the mouse pointer will stick to the other item's borders with the
coordinates which are closest to the current cursor coordinates. Sticking range factor can be
changed in the page property with name "magnetRate". Page Editor has some other tools to
change item properties, such as font editor, alignment editor, border editor.
On the right side of the page widget you can see Object Inspector. All items belong to
page are represented there as an item tree. You can switch between items using Object
Inspector or by clicking item on the workspace area(#12). Property Editor is the next element
to review. There are all editable properties that page has. By pressing on property name you
can see a short property description (#11). The Workspace (#12) shows the entire page
template. You can add a new band or an item to your page using drag-n-drop functionality
dragging the selected item from the drop-down list(#4, #5) to the page on the workspace.
Almost all items can be placed only on a band, and bands can be placed only on a page directly.
Press "Delete" button to delete the band or the item with all their children items.
It is possible to select some items and do group operations. To select some items click
first item and then hold CTRL and click on the other item. You can click direct on item on the
page or click item name in the Object Inspector. To perform further group operation use
editors on the tool bar. The changes you make will be applied to all selected items if item allow
it.
On the application status bar you can see current mouse position and geometry of the
current selected object.
Some item might have helper. Sometimes it is easier way to change object's property. To
open object helper, double click on the object. For example, if you click on Memo object you
will be able to use text editor to enter Memo text or expression. Some other editors can be
available too if appropriate modules are installed. Commercial version has some additional
modules that are not provided for community version.
Control Keys
Key
Action
Description
Ctrl+N
Report → New Report
Create new report template
Ctrl+O
Report → Open Report
Open report template
Ctrl+S
Report → Save Report
Save current report template
Report → Save Report As...
Save current report template with another file name
Report → Close Report
Close current report template
Ctrl+W
Del
Delete current item
Mouse controls
Operation
Description
Left button
Select object; paste new object; move or resize selected object
Right button
Select object, paste new object; move or resize selected object with assigning new
parent item at the mouse button leave position
Left double-click
Open object's helper
Mouse wheel
Scroll report page
Ctrl+left button
Add/remove object from selection group
Script Editor module
You can switch to Script Editor by pressing the "Script" button on the module bar. Script
editor is pretty simple module and contains an editor with syntax highlighting and "Validate"
button. Validation checks only the syntax correctness of your script and does not actually run
the script. So even if your script passed validation, it still can contain runtime errors. Usually
you can see error list by pressing a green button in the status bar on the bottom of the
Designer window. If there are errors exist in the script the button becomes red. Script Editor
uses javascript as a scripting language.
List of controls:
Клавиша
Описание
Cursor arrows
Change cursor position
PageUp, PageDown
Go to Previous/Next page
Ctrl+PageUp
Got to text begin
Ctrl+PageDown
Go to text end
Home
Go to line begin
End
Go to line end
Enter
Go to Next line
Delete
Delete char in cursor position; delete selected text
Клавиша
Описание
Backspace
Delete char left to cursor position
Ctrl+A
Select all text
Since CuteReport uses standard javascript syntax, refer to JavaScript
documentation if you experience difficulties with this language.
Dataset Editor module
Key to Dataset Editor features:
1.
2.
3.
4.
5.
6.
modules bar with Dataset Editor activated
datasets bar
create new dataset buttons
delete current dataset
test dataset
dataset helper
You can switch to Dataset Editor by pressing the "Dataset" button on the module bar
(#1). All created datasets of the current report are shown on the dataset bar (#2). Using this
bar you can switch between datasets (mouse click) or rename the current dataset (mouse
double-click). For creating a new dataset press a button corresponding to required dataset
type #3. Basic distribution provides 4 datasets: CSV dataset, SQL dataset, File System Dataset
and Model dataset. These modules have names “Standard::CSV”, “Standard::SQL”,
“Standard::Filesystem”, “Standard::Model” accordingly. Read description for each dataset
below. To delete current dataset, press button with trash bin icon #4. When you have set all
the options for the created dataset, you can press the "Test it" button (#5) and check if
everything correct. All datasets have a common interface and provide data as a table. Each
dataset has its own configuration widget (#6).
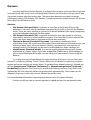
Preview module
Key to Preview features:
1.
2.
3.
4.
5.
6.
7.
8.
module bar with Preview activated
rendering start/stop button
fit page to view button group
zooming button group
page navigation
export to file
print
rendered page
The job of the Preview module is to display rendered report pages. There are some
useful button groups to help you. By first, there is the button to start rendering process of
current report template (#2). Every time you need to render or re-render your report template
this button will be helpful. As alternate variant you can use main menu action: Main Menu ->
Service -> Render or just press F5 on your keyboard. If your report requires some time for
rendering then process dialog will appear. To stop current rendering process press this button
again (or press F5). When report is rendered you can change zoom by using buttons: fit to page,
fit width, zoom in, zoom out (#3, #4) or you can set any zoom you want by entering percent
value in percent representing widget. To change current page use buttons: First page, Previous
Page, Next Page, Last Page or set page number directly in the page number widget. Finally, you
can print rendered report (#7) or export it to a file(#6).
Designer Options
TODO
Creating Report template
In this chapter we will review some general aspects of report designing. We will look
close on some important items and theirs properties and will make some report examples.
Make sure you have CuteReport installed and try to make these examples by yourself using
pre-installed test databases. Since CuteReport is in active developing, some parts of this
documentation can differ from your CuteReport installation.
Report objects
CuteReport Designer's Page Editor module is designed to represent report as a set of
schematic pages. All objects are placed somewhere on a report page and they are used to
display any text or graphics information. Basic CuteReport objects are included to Community
CuteReport edition package. Some extended objects are included to Commercial package.
Let us review object set.
Bands:
•
•
•
•
•
•
•
•
PageHeader: band located on the top of page
PageFooter: band located on the bottom of page
Detail: band that connected to dataset and processed with each dataset iteration
DetailHeader: band that located on top of details group
DetailFooter: band that located on bottom of details group
Title: band that located before detail band(s)
Summary: band that located after detail band(s)
Overlay: band with the free accommodation, can be places anywhere on page without
layouts
Items:
•
•
•
•
•
•
•
•
•
•
Arc: item that draws arc
Barcode: item represents barcode
Chart: item that draws any kind of charts
Chord: items that draws chord
Ellipse: item that draws ellipse
Image: item that draws dynamic or static image in PNG, JPG, BMP and other formats
Line: item that draws horizontal, vertical or diagonal line
Memo: item that represents any text information, plain text and HTML formats are
supported
Pie: item that draws pie
Rectangle: item that draws rectangle
The basic objects most commonly used are the “Detail” band and “Memo” item. You will
learn about their capabilities in detail later in this chapter.
"Hello World" report example
This simple report example contains just one piece of information: "Hello World!" text.
Open CuteReport Designer, create new report template using Report → Create Report, go to
the "Page editor" using left tab panel and create new page. Since any item can be placed only
on carrier band, we must place any band first. Click on the button "Bands"
and select any
simple band, for example Page Header. Click somewhere on the page to place this band. Then
click on the button with the title "Items" or icon
and select "Memo" . There is also
Extended Memo item exists in the professional version, that extends functionality of the basic
Memo. Use any of them if you have both. After selecting Memo item, click somewhere inside
Page Header to place selected Memo. The object will be placed at the mouse position.
Depending of your local settings Memo Helper dialog will appear immediately or you
can double-click on the Memo to show this dialog. Type "Hello World!" and then click "Ok"
button.
Now Report template is completed. To generate actual report select in main menu "Service →
Run" or press "F5" on your keyboard. Designer will be switched to the "Preview" tab and
rendered report page with "Hello World!" will appear. Rendered report can be printed or
exported to one of the supported export formats.
Memo object
The Memo object has many great features to draw text. It can draw text in a frame and
can be filled with some color. The text can be displayed using any font with any size and style.
All the properties can be set using Property Editor or visually with the help of the tool bar
editors.
Here you can see some samples:
We will make a simple example of Memo with two lines of text:
First text line with some very useful info.
Second line with some other useful info.
Enable Memo borders from Property Editor and resize item up to 90x30 mm using mouse or
Property Editor. As you can see now Memo can display not only a single line but several lines of
text as well. Try to reduce Memo width to 50 mm. Obviously, lines can not fit to the object's
border and will be wrapped. This is controlled by TextFlags::TextWordWrap object property. If
it is disabled any long line will be cut short. Lets play with other TextFlags and see what we can
obtain.
Rotating
Lets take a look at the other feature: rotation. Any object including Memo can be
rotated to any angle in degree range 0..360. Set required angle in the Property Editor by
changing property "rotation". Memo borders will be aligned accordingly, so you don't need to
care about the borders.
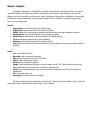
HTML tags
Memo object allow most of HTML tags. Tags can be placed within Memo text. Tags are
disabled by default. For HTML tags detection set property “allowHTML” to "true". There are
some examples below.
<i>Memo</i> <b>example</b><br>
E = mc<sup>2</sup\><br>
A<sub>1</sub> = B<sup>2</sup><br>
this is a usual text, <font color=red>and this is a red one
</font><br>
this is a usual text, <font color="#FF8030">and this is an orange one</font>
Expressions
Expression is one of the most important feature of Memo object. It allows to display not
only static text but runtime expression result as well. Expressions can be mixed with a static
text. To learn how it works enter the text above to the Memo object:
Now is [QDateTime.currentDateTime()]
(or simplified variant with taking locale into account: "Now is [DATE]")
and render report by pressing "F5" on your keyboard. You'll see result of the rendering,
something like that:
Now is Fri Jul 18 2014 00:44:22 GMT-0700 (PDT)
(or for DATE variable: 18/07/2014 or 07/18/2014 depending of your locale)
Why is that so? CuteReport renderer recognizes every expression instance, calculates it
and replaces expression with its result. Memo text can contain a number of expressions.
Expression can use complex arithmetic, constants, variables, objects and theirs properties. But
there are some possible issues may occur if our normal text contains square brackets that do
not mean to be an expression. For example, we want to draw:
array[0] = 'Banana'
Entry [0] will be recognized as an expression, calculated with result 0 and will placed to our
text. As result we will see:
array0 = 'Banana'
which is definitely not that we supposed to see. There are 2 solutions:
•
•
set "allowExpressions" property to "false" to disable any expression into current Memo
item
change default square brackets to any symbols or symbol set you want in the
"expressionDelimiter" property
In the first case entire text will be recognized as a regular text without expressions. In the
second case expressions will be recognized using another "begin sign" and "end sign". You can
use "<" as begin and ">" as the end, but only if you don't use HTML text. If you do use HTML you
might use "<%" as begin and "%>" as the end. Expression detector works before text
rendering, so any of your expression delimiters will be cut off from your text. Do not use the
same symbol set as the "begin" and the "end" sign.
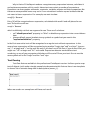
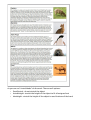
Text flowing
Text flow feature available in the professional CuteReport version. It allows you to wrap
text of objects. Let's make a simple example to demonstrate this feature. Here is our template
to show a list of animals along with its descriptions (memo_1):
When we render our example we will have such result:
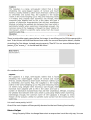
There is noticeable empty space below the image. It would be good to fill this space with a
text. To do this we will add new Memo item under the current description Memo, disable
stretching for first Memo. Instead we set property “flowTo” for our second Memo object
(memo_2) to “memo_1”. It should look like there:
Our rendered result:
It is much more pretty. Isn't it?
One of the next chapter will be specially devoted to the text flowing functionality
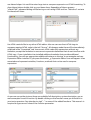
Memo Helper
Using Property Editor to change Memo text or expression is not the only way. You can
use Memo helper. It is useful to enter large text or compose expression or HTML formatting. To
show Memo helper double click on your Memo item. Depending of Memo propery
“allowHTML”, appeared dialog will be having or not having HTML tool bar. There are 2 variants
for these both cases:
Use HTML controls like in any other HTML editor. Also use can use direct HTML tags to
compose required HTML code in the tab “Source”. All changes made there will be immediately
reflected in the “Formatted” tab. You can mix HTML code with expressions without any
limitation, except the limitation to use correct expression delimiters that do not interfere with
HTML tags. If your installation has installed additional modules that provide additional
functionality, you will see appropriate additional buttons on the top. In our example we have
Expression Editor installed. If you press the button
Expression Editor form will appear. It has
some tabs and represent variables, functions, methods that can be used to compose
expression:
As you can see on the pictures there are available full description, syntax description, one or
more examples for each function. By double clicking on the function name you will add it to
your text expression. Pay attention to sigh “~” in some of the added functions. This means it is
required to type correct value of the function parameter.
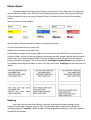
Formatting
[TODO]
Detailed description of formatting string see in Chapter “Script Engine” → “Formatting”.
Other Memo properties:
•
•
•
•
stretchMode: object stretchability to fit text
showStretchability: do stretching not only on rendered page, but on Designer's Page
Editor as well
expressionDelimiter: two strings separated by comma which means the begin and the
end of scripting block.
stretchFont: set automatic font size to fit Memo text within Memo width
Bands
Bands are designed for dynamic or static positioning of items on a page. Each band has
its own position and functionality. CuteReport has some special bands designer to represent
data from a dataset. Dataset contains structured data organized into rows(lines) which have
one or more columns(fields). To print data from datasets CuteReport uses these special bands
named "Detail...". To make it work, add one or more such bands to the page, connect them to
the dataset and place Memo items on them. Once band is connected to the dataset, Memo will
have button on its right side with the drop-down list of dataset's field names (commercial
version only). At the rendering time these bands will be printed on the rendered page. "Detail"
band usually will be printed once per dataset row, DetailHeader and DetailFooter will be
printed accordingly to theirs "condition" property. If there is no free space to print new band
on the current page, new rendered page will be automatically created to continue. New page
will print all page headers and footers before continue to print Detail bands. This process is
called rendering.
There are some bands included into the standard package and theirs short description:
•
•
•
•
•
•
•
•
PageHeader: displays all nested items on the top of the page
PageFooter: displays all nested items on the bottom of the page
Title: displays all nested items on the report begin
Summary: displays all nested items on the report end
Detail: must be joined to a dataset and it displays all nested items on every dataset
iteration
DetailHeader: must be joined to a dataset and can be shown on every dataset iteration
or when "condition" property calculated as "true". It can be used to show header for
group of lines.
DetailFooter: must be joined to a dataset and can be shown on every dataset iteration
or when "condition" property calculated as "true". It can be used by the same way as
detailHeader but at the bottom of the group.
Overlay: can be located anywhere on a page without respecting any layouts. Can be
used as carrier band for foreground, background, watermarks.
Storages
Now we review another class of report elements. Storage is a structure that keeps all
data used in a report such as images, templates, databases, etc. CuteReport provides some
standard types of storage: File System, GIT, resource, Database. Certainly, you are familiar with
some or all of them. Further we will review each storage detailed, but for now lets review
common aspects of storage class. In the CuteReport you can create any number of instances of
each type. It is useful if you have some remote systems that stores reports or one system with
different settings. Like one GIT server with read only access and one GIT server with full access.
In this case you can create 2 storage objects of type “GIT” and set appropriate parameters to
each of them. All storages in the CuteReport have theirs own unique name, based on a storage
schema. So 2 created objects with type “GIT” will have names “git_1” and “git_2”. Any name can
be changed to any desired string, but it still should be unique. CuteReport core will not allow
you to assign already used name. To get access to the object on the storage you will use path in
URL style, like: “file_1:/file_path/image_file.jpg”, where “file_1” is the storage name and
“/file_path/image_file.jpg” path to the file located on the storage. It is possible to assign
default storage in the Designer Option dialog using "Tools → Options → Storage", so any file
name with unspecified storage name will pass to the default storage.
There are 2 kind of storage with different priorities: global storages and report's internal
storages. When CuteReport engine meets storage url by first it checks internal report storages,
then global storages and then default storage. So if you have well specified storage destination
and options for your report, add it to report internally in the module tab “Reports”. Your report
will always use this storage not regarding of the global storage settings.
File System storage (Standard::Filesystem)
FileSystem is the most commonly used storage. It has only few options: "root folder" and
"ask for rewrite". Root folder is the upper directory accessible to user. "Ask for rewrite" option
is used to detect if it is needed to show dialog for overwrite file.
GIT storage (Standard::GIT)
This type of storage can be used to keep all reports and theirs objects in local or remote
GIT version control system. It has such options:
•
•
•
•
•
remote url: git repository url
login, password: credentials to access git repository
local path: local directory where git repository will be cloned to
git binary: git console binary. CuteReport uses external git binary to operate git
repository, so it has to be defined
"sync now" button: button for cloning or pulling data from a remote repository
Resource storage (Standard::Resource)
All objects stored in this storage will be included to report's template file.
SQL Storage (Standard::SQL)
This storage is designed to help you easy save and load report templates and report
objects from SQL databases without writing any code in your application. Just provide info
about the database and correct data table and field where the reports or object are stored.
Datasets
As it was mentioned before Dataset is an object that contains structured data organized
into rows(lines) with one or more columns(fields). Dataset can fetch data from any source and
it provides common interface to the data. There are some datasets provided in the basic
CuteReport edition: SQL Dataset, CSV Dataset, FileSystem Dataset, Model Dataset. All of them
fetch data from different sources.
Datasets:
•
•
•
•
SQL Dataset (Standard::SQL): It provides an interface to fetch data from an SQL
database. It can work with any database supported by Qt itself, ie that has Qt database
driver. There are some settings to connect to a remote database (like mysql, postgresql)
or to use embedded database file (like sqlite)
CSV Dataset (Standard::CSV): It provides an interface to a data stored in a file and
separated by comma or other predefined symbol. It can load data from an external file
every time when populated or load and cache the data internally
Filesystem Dataset (Standard::Filesystem): It provides an interface to fetch
information from a file system and show disks, files and directories information as a row
structured data. There are some options: filtering, recursion level, max number of
exposed records. This dataset can be used to make goods list, photo catalogs, etc.
ModelDataset (Standard::Model): It is used to export prepared data from a custom
application to a report object. If you have widget like QTableView or QTableWidget or
your custom filtered/sorted model you can easily print data stored in there using this
dataset.
Try to play with each of the dataset to understand how they work. You can fetch data
and see it in table by pressing "Test it" button. Data from all dataset is exposed to scripting
engine and can be used by any report object. To get data from dataset where it's allowed you
can use [datasetname."fieldname".lineNumber] or [datasetname.getValue("fieldname",
lineNumber)] expression. First form is just shortening of the second one. Every short form
replaced by full form internally before script execution automatically. Line number can be
skipped in any form. In this case, current dataset line will be used.
For more detailed information regarding each dataset refer to chapter Datasets.
Further we will see how to connect dataset to a band and how to use dataset's data.
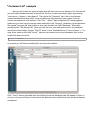
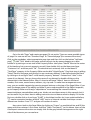
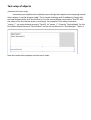
"Customer List" example
Now we will create our second report and will learn how to use datasets. For that we will
use test sqlite database named "business.db". By first, create new empty report by pressing
"main menu -> Report -> New Report". Then go to the "Datasets" tab, click on the dataset
names combobox and select SQL. Now you have one SQL dataset in your report. Lets set
correct parameters for the dataset. Click "File...". When "Open database file" dialog appears,
make sure you have correct storage name selected in the "Storage" combobox, locate database
file named "business.db" and choose it. Now you should have field "Database:" filled with
something like "file:dataset.db". Since we have no host, user and password for this database
we will skip these fields. Choose "SQLITE" driver in the "Available Drivers:" list and press "<<" to
copy driver name to the field "Driver". Now we can connect to out test database. Lets write a
simple SQL query to test it:
select * from customer
As a result you will have something like on the picture below:
Click "Test it" button and table with the fetched from the database data will appear. If there is
an error exists you will see it in the status bar bottom frame. Well done! Now you have dataset
completed.
Go to the tab "Page" and create new page if it not exists. There are some possible types
of page. For now we will use "Standard Page" or "Extended page"(for commercial version).
Click on the combobox, select appropriate page type and then click on the button "Add new
page" . Add "Title" band to the page, and set correct size by mouse dragging on a blue
handle or by setting a correct size in the Property Editor. Now place "Memo" item to the center
of the band and set a correct geometry as well. Now double click on the Memo and type
"Customer List" and then press "Ok". To make this text centered, click on the Memo's
"TextFlags" property in the Property Editor and enable "AlignHCenter" flag. Next step is adding
"Detail" band to the page and joining it to our customer dataset. To do that activate the Band
by clicking on it and type "data" in the band's property "dataset". Entered text "data" is the
name of our dataset. You can change the name of any dataset by double-clicking on the
dataset tab in the Dataset Editor. Now it's time to add some "Memo" items to the band:
number, first name, second name, address, city, zip code. To make item arrangement more
easy, you can enable magnets by pressing magnet buttons on the top of the Page Editor. If you
want to change name of the object and make it more understandable in the Object Inspector,
go to Property Editor and change "objectName" to something like: memoFirstName,
memoLastName, memoAddress and go on. We do not use these names in this example, but it
can be useful for you later. Next is adding instruction to our Memos what to display. Go to the
first one, double click on it and type "[LINE]" in the Helper's editor. As it was explained before,
"[]" means expression borders and the “LINE” text is an internal variable that keeps current
dataset row number. Press "F5" and you will see how it works.
Now return back to the Page Editor by clicking on "Pages" on module tab bar and fill the
memo with the customer's first name. Add text "[data."firstname"]" to this Memo. Users of the
CuteReport commercial version can simply click on the gray button that appears on the right
side of the Memo as you can see here:
This drop-down list contains all the fields in the dataset Memo related to. It works only
for Memos located on bands that have property “dataset” filled and the filled dataset exists
and properly initiated.
Do the same for all other items and set correct dataset field to draw. Press "F5" and you
should see something like this:
If you don't have such result, you can load report CustomerList.qtrp from the CuteReport
package and figure out what you did wrong.
Image object
Image object is designed to represent any images in the supported graphical formats.
Currently supported formats: BMP (Windows Bitmap), GIF (Graphic Interchange Format), JPG
(Joint Photographic Experts Group), JPEG (Joint Photographic Experts Group), PNG (Portable
Network Graphics), PBM (Portable Bitmap), PGM (Portable Graymap), PPM (Portable Pixmap),
XBM X11 (Bitmap), XPM (X11 Pixmap).
Lets look closer at this object. Create a new report, add a new page, add an Image item.
There are some data sources for the Image available: Static, Storage, Dataset. Type of source is
defined in sourceType property.
Let's review each option:
•
•
•
Static: allows you to load Image from a file and keep loaded data inside the object. File
must be loaded manually by pressing "image" property in the Property Editor.
Storage: allows you to load file in runtime. Image property "source" must contain the
path to the required file. If path does not contain storage name default storage will be
used. Property "source" can contain expressions. For example, if source is defined as
"file:/[data."filename"]" then report engine it will try to take file name from the
database “data” and then will try to load this file from the storage with name “file”.
Dataset: allows you to load file from a dataset blob. Image property "source" must be
defined in the same way as for "Storage".
A list of some other important properties:
•
•
keepAspectRatio: If it is set to "true", image will always keep original aspect ratio while
scaling.
Center: If it is set to true, image will always be centered in its frame.
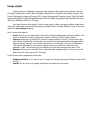
Report with Images
In this chapter we will learn how to use an Image object and a File System storage.
Let's create a new report, add a new page, add Title and Detail band. Next is creating File
System dataset. Go to "Datasets" tab, choose Standard::FileSystem and click it. Choose any
directory that contains some pictures by pressing "Select dir..." button. Set "maxNumber" to 6.
This is maximum records that dataset will fetch. Disable flags: Directories, All Directories. Add
filter: ".jpg; .png" or any other graphic formats you want. Set "Path appearance" to
"AbsolutePath", so we will be able to load picture using its absolute path. Now press "Test it".
As a result you should see the list contains 6 files or less with the file format you have set in
your filter.
Now go to the Page Editor. Add Memo object to the Title band, type there "Customer's
pictures" and make text centered. For the better appearance change "backgroundBrush" for
the Title. Set "backgroundBrush::style" to "SolidPattern" and "backgroundBrush::color" to
#688482. Now change text color. Click on the Memo and change property "textColor" to white.
Well done!
Now we are starting to create image frame. Set height of the Detail to 30mm. Add Image
object to the right side of the Detail and change its size to fit to the detail. Set "sourceType" as
"Dataset" and "source"as "file://[data."name"]". As you remember everything inside the square
brackets will be identified as an expression and will be replaced by the expression result. So
our expression finally will be looking like "file://picture_path/picture.jpg". Well, there is
another very important thing: if report loads any data in runtime, it MUST have storage
assigned!. This is done for security. In some cases you may not allow user to use any storage
CuteReport has. So go to the "Reports" tab, and add "Standard::FileSystem" storage in the
"Storage" tab. We have images path as absolute path, so clean up "Root folder" for this
storage.
And the last step is creating Memo item that contains file's path. Add a new Memo to
the left side of the Detail band and type there: "[data."Name"]". Users of the Commercial
version can simply press the button that appears when you hover mouse over the Memo.
Finally you report template should look like this :
Now it's time to press "F5" and enjoy result:
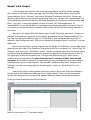
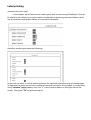
Multi-lined text display
Let's proceed further and learn how to manage multi-line text. In the previous chapter
we have learned how to make new report, create dataset and connect dataset to a band. So
lets do it:
•
•
•
•
•
create new empty report
add a new SQL dataset and use test sqlite dataset "animals.db" which you can find along
with the CuteReport distribution or take it there:
https://github.com/AlFoX/CuteReport_examples/tree/master/datasets.
add Detail band
put 2 Memos on the band: first is the animal name, second one is the animal description
put Image item to the right side of the band
Now lets look closer how to create Dataset. When you have added SQLdataset, point it
to your "animals.db" file, set Driver - "SQLITE" and add the sql query - "select * from animal".
Press "Test it" and check if all fine. Below you can see how it should finally look.
When this part is completed, go back to the Page Editor and set correct fields to display
for the Memo's. The first topmost Memo is an animal name. So double-click it and type:
[data."name"]. Users of the commercial version, can simply click on the appeared button on the
right side of the Memo and choose field from the drop-down list. If it doesn't appear check if
your band is connected to the correct dataset, i.e. dataset under the Memo has filled field
"dataset". Set Bold text for the animal name by clicking on the "font" property in the Property
Editor or by using font editor in the tool bar. Now go to the second Memo. It is animal
description. So type or select there: [data."description"]. Simple, huh? Lets look the result and
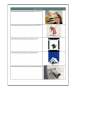
render our report (press "F5"):
Doesn't look good, right? Some of the descriptions were cut-off. Sure we can simply change the
description Memo's height to fit largest text, but there are some disadvantages:
•
•
•
paper wasting, since we will not use entire Memo's room for small text
you newer know how long text will be or it can be changed in future
it just doesn't look pretty :)
Go ahead and fix it: set Memo property "stretchMode" to "ActualHeight", set Detail property
"stretchable" to "true" and generate report again.
As you can see "stretchMode" do the work. There are all options:
•
•
•
DontStretch - do not stretch the object
ActualHeight - stretch the height of the object to fit all assigned text
MaxHeight - stretch the height of the object to reach bottom of the band
Text wrap of objects
(commercial version only)
Sometimes you might want to develop report design that requires text wrapping around
other objects. It can be Image or table. This is simple challenge with CuteReport. Simply add
one new Memos where text should flow to. For the second Memo set property "flowTo" with
the name of the first Memo where is text begin. For example if first Memo has name
"memo_1", set second Memo property "flowTo" to "memo_1". Property "StretchMode" for the
first Memo should be set to "DontStretch" and for the second one to "ActualHeight". That's it.
Now lets render this template and see how it looks:
For this example we have set textFlag property to AlignJusify. It is not necessary to set text
flags to all Memos, so set them only for the first one. Every subsequent Memo inherits this
setting.
Complex wrapping
Making complex wrapping is not really much complicated. Take a look at the next example:
As you may notice there are 3 Memo objects that used to fit text: first in the middle top
contains text "[data."description"]". Second one is laying under the Title memo and covers left
and central part. Third one is located on the bottom under all other objects. Its height is set to
minimal, since for some short texts it will not be used. So we do not need space wasting. Every
next Memo joined to the previous one by setting property "flowTo". The property
stretchMode of the last item is set to "ActualHeight". First two items do no need to stretch, so
theirs property is set to "DontStretch". Press "F5" to render and voilà:
You do not have to care about object insertion order, you can add Memo objects to
report page in arbitrary order. Once you set correct "flowTo" name all is done. CuteReport is
smart enough to understand what do you want and it hides all routine work from your sight.
Enjoy!
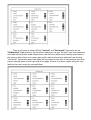
Label printing
(commercial version only)
In this chapter we will see how to create report with columns using CuteReport. That can
be useful to print labels or so. Let's create a simple report containing customer labels to print
out on customer case folders. Below you can see this example:
And after rendering we have the following:
As you can see there is a lot of wasted space on the right side, therefore a lot of wasted paper.
To optimize the space we will set a number of columns that will fit all our labels. It can be done
using "columns" page property. Set it to "3" in the Property Editor on the right side of the
screen. Then press "F5" to generate report.
There are 2 types of column filling: "Vertical" and "Horizontal" that can be set via
"fillDirection" Page property. On the picture above you can see "Vertical" type that means any
next label will be printer under the previous one and so on while there is empty space exist in
the column. When there is no space, report will create a new column and start from the top.
"Horizontal" type means every next label will be printed on the right of the previous one while
there is enough space on the right side of the page. If there is no space, report will print next
label on the next row as you can see below:
You can set any type depending of your needs. Not all bands respect column setting.
Some ignore it, like PageHeader, PageFooter. Some other have special property to adjust this
behavior, like DetailHeader or DetailFooter. Using this option you can design complex
columned reports. One of the samples of columned report with grouping you can see below:
Multi-page report
It is possible to create several design pages in CuteReport. This feature is useful if report
should contain different pages with different sizes, orientations, etc. In this case report engine
will fully render first page and then second and so on. Total number of template pages is not
limited. Let us look at the simple example with 2 pages where the first one is title page and the
second one is report itself. We will use our previous example "Customer List". To add new page
click on the button on the Page Editor's toolbar. If there are some types of page you will see
drop-down menu. Then choose page type you want by clicking it. New page will be added to
the report. Move it to the first place by clicking . Since item cannot be placed direct on page,
we will add Overlay band to the middle of the page. Now add Memo item to the band and
enter text "Customer Report" in there. Render report and now it should look like:
Script Engine
In this chapter we will learn how to work with CuteReport script engine. Scripting
feature brings an extremely high level of flexibility. Using script user can control almost every
rending step and design really complex reports. There is main script in a report that control
everything from report starting till it's rendered. Some items like Memo or Barcode are
supporting script in their text properties. Usually scripting expression have to be framed by [],
so the scripting engine will know that this is a script and not regular text. But to some fields
where only script expressions is allowed it can be written without []. Some items can
reimplement “[]” to use something else and provide additional field to define script expression
borders, like "expDelimiter" in a Memo object.
Script objects
All report objects are accessible from script by unique object name. For example, if you
have Memo object with name memo_1 and you want to change its color, you can do it by the
next way:
memo_1.backgroundBrush = new QBrush(new QColor("#665544"));
memo_1.color = new QColor(Qt.red);
All object properties you see in Propery Editor can be manahed via script. Some objects
may have two or more propertyes with the same name, like propery "stretchMode" of Memo
element. There are 2 types: enum and string. You can use any of them like:
memo_1.stretchMode = "DownStretch";
memo_2.stretchMode = Memo.ActualHeight;
Script variables
Any object or value is stored in script as variable. You can create your own custom
variable on the start of report processing and then change its value while report processing.
Script Engine may have its own internal variables that user can access to.
Local variables
Variables can be declared and used in script locally. Once variable declared it can acquire
any arbitrary value. Here is an example:
var myVar = "Hello World!";
When you have declared variable you can use it in any report's object, for example,
Mome, typing “[myVar]” in property “text”. For more detailed information regarding JavaScript
variables refer to JavaScript documentation.
Global variables
Any global variables declared in report can be accessible from script expression. Other
name of global variables is parameters. Variable name should be declared as: ${my_variable}
without spaces in variable name within brackets. It is recommended to use two variants of
variable naming if the name contains some words, like “my super duper variable”. First variant
is to replace spaces with underscore sign “_”, like “my_super_duper_variable”. Second variant is
to remove spaces and use first capital letter on any word after the first one like
“mySuperDuperVariable”. Internally Script Engine uses special representation of the global
variables. So using "_" in the begin of variable name highly not recommended.
Once variable declared it will be automatically added to the list of global variables. Let
us demonstrate it. Open new report, go to “Script” tab and type “${test}” in there. Now switch
to the “Reports” tab. You will see new variable appears in the list of reports global. Now you
test your report by assigning any value to this variable.
Some variable types available for external variables (parameters): String, Boolean,
Integer, Double, Date, Time, DateTime. In case variable is passed from external program, its
type will be automatically casted to one of the specified type.
Renderer variables
Renderer engine has its own variables and full variable list depends of renderer module
itself.
There are some of renderer variables:
•
•
•
•
•
•
•
•
•
LINE — current dataset line number starting from 1
LINES — total lines
PAGE — current page number starting from 1
PAGES — total pages (requires o pass report processing)
PASS — current report pass number
PASSES — total report passes
DATE — string representing current date formatted regarding application locale
settings (professional version only). Function QDate.currentDate() can be used instead
of this variable
TIME — current time (professional version only). Function QTime.currentTime() can be
used instead of this variable)
DATETIME — datetime object that contains current date and time and can be formatted
to any representation using formatting tag
Formatting
(professional version only)
Any expression calculated by Script Engine can be formatted for better appearance. To
do that followed format is used:
[expression #tag]
where “expression” is scripting expression, and “tag” is formatting tag. Tag should be located
after the expression and it is separated from the expression by space followed by # sign. No
other symbol after the tag is acceptable.
Formatting tag contains of two parts separated by percent sign “%”: expression type and
formatting options. Expression types and theirs codes can be:
•
text — s
•
numeric — n
•
date — d
•
boolean — b
Formatting options depend of the type.
Formatting options for text type:
•
(empty) — no formatting required;
•
l — (low case) all text should be printed using low case letters. Example: original text
“Text” → formatted text “text”;
•
u — (upper case) all text should be printed using upper case letters. Example: original
text “Text” → formatted text “TEXT”;
•
fu — print first letter of any sentence in upper case. Example: original teext “just a text”
→ formatted text “Just a text”;
•
s — print text using sentence formatting, i.e. first letter is in upper case and period sign
at the end. Example: original text “just a text. Additional text” → formatted text “Just a
text. Additional text.”;
Formatting options for numeric type in general look like:
[flag][number of integer digits][decimal separator][number of decimal digits][additional char
formatting option]
Any component in numeric formatting can be skipped. “Flag” has anly one effective
value “+” and it directs to print positive sign for positive values besides negative sign with
negative values.
Number of integer digits shows minimal number of digits in integer part of value. All
missing digits will be filled by zero.
Decimal separator shows which symbol will be used as decimal separator. The most
often used symbol is dot “.” and comma “,”. To print standard separator for current application
locale settings use sign “?”. Any other non numeric symbols can be used as well, for example
“-”.
Number of decimal digits determines minimal number of decimal digits after the
decimal dot. If this number contains is less number if digits then missed digits will be filled by
zero.
Additional char formatting option can be followed:
•
f — fixed number of decimal digits. Any extra digits will be discarded.
•
n — like above but with adding thousand group separator
•
m — money formatting used for current application locale settins
Examples:
[12345. 6 #n%7] → «0012345.6»
[12345. 6 #n%+7] → «+0012345.6»
[12345. 6 #n%4.2] → «12345.60»
[12345. 6 #n%4-2] → «12345-60»
[12345. 6 #n%m] → «12345.60 грн.»
[12345. 6032 #n%4.2f] → «12345.60»
[12345. 6032 #n%4.2n] → «12,345.60»
Date and time formatting options:
•
text — includes day and month name, number of day in month and full year. Day and
month names are printed in shortened form defined in current locale. It is equial to “ddd
MMM d yyy”
•
short — print short date form
•
long — print long date form
•
dd.mm.yyyy — date in format '23.12.2015'
•
dd mmm yyyy — date in format '23 Nov 2015'
•
dd mmmm yyyy — date in format '23 November 2015'
•
hh:mm — time in format '23:12'
•
hh:mm:ss — time in format'23:12:01'
•
dd mmmm yyyy, hh:mm — date and time in format '23 November 2015, 23:12'
Script Signals
When you write a script it means you write main function, which is processed on the
report generator's start. In this function user can create some variables, initialize them or do
some other preparations. You still might want more control over report processing. To make it
possible almost everyone report object has signals and you can assign your custom slot to
these signals. For example you can assign your custom filter to Detail band and hide some
bands while pass another. Lets review some signals and later will see how we can use them.
Common item signals:
Signal Name
Description
printInit
emitted when all items are preparing to be printed
printReset
emitted when all items are cleaned up after printing
printCreatingBefore
emitted before item printing. All property changes affects original
template item
printDataBefore
emitted when initial data for printed item is prepared. All property changes
affects only current printed item and will be reset
printBefore
emitted after all item's data is processed, but before actual printing
printAfter
emitted after item is printed on a page
Also any item can have its own signals. You can see full signal list along with signal description
in a Property Editor.
Renderer signals:
Signal Name
Description
reportStart()
emitted after report started
bandBefore(CuteReport::BandInterface * band)
emitted before band rendering
bandAfter(CuteReport::BandInterface * band)
emitted after band is rendered
bandGemetryAfter(CuteReport::BandInterface * band)
emitted when band's geometry is
managed
itemBefore(CuteReport::BaseItemInterface * item)
emitted before item rendering
itemAfter(CuteReport::BaseItemInterface * item)
emitted after item is rendered
itemGeometryAfter(CuteReport::BaseItemInterface *
item)
emitted after item's geometry
managed
datasetBefore(CuteReport::DatasetInterface * dataset)
emitted before dataset processing
datasetAfter(CuteReport::DatasetInterface * dataset)
emitted after dataset processed
datasetIteration(CuteReport::DatasetInterface *
dataset)
emitted on every dataset iteration
pageBefore(CuteReport::PageInterface * page)
emitted before template page
processing
pageAfter(CuteReport::PageInterface * page)
emitted after template page
[processing
Signal Name
Description
formBefore(CuteReport::FormInterface * dataset)
emitted before form is shown
formAfter(CuteReport::FormInterface * dataset)
emitted after form is closed
reportDone()
emitted after report rendering is done
Using in custom application
In this chapter you will learn how to use CuteReport in your custom application.
Project setting up
There are 2 possible ways to use CuteReport with your custom application: as a
standalone framework or as an embedded framework. Let's look close to the both ways.
Embedded library
There are some important steps to use CuteReport as embedded library in the custom
application:
•
•
•
add all necessary data to your project file (.pro);
add header files of CuteReport to your cpp file;
create and init report core;
Add next lines to your .pro file:
INCLUDEPATH += path_to_CuteReport_headers
DEPENDPATH += $$INCLUDEPATH
LIBS += -Lpath_to_cutereport_shared_files -lCuteReport -lCuteReportWidgets
And add above headers to your code:
#include "reportcore.h"
#include "reportinterface.h"
Standalone framework
To use CuteReport as standalone framework you can simply install CuteReport using installer
provided. There are some advantages using it in this way:
•
if you have some application installed that use CuteReport you should not update it for
every application. Update CuteReport and all application will use new version.
•
you can use official CuteReport repositories and keep CuteReport up to date
automatically for Linux distributions.
To connect CuteReport to you your application add to your pro file something like that:
!include( path_to_cutereport_include_directory/CuteReport.pri ) {
error( Cannot find the CuteReport.pri file! )
}
Path to CuteReport.pri is dependent of your distribution.
There is default path for most installation:
Linux: /usr/include/cutereport/CuteReport.pri
Windows: c:/Program Files/CuteReport/dev/include/CuteReport.pri
Second step is to include header file to your C++ file:
#include <CuteReport>
Simple example
Next is creating CuteReport::ReportCore instance and initing it:
CuteReport::ReportCore * reportCore = new CuteReport::ReportCore();
There are some parameters you can pass to the constructor:
•
•
•
•
parent: sets parent object to the CuteReport instance. If it is set you should not care
about CuteReport instance deletion;
settings: pointer to a QSettings object. You can use your project's settings to allow
CuteReport to save its settings and states to the file using [CuteReport] group. The
settings in this file can provide some initial info to configure CuteReport. Instead of
writing a lot of code to add instances like storage objects, renderer objects, printer
objects to the report, you can use custom settings. We will review these settings later. If
QSettings pointer is not specified CuteReport will create its own ini file.
interactive: used to specify if report objects are static or can be changed. If you develop
some console application that process report templates without changing report objects
you can free some resources by using "false". It is true by default;
initLogSystem: determines if you need or no to see CuteReport's logs. It is True by
default. It should be mentioned that log destinations and log levels can be configured
separately.
Additionally you can connect some signals to detect report exporting and rendering:
connect(reportCore, SIGNAL(exportDone(QString,bool)), this, SLOT(slotExportDone(QString,bool)));
connect(reportCore, SIGNAL(printingDone(QString,bool)), this, SLOT(slotPrintDone(QString,bool)));
Now when we have core created we can load a report template:
CuteReport::ReportInterface * report = reportCore->loadReport("file:/path/myreport.qtrp");
In most cases you might want to see report preview, so lets create preview widget:
CuteReport::ReportPreview * preview = new CuteReport::ReportPreview(reportCore);
preview->connectReport(report);
By passing report pointer to the preview widget you specify what report object preview
should be represented.
Now we can start report rendering. There are some ways to do this. First way is pressing
button "Run" in the preview widget. Second way is to invoke CuteReport Core method
render(report).
reportCore->render(report);
Third way is to invoke Preview method run(). You can choose any way.
preview->run();
Choose any way you like.
Custom application example
Now let's do some coding. To add CuteReport library to your application you can do something
like this:
#include "reportcore.h"
/* create report core instance */
CuteReport::ReportCore * reportCore = new CuteReport::ReportCore(0 ,0, false);
/* create report preview widget */
CuteReport::ReportPreview * preview = new CuteReport::ReportPreview(parentWidget);
/* assign report core to our preview */
preview->setReportCore(reportCore);
/* loading report template from file and creating of report object */
CuteReport::ReportInterface * reportObject = reportCore->loadReport("git:report.qtrp");
/* connect created report object to the preview */
preview->connectReport(reportObject);
/* show preview widget */
preview->show();
/* start report rendering */
preview->run();
Usually you need only one ReportCore instance in your application. Any number of Preview
widget can be assigned to the core.
Datasets
Model Dataset
Model Dataset is designed to print model's data (inherited from QAbstractItemModel)
from an application. For printing data some steps are necessary:
•
Create Model Dataset in your report;
•
In the field "Model name" type in any name for your model. If there are some, they
should be different;
•
For the report testing you can fill test model with the data using any number of columns
and rows;
All set. For printing your report you have to pass your model address (as longlong) to the
report using report parameters.
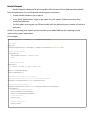
For example:
CuteReport::ReportCore * cuteReport = new CuteReport::ReportCore();
// load report
QString err;
CuteReport::ReportInterface * reportObject = cuteReport->loadReport("file:test.qtrp", &err);
// if error, exit with message
if (!reportObject) {
QMessageBox::critical(this, "loadReport", err);
return;
}
// making of the test model
QStringList list;
list << "11111" << "2222" << "333" << "44" << "5";
model = new QStringListModel();
model->setStringList(list);
// Warning!!! Link to model passed as longlong
// Set model name the same you have set in the ModelDataset before
reportObject->setVariableValue("model1",qlonglong(model));
// making report preview window
CuteReport::ReportPreview * preview = new CuteReport::ReportPreview(cuteReport);
if (reportObject) {
// set core and set preloaded report
preview->setReportCore(cuteReport);
preview->connectReport(reportObject);
// report processing
preview->run();
//Preview window show
preview->show();
}
While rendering the data model will be cloned, since QAbstractItemModel is not thread safe.