1
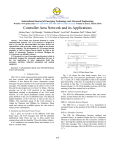
Model-Based Validation of Fuel Cell Hybrid Vehicle
Control Systems
By
Erik Wilhelm
A thesis
presented to the University of Waterloo
in fulfillment of the
thesis requirement for the degree of
Master of Applied Science
in
Chemical Engineering
Waterloo, Ontario, Canada, 2007
© Erik Wilhelm 2007
i
I hereby declare that I am the sole author of this thesis. This is a true copy of the thesis,
including any required final revisions, as accepted by my examiners.
_________________________________________
I understand that my thesis may be made electronically available to the public.
_________________________________________
ii
Abstract
Hydrogen fuel cell technology has emerged as an efficient and clean alternative to
internal combustion engines for powering vehicles, and hydrogen powertrains will aid in
addressing key environmental issues such as urban air quality and global warming. This
work demonstrates the effectiveness of a „hardware-in-loop‟ (HIL) simulation system for
validating the safety and effectiveness of control algorithms for a hydrogen fuel cell
hybrid passenger vehicle.
A significant amount of the work completed in conjunction with the thesis topic was the
design and construction of the fuel cell vehicle for competition. Producing a „rolling test
bench‟ that generates data to be used to create HIL simulation models required nearly two
years of work before an acceptable level of reliability was reached to produce usable
data. Some detail will be given in this thesis regarding the infrastructure modifications
required to safely build a hydrogen fuel cell vehicle, as well as the design challenges
faced in the integration of a fuel cell power module, two electric drive motors, a nickel
metal hydride battery, and required power electronics into a small sport utility vehicle
originally designed for an internal combustion powertrain.
The virtual control validation performed involved designing dynamic models of the
systems of interest and performing real-time simulation to ensure that the appropriate
controller response is observed. For this thesis, emphasis was placed on several key
vehicle control topics. Communication robustness was evaluated to ensure that the
complicated vehicle communication network could effectively handle traffic from the six
powertrain sub-controllers. Safety algorithms were tested for appropriate response to
fault conditions. Control systems were developed and tuned offline reducing the amount
of time required for in-vehicle development and testing. Software-in-the-loop simulation
was used to check initial code integrity and to validate the hardware-in-the-loop vehicle
models. The methodology presented in this work was found to be sufficient for a
thorough safety and rationality evaluation of control strategies for hybrid fuel cell
vehicles.
iii
Acknowledgements
I would like to thank Dr. M.W. Fowler for his kind and generous support, his confidence
in my ability, and for the patience that he showed as my faculty advisor during the
process of writing this thesis. He encouraged my development in innumerable ways and
I will always be grateful.
I would also like to acknowledge the mentoring and assistance that Dr. R.A. Fraser, the
faculty advisor for the Alternative Fuels Team, provided during this work and throughout
the ChallengeX project. His insight and experience is the foundation upon which all of
the UWAFT advanced vehicle developments rested.
The University of Waterloo Alternative Fuels Team is an interesting, dedicated, and
motivated group of people. We had some fun, we learned a great deal, and we got the job
done. Christin Strong was always there for me during the good times and the bad, and
does a great job wiring vehicles. Mike „Wally‟ Wahlstrom and I were co-leaders of this
boat, and it was a privilege to work with someone so talented. Chris Lawrence set an
incredible example for being able to work effectively on two hours of sleep. Matt
Stevens was a great source of inspiration and a co-leader of the UWAFT T-bone subteam. Sumit Kundu brought perspective to this work and, as the „godfather‟ of the green
energy group, had to deal with UWAFT absconding with his lab equipment. Ryan
Huizing made it ok to stay late because he was always there from sunset until sunrise
anyway. Jeff Gostick (with Sumit‟s help) made a great thing happen on the hydrogen
system, and installed the best-looking exhaust tip at competition on our vehicle. Charles
Hua, the new co-leader of the team, picked up a lot of responsibility and bore it with
grace. Filip Spacek made the Bluetooth/CAN device code work, and made sure I made it
to the Duke. And for that I am infinitely grateful.
The National Science and Engineering Research Council of Canada supported this work
financially through the PGS-M scholarship program. I am very grateful for the funding
that enabled me to perform this work and to help design and build a fuel cell Equinox.
iv
Dedication
This work is dedicated to my parents, Diane and Jim, and to my brother Roland. My
family prepared me for these years of work and gave me the ability to persevere through
difficult moments.
v
Table of Contents
Chapter 1: Introduction ............................................................................................ 1
1.1 Problem Statement.................................................................................................. 1
1.2 Objectives................................................................................................................. 1
1.3 Problem Background .............................................................................................. 2
1.4 Hybrid Vehicle Powertrains................................................................................... 9
1.3.1 Parallel Hybrids ............................................................................................... 10
1.3.2 Series Hybrids .................................................................................................. 10
1.3.3 Series Parallel Hybrids ..................................................................................... 11
1.4 Transportation Fuel Cell Technology ................................................................. 12
1.5 Hardware-in-the-loop Control Validation .......................................................... 18
Chapter 2: Fuel Cell Hybrid Chevrolet Equinox ........................................... 24
2.1 ChallengeX............................................................................................................. 24
2.2 Vehicle Architecture Description ........................................................................ 26
2.2.1 Vehicle Electrical Systems .............................................................................. 28
2.2.2 Vehicle Control Architecture ........................................................................... 29
2.2.3 Vehicle Hydrogen Storage System .................................................................. 31
2.2.4 Fuel Cell Power Module .................................................................................. 33
2.2.5 Thermal systems .............................................................................................. 35
2.3 Infrastructure Modification ................................................................................. 36
Chapter 3: HIL modeling methodology ............................................................. 37
3.1 Vehicle Communication Validation .................................................................... 39
3.1.1 Communication Lag Testing............................................................................ 39
3.1.2 Communication Bus Loading .......................................................................... 43
3.2 Controller Safety Response Validation ............................................................... 44
3.2.1 Fault Message Handling .................................................................................. 44
3.2.2 Signal Failure Insertion .................................................................................... 47
3.2.3 Voltage Droop Sensitivity................................................................................ 49
3.3 Vehicle Dynamic Control System Validation ..................................................... 50
vi
3.4 12V system validation ........................................................................................... 54
3.5 Offline Development ............................................................................................. 57
Chapter 4: Validation Results and Discussion ............................................... 62
4.1 Vehicle Communication Validation .................................................................... 63
4.1.1 Signal bus lag ................................................................................................... 63
4.1.2 CAN bus loading.............................................................................................. 67
4.2 Controller Safety Response Validation ............................................................... 70
4.2.1 Fault Message Handling .................................................................................. 70
4.2.2 12V Bus Droop/Spike Testing ......................................................................... 72
4.2.3 Failure Insertion Validation ............................................................................. 73
4.3 Vehicle Dynamic Control System Validation ..................................................... 82
4.4 12V NiMH charge system validation................................................................... 86
4.5 Offline Development ............................................................................................. 89
4.5.1 Bluetooth Controller Area Network Development .......................................... 89
4.5.2 Graphical User Interface Development ........................................................... 92
Chapter 5: Conclusions and Recommendations ............................................. 94
Chapter 6: References .............................................................................................. 98
Appendices ................................................................................................................. 103
Appendix A: Hardware Data Sheets .......................................................................... 103
Appendix B: HIL Simulator wiring and Controller CAN ......................................... 105
Appendix C: Simulation Interface Toolkit Code ....................................................... 111
Appendix D: Real Time Workshop Code .................................................................. 113
Appendix E: Java code for Blackberry Interface....................................................... 115
Appendix F: Expanded Pictures ................................................................................ 121
Appendix G: Scientific contributions ........................................................................ 124
vii
List of Tables
Table 1: High power fuel cell power module components .............................................. 17
Table 2: The state of the art of fuel cell vehicle technology ............................................ 18
Table 3: Utility of HIL simulation in the automotive industry ........................................ 20
Table 4: Hardware-in-the-loop automotive application (individually referenced) .......... 23
Table 5: University of Waterloo Fuel Cell Equinox: Technical Specifications 35 ........... 25
Table 6: University of Waterloo fuel cell hybrid vehicle powertrain components 35 ...... 27
Table 7: Vehicle controller technology............................................................................ 30
Table 8: Safety standards applicable to vehicular hydrogen storage ............................... 32
Table 9: Fuel cell power module performance characteristics ........................................ 34
Table 10: Fuel cell Equinox thermal system operating characteristics ............................ 35
Table 11: Hardware-in-the-loop simulation system input/output requirement summary 41
Table 12: Messages from vehicle CAN bus sent by PXI for bus loading simulation...... 43
Table 13: Fuel cell fault management truth table ............................................................ 45
Table 14: Three safety-critical control signals selected for fault insertion ...................... 48
Table 15: Dynamic simulation model assumptions ......................................................... 53
Table 16: Traction control and regenerative braking inputs and outputs ........................ 54
Table 17: Battery control system input and output .......................................................... 56
Table 18: Critical CAN messages for broadcasting via Bluetooth to wireless device .... 58
Table 19: Results from bus loading tests ......................................................................... 69
Table 20: Simulated fault messages ................................................................................. 71
Table 21: Controller status during voltage spike/droop trial ........................................... 73
Table 22: „IGBT ok?‟ monitoring line failure insertion results ....................................... 74
Table 23: Gear selection failure insertion control response ............................................. 76
Table 24: Throttle pedal position sensor failure insertion trails ...................................... 78
Table 25: Torque control strategy troubleshooting process ............................................. 84
Table 26: Expected versus actual current signals ............................................................ 87
Table 27: Predictable characters from the Mototron received by the GUI ...................... 93
viii
List of Figures
Figure 1: Hydrogen storage technology state-of-the-art and targets ................................. 3
Figure 2: Panel 1: Current energy cycle
Panel 2: Hydrogen energy cycle .................... 5
Figure 3: Distribution of transportation fuel resources. Fossil12 (a) and solar13 (b) .......... 6
Figure 4: Lifecycle analysis of promising hydrogen production methods 14..................... 7
Figure 5: Projected 21st century transportation energy system 15 ...................................... 8
Figure 6: US hybrid sales in 2004-2007 16 ........................................................................ 9
Figure 7: Parallel hybrid vehicle configuration 44 ........................................................... 10
Figure 8: Series hybrid vehicle configuration 44 .............................................................. 11
Figure 9: Series-parallel hybrid vehicle configuration 44................................................. 11
Figure 10: Single polymer electrolyte fuel cell ............................................................... 13
Figure 11: Polymer electrolyte membrane structure: sulphonated flouroethylene .......... 14
Figure 12: Polarization curve showing the operating characteristics of a fuel cell ......... 15
Figure 13: Fuel cell stack comprised of 18 cells in series ............................................... 16
Figure 14: Examples of uni- and bidirectional simulation 26 ........................................... 19
Figure 15: Hardware-in-the-loop system considerations ................................................. 21
Figure 16: 17 ChallengeX teams at GM‟s Milford Proving Grounds 33 .......................... 24
Figure 17: Powertrain packaging for the fuel cell Chevrolet Equinox ............................ 28
Figure 18: Major wiring conduits on the fuel cell Equinox ............................................. 29
Figure 19: Fuel cell Equinox control architecture ........................................................... 31
Figure 20: Finite Element Analysis on hydrogen tank mounting structure ..................... 32
Figure 21: Hydrogen tank location on the Chevrolet Equinox vehicle ........................... 33
Figure 22: 65kW HyPM fuel cell power module ............................................................ 33
Figure 23: Computational fluid dynamics on the fuel cell air delivery system 50 ........... 34
Figure 24: Fuel cell heat rejection system packaging solid model .................................. 35
Figure 25: A Hardware-in-the-loop simulation system for a fuel cell Chevy Equinox ... 37
Figure 26: HIL system circuits. Low-side relay driver (a) Failure insertion (b) ............. 38
Figure 27: Communication lag test data flow: Begins red, ends green ........................... 41
Figure 28: Timing pulse algorithm. Inset: Rising jitter triggered subsystem .................. 42
Figure 29: Bus loader model (a) and associated CAN transmission VI for the PXI (b) . 44
Figure 30: Fuel cell power module fault insertion model ................................................ 46
ix
Figure 31: Simulation interface toolkit fault handling algorithm .................................... 46
Figure 32: Failure insertion code. IGBT ok (a). Throttle position (b). PRNDL (c) ........ 48
Figure 33: Failure insertion plant model. Simulink model (a) Labview control (b) ....... 49
Figure 34: Dynamic vehicle model (a) Powertrain model (b) ......................................... 51
Figure 35: Efficiency table for the Ballard 312V67 MG AC induction motors .............. 52
Figure 36: Battery control stateflow (a). Vicor safety stateflow (b) ................................ 55
Figure 37: 12V NiMH battery Simulink model ............................................................... 56
Figure 38: Top level 12V battery HIL model .................................................................. 57
Figure 39: Bluetooth to CAN development on the HIL system. Simple HIL model (a)
Battery CAN message definition (b) Data transmission pathway (c) ............................... 59
Figure 40: Graphical user interface being developed on the HIL system ....................... 60
Figure 41: GUI vehicle controller interface code ............................................................ 61
Figure 42: Lag resulting from signal bus test with PXI simulator sleep ......................... 64
Figure 43: Varied frequency bus lag trial with PXI sleep time removed ........................ 65
Figure 44: Close-up view of signal bus lag trial with PXI sleep removed ...................... 66
Figure 45: Cycle lag recorded over time for PXI sleep removed data lag....................... 67
Figure 46: Kvaser bus monitor showing CAN bus load with competition code ............. 68
Figure 47: Bus load as a function of 13 message transmission loop rate ........................ 70
Figure 48: Mototune screenshots demonstrating appropriate controller response .......... 71
Figure 49: Control output voltage relative to input voltage............................................. 72
Figure 50: Undesired controller response to „IGBT ok?‟ failure. No inserted line failure
(a). Inserted short high (b). Inserted short to ground (c) ................................................... 74
Figure 51: Terminated safety logic in competition controller code................................. 75
Figure 52: Implemented torque pass-through arbitration (a). Recommended torque passthrough arbitration (b) ....................................................................................................... 77
Figure 53: Averaged instead of zeroed throttle position value when sensors disagree ... 79
Figure 54: Torque request enabled subsystem parameter: change „held‟ to „reset‟ ........ 80
Figure 55: TPS safety variable partial implementation (a). Proposed location for TPS
safety variable (b) ............................................................................................................. 81
Figure 56: Validation of model predicted bus voltages vs vehicle acceleration data ...... 83
Figure 57: Intended torque control algorithm .................................................................. 84
x
Figure 58: Regenerative braking control strategy not functioning as intended ............... 85
Figure 59: Regenerative braking control strategy functioning as intended ..................... 85
Figure 60: Empirical NiMH battery system model fit ..................................................... 86
Figure 61: Faulty integration method resulting in unstable control response.................. 88
Figure 62: Expected charge circuit function. Charging the battery is interrupted
periodically for 1 minute intervals to measure the battery state of charge ....................... 89
Figure 63: Recorded Bluetooth™ raw data with expected CAN message circled .......... 90
Figure 64: Bluetooth CAN message receiver on the Blackberry™ device ..................... 91
Figure 65: TPC-2006 touch screen with custom UWAFT interface 41............................ 93
xi
Nomenclature and Abbreviations
UWAFT: University of Waterloo Alternative Fuels Team
HIL: Hardware-in-the-loop
SIL: Software-in-the-loop
PEM: Polymer electrolyte membrane
kW: Kilowatt
A: Ampere
V: Volt. Also depicted as E.
kph: kilometers per hour
CAD: Canadian dollars
°C: degree Celcius
Psi: pounds per square inch
NiMH: nickel metal hydride
SMR: steam methane reforming
FCPM: fuel cell power module
MEA: membrane electrolyte assembly
Ω: ohm
ECU: Engine control unit
CAN: controller area network
ms: millisecond
I/O: input / output
ABS: anti-lock braking
GM: General Motors
PSAT: Powertrain systems analysis toolkit
Nm: Newton-meter
Ah: Amp-hour
DC: direct current
AC: alternating current
BCM: body control module
slpm: standard liter per minute
xii
SIT: simulation interface toolkit
RPM: revolutions per minute
PWM: pulse width modulation
TCS: torque control strategy
HCS: hybrid control strategy
TPS: throttle position sensor
MCU: motor control unit
RMS: root mean squared
SOC: state of charge
DFMEA: design failure modes and effects analysis
GUI: graphical user interface
xiii
Chapter 1: Introduction
1.1 Problem Statement
The environmental and economic motivation to reduce greenhouse gas emission and
energy use in transportation has resulted in the introduction of fuel cells as an alternative
to internal combustion propulsion, and thereby caused an increase in vehicle powertrain
complexity.
To ensure that the control hardware and algorithms for a complex fuel cell hybrid vehicle
respond safely and as-intended, extensive off-line testing must be performed before the
control systems are implemented on the road.
1.2 Objectives
This work outlines the development of “hardware-in-the-loop” (HIL) and “software-inthe-loop” (SIL) controls validation methodologies for an advanced fuel cell / battery
hybrid vehicle powertrain. The work was performed in parallel with the design and
construction of a fuel cell hybrid Chevrolet Equinox which was the target of the control
system simulation.
A challenge specific to the Waterloo vehicle development team was based on an inherent
limitation of current fuel cell powered vehicles. The fuel cell technology used for the
Equinox cannot be operated in temperatures below 10°C, which resulted in a significantly
reduced development and testing window relative to teams located in more temperate
regions of North America. By basing a significant portion of the vehicle control
development on software-in-the-loop and hardware-in-the-loop techniques outlined in
this thesis, the development and refinement of control algorithms was able to take place
year round. Additionally, this thesis demonstrates how SIL and HIL techniques can be
applied to offer significant time reduction in development by allowing for the rapid
establishment and execution of tests. Finally, with an expensive powertrain technology
1
such as a fuel cell power module, it is prudent to ensure that the controller will be able to
safely operate the vehicle before the algorithms are loaded and the key is turned. The
intent of this work is to advance the field of real time vehicle simulation and hardware-inthe-loop controller validation as a design engineering tool.
1.3 Problem Background
Transportation technology has captured the global imagination and has been the subject
of intense research and development for the past century and a half. Throughout the
history of powered transportation, society has sought out higher performance, increased
comfort, and additional functions for their passenger vehicles.
It is a critical point in
civilization‟s history where consideration must now not only be made for vehicle
performance, but must now also for how traveling impacts the environment. The threat
that our near-exclusive use of fossil fuels for transportation energy poses to the
environment is considerable. The fact that the combustion of fossil fuels has caused a
significant increase in atmospheric greenhouse gas concentration and that this increase
due to human activity has had a warming effect on our climate is widely accepted in the
scientific community 1. The detrimental effects that global warming will have on the
global ecosystem and economy have been extensively modeled and are predicted to be
severe, including increased tropical storms, droughts, and floods 2. Poor air quality in
urban areas caused by vehicle emissions has a significant negative impact on human
health 3. In addition to the negative effects that fossil fuel use in transportation has on the
environment, the dependence on energy from foreign sources has destabilized political
relations between nations leading to wars and famine. The 20th century‟s adoption of oil
as a transportation energy source was due in most part to its ease of extraction and use.
The short-term simplicity of burning oil to provide power for transportation has,
however, created the above-mentioned long-term problems which must be addressed 3.
While there are at least three viable alternative fuels competing to replace petroleum for
transportation energy, hydrogen shows the most promise. It also presents the greatest
challenges as a new energy carrier, when compared with liquid alternative fuels such as
2
ethanol or biodiesel. There are many uncertainties surrounding hydrogen as a fuel, such
the current lack of adequate production and distribution infrastructure, the difficulty of
safe storage in vehicles at suitable energy densities, and the high cost per kilowatt of fuel
cell power systems. The large initial capital outlay to finance the construction of a vehicle
fueling infrastructure is one of the major impediments to the adoption of hydrogen as a
fuel. Without stations which offer hydrogen fuel, consumers are reluctant to purchase fuel
cell vehicles. Without a consumer market for hydrogen-powered vehicles, energy
companies are reluctant to build stations. On-board storage density has been improving
for hydrogen, but it is still far from where it needs to be to offer drivers the range that
they can enjoy from liquid fuels. Figure 1 highlights the current state of hydrogen storage
and the improvements needed in order for it to become competitive without requiring
consumers to change their driving habits 5.
Figure 1: Hydrogen storage technology state-of-the-art and targets
The cost of fuel cell vehicle technology is also a barrier to its widespread adoption.
Current prototype and one-off fuel cell engine technology costs a prohibitive $8,000$10,000 CAD/kW in 2005 dollars, which does not compare favorably with internal
3
combustion engine technology that costs around $50 USD/kW 6. Carlson et al present a
convincing estimate of the mass production reduction in price per kilowatt for fuel cell
technology, suggesting that it should reach $108 USD/kW 7 in 2005 dollars. The
technological advancements required to further reduce this price are the reduction in the
use of rare earth metal catalysts to promote the fuel cell reaction and improvements in
stack plate manufacturability.
The production and distribution cost of hydrogen as a transportation fuel is also currently
higher than that of petroleum fuels. Granovskii et al determined in a comparison of
hydrogen production methods with gasoline that, as the impact of the fuel air pollution
and greenhouse gas emissions decreases, so does the economic efficiency for the
production process 8. This disparity must be corrected by factoring the environmental
remediation cost of fossil fuel consumption into its production and distribution cost to
ensure that future generations do not bear the burden of these costs. It is also important
to consider the impending fossil fuel shortages as „easy oil‟ is depleted and energy
companies experience more difficulties in extracting reserves such as oil sands and deepocean wells, which carry an inherently higher risk and environmental impact.
The public image of hydrogen has suffered as a result of several high profile accidents
such as the Hindenburg disaster of 1937. Despite the damaging publicity of the
Hindenburg legacy, the reality remains that hydrogen as a fuel can be stored and handled
as safely as gasoline or any other transportation fuel 9. It merely has a different set of
safe handling requirements than that of conventional liquid fuels. For example, it is
important to have adequate detection systems in place to monitor for leaks because
hydrogen is odourless and colourless. On the other hand, if a minor leak occurs,
hydrogen is less likely than gasoline to pose a flammability risk in an enclosed space
such as a garage due to hydrogen‟s diffusivity and buoyancy properties 10.
While the technical challenges surrounding hydrogen fuel such as its storage, production,
and distribution are significant, the potential that it has to improve the human condition
justifies the efforts required to overcome them and to move towards a hydrogen
4
economy. In particular, the use of renewable energy sources such as wind, solar, and
hydro to generate hydrogen represents an attractive closed-loop energy path that does not
release greenhouse gasses such as carbon dioxide, and that therefore mitigates the human
impact on global warming 2. Figure 2 shows a typical carbon cycle before and after the
implementation of a renewable hydrogen transportation fuel system.
Fossil Fuel
Exploration
CO2
Natural
text
Gas
Thermochemical
text
Process
Solar
radiation
H2O
CO2
CO2
text
Hydro
Compression
H2
`
text
Petroleum
text
Wind
text
Coal
Phototext
voltaic
Traction
text
/
Motor
Refining
text
text
Electrolysis
H2
Fuel cell
text
Power Module
`
CO2
Fischer-Tropsch
Synthesis
te
xt
Internal combustion
Engine
Internal
text
combustion
Engine
Motive Force
Figure 2: Panel 1: Current energy cycle
H2O
Motive Force
Panel 2: Hydrogen energy cycle
The human health effects of vehicle emissions are well-documented. A study by the
Ontario government in 2005 found that vehicle emissions were responsible for
approximately 5000 deaths in that year 3. In addition to reducing or eliminating well-towheels greenhouse gas emissions, hydrogen fuel also eliminates almost every criteria of
vehicle tailpipe emission with the exception of nitrous oxides. By producing hydrogen
from fossil fuels in central rural plants and transporting it into urban areas, it is possible
to reduce the volatile organic, particulate, and ground level ozone pollutants that are
created by all internal combustion vehicles and thereby create a healthier environment in
our cities.
A significant portion of the world‟s petroleum reserves are located in countries where
political instabilities often disrupt production and distribution. Geopolitical instability
could be mitigated by the adoption of a fuel with production diversity such as hydrogen,
as an energy pathway selection can be made from the myriad of sources available.
Countries with large supplies of bio-wastes such as sugar cane stalk in the case of Brazil
5
or pulp and paper waste in the case of the United States can convert their waste stock into
valuable fuel 11. Countries with significant hydroelectric and nuclear generating capacity
that is typically underutilized during off-peak hours can use their plants more effectively
to generate hydrogen. Equatorial countries are well-positioned to use solar energy to
produce hydrogen for export to their neighbors. Figure 3 shows the current distribution
of transportation fuel resources as well as how global solar resources are distributed. It is
clear that if solar energy were used to produce hydrogen, the global energy supply would
be much more evenly distributed.
a.
b.
Figure 3: Distribution of transportation fuel resources. Fossil12 (a) and solar13 (b)
6
The life cycle assessments of different well-to-wheel hydrogen fuel production pathways
can aid in gaining a perspective on the relative merits of each and how they compare to
our present day transportation energy system. An extensive life cycle analysis has been
performed on the efficiency and loss associated with all available feed stocks for
hydrogen production by Granovski, et al. Selected production pathways are shown in
Figure 4.
Figure 4: Lifecycle analysis of promising hydrogen production methods 14
In the life cycle analysis on greenhouse gas emissions during hydrogen production, most
often wind and solar production methods compare favorably with fossil fuel production
methods such as the steam methane reforming (SMR) of natural gas, the most common
method of production at present 14. Renewable methods of production are one of the key
ways that hydrogen technology can reduce the environmental cost of transportation
energy utilization.
7
At the end of the 19th century and the beginning of the 20th century, there was no
dominant transportation fuel; gasoline, electric, and steam-powered vehicles were all
competing for the market. Society finds itself in a similar situation at the end of the 20th
century and the beginning of the 21st century. A representation of the last two hundred
years and a reasonable projection of the transportation energy system that can be
expected in the coming decades 15 are outlined in Figure 5.
Figure 5: Projected 21st century transportation energy system 15
A primary challenge for the transition from the incumbent transportation technology is a
near-term perspective that places limited value in avoiding environmental and economic
impact. In the next decade, hydrogen produced from fossil fuels for transportation use
will improve our urban air quality and reduce our dependency on foreign oil. In the
coming quarter century, hydrogen produced in a sustainable fashion will reduce
anthropogenic carbon dioxide emission significantly and help to mitigate global
warming. The challenges and opportunities that lie ahead are easy to compare to the ones
that faced the fathers of the automotive industry at the turn of the 19th century. Efforts
should be made to ensure that, as the future of mobility for succeeding generations is
reinvented, the lessons of the past are considered and not forgotten.
8
1.4 Hybrid Vehicle Powertrains
Hybrid electric vehicles use in-vehicle energy storage devices such as batteries or
ultracapacitors with electric motors in addition to their primary drive engines in order to
recapture braking energy and to drive the wheels using the most efficient energy
pathway. Most vehicle manufacturers have made significant progress in the past five
years in developing hybrid vehicles to add to their product lines, with consumer demand
for hybrid technology increasing significantly in the past years. Figure 6 shows the sale
of hybrid vehicles in the US from 2004 until 2007 16. The correlation between consumer
preference for vehicles that save fuel and the price of fuel at any given time is clear.
Figure 6: US hybrid sales in 2004-2007 16
9
1.3.1 Parallel Hybrids
In the parallel hybrid architecture, the motor and the engine are both able to deliver
power to the wheels. This allows the motor to assist the engine on hard acceleration, as
well as to take over completely during low speed driving. During braking, the motor
becomes a generator that recharges the battery with the mechanical energy required for
stopping. The disadvantage of the architecture shown in Figure 7 is that the internal
combustion engine cannot be constantly operated in its most efficient operating range
because it is mechanically linked to the wheels.
Figure 7: Parallel hybrid vehicle configuration 44
1.3.2 Series Hybrids
Series hybrid vehicles seek to operate an optimally sized internal combustion engine at
the engine‟s most efficient operating range. Then engine generates electricity which is
then either used at the wheels, or to charge the battery, depending on the driver request.
The wheels are driven by the electric motor alone and regenerative braking is still
possible, as shown in Figure 8. The disadvantages of this architecture is that the power
must flow through all of the powertrain components, so they must all be sized large
enough to handle the vehicle‟s torque requirements and the efficiency losses in energy
conversion are significant.
10
Figure 8: Series hybrid vehicle configuration 44
1.3.3 Series Parallel Hybrids
The series parallel configuration shown in Figure 9 takes allows the greatest flexibility in
power delivery, and can therefore select the most efficient operating point while
maintaining the ability to provide sufficient power to the wheels during heavy
acceleration. The major drawbacks of this architecture are its weight, cost, and
complexity. The Toyota Prius employs a series-parallel powertrain configuration, and
has established itself as the flagship for hybrid vehicles 17.
Figure 9: Series-parallel hybrid vehicle configuration 44
11
1.4 Transportation Fuel Cell Technology
One key enabling technology for the transition to a hydrogen energy economy is the fuel
cell engine. Fuel cell power modules (FCPM‟s) are able to transform chemical fuel
energy into electrical energy with 50-60% practical efficiencies. Fuel cells have been
researched for over 150 years 18, since the first demonstration of the principle by Sir
William Grove in 1839. In the last 20 years, significant progress has been made towards
developing transportation fuel cell applications, particularly with the development of
stable ion conducting membrane polymers. The first successful vehicular fuel cell
integration was performed on a tractor for Allis-Chalmers that used potassium hydroxide
as an electrolyte in 1959 19. Since that early effort, the fuel cell technology that has been
broadly accepted as the most promising for transportation application is the polymer
electrolyte membrane (PEM) fuel cell. In addition to requiring robust and durable fuel
cell stacks, the balance of plant that every fuel cell engine requires to meter and condition
the reactant feed streams has required significant development, particularly to ensure
reliable cold starting and operation. Today, all major vehicle manufacturers are involved
to some degree in fuel cell research and development. General Motors is a leader in the
drive towards transportation fuel cells and plans to have commercial products by 2010 20.
Fuel cells share many of the physical and electrochemical characteristics of batteries. The
primary difference is that fuel cells receive a constant reactant feed, whereas batteries
must be charged to return their reactants to the electrodes. A single polymer electrolyte
fuel cell is pictured in Figure 10 with its salient physical features labeled 18. Polymer
electrolyte fuel cells are low temperature fuel cells and do not require caustic or acidic
liquid electrolytes and are therefore well-suited for transportation applications. In
addition, they operate at low temperatures of around 65°C and are therefore inherently
safer than higher temperature fuel cells.
12
Figure 10: Single polymer electrolyte fuel cell
The bipolar plate in Figure 10 acts as a current carrier and provides physical structural
rigidity to the cell. It also plays a key role in reactant gas delivery and product water
removal. Modern fuel cell bipolar plate design reduces or eliminates reactant gas
humidification requirements by wicking water to dry areas of the membrane and
removing water from saturated areas of the gas diffusion layer 21. Bipolar plates were
originally produced from machined graphite, but are now most often either stamped and
anodized metal or molded conductive polymer. The gas diffusion layer distributes gases
to the reaction sites on the catalyst layer and wicks water from the membrane to the flow
channels in the bipolar plate. It is composed of carbon cloth with water permeability and
physical characteristics that maximize performance 22. The polymer electrolyte
membrane and catalyst layer are manufactured as a single unit, known as a membrane
electrolyte assembly (MEA). The MEA facilitates the fuel cell reaction in Figure 10. It
allows protons to travel from the anode to the cathode during the reaction, but is an
electronic insulator forcing the electrons produced to travel through an external circuit
and do work. The reaction on both the anode and cathode is catalyzed primarily by
platinum, but this area is the focus of research to develop new catalysts and doping
compounds to reduce cost and increase functionality such as catalyst regeneration 23.
The sulfate group shown in the simplified chemical representation of a PEM shown in
13
Figure 11 is required in order to facilitate proton transfer by creating an acidic membrane
condition in the presence of water 18. The structure of the polymer electrolyte membrane
is the reason that proper water management and hydration is critical to efficient fuel cell
operation.
Figure 11: Polymer electrolyte membrane structure: sulphonated flouroethylene
PEM fuel cells obey the same electrochemical laws that batteries do. Their performance
characteristics differ significantly, however, because of their unique solid electrolyte.
The discharge characteristics of a fuel cell are shown in Figure 12.
14
1
ENernst
act
0.9
ohmic
0.8
concentration
Voltage (V/cell)
0.7
0.6
0.5
0.4
0.3
0.2
0.1
0
0.00
0.20
0.40
Current
0.60
0.80
(A/cm2)
Figure 12: Polarization curve showing the operating characteristics of a fuel cell
The loss regions highlighted in the sample discharge (polarization) curve of the fuel cell
shown in Figure 12 are the activation losses (
concentration losses (
) , the ohmic losses (
), and the
). Activation loss is the highly non-linear voltage
drop that is representative of the energy used to drive the chemical reaction that transfers
electrons to or from the electrodes at the catalyst surface, and is characteristic of the fuel
cell reaction kinetics. It is directly related to the effective catalytic surface area. Ohmic
loss is the linear voltage drop that is caused by resistance in the electrical connections of
the system as well as the resistance to proton transport through the electrolyte.
Concentration overpotential is the loss caused by the slow mass transport of reactants
from the bulk fluid to the reaction sites and is non-linear according to mass transfer
relationships. The Nearnst law defines the thermodynamic voltage limitation (or E) of
the system by Equation 1. This equation relates the concentration of reactant gasses to
reversible fuel cell potential, giving the maximum possible voltage at a given temperature
and pressure18.
15
1.00
2
RT a H 2 a O2
o
EE
ln
2 F a H 2O
1
1
To achieve useful operation voltages for use in vehicle or power applications, single fuel
cells must be combined into stacks of multiple cells such as the stack shown in Figure 13.
The stack shown in this figure has 18 cells, and is considered a low voltage stack at ~16V
with no load. Typical vehicle fuel cells have between 200 and 400 cells (180V – 360V),
and have an active area of 300 to 600 cm2.
© Erik Wilhelm 2007
Figure 13: Fuel cell stack comprised of 18 cells in series
The fuel cell stack must then be supplied with reactants at the proper temperature,
pressure, and levels of humidity. In order to do so, a balance of plant must be established
around the stack and is commonly called a fuel cell power module (FCPM). The fuel cell
power module also controls the system to ensure that it operates in the most efficient
16
manner at a given load, monitors system performance and safety, and interfaces with the
vehicle controller. Table 1 outlines the common elements of a fuel cell balance of plant.
Table 1: High power fuel cell power module components
Component
Function
Power Draw
Fuel cell stack
Perform the electrochemical fuel cell reaction
N/A
Air compressor
Deliver oxidant in required quantities to the stack
2 ~ 3 kW
Hydrogen recirculation pump
Ensure even humidification and reactant delivery
50 ~100 W
Water pump
Circulate cooling fluid through stack to remove heat
500 ~600 W
Heat exchanger
Dissipate waste heat produced in the reaction
N/A
Controller
Meter reactant flow and ensure safe operation
1~5 W
Anode humidification
Ensure anode reactant stream is adequately humidified
Cathode humidification
Ensure cathode reactant stream is adequately humidified
30 ~ 90 W
Purge and vent valves
Regulate hydrogen exhaust and prevent overpressure
20 ~ 40 W
N/A
Integrating fuel cell power module technology into current vehicle architectures presents
challenges as well as opportunities. The volumetric power density of fuel cell engines,
currently 1.5 kW/L 24, does not compare favorably to the power density of internal
combustion engines which are typically around 50 kW/L. Similarly, the gravimetric
energy density of fuel cell power modules, typically 0.07 kW/kg, is still less than the
gravimetric energy density of internal combustion engines, which is around 0.5 kW/kg.
When the fuel storage system is considered, petroleum and diesel-fuelled vehicles require
even less volume and weight than their fuel cell counterparts. On the other hand, fuel
cells and their hydrogen storage technologies have a greater degree of flexibility in their
packaging location. The transmission of power in fuel cell vehicles is electromechanical,
so the fuel cell engine can be effectively packaged in a low-profile manner in-line with
the chassis of the vehicle. This lowers the vehicle‟s center of mass and improves
handling. The hydrogen storage may also be packaged in many configurations on the
vehicle and piped to the required fuel cell inlet ports. For example, the Michelin fuel cell
vehicle uses the hydrogen storage as its structural members which allows for a very rigid
body structure and thus improved handling 25. The state of the art fuel cell hybrid
vehicles that have been developed by the automotive industry are outlined in Table 2.
17
Table 2: The state of the art of fuel cell vehicle technology
Manufacturer
Vehicle
Hybrid Features
DaimlerChrysler
Modified Mercedes-Benz A-Class "F-Cell"
65kW drive motor, 350 bar storage, 150 km range
Ford Motor
Modified Ford Focus "FCV"
85 kW fuel cell, NiMH battery, 300 km range
General Motors
Modified Chevrolet Equinox "Equinox Fuel Cell"
93 kW fuel cell, 35kW NiMH battery, 320 km range
Honda
Custom Honda "FCX"
80 kW drive motors, ultracapacitors, 430 km range
Hyundai
Modified Hyundai Tucson "FCEV"
80 kW drive motors, NiMH battery, 300 km range
Nissan
Modified Nissan X-TRAIL "FCV"
85 kW drive motors, Lion battery, 350 km range
Toyota
Modified Toyota Highlander "FCV"
82 kW drive motors, NiMH battery, 330 km range
Fuel cell hybrid technology is at an advanced stage of development, and the barriers to
commercialization are primarily related to cost reduction, fueling infrastructure, and
hydrogen storage (range). Although several technical and political challenges remain
unsolved, the economic and environmental benefits of introducing fuel cell vehicles as an
alternative to internal combustion technology are understood to outweigh the costs. It is
widely acknowledged in the automotive industry that hydrogen will be a viable
transportation fuel in the coming decades 17.
1.5 Hardware-in-the-loop Control Validation
Hardware-in-the-loop simulation (HIL) is an increasingly valuable tool for rapid
prototyping, system modeling, and validation. This simulation methodology was first
implemented in aviation and guided missile control tuning and validation where physical
control testing is at best difficult and, at worst, dangerous or impossible. HIL has since
found widespread use in vehicle control design, where emphasis on safe and economical
testing has made HIL an industry standard. The definition of HIL, which was originally
the validation of an engine control unit (ECU) in a virtual vehicle simulation
environment, has been expanded to include hardware from almost all vehicle subsystems.
Often when designing a model, feedback from either the physical subsystem or the virtual
subsystem can be neglected with little effect on fidelity. Figure 14 illustrates examples of
this assumption. The effect that a wind turbine will have on a hurricane‟s wind speed can
be neglected in simulation, as can the effect of a chassis on a road profile in a
unidirectional simulation methodology. This allows the simulation to be run offline, with
18
data from the driver system (hurricane, road profile) used in the driven (wind turbine,
vehicle) system.
Hardware-in-the-loop simulation, however, captures a control and
feedback loop allowing bidirectional interaction between the virtual and physical
components to be observed and tested 26.
A
Physical
Hurricane
Neglected
Interaction
Virtual
Wind Turbine
Model
B
Measured
wind speed
Physical
Chassis
Prototype
Road
Profile
Virtual
Road
Model
C
Vehicle
Metrics
Neglected
Interaction
Physical
Controller
Prototype
Virtual
Vehicle
Model
Control
Signals
Figure 14: Examples of uni- and bidirectional simulation 26
The definition of hardware-in-the-loop simulation that will be used in this thesis is “the
use of comprehensive virtual vehicle and road profiles in real-time simulation
environments to validate and tune multiple engine control units” and is shown in panel C
of Figure 14.
The advantages that HIL simulation offers to the automotive industry are outlined in
Table 3 26. The ability to test vehicle subsystems in a safe and repeatable fashion, as well
as the time and cost savings associated with HIL testing should be highlighted as major
benefits of performing the validation in a vehicle design cycle.
19
Table 3: Utility of HIL simulation in the automotive industry
Advantage
Description
Example
Cost Effectiveness
Less hardware required
Simulation of subsystems before hardware selection
Rapid Prototyping
Reduced setup time
Engine control performed without dynamometer test
Fidelity/Verisimilitude
Can resolve focus on individual subsystems
Isolating pump dynamics is easier to simulate
Simulation Speed
Complex physical phenomena runs faster
Empirical nature of models allows shorter testing time
Repeatability
Boundary conditions controllable
Suspension systems can be loaded in simulation
Virtual environment
HIL allows simulation of destructive events
Airbag deployment can be tested
Comprehensiveness
Broad range of physical conditions simulated
Temperature variation from a mountain ascent testing
Safety
Vehicle safety systems can be validated
Ensuring appropriate torque requests for throttle signals
Parallelism
Subsystems can be developed in parallel
Hybrid control strategy tuned parallel to development
The burgeoning hybrid vehicle market has prompted vehicle manufacturers to accelerate
the development of hybrid vehicles, necessitating the rapid prototyping capability offered
by HIL simulation. Hybrid vehicle powertrain complexity also requires more complicated
control hardware and algorithms, which presents an opportunity to use HIL simulation to
test fail-safe functionality and rationality in the increasingly complex hybrid control
systems.
There are several important considerations when establishing hardware-in-the-loop
simulation systems above and beyond what is required for unidirectional modeled
systems. In addition to model accuracy and fidelity, determinism and interconnectivity
between hardware and software components must be designed for in HIL test apparatus.
20
Figure 15: Hardware-in-the-loop system considerations
Some of the important characteristics of HIL simulators are shown in Figure 15 and
require elaboration in the list below 27.
1. The processor that is running the virtual vehicle simulator must be able to operate
deterministically in order to ensure system transient characteristics are captured
and simulated. This requires a real-time operating system that executes
integration steps at regular intervals signaled by clock interrupts. Event stream
processing must often be employed to attain the sampling rate requirements of
1ms or less required by automotive control systems 28.
2. To ensure that each integration step occurs within the specified simulation time,
fixed step solvers must be used for HIL systems. This introduces modeling
challenges when state changes such as gear shifting occur between simulation
steps and necessitates a hybrid discreet/continuous state model to be developed to
handle these events 26.
3. In order to accurately represent the physical vehicle systems being simulated, the
HIL models must be sufficiently complex. Increasing model complexity requires
21
increasing simulation step time, which conflicts with the system‟s real-time
operating requirements. An optimal balance must be struck between model
accuracy and simplicity to correctly represent the physical systems while ensuring
that transient dynamics are captured during simulation 29.
4. Empirical models are often chosen to ensure sufficient accuracy balanced with
deterministic execution. It is important to ensure that models constructed from
fitted data perform in a rational way outside of the data collection range.
Amplification of error can occur at data boundaries, particularly during start-up
transients, for example.
5. The controller area network (CAN) protocol that is used in the vehicle system
must be rigorously emulated on the HIL simulation system. This network must
also be tested for bus utilization, error handling, and network management
capabilities which requires the ability to externally monitor and load the network.
6. Designing the vehicle control system must include careful analysis of the method
of splitting control functionality between control hardware. Time critical and
non-time critical tasks should be split between loops and assigned to the
appropriate vehicle controllers. Partitioning the control in this fashion allows
independent processing paths to be used to check control rationality and ensure
safety through redundancy.
7. Sensor and actuator conformity must be tested by comparing vehicle sensor
performance metrics to HIL real-time simulator I/O performance metrics. In order
to ensure appropriate controller response, the HIL hardware must be able to
accept inputs and set outputs with the same time factor, range, and sensitivity that
the vehicle controller expects and delivers.
8. Controller loop rate can be tuned if the HIL simulation timing is sufficiently fast
to simulate the quickest vehicle system response. For example, anti-lock braking
systems require a physical model running integration steps every 4 ms in order to
ensure that the vehicle controller can be tuned to perform its function properly in
real time 30.
9. The overall HIL simulation system should be monitored by an external computer
to capture data, provide non-deterministic system status updates, program new
22
code to both the simulator and controller, and control simulation runs. This
computer also allows disturbances to the communication and I/O bus to be
performed to test controller response under repeatable failure conditions.
The types of tests and applications of hardware-in-the-loop simulation for vehicle control
validation are many, and the list is growing with the increasing popularity of exotic
hybrid and fuel cell vehicle powertrains. Table 4 is a short list of some of the ways that
HIL has been applied. Note that some of the applications define HIL to include hardware
such as engines, air compressors, or brake actuators that interface with real-time
simulation 31. This departs from the definition of a vehicle controller coupled with a realtime controller used in this thesis.
Table 4: Hardware-in-the-loop automotive application (individually referenced)
Hardware
Institute
ABS controller 31
Generic control 45
Compressor and controller
46
Application
KERI
14 degree of freedom vehicle simulation for ABS tuning and validation
DaimlerChrysler
Automatic comparison of time-dependent signals and responses
VKA
Characterization of compressor dynamics decoupled from fuel cell
Powertrain controller 47
Ford
Testing signal I/O faults for short to ground, short to battery, and float
Engine Control Unit 32
Delphi
Robust software design and testing practices on an encoder reader
ANL
Full powertrain coupled with PSAT vehicle dynamics and control package
Diesel Engine controller
48
Literature that has been published since the advent of hardware-in-the-loop simulation in
the early 1980‟s has documented applications such as communication bus validation,
jitter and determinism characterization, algebraic loop troubleshooting, executed
command and data lag identification, fail-safe testing, response variable tuning, and
system variability determination through stochastic simulation 32.
This thesis will outline the development HIL simulation models and how control systems
for a fuel cell hybrid vehicle can be safely and effectively tested. As the complexity of
future vehicle powertrains increases, so does the utility of virtual control system
validation. The novel HIL and SIL simulation techniques presented here are intended to
guide future fuel cell vehicle control system validation efforts, particularly in the areas of
communication validation and fail-safe testing.
23
Chapter 2: Fuel Cell Hybrid Chevrolet Equinox
2.1 ChallengeX
This thesis was closely integrated with the development of a fuel cell vehicle at the
University of Waterloo in the period from 2005 to 2007. In 2007, it was one of only 6
passenger fuel cell vehicles on the road in Canada and the only such vehicle to be built by
students. While the thesis focused on the HIL control system development, significant
work was also performed on fuel cell power train design and integration. The graduate
studies activities also extended to overall team leadership, hydrogen fueling system
design, safe facility infrastructure development, and participation in outreach events.
The University of Waterloo Alternative Fuels team was selected from over 300
universities that applied to participate in the ChallengeX competition. This advanced
vehicle design competition is part of a series organized by Argonne National Labs since
1989 and is sponsored by General Motors (GM), the US Department of Energy, and
Natural Resources Canada.
Figure 16: 17 ChallengeX teams at GM’s Milford Proving Grounds 33
The ChallengeX competition is a four-year competition with three phases that parallels
GM‟s Global Vehicle Development Process 33. Figure 16 shows the seventeen
competing schools with their 2005 Chevrolet Equinox vehicles. The first year of the
competition focused on model-based design, simulation, and market analysis with the
24
goal of developing vehicle technical specifications to drive the development in the second
and third phases. The vehicle technical specifications for the second and third year of the
competition, as well as the base Equinox performance specifications are found in Table 5.
The UWAFT team captured first place honours in the design phase of the ChallengeX
competition, as well as securing eight first place awards and two third place awards. The
second phase of the competition required that the design from the first phase be
implemented into a “mule vehicle” which met the vehicle performance specifications.
Phase three of the competition required the Equinox be brought to a “99% buy-off” level
of production readiness. This level of production readiness can only be reached when the
vehicles‟ appearance, drive quality, performance, reliability, safety, and control systems
pass stringent quality checks.
Table 5: University of Waterloo Fuel Cell Equinox: Technical Specifications 35
Metric
Base Vehicle
Waterloo Y2 VTS
Waterloo Y3 VTS
Fuel Economy combined EPA
[l/100km]
≤10.1
≤6.96
≤7.35
Mass [kg]
≤1818
≤2227
≤2000
Acceleration: 0100kph [s]
≤8.9
≤9.9
≤9.0
Acceleration: 80110kph [s]
≤6.8
≤9.4
≤6.8
Range – highway
[km]
≥512
≥224
≥220
Start Time [s]
<2.0
≤5.0
≤5.0
Passenger Capacity
5
2
5
Emissions [Tier, bin]
Tier 2, Bin 5
Tier 2, Bin 1
Tier 2, Bin 1
Trailering Gradeability 7% gr. –
90kph – 0.4km [kg]
1591
1136
1136
Trailering Gradeability 4% gr. –
90kph – 10km [kg]
1591
1136
1136
The approach that was taken to achieving a 99% buy-off level of production readiness for
the third year of the competition involved a significant amount of control development
25
and optimization. Hardware-in-the-loop simulation was used extensively to meet the
Year Three development targets. Augmenting basic powertrain control with full
diagnostic capability, adding redundancy and fail safe measures, and analyzing control
response to unexpected inputs are examples of how hardware-in-the-loop control
validation played a large role in 99% buy-off development.
2.2 Vehicle Architecture Description
The University of Waterloo Alternative Fuels Team made extensive use of Powertrain
Systems Analysis Toolkit (PSAT) as a design tool during the first phase of the
ChallengeX competition. The results of running a series of over 400 powertrain models
on standard drive cycles were used in selecting and optimizing the fuel cell hybrid
vehicle powertrain outlined in Table 6.
26
Table 6: University of Waterloo fuel cell hybrid vehicle powertrain components 35
Device
Fuel Cell Power
Module
Hydrogen Storage
DC/DC Converter
Motors (2 units)
Motor Controllers
(2 units)
Battery Pack
Make/Model
Specifications
Max Power:
65kW
Voltage Range:
190-300V
Current Range:
0-300A
Mass:
350kg
Max Pressure:
5000 psi
Tank Capacity:
4.31kg H2
Tank Weight:
92kg
Tank Volume:
178L
Input Voltage Range:
190-310V
Custom UWAFT design and
Output Voltage Range:
300-385V
construction
Converter Type:
Boost
Mass:
30 kg
Peak Power:
67kW
Continuous Power:
32kW
Max Torque:
190Nm
Mass:
84kg
Continuous Power:
67kW
Input Voltage:
260-385V
Output Current:
280A RMS
Voltage Range:
220-360V
Capacity:
8.5Ah
Energy:
2.4kWh
Mass:
88kg
Hydrogenics/HYPM 65kW
Dynetek/ZM180
Ballard/312V67
Ballard/312V67
Cobasys/NiMHax288-60
The second year of the ChallengeX competition focused on the mechanical integration of
all of the specified mechanical powertrain elements. The Equinox has a unibody
construction, which necessitated many structural modifications to package all the
required fuel cell powertrain elements. The overall powertrain layout is shown in Figure
17.
27
Figure 17: Powertrain packaging for the fuel cell Chevrolet Equinox
A nickel metal hydride battery, a three phase induction traction motor, a high DC/DC
converter, and power distribution are housed underhood. The fuel cell power module is
packaged in the floor of the vehicle to allow for five passenger seating. This required the
redesign of the main structural frame rails, which provide the Equinox chassis with most
of its stiffness 34. The rear cradle and vehicle sub-frame required significant modification
to accept a drive motor and hydrogen tank supports. Most of the powertrain component
mounting solutions were implemented using aluminum to ensure that vehicle weight
restrictions were met 35.
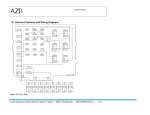
2.2.1 Vehicle Electrical Systems
The UWAFT fuel cell Equinox has a high voltage bus (220-360V), a 24V bus, and a 12V
bus, in addition to control system and communication bus wiring. The complexity of
these electrical systems was managed by developing comprehensive wiring diagrams for
the various vehicle systems. Figure 18 is a schematic of the wiring runs that were
implemented on the vehicle. A and B are fuel cell high power conduit. D, E, H, and I
represent motor high power conduit. G and C connect the battery and the fuel cells
through the DC/DC converter respectively to the high power bus. F ensures that high
voltage parasitic loads are powered.
28
A
F/C Module 1
D
H
E
F/C Module 2
F
G
Rear
Motor
HV
Distribution
Box
Motor
Inverter
B
C
Front
Motor
Cobasys - ESS
I
Motor
Inverter
DC/DC
A/C
Inverter
Figure 18: Major wiring conduits on the fuel cell Equinox
Connector labels corresponding to wiring diagrams ensured that troubleshooting of
circuits could be easily accomplished and added to the 99% buy-off production readiness
for the third year Equinox implementation 36.
2.2.2 Vehicle Control Architecture
The Equinox control architecture consists of a supervisory controller, a secondary
controller, and a body controller. The body controller (BCM) is stock and is programmed
by GM. The supervisory and secondary controllers are both UWAFT programmed
controllers and have the specifications shown in Table 7.
29
Table 7: Vehicle controller technology
Controller:
Processor:
Clock Frequency:
Internal Flash:
External Flash:
EEPROM
Internal SRAM:
Supply Voltage:
Analog In/Out Used
Digita In/Out Used
PWM Used
CAN Used
Supervisory
controller
Secondary
controller
Mototron ECU565128
Mototron ECU55580
Motorola MPC565
Motorola MPC555
56 MHz
40 MHz
1M
448K
NIL
2M (optional)
8K serial/optional
64K x 8 (parallel)
8K serial/optional
128k (parallel)
36K
32K
6-32VDC
8-16V
24
7
8
6
8
16
2
2
The number of powertrain elements and their specific control requirements necessitated a
complex communication bus to be implemented in the vehicle. There are three controller
area network (CAN) busses on-board and almost every available signal connection to
both controllers is used. Figure 19 shows the control hardware architecture in the vehicle,
as well as the elements requiring control.
30
CAN2
SC 2
Motor
Controller
SC 1
DC/DC
Converter
ESS
Motor
Controller
CAN1
Fuel Cell
Thermal Management
Mototron 1
High Voltage
Thermal Management
GM Body Controller
Mototron 2
SC 3
GM_CAN
H2 Storage
& Safety
Figure 19: Fuel cell Equinox control architecture
The high degree of complexity in the control architecture stems from the number of
independent powertrain subsystems. The integration of six major powertrain elements
from four independent manufacturers posed communication compliance challenges in
addition to the inherent difficulty of physically controlling the powertrain elements. To
solve these challenges, the communication bus was divided into three sections, and more
reliance on analog signal bus communication was required. The benefit of a complicated
hybrid architecture, however, is the ability to optimize the powertrain efficiency by
controlling which energy source provides power to the wheels for a given operational
mode 43.
2.2.3 Vehicle Hydrogen Storage System
The hydrogen storage system for the fuel cell Equinox was designed by Enviromech
Industries for the Alternative Fuels Team37. The ZM180 tank used in the system stores
4.31 kg of hydrogen at its service pressure of 5075psi and is a carbon-fiber wound type 3
tank. The fuel system was designed to comply with the most current codes and standards
for in-vehicle hydrogen storage, detailed in Table 8.
31
Table 8: Safety standards applicable to vehicular hydrogen storage
Code
CGA G-5.5
NFPA 52
CSA B109-01
CSA B51 Part 2
B51S1-05
ANSI/AGA NGV
3.1/CGA 12.3 and NGV
12.3-M95
Dynetek Cylinder And
Component Operations
Manual
Description
Hydrogen Vent Systems
Vehicular Fuel Systems Code
Natural Gas for Vehicles Installation Code
High Pressure Cylinders for the On-Board
Storage of Natural Gas as a Fuel for
Automotive Vehicles
Supplement No. 1 to B51-03, Boiler, Pressure
Vessel and Pressure Piping Code
Fuel System Components for natural gas
powered vehicles
Vehicle Applications
In order to validate the safety of the on-board hydrogen systems in collision events, the
stress and strain performance of the tank mounting solution was simulated using a finite
element analysis (FEA). The results from the FEA are shown in Figure 20, and were
compared with dynamic FEA results as well as real crash data for validation 38.
Figure 20: Finite Element Analysis on hydrogen tank mounting structure
32
The tank fills most of the vehicle‟s cargo space, highlighting the challenge of storing
sufficient quantities of hydrogen on board fuel cell vehicles, as discussed in the
introduction. Figure 21 shows the final hydrogen tank packaging.
Figure 21: Hydrogen tank location on the Chevrolet Equinox vehicle
2.2.4 Fuel Cell Power Module
The fuel cell power module selected for the Equinox was designed and built by
Hydrogenics Corporation, and is capable of producing 65kW nominally at approximately
50% thermodynamic system efficiency. The power module consists of two units, with a
total of four individual fuel cell stacks and is shown in Figure 22.
Figure 22: 65kW HyPM fuel cell power module
33
The power module‟s physical, mechanical, and electrical characteristics are summarized
in Table 9.
Table 9: Fuel cell power module performance characteristics
Minimum
Maximum
Unit
Voltage
190
300
V
Current
0
350
A
Power
0
65
kW
System Efficiency
45
56
%
Coolant Temperature
59
68
C
Weight
-
300
kg
Volume
-
543
L
The system has a single compressor which delivers 4200 slpm of air divided between the
master and slave modules 39. It is important to ensure even air flow between the two
modules. The compressor is located where the fuel tank was packaged on the stock
Equinox and has uneven lengths of piping into the fuel cell power module. To create
even flow distribution to each stack module, fluid dynamic simulation (CFD) was used to
estimate the difference in airflow. Designs developed using CFD were then tested and
tuned to balance the oxidant delivery to each side of the power module. Figure 23 shows
the simulation graphics, and an expanded view is found in Appendix F. A restriction was
ultimately introduced in the shorter line in order to ensure even airflow between the
system halves.
Equal length, 1:1
Actual length, 1:0.82
Constriction, 1:0.69
distribution
distribution
distribution
Figure 23: Computational fluid dynamics on the fuel cell air delivery system 50
34
2.2.5 Thermal systems
There are four component cooling loops on the Equinox. Each loop consists of one or
more radiator, pump, and fan. The coolant for the battery and motor loops is a 50/50
mixture of water and glycol. The fuel cell power module requires de-ionized water as a
coolant to ensure that no current leak occurs between the cells in series. The
characteristics of each of the cooling loops are described in Table 10.
Table 10: Fuel cell Equinox thermal system operating characteristics
Loop
Components
Fuel Cell
FCPM
Battery
Required
Heat
Rejection
(kW)
80
Flow (LPM)
120
Delta P (psi)
6.5
Max T (C)
80
Battery, AC Inverter
12
6
45
3
Front Motor
Motor, Inverter, DC/DC
9.5
9
50
4.5
Rear Motor
Motor, Inverter, Blower
8
10
40
3.7
To ensure that each cooling loop would integrate seamlessly into the vehicle, extensive
solid models were built. An example of the solid modeling performed is shown in Figure
24 for the fuel cell power module de-ionized water cooling loop.
Figure 24: Fuel cell heat rejection system packaging solid model
35
2.3 Infrastructure Modification
In order to safely handle hydrogen in the Alternative Fuels Team facility, a safety
certification process was undertaken. Codes and standards that needed to be adhered to
during the design of the hydrogen safe test facility were 51:
1. NFPA 30A Automotive and Marine Service Station Code
2. NFPA 50A Standard for Gaseous Hydrogen Systems at Consumer Systems
3. NFPA 50B Standard for Liquefied Hydrogen Systems at Consumer Sites
4. NFPA 52 Compressed Natural Gas (CNG) Vehicular Fuel Systems Code
5. NFPA 70 National Electric Code (NEC)
6. NFPA 88A Standard for Parking Structures (Facility Related)
7. NFPA 88B Standard for Repair Garages (Facility Related)
8. NFPA 68 Venting of Deflagrations (Station and Facility Related)
9. California Fire Code
Ventilation systems were added to the UWAFT facility to increase the number of air
changes per hour in the test cell during power module operation. A programmable logic
controller supervises the ambient hydrogen level, the power supply to devices above 2m,
the main door level, and the emergency stop shut off switches. In an emergency state,
the hydrogen supply to the facility is isolated, visual and auditory signals warn that an
alarm is present, and the ventilation system increases its speed.
36
Chapter 3: HIL modeling methodology
An overview of the „Hardware-in-the-loop‟ (HIL) simulation system is shown below in
Figure 25, and an expanded view is shown in Appendix F. The PXI real time controller
and data acquisition boards, the Mototron controllers, and the interface pad are shown in
an expanded view in the figure. The HIL simulation system was constructed and
programmed specifically for this thesis. To remain accurate to the physical vehicle
control system, identical controller hardware and wiring methods were used.
Relay bank
Input bank
Secondary controller
Voltage dividers
© Erik Wilhelm 2007 Failure insertion
PXI real-time controller
Supervisory controller
© Erik Wilhelm 2007
© Erik Wilhelm 2007
© Erik Wilhelm 2007
Figure 25: A Hardware-in-the-loop simulation system for a fuel cell Chevy Equinox
A close-up of the interface pad is shown in Figure 25, showing the four circuit boards
used to pass the signals between the real time simulator and the controllers. To simulate
vehicle low voltage (12 and 24V) controller wiring more accurately, relays similar in size
and performance to the vehicle‟s relays were wired to the HIL controller‟s low side
drivers. These relays perform vehicle functions such as switching pumps and fans,
controlling lights and contactors. By having these elements in the system, the switching
time can be more accurately simulated. The low side driver circuit as well as the circuit
for the failure insertion is shown in Figure 26. All other circuits are either pull-down
37
resistors or are pass-through connections. Please see Appendix B for full simulation
system connection summary.
a.
PXI ADC Input
Device on: 10Gohm
Device off: 820ohm
-
+
Vehicle
Controller
LS driver
0.5A quick-blow
13.6 V
1kohm
5.0 V
b.
PXI
0-5V digital
output
A= passthrough relay
B= ground/high relay
Input (5V
digital from
PXI)
Source (to
gnd)
PXI ADC Output
Drain (from
coil high)
Normal/Fault
Relay
10 mA fast
High/Low
Fault Relay
Vehicle
Controller
Analog in
1P2T
1 k potentiometer
13.6V
5.0 V
1P2T
Figure 26: HIL system circuits. Low-side relay driver (a) Failure insertion (b)
The speed with which the HIL simulation system can be reconfigured to run a new test
scenario simulation dictates the method used to validate vehicle controls. Iteratively
38
solving control challenges is a valid approach to overall control system development on
the HIL system due to the significantly reduced turnaround time for each trial in a virtual
environment. Conversely, iteratively solving controls challenges cannot happen as
quickly during in-vehicle testing due to safety concerns, prototype powertrain repair cost,
and length of trials. Most of the work performed on the HIL system involves a „guess
and check‟ style of iteration, with initial guesses being arrived at based on engineering
analysis and judgment.
3.1 Vehicle Communication Validation
3.1.1 Communication Lag Testing
The objective of this test was to quantify the jitter inherent in the vehicle control
hardware. Control system „jitter‟ is the failure of the control loop to execute within the
predefined loop time. By not performing deterministically (having jitter), a control
system poses a risk to vehicle hardware by not being able to accurately and predictably
perform its control tasks. The first step was determining the limits of the real-time
capabilities on the PXI real-time controller used as the virtual vehicle. The ability of the
PXI to deterministically run the vehicle plant model was theoretically confirmed 49 and
the next step was then to determine the lag inherent in both signal and data
communication busses on the hardware-in-the-loop simulation system. The final step
was the extrapolation of the results of the hardware-in-the-loop simulation to the vehicle
to evaluate the ability of the control hardware to accurately perform its control tasks over
all of its operation modes.
The PXI 8187 real time controller has an Intel P4 processor at 2.5 GHz with 1 GB of
RAM. The LabVIEW real time operating system on the controller ensures that the model
loop rates are fast enough to ensure that the simulation/control loop stays stable. Using
LabVIEW shared variable or RT-FIFO communication protocols to exchange data
between time critical and non-time critical loops according to National Instrument‟s best
practice recommendations increased confidence in the ability of the PXI to perform the
tasks required for the Hardware-in-the-loop simulation system 40. The application of
39
these techniques may be found in the sample code in Appendix C. In particular, the
methods described below were applied to all code written for the HIL simulator,
including:
1. RT-FIFO functions were used to pass data between time critical and non-time
critical loops;
2. „Sleep‟ time was added to the highest priority control loops to ensure that lower
priority loops would have an opportunity to execute;
3. Continuous sample timing was used as opposed to discrete sampling to allow the
RT system to pull data from the acquisition board as soon as new data was
available;
4. No TCP/IP communication was used in medium or high priority code to ensure
that communication lag to the host computer did not impinge on real time
operation; and
5. As many code optimization features as possible were allowed when the Simulink
real time workshop was building code.
The I/O requirements for the vehicle controller are shown in Table 11. A significant
number of the channels available on the Mototron controller could not be used for fuel
cell hybrid vehicle control because they were configured for internal combustion engine
monitoring and control applications. For example, four inputs are designed to be wired to
oxygen sensors which is a critical application in a combustion engine but renders the
inputs unusable in a fuel cell vehicle operation. The full control electrical connection
schematic for the HIL simulation stand can be found in Appendix B and outlines all
connections, including power, ground, and other physical interface pad connections.
40
Table 11: Hardware-in-the-loop simulation system input/output requirement summary
Signal Type
Channels
Analog In (0-5V)
44
Analog Out (Relay Drivers)
22
Analog Out (PWM)
14
CAN
3
Serial
1
Total I/O
84
The controller area network (CAN) communication on the vehicle takes place at 500
kbit/s and all PWM signals are transmitted at 10 kHz.
Real-time Hardware
PXI Chassis
Vehicle Controllers
A/D
Supervisory
Controller
MPC-565
128
PXI-8187
RT Controller
LSD
13.8V
PXI-6289
AO
Secondary
Controller
MPC-555
80
5.0V
PXI-6229
AI
User
interface
Data
logging
Machine-time Controller
Toshiba Satellite A40
Figure 27: Communication lag test data flow: Begins red, ends green
The communication lag test involves two channels on each of the PXI and the Mototron
controllers. The PXI generates an output signal, the Mototron controller reads the signal
in and passes it directly to a low side driver which induces 12V across the pull down
resistor read by the PXI. The outgoing pulse is shown in Figure 27 as a red line and the
41
echoed signal is shown in the Figure as a green line. This setup passes signals as closely
as possible to the way that they are actually passed during vehicle operation.
The determinism check algorithm was designed to run continuously in the background
while other code is running to ensure that the system remains stable when more
complicated control algorithms are developed and deployed on the controller. Figure 28
shows the algorithm, which relies on triggered subsystems to execute timing shifts when
the pulse is sent and received to determine the lag in the signal.
Figure 28: Timing pulse algorithm. Inset: Rising jitter triggered subsystem
A threshold crossing was chosen to trigger the analog output because a smooth square
wave is computationally intensive and one of the key assumptions in this trial is that the
determinism calculation adds negligible processor overhead relative to the more
computationally difficult vehicle control algorithms. The assumption that the PXI is
functioning deterministically was tuned and is checked in-service by using the LabVIEW
„is late?‟ function 41. The line inductance on the HIL system is assumed to be average
relative to any line inductance on the vehicle. Effort was taken to ensure that similar
relays were used and that comparable pull-down resistors were employed.
42
3.1.2 Communication Bus Loading
The vehicle relies heavily on its controller area network (CAN) communication bus. All
of the powertrain components with the exception of the DC/DC converter have CANenabled sub-controllers that respond to safety and operation commands. The network‟s
ability to handle high bus loads is therefore critical to safe operation. The CAN 2 bus is
the high-traffic bus that connects most major powertrain elements. Please refer to Figure
19 in Chapter 2 for a description of the communication bus architecture. High bus loads
occur on the fuel cell hybrid Equinox in particular when:
1. Testing is being performed on the DC/DC converter requiring the 1ms CAN data
logging message to be sent;
2. Asynchronous fault messages are being sent; and
3. Noisy communication bus signals are causing transmission errors requiring
messages to be re-transmitted.
In order to quantify the ability of the controller to handle heavy traffic on the CAN 2
network, the HIL system was configured to load the bus with signals. The signals chosen
for the bus loader application are ones that would normally be seen during vehicle
operation and are tabulated in Table 12.
Table 12: Messages from vehicle CAN bus sent by PXI for bus loading simulation
ID
Data
Signal
0x264
1
FCVM_MinCell_Voltage
0x316
2
MCU2_PowerReduction
0x318
3
FCPM_RuntimeMinutes
0x220
4
MCU1_PowerReduction
0x235
5
SC1_TankSolenoid
0x584
6
MCU1_ActualTorque
0x488
7
MCU1_Heatsinktemp
0x594
8
MCU2_Torque
0x396
11
MCU2_CurrentEstimation
0x298
10
MCU2_Heatsinktemp
0x387
12
FCPM_Coolant_overtemp
0x402
13
FCPM_Airflow
43
Their data payloads were modified to allow them to be easily identified in the analysis
and their transmission rate was varied to perform the loading test. Figure 29 shows the
bus loader model and the associated VI used to control the PXI as it transmitted CAN
messages.
a.
a.
b.
Figure 29: Bus loader model (a) and associated CAN transmission VI for the PXI (b)
A bus fault was determined by observing the battery counter message that is broadcast by
the controller to the battery pack. If 100 successive counts of that message are not
received or received in error, a bus fault is declared.
3.2 Controller Safety Response Validation
3.2.1 Fault Message Handling
Ensuring safe vehicle operation at all times is a critical objective of the vehicle controller.
In order to accomplish that goal, the controller must be validated on the Hardware-in-theloop simulation system to ensure that it is able to manage fault messages from all of the
powertrain element sub-controllers appropriately. For safety critical systems, a rigorous
layer of control and diagnostic strategies that ensure that the probability of events that
could lead to dangerous conditions (e.g.. startling the driver with an unintended
acceleration, loss of braking function) occurring is below a reasonable value.
44
Countermeasures such as dual path calculations, dual processors, checksum, and serial
data validity bits are implemented in these safety control layers.
A challenge faced by the team during the fault handling development was that the fuel
cell power module (FCPM) component controller was consistently reporting an
unexpected stream of error messages when a fault condition was present. This made
appropriate control response and a subsequent guarantee of safe vehicle conditions
impossible. The hardware-in-the-loop simulation allowed the assessment of control
response to critical fuel cell operating conditions such as over-temperature, under-voltage
and other states. Table 13 is a truth table that shows the desired response to received
CAN bus fault messages.
Table 13: Fuel cell fault management truth table
Condition
Fault
Ds 1
Ds 2
Ds 3
Ds 4
Ds 5
Ds 6
Ds 7
Ds 8
Ds 00
0x187 bit 1 == 1
Coolant Overtemp
T
F
F
F
F
F
F
F
F
0x187 bit 33 == 1
Low Coolant Flow
F
T
F
F
F
F
F
F
F
0x187 bit 0 == 1
Stack Undervoltage
F
F
T
F
F
F
F
F
F
0x187 bit 7 == 1
External E-Stop
F
F
F
T
F
F
F
F
F
0x187 byte 0 == 3
Wait for OCV
F
F
F
F
T
F
F
F
F
0x187 byte 0 == 5
No Fault
F
F
F
F
F
T
F
F
F
0x187 byte 0 == 8
Fault state
F
F
F
F
F
F
T
F
F
0x187 byte 0 == 11
Open loop mode
F
F
F
F
F
F
F
T
F
Red.
Limp
Red.
Pwr.
Pwr.
St.
Restart
Stndby
Log
Fault
Pwr.
Susp.
Action
Batt.
St.
To troubleshoot this issue and to design a response solution, a model of the fuel cell
power module was composed. This extremely simple error analysis model is shown in
Figure 30. A series of constants are defined in the model and are varied using the
simulation interface toolkit (SIT) front panel shown in Figure 31. The SIT is a tool that
was developed to automatically generate driver code to interface a compiled Simulink
model with National Instruments hardware 40. SIT writes code specifically for
interfacing real-time targets to host computers.
45
Figure 30: Fuel cell power module fault insertion model
Figure 31: Simulation interface toolkit fault handling algorithm
The test was performed in order to develop fault memory functionality on the Mototron
controller in order to capture the erratic fuel cell power module fault handling response.
46
3.2.2 Signal Failure Insertion
Vehicle operating environments subject wiring harnesses to extreme temperature
variation, debris, water, salt, and snow and it is not uncommon for wire harnesses to fail
as a result. It is crucial that, if a wiring harness fails, the elements of a vehicle control
system that are affected by the broken wire do not cause unsafe vehicle operation. A
good example is in throttle-by-wire operation, if one of the redundant throttle pedal
position sensors fails, a wide-open-throttle condition should not result. There are three
failure modes of interest:
1. Short to ground: occurs when a bare control wire contacts the chassis
2. Short high: occurs when a bare control wire contacts battery positive or live
control wire
3. Floating short: occurs when a control wire is severed resulting in a unpredictable
line voltage
The objective of the hardware-in-the-loop failure insertion testing is to ensure that if any
of these wire harness failures occur, the controller will respond appropriately.
To perform this validation, three target control signals were selected and their control
algorithms were extracted from the main control code. The selected signals were chosen
because they were identified as being critical to safety in the Design Failure Modes and
Effects Analysis (DFMEA) carried out by the Alternative Fuels Team. The signals and
desired responses and can be found in Table 14. The „IGBT ok?‟ signal is normally a 5V
signal that is sent by the high frequency switch in the DC/DC boost converter. If the
switch fails, current will be drawn in an uncontrolled manner from the fuel cell, which
can cause damage to equipment and injury to passengers. The safety in the vehicle code
is meant to disable the fuel cell if the 5V signal is not read as 5V, or is read above or
below that value by a slight amount.
47
Table 14: Three safety-critical control signals selected for fault insertion
Signal
IGBT ok?
Gear position
Throttle position A
Intended
failed IGBT
Drive or Reverse
Wide open throttle
Expected controller response
High
Float
Low
disable FCPM
may miss fault
disable FCPM
lock out torque
lock out torque
lock out torque
lock out torque
lock out torque
lock out torque
The gear position and throttle position signals control torque direction and magnitude,
respectively. Failure on either of these lines should result in a „zero-torque‟ command to
both front and rear motors. There is particular concern about the gear selection system
because it was custom-built for the vehicle using retrofitted contacts.
The control code dealing with each of these signals was abstracted from the most current
version of the competition code. The code sections were extracted verbatim and care was
taken to ensure that the fidelity of the controller behaviour was maintained by copying
exact syntax from the main control code to the failure insertion code shown in Figure 32.
a.
b.
c.
Figure 32: Failure insertion code. IGBT ok (a). Throttle position (b). PRNDL (c)
48
The control code was programmed to the appropriate controllers and the failure insertion
code from Figure 33 was established in order to apply the desired plant signals from the
vehicle. The „IGBT ok?‟ signal was constantly set low to simulate a failed switch. The
gear selector values were changed to test varied responses, as were the throttle position
values.
a.
b.b.
Figure 33: Failure insertion plant model. Simulink model (a) Labview control (b)
3.2.3 Voltage Droop Sensitivity
The vehicle control systems are required to respond appropriately when the 12V bus
voltage drifts outside of its normal operating range. During normal operation, 12V
system can droop if the NiMH battery state of charge is too low or if the instantaneous
current draw is too high (during power steering, for example). The 12V can spike if the
boost converters fail or receive an erroneous input signal. In either case, it is important
that critical safety and operation functions performed by the controller continue
uninterrupted. In order to assess the controller performance during 12V voltage spike
(18V) and droop (8V) conditions, that hardware-in-the-loop simulation system was used
to simulate voltage drift. Low side driver, CAN bus, and PWM signals were monitored
to ensure that their outputs did not behave erratically with variations in the 12V bus
voltage, and no such behaviour was detected.
49
3.3 Vehicle Dynamic Control System Validation
From the perspective of safe vehicle operation, the control algorithms that determine the
request for torque from the electric drive motors and the gear and throttle position are
critical. The algorithms must not only consider driver intent from the throttle and gear
position, but also the condition of the power delivery systems (fuel cell, DC/DC
converter, and battery) and the resulting effect of an increase in power. Experience has
shown that torque control on full electric hybrid vehicles is not trivial. During the second
year of the hybrid fuel cell vehicle development, at least two unintended accelerations
were caused by torque control algorithms lacking the required level of safety. To avoid
these problems in the third competition year, software-in-the-loop (SIL) verification
methods were applied to traction control and regenerative braking control algorithms
before they were implemented in the vehicle.
The software-in-the-loop model was extracted from the hardware-in-the-loop model.
This was done to target relevant torque control signals only and to avoid confounding
with other potential errors in the control code that could mask the analyzed responses.
The drive train and power generation plant models are shown in Figure 34. The chassis
and drive train model consists of a vehicle dynamics block, four tire blocks, and inertial
elements from Simulink‟s SimDriveLine™ toolbox.
50
a.
b.
Figure 34: Dynamic vehicle model (a) Powertrain model (b)
51
The motor models are empirically developed and use efficiency under specific torque and
speed operation depicted in Figure 35 to calculate instantaneous current and voltage
values. The motor models broadcast actual fault messages according to how they are
operated. The battery and fuel cell models, which will be discussed in greater detail in the
following chapters, are also capable of reporting faults according to the way that the
controller and powertrain are handled.
Figure 35: Efficiency table for the Ballard 312V67 MG AC induction motors
The dynamics blocks are loaded with the vehicle characteristics shown in Table 15 and
have undergone sensitivity validation. No single input variable was found to have an
overriding influence on the dynamic model‟s behaviour. These assumptions have proven
to yield stable model responses to driver inputs and are based closely on the Equinox
characteristics.
52
Table 15: Dynamic simulation model assumptions
Motors
Unit/Description
11.58:1
gear ratio in Ranger motor
RPM/torque curve
calculated from Ballard IPT data
Torque, current, efficiency curve
calculated from Ballard IPT data
0.05
response time (s) from manufacturer specifications
359
max motor voltage
239
min motor voltage
25
Nm- torque request offset
13500
max motor speed
435
A - max motor current (propel and regen)
Vehicle
Unit/Description
2178
vehicle mass (kg)
0.417
Coefficient of drag
2.686
Frontal Area (m2)
2.3975
length from CG(assumed centered due to our 50/50 weight split) to front
2.3975
length from CG(assumed centered due to our 50/50 weight split) to rear
0.4
height of CG (assumed based on low weight distribution from fuel cells)
Half-shafts
Unit/Description
10.5
lbs (front)
11.2
lbs (rear)
0.04446
kg-m2 (front)
0.08892
kg-m2 (rear)
Tire
Unit/Description
0.35605
rolling radius (m)
Braking torque
Unit/Description
30
starting speed (mph)
0
ending speed (mph)
35
stopping distance (ft)
1.60060015
time to stop (s)
-8.33125
deceleration (m/s2)
2095
mass (kg)
-17453.96875
force (N)
0.3
braking radius (m)
-5236.190625
N-m braking torque
The traction control and regenerative braking simulation models require specific input
from the plant model and create output commands accordingly. These inputs and outputs
are listed in Table 16.
53
Table 16: Traction control and regenerative braking inputs and outputs
Input
Unit
Output
Unit
Motor1_Speed
RPM
Front_motor_torque
N-m
Motor2_Speed
RPM
Rear_motor_torque
N-m
Motor1_Torque_est
N-m
Motor2_Torque_est
N-m
Throttle Position
%
Brake Position
%
Battery_PWR_allowed
kW
Battery_CHRG_allowed
kW
FCPM_Curr_allowed
A
FCPM_Voltage
V
Gear
enumeration
Regen_cutoff_speed_start
RPM
Regen_cutoff_speed_end
RPM
Max_regen_torque
N-m
The dynamic plant model is able to provide each of the inputs to the traction control
block so that regenerative braking and traction control functionality can be validated.
3.4 12V system validation
The second section of this modeling effort applied to the method of controlling the 12V
NiMH battery charging system. The 12V systems were identified as having a higher
probability of failure with significant failure effects on vehicle operation in the team‟s
DFMEA.
It was therefore imperative to design a robust and lightweight 12V system
and to test its operation and control before it was implemented. Vicor DC/DC buck
converters and an AA Portable Power MH-F13000 nickel metal hydride (NiMH) battery
pack are at the heart of the 12V system 36. The DC/DC converters step the high voltage
bus (300V) down to 13.4 V during normal operation. They are also able to reduce the bus
voltage to 12.5 volts in a „reduced parasitic‟ mode if the current drawn from them
exceeds 140A, and to 9 volts in a „shutdown‟ mode if the current draw exceeds 170A. If
the temperature exceeds 90°C, the Vicors reduce their output power and if the
temperature exceeds 95°C, then they shut down. These operating modes serve to protect
the Vicors from damage in over-temperature or over-current conditions, which are failure
modes were observed in previous rounds of competition. The intended battery control
54
logic is outlined in the stateflow chart in Figure 36 and includes the safety considerations
that are made to protect the occupants and the vehicle.
a.
b.
Figure 36: Battery control stateflow (a). Vicor safety stateflow (b)
The battery control inputs and outputs are outlined in Table 17.
55
Table 17: Battery control system input and output
Input
Unit
Output
Unit
Battery_state
N/A
Voltage setpoint
V
VicorA_temperature
C
PWM signal
%
VicorB_temperature
C
VicorC_temperature
C
VicorA_current
A
VicorB_current
A
VicorC_current
A
12V_battery_voltage
V
12V_battery_current
A
To test the battery control system, a battery model was designed to simulate the
behaviour of the battery pack. The pack has a nominal voltage of 12 volts and a capacity
of 13 Ah. Its charge and discharge characteristics and internal resistance are known from
the manufacturer‟s data sheet. This information is used to build the battery model shown
in Figure 37.
Figure 37: 12V NiMH battery Simulink model
56
This simple battery model is integrated into a larger HIL enabled model to be run on the
PXI. The top-level model contains constants such as the 12V charge bus voltage (labeled
3) and the discharge current (labeled 4) that can be modified in real time using the
simulation interface toolkit in order to test a particular control strategy. The top-level
model is shown in Figure 38.
3
4
1
2
Figure 38: Top level 12V battery HIL model
Other configurable variables in this model are the battery state message (labeled 1) and
E-stop ok variable (labeled 2) from the rear secondary controller. The initial SOC of the
battery is assumed to be 70% and the initial drain current is 0.
3.5 Offline Development
A major advantage of the hardware-in-the-loop simulation system for the Alternative
Fuels Team is the ability to develop control algorithms offline for auxiliary powertrain
subsystems. A Graphical User Interface (GUI) and a Bluetooth – CAN transceiver
system were established on the HIL simulation system without requiring any vehicle
resources or down time. These non-powertrain essential subsystems add significant value
to the vehicle‟s consumer acceptability, but are not important enough to warrant taking
the vehicle offline for their development.
57
To develop the CAN to Bluetooth interface, the functional requirements were defined and
can be found in Table 18. The purpose of the device is to receive critical CAN messages
so that test engineers can monitor the powertrain during operation and the battery during
charge mode. Of the four CAN signals that were identified as being of interest for live
wireless monitoring, the battery state of charge and voltage are the most critical.
Table 18: Critical CAN messages for broadcasting via Bluetooth to wireless device
CAN Signal of Interest
Period
Unit
Battery SOC
100 ms
%
Battery V
100 ms
V
FCPM power
Asynch
kW
Vehicle speed
100 ms
kph
The model that was developed to perform this testing was then built for the PXI. The
model function is to create artificial CAN signals that are broadcast to the R.M.
Michaelides hardware called the CANVIEW-Bluetooth™. The technical specifications
for this device can be found in Appendix A. The model is extremely simplistic. It simply
outputs repeated sequences to specific Simulink out ports. These out ports are defined as
CAN signals using the simulation interface toolkit (SIT) and the CAN baud rate must be
hand-coded to 500 kbits/s in the SIT “io_init” virtual instrument. The simple model, the
CAN definition for the battery SOC signal, and the data transmission path are shown in
Figure 39.
58
a.
b.
c.
PXI 8187
Simulation
Interface Toolkit
PXI
8461
2 Channel High
Speed CAN
CANVIEWBluetooth
Transceiver
Blackberry
Bluetooth buffer
UWAFT
Blackberry JDE
API
Figure 39: Bluetooth to CAN development on the HIL system. Simple HIL model (a) Battery CAN
message definition (b) Data transmission pathway (c)
Two major challenges existed for the integration of the graphical user interface (GUI).
The first was establishing a method of communication between the GUI and the vehicle,
and the second was ensuring that the GUI displayed the correct value during operation.
The National Instruments TPC-2006 is a touch screen device that runs Windows CE™
and is shown in Figure 40. It has four serial ports, of which one is a 2-wire RS-485 port.
The Mototron ECU-565 is also capable of communicating over 2-wire RS-485. The
availability of this communication port and protocol and the lack of CAN device drivers
written for WinCE drove the decision to use the 485 ports to communicate with the GUI.
59
GUI on test stand
Figure 40: Graphical user interface being developed on the HIL system
The GUI test HIL model is shown in Figure 41 and would be identical to the code
implemented in-vehicle. This interface simulates the gear selection through a LabVIEW
front page and also allows a ground fault event to be simulated. The GUI displays
required information for the driver related to traction, necessitating a high level of
reliability. These messages are then sent over RS-485 using code identical to that which
is loaded on the Mototron controller.
60
Figure 41: GUI vehicle controller interface code
In order to meet consumer acceptability requirements, the gear selection function on the
GUI must respond to the mechanical movement of the parking pall without a perceived
time lag. In addition, the colours must be selected to ensure that the selected gear is
visible even when sunlight is streaming into the vehicle.
61
Chapter 4: Validation Results and Discussion
The control validation performed in this thesis solved several critical controls issues and
added value to the hybrid fuel cell vehicle development during the third year of the
ChallengeX competition. The development time saved, the improved safety to personnel
and materials, and the improved systems understanding has justified the effort expended
in extensive virtual control validation. Parallelizing the control development in order to
develop and debug control strategies and to create first estimates for calibration
parameters prior to vehicle availability was made possible through HIL on battery
charging, Bluetooth™ interface, and graphical user interface control code. Software-inthe-loop torque control validation was used to reduce troubleshooting and calibration
time once a vehicle became available for dynamic testing.
HIL simulation was instrumental in ensuring that problems that are very difficult to
identify at the vehicle level such as processor RAM failures like „bit flips‟ and data type
errors were caught at the simulation stage before they could cause any damage in the
vehicle system 42.
Throughout the control system development and validation, a comparative analysis of
desired versus actual control response was performed to judge the suitability of changes.
Control system performance was optimized where possible and judged on a pass/fail
basis from a safety perspective. For these models, absolute model fidelity was not
required and rough empirical models were appropriate. However, for some of the control
tuning and calibration work, highly accurate models were required to ensure that correct
gain and offset values were selected, for example. Even for these models, virtual control
validation was treated as a good „first estimate‟ and tuning of control parameters was
often performed after code was loaded onto the controllers.
Empirical instead of mechanistic models were selected for the motor, fuel cell, battery,
and most other powertrain components. The exception was the vehicle dynamics models
which were taken from the SimDriveLine library. The overriding reason for this decision
was the availability of all of the data required to build the accurate system models. The
62
fuel cell vehicle operating data provided a comprehensive source of steady-state as well
as some transient empirical correlations for battery, motor, and fuel cell operation.
Detailed descriptions of the modeling results will be provided in this section.
4.1 Vehicle Communication Validation
4.1.1 Signal bus lag
Testing the signal bus lag was the first HIL simulation performed. This was performed
first because the intent was to benchmark the lag across all additional tests to evaluate the
impact of processor utilization on communication lag. The DC/DC converter is the
powertrain element that is most sensitive to signal bus lag. If the controller is unable to
execute its algorithms within 1 ms, then it may miss the most current input and output
voltages and will not be able to effectively control the DC/DC switching frequency. All
other signal bus elements have time factors in the 20-100ms range, such as thermistors,
pressure transducers, and potentiometers. A lag of over 20 ms in the time required to
perform a signal read/write operation may result in the controller missing critical
dynamic powertrain behaviour and is unacceptable for safe vehicle control.
The I/O operation with the longest anticipated signal lag was chosen for this test. The
actuation of a low side driver circuit and the measuring of a response across a pull down
resistor is the event which requires significant processor overhead and has the most line
inductance. The simulation model described in the previous chapter was debugged and
tested using a digital oscilloscope to verify that the signal being logged was identical to
the signal being sent and received. To be able to monitor performance, the signal values
displayed on the host machine needed to be decimated to display one signal value for
every 100 sent/received. This compensated for the lag in TCP/IP communication and
served to avoid host over-write failure when no decimation was applied.
63
The test methodology required that the signal output pulse be stepped through a series of
frequencies to see if the period has an effect on the delay between the sent and received
signals. The results from the first test are shown in Figure 42.
6
input
response
5
3
Falling lag
=110ms
{
{
Signal (V)
4
2
Rising lag
=105ms
1
0
0
0.1
0.2
0.3
0.4
0.5
0.6
0.7
Time (s)
Figure 42: Lag resulting from signal bus test with PXI simulator sleep
The rising lag was measured at 50% of its resting value and was approximately 105 ms,
and the falling lag was 110 ms throughout the entire test frequency cycle. This was an
unexpectedly long lag on both the rising and the falling edge and warranted examination
of the control code. A 100 ms delay block was found in the code, and was replaced with
a 10ms delay for the second trial.
The full trace from the second lab experiment is shown in Figure 43, and serves to
highlight the experimental procedure. The frequency of the pulses was varied from 10,
15, 20, 25, 30 to 40 Hz during the trail. The second I/O lag trial resulted in an average
rising lag of 12 ms and an average falling lag of 16 ms which can be seen in the zoom
image in Figure 44. Note that both the pulse and response are at 5V, a change from the
64
initial trial where the pulse was set at 2.5V. The base 10 ms lag is caused by the inherent
loop delay to allow the processor to sleep. The additional lag on the rising edge is a
combination of the time taken to actuate the relay coil and the time required to write the
data to the buffer. The additional lag on the falling edge is a combination of the line
inductance and the time taken to write the data to the buffer. Experiments replacing the
1Kohm pull down resistors with 120 ohm resistors showed no perceivable improvement
in falling lag, leading to the conclusion that the data acquisition board‟s internal pull
down resistance is producing this latency.
6
5
Voltage (V)
4
3
2
1
0
0
5
10
15
20
-1
Time (s)
Pulse
Response
Figure 43: Varied frequency bus lag trial with PXI sleep time removed
65
25
30
35
6
5
Voltage (V)
4
3
2
1
0
0
0.1
0.2
0.3
0.4
0.5
0.6
0.7
0.8
0.9
1
-1
Time (s)
Pulse
Response
Figure 44: Close-up view of signal bus lag trial with PXI sleep removed
The instantaneous lag was recorded over time and can be seen in Figure 45. The nonsteady state values which are represented as spikes in the curve can be neglected because
they are a function of how the lag is determined. The steady-state lag values show no
correlation between the quantity of lag present and the frequency of the pulse signal. The
hardware is configured to continuously acquire samples and to send those samples to the
model as soon as they are ready. The software is not always ready to accept the
hardware-acquired samples. Depending on the number of samples in the buffer at a given
instant, there may be different processing times associated with each switching event,
giving rise to the random behaviour of Figure 45.
66
25
20
Voltage (V)
15
10
5
0
0
5
10
15
20
25
30
35
-5
Time (s)
Rising lag
Falling lag
Figure 45: Cycle lag recorded over time for PXI sleep removed data lag
The results of this test show that there is less than 20 ms of lag in the longest signal event
on the HIL system. It is expected that all other signal bus operations will occur in less
than 20 ms, because the low side driver actuation and signal measurement across a pull
down resistor require the maximum amount of system resources and physical/mechanical
switching. Most of the physical systems that will be simulated on the vehicle have time
factors that are significantly larger than 20ms. The only operation on the vehicle which
requires a controller response speed in the order of 1 ms is the DC/DC control. To be
able to accurately simulate the DC/DC control, another study must be performed on the
ability of the PXI to read in the 10 kHz PWM signal from the controller accurately in
order to properly output the DC/DC response.
4.1.2 CAN bus loading
Validation of the CAN bus loading was performed using the Kvaser CANking™ bus
monitoring tool as seen in Figure 46. The CAN messages, payload, and transmission rate
corresponds to the expected communication over both CAN busses with the code loaded
on the controllers.
67
Figure 46: Kvaser bus monitor showing CAN bus load with competition code
The signal bus lag was determined to be greater than 10ms on the HIL simulation system
in the previous thesis section. This was deemed adequate for simulating all powertrain
elements requiring analog or digital control signal interface except for the DC/DC
converter. The CAN communication network is where most of the high speed closedloop powertrain control takes place. A CAN signal must be received and transmitted
within a single controller loop cycle of 10 ms without exception. The results of the CAN
bus loading experiment show that meeting this CAN communication speed requirement
is possible on the HIL simulation system. Even under heavier communication bus loads
than are present on the vehicle, CAN communication takes place deterministically with
no latency issues.
Table 19 shows the communication bus loading trials that were undertaken and the
results generated. The loop rate column refers to the rate that the SIT model broadcasts
the 13 target vehicle CAN messages across the HIL system bus and is directly
proportional to the quantity of CAN data that the PXI sends each second. The CAN bus
load with only PXI vehicle model broadcasting CAN is a function of the payload of each
68
CAN message, as well as the message transmission frequency. Each PXI vehicle model
CAN message is carrying a maximum of 16 bits of data.
Table 19: Results from bus loading tests
loop
PXI load
Total load
Trail
(ms)
(%)
(%)
Error?
Pass?
1
50
6
42
N
Y
2
20
14
50
N
Y
3
10
29
64
N
Y
4
5
55
83
Y
Y
5
1
263
N/A
N/A
N
Although a CAN error flag was set during the 4th trial when the bus load reached 83%,
the test was still deemed a pass because the error was reset and the target controller CAN
message was not received late. With the 5th trial, the CAN bus crashed immediately each
time the PXI was brought online. From Figure 47, which plots bus load relative to PXI
CAN transmission rate, a 100% bus utilization loop rate for the bus loader model was
calculated at 2.37 ms. Additional bus loading trials were performed to test the prediction
accuracy of the bus loading figure. A 3 ms loop rate transmitting the 13 messages
corresponds to an exact bus loading of 90%. The PXI was unable to sustain this level of
bus load for more than a few minutes, which suggests that at 90% bus load, the vehicle
controller area network communication bus will be unstable. It is recommended,
therefore, that the vehicle CAN bus be loaded to no more than 90% capacity. This
coincides well with the control design „rule-of-thumb‟ that an 80% loaded bus is a fully
loaded bus.
69
90
80
Bus Load (%)
70
60
y = 129.3x-0.29
50
40
30
20
10
0
0
10
20
30
40
Loop Rate (ms)
50
60
Figure 47: Bus load as a function of 13 message transmission loop rate
The maximum controller bus load that has been recorded during vehicle operation is less
than 50%. At this level of CAN bus utilization, the results of the bus testing suggest that
there will be no concern of CAN signal latency interfering with safe vehicle operation. It
is important to note, however, that the vehicle CAN signal bus is significantly longer and
is subject to higher levels of electromagnetic interference. All of these factors contribute
to signal noise which increases data loss on the communication network. The vehicle
CAN network is less tolerant to heavy bus loading than the HIL system, even though a
wide utilization safety factor has been shown to exist.
4.2 Controller Safety Response Validation
4.2.1 Fault Message Handling
The fault message simulation model‟s simplicity is its utility. The simulator was used to
asynchronously transmit fault messages to the vehicle controller. The fault messages
shown in Table 20 were simulated and the expected response from the controller in each
of the cases was verified. If the fault message was stored appropriately in the Mototune
failure memory and the access operation was successful, a „Pass‟ was designated.
70
Table 20: Simulated fault messages
Fault Message Transmitted
Response
Pass?
stack_undervoltage
Temporary in occurred faults
Y
coolant_underflow
Held in active faults
Y
coolant_overtemperature
Held in occurred faults
Y
external_estop
Held in active faults
Y
This behaviour is demonstrated in the screenshots of Mototune in Figure 48. In each
case, the controller correctly identified and responded to the fault. Case (a.) shows the
stack undervoltage fault saved to controller memory, case (b.) shows an active stack
undervoltage fault, and case (c.) shows the stack coolant overtemperature fault occurring
while the undervoltage fault has been saved.
a.
b.
c.
Figure 48: Mototune screenshots demonstrating appropriate controller response
The results of this simulation showed that the controller was not the source of the
undesired behaviour. Attention was then turned to the fuel cell power module controller
and it was discovered that, due to an internal programming error, the failure message was
being broadcast multiple times on the mirrored CAN bus in rapid succession as soon as a
single fault was logged. This error was remedied in new code which properly handled
the fault messages being transmitted on both controller communication busses. At this
time, however, the results of the newly loaded code which included the updated fuel cell
code are not available.
71
4.2.2 12V Bus Droop/Spike Testing
The 12V bus droop and spike testing was carried out using the same HIL model as the
CAN bus loading testing. This allowed the CAN message signals that were indicative of
normal function to be monitored for abnormality and unexpected behaviour resulting
from 12V bus variation. The HIL setup was validated for its proximity to the actual
vehicle conditions as part of the CAN bus loading procedure. In addition, the voltage
across the „MCU1 key in‟ high side driver was monitored.
Measured Voltage (V)
20
15
10
5
0
0
Input
5
10
BCM Keyin
Trial
15
20
Figure 49: Control output voltage relative to input voltage
The controller high side driver output response to varied values in supply voltage was
predictable and can be seen in Figure 49. Throughout the trial, the output voltage tracked
the input voltage closely. Table 21 documents the controller status as the voltage is
varied and agrees with Figure 49 for the voltage at which the controller ceases to function
reliably. Throughout the trial, the target CAN messages and control outputs remain as
expected until the voltage dipped below the minimum voltage that the controller required
for operation. A control relay opened just before the rear controller shut off, after
reaching its minimum coil voltage. The voltage spike to 18V resulted in no unexpected
control response.
72
Table 21: Controller status during voltage spike/droop trial
#
V
Status
1
13.05
2
Note
#
V
Status
Note
ok
18
7.13
ok
14.06
ok
19
7.03
ok
3
15.06
ok
20
6.93
ok
3
16.07
ok
21
6.84
ok
4
17.07
ok
22
6.73
ok
5
18.07
ok
23
6.63
ok
6
12.05
ok
24
6.53
ok
7
11.05
ok
25
6.43
ok
8
10.05
ok
26
6.33
ok
9
9.05
ok
27
6.23
ok
10
8.05
ok
28
6.13
ok
11
7.83
ok
29
6.03
ok
12
7.73
ok
30
5.93
ok
13
7.63
ok
CAN error
31
5.83
warning
Control relay out
14
7.53
ok
Error clear
32
5.73
fault
Rear controller out
15
7.43
ok
33
5.63
fault
16
7.33
ok
34
5.53
fault
17
7.23
ok
35
5.43
fault
PXI CAN out
Front controller out
The objective of the test was to determine if variation in input voltage causes unexpected
control response and to identify the minimum operation voltage for the controller. No
unexpected control responses were observed until the controllers ceased operating at
5.73V (rear) and 5.43V (front). These values have an impact on the control
implementation in the vehicle by setting an absolute lower limit on the amount that the
12V NiMH battery can droop. Voltage droop on the 12V line has caused the vehicle
controllers to cease function in the past, but no quantification of the limits has been
performed until now.
4.2.3 Failure Insertion Validation
The failure insertion model was not validated with operating data because data is
unavailable for the potentially dangerous failures that were being simulated. The code
73
used to build the model was, however, copied directly from the most current vehicle
control code and is expected to behave identically to the vehicle code. While it is
undesirable to use simulation results that have not been validated, in this case, the
difficulty and danger in obtaining operating data justified the lack of validation.
The IGBT failure monitoring signal failure insertion trials are summarized in Table 22 .
For all three fault conditions, the controller did not perform as expected. The controller
was to disable the fuel cell power module in the event of any „IGBT ok?‟ line
irregularities. Instead, the enable line was held true as seen in Figure 50.
Table 22: ‘IGBT ok?’ monitoring line failure insertion results
Line condition Induced failure
Expected response
IGBT failure
12V line short
disable FCPM
IGBT failure
ground line short
disable FCPM
IGBT failure
floating line short disable FCPM
Observed response
Normal FCPM operation
Normal FCPM operation
Normal FCPM operation
Examining the code in light of the inability of the controller to disable the fuel cell even
when a failure was not inserted in the IGBT safety line resulted in the discovery of a
disabled safety switch. The terminator circled in Figure 51 prevents the IGBT fault
signal from disabling the fuel cell power module.
a.
b.
Figure 50: Undesired controller response to ‘IGBT ok?’ failure. No inserted line failure (a). Inserted
short high (b). Inserted short to ground (c)
74
c.
IGBT safety logic
Figure 51: Terminated safety logic in competition controller code
It is recommended that this safety switch be re-enabled in future code revisions.
In order to test the ability of the controller to ensure that unintended torque is not
generated due to gear selector line failure, a gear direction was chosen and the failures
shown in Table 23 were induced. It was assumed that disabling the torque control
strategy block (TCS) would ensure that no torque requests were sent to the motors. Close
to 40% of the gear selector failure insertion trials did not exhibit the desired response and
failed to disable the TCS when a failure was inserted.
75
Table 23: Gear selection failure insertion control response
Trial
Reverse
Drive
TCS enable?
Desired?
1
0
0
0
Y
2
1
0
1
Y
3
0
1
1
Y
4
1
1
1
N
5
high (0)
0
0
Y
6
low (0)
0
1
N
7
float(0)
0
0
Y
8
0
high (0)
0
Y
9
0
low (0)
1
N
10
0
float(0)
0
Y
11
high (0)
1
1
Y
12
low (0)
1
1
Y
13
float(0)
1
1
Y
14
1
high (0)
1
Y
15
1
low (0)
1
Y
16
1
float(0)
1
Y
17
high (1)
0
0
N
18
low (1)
0
1
Y
19
float(1)
0
0
N
20
0
high (1)
0
N
21
0
low (1)
1
Y
22
0
float(1)
0
N
23
high (1)
1
0
N
24
low (1)
1
1
Y
25
float(1)
1
0
N
26
1
high (1)
0
N
27
1
low (1)
1
Y
28
1
float(1)
0
N
Two major control logic errors were identified; one was unique to trial 4, and the rest of
the trials with unexpected results are a result of another type of logic error. Figure 52
shows a subsystem in the control logic directly before the decision to allow torque to be
enabled is made. The logic ensures that if either the reverse, drive, or tow gear are
enabled, torque commands may pass to the motors. It is recommended that an
enumeration strategy similar to the one implemented in the torque magnitude calculation
shown in the second pane of Figure 52 be implemented to disable the ability to pass
torque if two gears are selected. The redundancy of the safety ensures that even if two
gears are selected, a „zero-torque‟ command will be sent and that the torque control
strategy will also not be active in the eventuality of this failure.
76
a.
b.
Figure 52: Implemented torque pass-through arbitration (a). Recommended torque pass-through
arbitration (b)
The remaining unintended torque pass-through events in this trial result from the lack of
effective error checking in the gear selection algorithm. It is recommended that the
possibility of short circuits should be considered in the control code, especially given the
custom-built nature of the gear selector. A single NOR block that filters all of the gear
selection signals and prevents the torque control system from being enabled if it reads a
„true‟ value would be a simple solution to the problem.
77
The throttle position trials yielded unexpected results, beginning with an unplanned trial
during which a floating voltage signal occurred while setting up the failure insertion
channels resulted in a torque request when the TCS was disabled. This result was then
confirmed during the formal trials shown in Table 24.
Table 24: Throttle pedal position sensor failure insertion trails
Trial
1
2
3
4
5
6
TPS A
0
1
1
0
1
1
TPS B
0
1
0
1
1
1
Throttle pos.
0
1
0.52
0.51
1.02
1.02
gear
drive
drive
drive
drive
no gear
reverse
Front torque
0
152.29
76.8
76.2
152.29
-152.29
Rear torque
0
152.29
76.8
76.2
152.29
-152.29
Expected?
Y
Y
N
N
N
N*
*Value should be limited below maximum reverse torque and flipped instantly on
switching. Actual response should be ramped on shifting after vehicle speed reaches a
low threshold.
Over 65% of the throttle pedal failure insertion trials yielded unexpected performance
from the controller. The desired response for a disagreement between the values read on
the two redundant throttle position sensors (TPS) is to not allow torque to be applied at
the wheels. When contrasted with the observed performance during Trial 3 in Figure 53,
which shows the throttle signal sent to the torque calculation algorithm as the average of
the two values sensor values, it is clear that this safety feature is not working correctly.
Trial four confirmed that the same fault is present using the second throttle position
sensor as a comparator.
78
Figure 53: Averaged instead of zeroed throttle position value when sensors disagree
In Trial 5, the gear selector was shifted out of gear (between gears) which should have
placed the torque request to zero as an error state. In this case, however, without a gear
to use to arbitrate the torque request, the control code continued to feed through an old
torque request, regardless of the actual throttle position. This represents unsafe operating
condition that needs to be addressed with fail-safe code. Trial 6 was a shift from wide
open throttle moving forward to a reverse gear. The appropriate control response would
be to limit the reverse torque until the vehicle speed reaches a pre-determined level which
is safe for the mechanical systems. Instead, the trial witnessed an instantaneous full
reverse torque request. This type of action is very likely to result in damage to the motors
or to the half-shafts.
To address the out-of-gear torque request, it is recommended that the enabled subsystem
containing the torque control strategy be modified. Figure 54 shows a block parameter
editor with the „state when enabling‟ parameter selected to be held. It is recommended
that if the state when enabling is changed to „reset‟, the out-of-gear issue will result in a
torque request of the default values which are easily set to zero in the torque request
algorithm.
79
Figure 54: Torque request enabled subsystem parameter: change ‘held’ to ‘reset’
In order to ensure that the redundant throttle position sensors behave in a fail safe
manner, it is recommended that the code circled in Figure 55 be fully implemented. The
initial comparison has been made between the throttle position sensor values, but nothing
is being done later in the code with the safety variable that is generated. It is
recommended that this variable be used to arbitrate whether torque be passed through in
the second pane of Figure 55.
80
a.
b.
Figure 55: TPS safety variable partial implementation (a). Proposed location for TPS safety variable
(b)
81
In the same subsystem used for implementing the TPS rationality check variable, called
„Safety Implement‟, it was noted that the MCU torque release safety checks had also
been overridden by a constant.
Inserting faults in this system was not performed because of the lack of failure handling
code identified in the preliminary trials. It was evident that there were no measures
implemented to handle the sensor rationality checking and therefore there would be no
provisions for failure insertion in these signal lines. It is recommended that control code
be implemented to cause the controller to gracefully execute fail safe measures if any
signal line inconsistency is noted.
4.3 Vehicle Dynamic Control System Validation
The fidelity of the SIL dynamic vehicle model was validated using a separate set of
vehicle operating data than was used to build the model. A representative result of this
validation is shown in Figure 56 which compares the vehicle high voltage busses to the
predicted high voltage busses for acceleration from 18 to 50 kph. The comparison of
predicted with actual operating data shows good agreement, leading to the conclusion
that the powertrain model has a high degree of accuracy. It should be noted that the
validation did uncover weaknesses in the model, particularly when considering noncritical vehicle component failure. The rear drive motor was often in a power reduction
or fault state during vehicle testing. This behaviour was not considered in the control
validation model for simplicity, but should be considered in future revisions to improve
model fidelity.
82
Figure 56: Validation of model predicted bus voltages vs vehicle acceleration data
Once the model fidelity was confirmed, the torque control and regenerative braking
algorithm validation was an iterative software-in-the-loop (SIL) process that was
performed before each new code revision was loaded to the vehicle controller. This
mandatory check took place because of previous experience loading untried code to the
controller and witnessing unintended acceleration events. The intended torque control
algorithm can be seen in Figure 57 43.
The first SIL effort was directed at debugging code. Once the code was debugged, the
simulation was used to provide approximate braking torque slew rates for regenerative
braking.
83
Direction of Vehicle
Direction of Torque Request
Positive
Negative
Forward Propulsion
Forward Regen
Reverse Regen
Reverse Propulsion
Positive
Negative
Figure 57: Intended torque control algorithm
The first version of the regenerative braking and traction control code that was loaded in
the SIL simulation system resulted in unintended behaviour. Table 25 outlines the
development and shows the iteration cycle that was performed to bring the code to an
acceptable performance level.
Table 25: Torque control strategy troubleshooting process
Error
Fix
Vehicle Capable?
Both motor full torque applied to single motor
Remove doubling gain
N
Torque passed through in park
Add safety to enumeration block
N
No torque available for reversing
Fix double safety redundancy
N
RPM limited at 500
Remove RPM limiting saturation
Y
Full negative torque requested at initial brake
Add saturation to limit regen torque
Y
Torque ramp too steep causing jarring decel
Add slew rate limitation to ramp
Y
These code fixes were all identified and implemented without running full SIL trials with
actual drive cycle inputs. They were performed using static input blocks and semidynamic models. Additional errors were discovered when real driver torque requests
were made using full dynamic simulation. Figure 58 shows no regenerative braking
being performed during deceleration, shown circled in the figure and characterized by a
lack of negative torque.
84
120
4000
3500
100
3000
2500
60
2000
1500
40
Wheel speed [RPM]
Speed [kph]/Torque [N-m]
80
1000
20
500
0
0
2
4
6
8
10
12
0
14
-20
-500
Time (s)
speed
Front Torque Req
RPM
Figure 58: Regenerative braking control strategy not functioning as intended
The cause of this behaviour was eventually identified as a safety logic error. Redundant
safety checks to ensure that regenerative braking would be performed during forward
motion were not receiving the required input speeds to unlatch the regenerative braking
function. Once this error was identified and corrected, regenerative braking behaviour
shown as negative torque requests, circled in Figure 59, was obtained through the
software-in-the-loop modeling.
140
8000
120
7000
100
5000
60
4000
40
3000
20
2000
0
0
5
10
15
20
25
30
35
40
1000
-20
-40
0
Time (s)
speed
Front Torque Req
RPM
Figure 59: Regenerative braking control strategy functioning as intended
85
Wheel speed [rpm]
Speed [kph]/Torque [N-m]
6000
80
4.4 12V NiMH charge system validation
The 12V system on the vehicle was completely redesigned for the 3rd year of competition
to improve its robustness and reliability after experiencing critical failures during the 2nd
year of competition. The validation effort began by checking that the discharge
behaviour of the battery model was consistent with the manufacturer‟s data for the
discharge performance. Figure 60 shows the actual performance overlaid with the model
predictions. It was found that the empirical data could be modeled with a third order
polynomial which produced a satisfactory fit, as can be seen in Figure 60.
1.4
1.2
Voltage (V)
1
0.8
0.6
0.4
0.2
0
0
10
20
30
40
50
60
70
Time (min)
Data
simulation model
Figure 60: Empirical NiMH battery system model fit
Once satisfied that the battery model accurately represented the performance data,
controls tuning was initiated, using software-in-the-loop methodology. The SIL testing
was able to identify the following behaviour issues before moving to HIL:
1. Charge control enable block was not properly attached, resulting in no current
pass-through; and
2. Sign reversed on integrator block caused unstable response to PWM input.
86
Once these issues were resolved, the code was flashed to the Mototron controllers and
HIL testing uncovered further unanticipated issues. The first major issue, underlined in
Table 26, was the disparity between the expected current sensor values and those that the
PXI were sending it. The current sensor employed on the battery for metering charging
current has a 0 current setting of 2.5V, and climbs to 3.5V for the max charging current
of 37.5A. The controller was calibrated to receive the proper current sensor signal as
shown in the table.
Table 26: Expected versus actual current signals
Current
Current
Expected
Signal
Signal
0
0
2.50
10
1
2.77
20
2
3.03
30
3
3.30
37.5
4
3.50
45.5
5
3.71
The next issue identified concerned the PI control loop used to set the charge current.
The proportional error term was being artificially inflated, causing major control
overshoot. This was because the PWM signal from the controller to the simulated charge
circuit was not being interpreted as expected by the PXI. Line resistance was causing the
expected 5.0V (RMS value for full duty cycle) to be read in as 4.11V, causing a lower
current flow than expected. This in turn caused the integrator error term to „wind-up‟ and
resulted in unstable control. This is an example of where an HIL virtual system issue is
not significant in the actual system. The actual charge circuit handles the PWM input
differently from the way that the PXI must accept the input and to solve this problem, a
threshold in the charge circuit simulation model required modification.
An interesting control challenge was noted, diagnosed and addressed in the final phase of
the HIL battery control testing. The behaviour in Figure 61 was observed once all of the
lower level controls issues were resolved. This oscillation was observed both during high
87
and low charge current requests from the controller. Oscilloscope probing ruled out the
possibility of signal transmission error.
Figure 61: Faulty integration method resulting in unstable control response
It was noted that the integrator term was causing unintended operation in the PI control.
The integral gain was ramped significantly when the set point and control values were
actually relatively close. Hand calculations confirmed that the integral error term was
being calculated erroneously. Upon analyzing the controller code, it was noted that the
Simulink-native integrator block was selecting an integration time step of 1 second,
although the input values were being updated every 10 ms. The 100 samples were being
averaged together in the integrator block and its response was updating far too slowly,
creating an unstable control response. To solve this problem and to yield the proper
control response seen in Figure 62, a custom integration term calculation needed to be
written.
88
Figure 62: Expected charge circuit function. Charging the battery is interrupted periodically for 1
minute intervals to measure the battery state of charge
The NiMH charge control was validated and appropriately tuned, using the hardware-inthe-loop simulation system. The iterative approach taken not only saved vehicle down
time due to 12V system troubleshooting, but also mitigated the risk of component
damage by identifying and correcting unstable control logic.
4.5 Offline Development
4.5.1 Bluetooth Controller Area Network Development
To design the Bluetooth interface, Research In Motion (RIM) proprietary Java
Development Environment (JDE) software was used to write an application for the
Blackberry™ wireless device that was targeted for use on the vehicle during the
competition. The HIL simulation system was used as a source of wireless controller area
89
network (CAN) messages with identical timing and data payloads as would be
transmitted by the vehicle CAN bus. The validation was performed in the following way:
1. „BT_CAN01‟ model was configured in Simulation Interface Toolkit to define
specific out ports as CAN message signals on CAN bus 1;
2. This model was run in real-time on the PXI. The Kvaser CAN bus monitor was
used to ensure that the CAN message timing and payload was as expected on
CAN 1;
3. The CANVIEW-Bluetooth hardware was connected to that data bus and properly
terminated. The hardware was then configured remotely using a Bluetooth
connection from the host computer;
4. The host computer was then used as a Bluetooth CAN message receiver by using
the HyperTerminal application. This was done to provide an idea of exactly what
data packets were being transmitted wirelessly over Bluetooth. The result of this
recording is shown in Figure 63; and,
5. The recorded CAN message transmission was then used to parse the Java code to
accept and read the desired CAN messages to be written onto the API screen.
Expected CAN message
Figure 63: Recorded Bluetooth™ raw data with expected CAN message circled
90
The Java code for the Bluetooth interface can be found in Appendix F. The resulting
Blackberry CAN interface is shown in Figure 64 and was a major consumer acceptability
feature of the vehicle during the competition as well as being extremely useful for
monitoring the battery state of charge (SOC) during a period of time that the GM CAN
network was being repaired on the vehicle, but the battery still required charging. The
only exact way to monitor the battery SOC was to use the RIM Blackberry™ loaded with
the monitoring software.
0
0
kph
Fuel cell power
330
Battery
Voltage
Figure 64: Bluetooth CAN message receiver on the Blackberry™ device
91
0
SOC
4.5.2 Graphical User Interface Development
To develop the graphical user interface (GUI) on the HIL simulation system, several
development phases were undertaken to overcome the challenge of integrating a touch
panel designed for stationary panel application into a vehicle. The main development
work is outlined below:
1. The TPC-2006 has a relatively low screen resolution and colour density as
shipped. National Instruments provides an online upgrade routine that upgrades
the screen quality. This was implemented immediately upon power-up;
2. To have an application start upon power-up, a specific protocol for file location
and WinCE configuration must be undertaken. The file must be located in the
„start‟ folder, or else the TPCConfig utility must be used to define startup files.
The GUI virtual instrument file was configured to be loaded upon startup of the
system; and,
3. To use the TPC RS-485 interface port, NI-VISA drivers must be loaded to the
TPC. This would normally need to occur each time the TPC is restarted, but a
*.cab file was provided by National Instruments that was used to ensure that the
VISA drivers were permanently installed.
This procedure allowed the TPC to perform its basic display and communication
functions. In order to interface the GUI to the hardware-in-the-loop simulation system, a
120 ohm termination resistor was integrated into the 2-wire RS-485 port connection from
the controller to the GUI. The signal quality and transmission rate was then observed
using an oscilloscope. An abnormal amount of noise in the communication line required
a rewiring effort to replace the wound unshielded wire with a twisted shielded pair with
the shielding grounded, which resulted in a marked improvement in signal quality.
Although the signal quality was improved, when the GUI communication VI was run and
the controller was broadcasting a serial communication signal, the received message was
unexpected and appeared to be random. A work-around strategy was devised to decode
92
the signal. Broadcasting specific characters on the Mototron resulted in predictable
received characters on the GUI, according to Table 27.
Table 27: Predictable characters from the Mototron received by the GUI
Mototron sends
Corresponds to
LabVIEW receives
5
Park
}
25
Reverse
s
51
Drive
f
50
Neutral
3
27
Tow
r
41
GFI
k
An expected character was received, however the messages contained a significant
amount of additional data that was not required, thereby requiring a parsing mechanism
to be conceived. The GUI code outlining this parsing mechanism can be found in
Appendix C.
The GUI display parameters selected for the year three competition vehicle were the gear
selection position and the ground fault warning. The screen shot in Figure 65 shows the
actual screen that is displayed to the user. The tab control on the top of the screen allows
vehicle parameters to be added such as instantaneous fuel economy in future functionality
expansion.
Figure 65: TPC-2006 touch screen with custom UWAFT interface 41
93
Chapter 5: Conclusions and Recommendations
This thesis describes how model-based control validation and development parallelized
work flow for the ChallengeX fuel cell hybrid Equinox project using a custom hardwarein-the-loop and software-in-the-loop simulation system. The ability to simulate a vehicle
in real-time allows control strategy and hardware development to take place during the
winter months when it is not feasible to perform on-road trials. An additional benefit is
that the set-up and execution times for running virtual controls tests are much shorter than
running in-vehicle tests. Virtual control development therefore allows more testing and
validation to be done in a short period. Most importantly, testing control algorithms on
systems that are expensive and potentially hazardous (high voltage) can be performed in
a virtual environment with confidence that no damage to personnel or equipment will
result.
Software-in-the-loop (SIL) testing was first performed in order to validate the vehicle
models that were to be used for hardware-in-the-loop testing, as well as to evaluate the
performance of regenerative braking and torque control algorithms. Once confidence in
the models was established, hardware-in-the-loop (HIL) simulation was performed
validate code generation, signal and communication busses, controller robustness, and
fail-safe control operation. The virtual vehicle model was run on National Instruments
PXI real-time control hardware using LabVIEW simulation interface toolkit. The vehicle
models were exclusively built in Simulink™ and Stateflow™ and were most often
empirical models created from the extensive vehicle testing data. A results summary and
recommendation list is given for each of the control validations performed:
Signal bus validation determined that the HIL simulation system can simulate all
vehicle systems except for the DC/DC converter dynamics which requires a signal
lag of 1ms or less. Controller CAN communication was verified to occur within
1ms, and the maximum signal lag on the rest of the system is less than 20ms.
These results suggest that communication and signal lag will not pose a risk to
safe vehicle control. It is recommended for future work that the DC/DC control
94
code be tested independently so that the simulation speed can be brought under
1ms and valid results can be obtained.
CAN bus loading trials showed that at the typical vehicle CAN bus loads of 50%
utilization, the communication system will be stable. Communication failure
begins to occur at 90% bus load. It is recommended that CAN bus loading always
be observed when new code is implemented to ensure that bus loading never
approaches the 90% threshold.
By simulating the expected fuel cell fault messages, the controller was found to
handle the faults appropriately. The source of the fault message irregularity was
determined to be the fuel cell power module controller. It is recommended that
new fuel cell power module control code be loaded to ensure that fault messages
are appropriately handled.
Varying the controller supply voltage found that both controllers are able to
operate reliably at 18V, although their nominal input voltage should be 12V.
Voltage droop testing found that the rear controller ceases to function reliably at
5.73V and the front controller ceases to function reliably at 5.43V. In order to
maintain proper controller functionality and thus occupant safety, it is
recommended that appropriate shut-down procedures are implemented if the 12V
bus voltage drops below a threshold of 9 volts for an extended period.
Failure insertion trials identified serious shortcomings in the control code that
handles fail safe operation in the event of signal line faults. None of the targeted
signal lines responded in the expected manner and the throttle position sensor
control code was found to lack important rationality checking that is an even
lower level critical functionality than line fault handling. Control suggestions
were made to appropriately handle a wiring harness failure and to control the
throttle position switch redundancy in that section.
95
A CAN/Bluetooth wireless vehicle communication bus interface as well as a
touch-screen graphical user interface were developed off-line using the HIL
simulation system without requiring vehicle resources. It is recommended that
further functionality be implemented on the HIL stand such as driver recognition
and expanded telematics.
The regenerative braking and torque control strategies were debugged and a first
tuning was performed in an SIL virtual environment. Several potentially
dangerous code behaviours were identified and mitigated. The fidelity of the
model was determined and the success of the SIL control validation was
confirmed by on-road vehicle operating data. It is recommended that before any
new motor control code is implemented, a detailed virtual validation is performed
to avoid occupant safety risks.
Full hardware-in-the-loop control validation and tuning was performed on the
new 12V charging system before it was implemented. Vehicle performance
confirmed the success of the control tuning effort. It is recommended that the
control strategy be further optimized to ensure that charging/discharging occurs as
efficiently as possible.
At competition, the University of Waterloo Alternative Fuels Team entry successfully
completed all of the dynamic competition events, a feat that has not been accomplished
by any fuel cell vehicle entry in past advanced vehicle design competitions. The team
was awarded the following prizes directly related to this thesis work:
Best Traction Control
Lowest Regulated Tailpipe Emissions
Third Place, The Mathworks: Crossover to Model-Based Design
Second Place, National Instruments Most Innovative Use of Graphical System
Design
7th place overall out of the 17 teams competing in ChallengeX
96
The model-based control validation work accomplished for this thesis played a
significant role in the UWAFT team‟s success at competition and their successful
development of a fuel cell hybrid passenger vehicle. It expanded the ability to perform
accelerated controls development and identified safety concerns in the control systems
before the code was implemented in the vehicle. The methodologies outlined in this
thesis can be applied to future vehicle control strategy validation efforts. The concepts
and results are scalable, and may be used to guide control strategy design for other types
of hybrid and non-hybrid powertrains. In order to safely evaluate the effectiveness of a
vehicle‟s control strategy, virtual validation must be performed on its communication,
fail safe features, and control algorithms.
97
Chapter 6: References
1. Stern, Nicholas 2007. The Economics of Climate Change – The Stern Review
Cambridge, UK: Cambridge University Press. Also published online: http://www.hmtreasury.gov.uk/independent_reviews/stern_review_economics_climate_change/stern
_review_report.cfm
2. Alley, Richard; et al. 2007. Climate Change 2007: The Physical Science Basis Paris:
Summary for Policymakers, 10th session of working group I of the IPCC
3. Yap, David; Reid, Neville; De Brou, Gary; Bloxam, Robert. 2005. Transboundary
Air Pollution in Ontario Toronto: Ontario Ministry of Environment Report
4. Dunn, Seth. 2002. Hydrogen futures: towards a sustainable energy system
International Journal of Hydrogen Energy 27. 235-264
5. Fraser, Don. 2003. Solutions for Hydrogen Storage and Distribution Charlottetown:
PEI Wind-Hydrogen Symposium. Presented June 23-24.
6. Anonymous. 2001. Beyond the Internal Combustion American Methanol Institute:
Whitepaper. Published online
http://www.methanol.org/contentIndex.cfm?section=fuelCells&topic=specialReports
&title=Index
7. Carlson, Eric. 2005. PEM Fuel Cell Cost Status Palm Springs, USA: Fuel Cell
Seminar, November 14-18
8. Granovskii, Mikhail; Dincer, Ibrahim; Rosen, Marc A. 2006. Environmental and
economic aspects of hydrogen production and utilization in fuel cell vehicles Journal
of Power Sources. 157. 411-421
9. Carpenter, Andrew R.; Hinze, Peter C. 2004. System safety analysis of hydrogen and
methanol vehicle fuels Process Safety Progress 23. 292-299
10. Lovins, Amory B. 2005. Twenty Hydrogen Myths Boulder, Colorado: Rocky
Mountain Institute whitepaper published online
https://www.rmi.org/images/other/Energy/E03-05_20HydrogenMyths.pdf
11. Helena L. Chum, Ralph P. Overend. 2001. Biomass and renewable fuels Fuel
Processing Technology 71. 187-195
98
12. Anonymous. 2005 Worldwide look at oil reserves and production. Oil and Gas
Journal 103. 24-25
13. Anonymous 2007. World Solar Insulation Values Available online:
http://howto.altenergystore.com/Reference-Materials/Solar-Insolation-MapWorld/a43/
14. Granovskii, M. et al. 2006. Life cycle assessment of hydrogen fuel cell and gasoline
vehicles. International Journal of Hydrogen Energy 31. 337-352
15. Anonymous. 2005. Electric Vehicle History. Electric Automobile Association
Whitepaper available online: www.eaaev.org
16. Bandivadekar, Anup. 2007. Impact of Vehicle Performance-Fuel Consumption
Trade-off on Light-Duty Vehicle Fuel Use. Cambridge, MA: MIT Before the
Transition to a Hydrogen Economy working group meeting, June 3rd.
17. Ayers, C.M. et al. 2004. Evaluation of 2004 Toyota Prius Hybrid Electric Drive
System Interim Report. Oakridge, TN: Engineering Science and Technology Division
report. Available online: http://www.ornl.gov/~webworks/cppr/y2001/rpt/121813.pdf
18. Larminie, James; Dicks, Andrew. 2000. Fuel Cell Systems Explained. New York:
John Wiley and Sons
19. Anonymous. 2003. Fuel Cell Vehicle World Survey 2003-Specialty Vehicles. US
DOE Office of Energy Efficiency and Renewable Energy whitepaper. Available
online:
http://www1.eere.energy.gov/hydrogenandfuelcells/pdfs/specialty_vehicles.pdf
20. Walsh, Brian; Moores, Peter. 2002. Auto Companies On Fuel Cells. Fuel Cells 2000
Special Report. Available online: www.fuelcells.org/info/charts/vehiclestudy.pdf
21. Haak, David; 2004. Scale-Up of Carbon/Carbon Composite Bipolar Plates. DOE
Hydrogen Program FY2004 progress report. Available online:
http://www.hydrogen.energy.gov/annual_progress04.html
22. Brandon, N.P.; Brett, D.J. 2006. Engineering porous materials for fuel cell
applications. Philosophical Transactions of the Royal Society 364. 147-159
23. Wang, Q. et al. 2004. Functionally Graded Cathode Catalyst Layers for Polymer
Electrolyte Fuel Cells. Journal of The Electrochemical Society 151. A950-A957
99
24. Musil, David. 2006. Fuel Cells –Current Status and Prospects for the Future.
Burnaby, BC: Ballard Power Systems Working Group Presentation. Available online:
www.greenfleet.com.au/uploads/pdfs/DMF%20Presentation%20%20D%20Musil.pdf
25. Anonymous. 2004. HFP Prototype Data Sheet: Hy-Light. European Hydrogen and
Fuel Cell Technology Platform Datasheet. Available online:
www.event.hfpeurope.org/exhibition/specs/Michelin_-_Specs.pdf
26. Fathy, H. et al. 2006. Review of Hardware-in-the-Loop Simulation and Its Prospects
in the Automotive Area. Modeling and Simulation for Military Applications, edited
by Kevin Schum, Alex F. Sisti Proc. of SPIE. 6228. 1-20
27. Boot, R. et al. 1999. Automated Test of ECUs in a Hardware-in-the-Loop Simulation
Environment. Hawai‟i, USA: Proceedings of the 1999 EEE International Symposium
on Computer Aided Control System Design. 22-27
28. Köhl, S.; Jegminat, D. 2005. How to Do Hardware-in-the-Loop Simulation Right.
Detroit, MI: Proceedings of the 2005 SAE World Congress. 2005-01-1657.
29. Hagiwaraa, K.; Terayamab,T.; Takedaa,Y. Yodab,K. Suzukia, S. 2002. Development
of automatic transmission control system using hardware-in-the-loop simulation
system. JSAE Review 23. 55-59
30. Lee, Jae-Cheon.; Suh, Myung-Won. Hardware-in-the Loop Simulator for ABS/TCS.
Hawai‟i, USA: Proceedings of the 1999 EEE International Symposium on Computer
Aided Control System Design. 652-657
31. Cho, J.M.; et al. 2001. Design and Implementation of HILS system for ABS ECU of
commercial vehicles. Pusan, Korea: IEEE transactions 0-7803-7090-2/01
32. Leaphart, Eldon G.; Muldoon, Steve E.; Irlbeck, Jill N. 2006. Application of Robust
Engineering Methods to Improve ECU Software Testing. Proceedings of 2006 SAE
World Congress, Detroit, Michigan, April 3-6
33. Jehlick, Forrest. 2007. ChallengeX Competition Rules. Argonne National Laboratory,
Advanced Vehicle Technology Competition Document
34. Mendes, Chris. 2006. Fuel Cell Mounting Waiver. University of Waterloo Alternative
Fuels Team ChallengeX Competition Document.
100
35. Stevens, Matt.; et al. 2006. University of Waterloo ChallengeX Spring Technical
Report. University of Waterloo Alternative Fuels Team ChallengeX Competition
Document.
36. Lawerence, Christopher. 2007. Improving Fuel Economy Via Management of
Electrical Loads in Fuel Cell Electric Vehicles. Waterloo, Ontario: Masters Thesis,
University of Waterloo
37. Kopic, Peter. 2006. Fuel System Installation and Operation Manual. Enviromech
Industries Fuel System Service Manual
38. Kopic, Peter. 2006. Engineering Analysis Summary: Cylinder Mounting Structure,
GM Equinox. Enviromech Industries Fuel System Service Manual.
39. Anonymous. 2005. HyPM 65: Fuel Cell Power Module. Mississauga, Ontario:
Hydrogenics Fuel Cell Operating Manual
40. Anonymous. 2006. LabVIEW Real-Time Architecture and Good Programming
Practices. National Instruments LabVIEW Developers Zone. Available online:
http://zone.ni.com/devzone/cda/tut/p/id/2833
41. Anonymous. 2006. Benchmarking a Typical Control Application using LabVIEW
Real-Time & NI-DAQmx. National Instruments LabVIEW Developers Zone.
Available online: http://zone.ni.com/devzone/cda/tut/p/id/5424
42. Ender, Tom. 2007. Email correspondence on April 16th, 2007.
43. Stevens, Matthew; Wahlstrom, Michael. 2007. Control Strategy Presentation.
Milford, MI: ChallengeX Competition Presentation Session. June 6th, 2007.
44. Mali, Taylor, J. Youth Outreach Presentation. Internal UWAFT outreach
presentation.
45. Conrad, Mirko. 2005. Automatic Evaluation of ECU Software Tests. Proceedings of
2005 SAE World Congress, Detroit, Michigan, April 11-14. 2005-01-1659
46. Lang, Oliver; Kindl, Helmut. 2005. Development of Fuel Cell System Air
Management Utilizing HIL Tools. Proceedings of 2002 SAE World Congress,
Detroit, Michigan, March 4-7. 2002-01-0409
47. Cardanha, Tim. 2005. Validating Powertrain Controller Systems With the VPACSHIL Powertrain Simulator. Proceedings of 2005 SAE World Congress, Detroit,
Michigan, April 11-14. 2005-01-1663
101
48. Pasquier, Maxime; Monnet, Gilles. 2006. Diesel Hybridization and Emissions: A
Report to DOE from the ANL Vehicle Systems and Fuels Team. Government report:
For the U.S. Department of Energy Office of Advanced Automotive Technologies.
49. Akers, Andrew. 2006. Electronic Service Request. National Instruments technical
support representative discussion.
50. Huizing, Ryan. 2006. Engineering Analysis of Fuel Cell Air Delivery. Coursework
performed for the Alternative Fuels Team.
51. Adams, Robert. 2005. Hydrogen Test Cell Safety Upgrade Report. Marathon
Technical Services Commissioned Report. University of Waterloo Alternative Fuels
Team.
102
Appendices
Appendix A: Hardware Data Sheets
MOSFET on HIL simulator: Supplier provided data sheet
NI-PXI 8187 real time controller: www.ni.com
103
PXI 6229 Low cost M-series DAQ: www.ni.com
PXI 6259 High speed M-series DAQ
NI PXI 6289 High accuracy M-series DAQ: www.ni.com
104
Appendix B: HIL Simulator wiring and Controller CAN
File name: HIL_IOandCAN_140407. 2 pages long, 3 pages wide.
105
106
107
108
109
110
Appendix C: Simulation Interface Toolkit Code
Figure C1: Host VI
Figure C2: SIT CAN initialize VI – note setting baud rate to 500 kbps.
111
Figure C3: SIT CAN driver VI – note base rate subVI where all IO actions take place
Figure C4: SIT DAQ initialize channel VI – note that even for only performing AO
operation AI is defined
112
Appendix D: Real Time Workshop Code
Figure D1: PXI HCS test code – note the signal probe for the NI .dll compiler
Figure D2: Drive cycle input- speed in m/s into a repeating sequence block. Stop
simulation when one sequence has been completed
113
Figure D3: Dynamic plant model – note simdriveline based dynamic performance
Figure D4: Motor plant model – note motor diagnostics and efficiency/torque inputs
114
Appendix E: Java code for Blackberry Interface
Filip Spacek 2007. Original Java code written in JDE.
package com.rim.samples.device.bluetoothsample;
import net.rim.device.api.bluetooth.*;
import net.rim.device.api.system.*;
import net.rim.device.api.util.*;
import net.rim.device.api.ui.container.*;
import net.rim.device.api.ui.*;
import net.rim.device.api.ui.component.*;
import java.io.*;
import java.util.*;
public class CANBluetoothGUI extends UiApplication //implements TrackwheelListener
{
private BluetoothSerialPortInfo[] m_portInfo;
private MainScreen m_portScreen;
private MenuItem m_closeItem;
private CANConnection m_can;
private LabelField m_debug;
public static void main(String[] args)
{
CANBluetoothGUI app = new CANBluetoothGUI();
app.enterEventDispatcher();
}
private CANBluetoothGUI()
{
String menuTitle;
m_portScreen = new MainScreen();
m_portScreen.setTitle(new LabelField("CAN Bluetooth, yes we can."));
if (BluetoothSerialPort.isSupported()) {
m_portInfo = BluetoothSerialPort.getSerialPortInfo();
for (int i = 0; i < m_portInfo.length; ++i) {
m_portScreen.add(new ButtonField(m_portInfo[i].getDeviceName()) {
public boolean trackwheelClick(int status, int time) {
openConnection(getLabel());
return true;
}
});
}
}
115
else {
final String[] names = { "FOO", "BAR" };
for (int i = 0; i < 2; ++i) {
m_portScreen.add(new ButtonField(names[i]) {
public boolean trackwheelClick(int status, int time) {
//System.out.println("clicked");
openConnection("bogus");
return true;
}
});
}
}
m_closeItem = new MenuItem("Close", 200000, 10) {
public void run() {
System.exit(0);
}
};
pushScreen(m_portScreen);
}
protected void makeMenu(Menu menu, int instance)
{
menu.add(m_closeItem.toString(), m_closeItem, Menu.UNDEFINED);
}
protected void openConnection(String uri) {
BluetoothSerialPortInfo port = null;
for (int i = 0; i < m_portInfo.length; ++i) {
if (m_portInfo[i].getDeviceName().equals(uri)) {
port = m_portInfo[i];
break;
}
}
m_can = new CANConnection(port);
}
static class AwesomoGauge extends Field implements DrawStyle {
private static final int WIDTH = 320;//120;
private static final int HEIGHT = 30;//80;
private String m_label;
public int m_value;
public int m_id;
public AwesomoGauge(String label, int id) {
116
m_label = label;
m_id = id;
}
public int getPreferredWidth() {
return WIDTH;
}
public int getPreferredHeight() {
return HEIGHT;
}
protected void layout(int width, int height) {
width = Math.min( width, getPreferredWidth() );
height = Math.min( height, getPreferredHeight() );
setExtent( width, height );
}
protected void paint(Graphics graphics) {
//graphics.drawArc(0, 0, getWidth(), getHeight(), 0, 360);
//graphics.drawRect(0, 0, getWidth(), getHeight());
graphics.drawText(m_label + " " + Integer.toString(m_id) + " " +
Integer.toString(m_value), 10, 10);
}
}
class CANConnection implements BluetoothSerialPortListener
{
private BluetoothSerialPort m_port;
private String m_deviceName;
private MainScreen m_gaugesScreen;
private FlowFieldManager m_gaugesManager;
private Vector m_gauges;
public CANConnection(BluetoothSerialPortInfo info)
{
try {
m_port = new BluetoothSerialPort(info, BluetoothSerialPort.BAUD_115200,
BluetoothSerialPort.DATA_FORMAT_PARITY_NONE | BluetoothSerialPort.DATA_FORMAT_STOP_BITS_1 |
BluetoothSerialPort.DATA_FORMAT_DATA_BITS_8, BluetoothSerialPort.FLOW_CONTROL_NONE, 1024, 1024, this);
m_deviceName = info.getDeviceName();
}
catch(IOException ex) {
Status.show("Error: " + ex.getMessage());
}
m_gaugesScreen = new MainScreen() {
protected void makeMenu(Menu menu, int instance) {
menu.add(m_closeItem.toString(), m_closeItem, Menu.UNDEFINED);
117
}
};
m_gauges = new Vector();
m_gaugesScreen.setTitle(new LabelField(info.getDeviceName()));
m_gaugesManager = new FlowFieldManager();
m_gaugesScreen.add(m_gaugesManager);
pushScreen(m_gaugesScreen);
Runnable refreshGauges = new Runnable() {
public void run() {
m_gaugesManager.invalidate();
}
};
invokeLater(refreshGauges, 20, true);
}
public void deviceConnected(boolean success)
{
if (success)
Status.show("YES");
else
Status.show("NO");
}
public void deviceDisconnected()
{
Status.show("Disconnected from " + m_deviceName);
}
public void dtrStateChange(boolean high)
{
Status.show("DTR: " + high);
}
private static final int NO_SYNC_YET = 0;
private static final int SAW_SYNC = 1;
private static final int READING_DATA = 2;
private static final int READING_CHECKSUM = 3;
private static final int READING_EOF = 4;
private int m_state;
private int m_rawPos;
private byte[] m_raw;
public void dataReceived(int length)
{
118
try {
for (int i = 0; i < length; ++i) {
int data = m_port.read();
switch (m_state) {
case NO_SYNC_YET:
if (data == 0x43) {
m_state = SAW_SYNC;
}
break;
case SAW_SYNC:
m_raw = new byte[data];
m_rawPos = 0;
m_state = READING_DATA;
break;
case READING_DATA:
m_raw[m_rawPos] = (byte)data;
++m_rawPos;
if (m_rawPos >= m_raw.length) {
parseMessage();
m_state = READING_CHECKSUM;
}
break;
case READING_CHECKSUM:
m_state = READING_EOF;
break;
case READING_EOF:
m_state = NO_SYNC_YET;
break;
}
}
} catch(IOException ioex) {
//Catch and re-throw the exception.
throw new RuntimeException(ioex.toString());
}
}
void parseMessage()
{
if (m_raw[0] != 0x01) {
Status.show("Unknown message type " + Integer.toString(m_raw[0], 16));
return;
}
int id = (m_raw[1] << 8) | m_raw[2];
//Status.show("ID " + Integer.toString(id, 16));
AwesomoGauge gauge = null;
for (int i = 0; i < m_gauges.size(); ++i) {
119
AwesomoGauge ith_gauge = (AwesomoGauge)m_gauges.elementAt(i);
if (ith_gauge.m_id == id) {
gauge = ith_gauge;
}
}
if (gauge == null) {
gauge = new AwesomoGauge("Gauge ", id);
m_gauges.addElement(gauge);
synchronized (getEventLock()) {
m_gaugesManager.add(gauge);
}
}
gauge.m_value = m_raw[4];
}
public void dataSent()
{
}
}
}
120
Appendix F: Expanded Pictures
F1: Equal length fuel cell air feed results in 1:1 distribution
F2: Actual implemented fuel cell air feed results in 1:0.82 distribution
121
F3: Imposed constriction in air feed results in 1:0.69 distribution
122
ECU555-80
PXI pinout SB-68
ECU565-128
Machine-time output
Interface pad
Smartcraft CAN hub
PXI Real-time controller
© Erik Wilhelm 2007
F4: Hardware in the loop simulation system
123
Power supply (5, 15, 24V)
Appendix G: Scientific contributions
Refereed Publications
Wilhelm, E., Fowler, M. 2006. “A Technical and Economic Review of Solar Hydrogen
Production Technologies”. Bulletin of Science Technology and Society. Vol. 26, No. 1,
278-287
Non-refereed Publications
E. Wilhelm, M. Wahlstrom, M.B. Stevens, C. Mendes, C. Lawrence, D. Sellan, C.
Haliburton, Dr. M.W. Fowler, Dr. R.A. Fraser. 2007 “Implementation and Optimization
of a Fuel Cell Hybrid Powertrain” SAE World Congress 2007. 07PFL-748.
T.J. Mali, J. Marshall, M.B. Stevens, C. Mendes, D.M. Shilling, K. Tong, E. Wilhelm, S.
Beckermann, R.A. Fraser, M.W. Fowler 2006. “Fuel Cell Hybrid Powertrain Design
Approach for a 2005 Chevrolet Equinox” SAE World Congress 2006. 2006-01-0744
Selected Presentations
Wilhelm, E., Fowler, M.W. 2007. “A Hardware-in-the-loop Simulation System for Fuel
Cell Vehicle Control” Graduate Studies Research Conference, University of Waterloo.
April 28th, 2007.
Wilhelm,E., Stevens, M. Mendes,C. Wahlstrom, M. Sellan, D. Marshall, J. Fowler, M.
Fraser, R. 2006.„Design Review of a Fuel Cell Hybrid Vehicle for the ChallengeX
competition” Conference Proceedings: 2nd International Green Energy Conference.
IGEC2-129
124