1
®
Fluke 125
Industrial ScopeMeter
Users Manual
GB
Jan 2007, rev.1, 08/07
© 2007 Fluke Corporation. All rights reserved.
All product names are trademarks of their respective companies.
LIMITED WARRANTY & LIMITATION OF LIABILITY
Each Fluke product is warranted to be free from defects in material and workmanship under normal use and service. The warranty period is three years for the
Fluke 120 Series Test Tool and one year for its accessories. The warranty period begins on the date of shipment. Parts, product repairs and services are
warranted for 90 days. This warranty extends only to the original buyer or end-user customer of a Fluke authorized reseller, and does not apply to fuses,
disposable batteries or to any product which, in Fluke's opinion, has been misused, altered, neglected or damaged by accident or abnormal conditions of
operation or handling. Fluke warrants that software will operate substantially in accordance with its functional specifications for 90 days and that it has been
properly recorded on non-defective media. Fluke does not warrant that software will be error free or operate without interruption.
Fluke authorized resellers shall extend this warranty on new and unused products to end-user customers only but have no authority to extend a greater or different
warranty on behalf of Fluke. Warranty support is available if product is purchased through a Fluke authorized sales outlet or Buyer has paid the applicable
international price. Fluke reserves the right to invoice Buyer for importation costs of repair/replacement parts when product purchased in one country is submitted for
repair in another country.
Fluke's warranty obligation is limited, at Fluke's option, to refund of the purchase price, free of charge repair, or replacement of a defective product which is returned to
a Fluke authorized service center within the warranty period.
To obtain warranty service, contact your nearest Fluke authorized service center or send the product, with a description of the difficulty, postage and insurance
prepaid (FOB Destination), to the nearest Fluke authorized service center. Fluke assumes no risk for damage in transit. Following warranty repair, the product will be
returned to Buyer, transportation prepaid (FOB Destination). If Fluke determines that the failure was caused by misuse, alteration, accident or abnormal condition of
operation or handling, Fluke will provide an estimate of repair costs and obtain authorization before commencing the work. Following repair, the product will be
returned to the Buyer transportation prepaid and the Buyer will be billed for the repair and return transportation charges (FOB Shipping Point).
THIS WARRANTY IS BUYER'S SOLE AND EXCLUSIVE REMEDY AND IS IN LIEU OF ALL OTHER WARRANTIES, EXPRESS OR IMPLIED, INCLUDING BUT
NOT LIMITED TO ANY IMPLIED WARRANTY OF MERCHANTABILITY OR FITNESS FOR A PARTICULAR PURPOSE. FLUKE SHALL NOT BE LIABLE FOR ANY
SPECIAL, INDIRECT, INCIDENTAL OR CONSEQUENTIAL DAMAGES OR LOSSES, INCLUDING LOSS OF DATA, WHETHER ARISING FROM BREACH OF
WARRANTY OR BASED ON CONTRACT, TORT, RELIANCE OR ANY OTHER THEORY.
Since some countries or states do not allow limitation of the term of an implied warranty, or exclusion or limitation of incidental or consequential damages, the
limitations and exclusions of this warranty may not apply to every buyer. If any provision of this Warranty is held invalid or unenforceable by a court of competent
jurisdiction, such holding will not affect the validity or enforceability of any other provision.
Fluke Corporation, P.O. Box 9090, Everett, WA 98206-9090 USA, or
Fluke Industrial B.V., P.O. Box 90, 7600 AB, Almelo, The Netherlands
SERVICE CENTERS
To locate an authorized service center, visit us on the World Wide Web:
http://www.fluke.com
or call Fluke using any of the phone numbers listed below:
+1-888-993-5853 in U.S.A. and Canada
+31-402-675-200 in Europe
+1-425-446-5500 from other countries
Table of Contents
Chapter
Title
Page
Declaration of Conformity.............................................................................................. 0-1
Unpacking the Test Tool Kit .......................................................................................... 0-2
Safely Using the Test Tool ............................................................................................ 0-4
1
General Operating Instructions .................................................................................. 1-1
Introduction ...................................................................................................................
Preparations for Use .....................................................................................................
Powering the Test Tool .................................................................................................
Resetting the Test Tool .................................................................................................
Changing Backlight .......................................................................................................
Changing Contrast ........................................................................................................
Making Selections in a Menu.........................................................................................
Looking at the Measurement Connections ....................................................................
Input A .....................................................................................................................
Input B .....................................................................................................................
i
1-1
1-1
1-1
1-2
1-3
1-3
1-4
1-5
1-5
1-5
Fluke 125
Users Manual
COM ........................................................................................................................ 1-5
Measurement Probes & Settings................................................................................... 1-6
2
Scope/Meter Mode ....................................................................................................... 2-1
Introduction ...................................................................................................................
Selecting the Scope/Meter Mode ..................................................................................
Reading the Screen ......................................................................................................
Displaying an Unknown Signal with Connect-and-View™ (Auto Set)............................
Making Measurements..................................................................................................
Connecting the Inputs..............................................................................................
Voltage measurements ......................................................................................
Ohm (Ω), continuity, diode, and capacitance measurements.............................
Current measurements ......................................................................................
Temperature measurements..............................................................................
Power measurements ........................................................................................
Selecting a measurement function. ...............................................................................
Freezing the Screen......................................................................................................
Holding a Stable Reading..............................................................................................
Making Relative Measurements ....................................................................................
Selecting Auto/Manual Ranges .....................................................................................
Changing the Graphic Representation on the Screen ...................................................
Changing the Amplitude ..........................................................................................
Changing the Time Base .........................................................................................
Positioning the Waveform on the Screen ................................................................
Smoothing Waveforms and Readings .....................................................................
Displaying the Envelope of a Waveform ..................................................................
ii
2-1
2-1
2-2
2-3
2-4
2-4
2-4
2-4
2-4
2-4
2-4
2-6
2-8
2-8
2-9
2-10
2-10
2-10
2-10
2-11
2-12
2-13
Contents (continued)
Acquiring the Waveform ..........................................................................................
Making a Single Acquisition ...............................................................................
Recording Slow Signals over a Long Period of Time .........................................
Selecting AC-Coupling .......................................................................................
Reversing the Polarity of the Displayed Waveform ............................................
Triggering on a Waveform.............................................................................................
Setting Trigger Level and Slope...............................................................................
Selecting the Trigger Parameters ............................................................................
Isolated Triggering ...................................................................................................
Triggering on Video Signals.....................................................................................
Triggering on a Specific Video Line .........................................................................
Making Cursor Measurements ......................................................................................
Using Horizontal Cursors on a Waveform................................................................
Using Vertical Cursors on a Waveform....................................................................
Using the 10:1 Probe for High Frequency Measurements.............................................
Probe Attenuation. ...................................................................................................
Probe Adjustment. ...................................................................................................
3
Harmonics .................................................................................................................... 3-1
Introduction ...................................................................................................................
Measuring Harmonics ...................................................................................................
Performing Harmonics Measurements ....................................................................
Zooming Harmonics.................................................................................................
Using Cursors ..........................................................................................................
Reading the Harmonics Screen ...............................................................................
4
2-14
2-14
2-15
2-16
2-16
2-17
2-17
2-18
2-19
2-20
2-21
2-22
2-22
2-23
2-25
2-25
2-25
3-1
3-1
3-2
3-4
3-4
3-5
Field Bus Measurements............................................................................................. 4-1
Introduction ................................................................................................................... 4-1
Performing Fieldbus Measurements.............................................................................. 4-2
iii
Fluke 125
Users Manual
Reading the Screen ......................................................................................................
Viewing the Bus Waveform Screen...............................................................................
Setting the Test Limits...................................................................................................
Saving and Recalling Test Limits ..................................................................................
5
TM
Plotting Measurements over Time (TrendPlot ) ...................................................... 5-1
Introduction ...................................................................................................................
Starting/Stopping a TrendPlotTM ..................................................................................
Changing the TrendPlot Reading ..................................................................................
Making TrendPlot Cursor Measurements......................................................................
6
4-4
4-7
4-8
4-32
5-1
5-1
5-3
5-3
Saving and Recalling Data Sets ................................................................................. 6-1
Introduction ................................................................................................................... 6-1
Saving Data Sets .......................................................................................................... 6-1
Recalling, Renaming, Deleting Data Sets ..................................................................... 6-3
7
Using a Printer and FlukeView ................................................................................... 7-1
Introduction ................................................................................................................... 7-1
Using a Printer .............................................................................................................. 7-1
Using FlukeView® Software.......................................................................................... 7-3
8
Maintaining the Test Tool ........................................................................................... 8-1
Introduction ...................................................................................................................
Cleaning the Test Tool ..................................................................................................
Storing the Test Tool.....................................................................................................
Charging the Rechargeable Battery Pack .....................................................................
iv
8-1
8-1
8-1
8-2
Contents (continued)
Keeping Batteries in Optimal Condition.........................................................................
Replacing and Disposing of the Rechargeable Battery Pack ........................................
Using and Adjusting 10:1 Scope Probes .......................................................................
Calibration Information ..................................................................................................
Parts and Accessories...................................................................................................
Service Manual ........................................................................................................
Standard Accessories..............................................................................................
Optional Accessories ...............................................................................................
9
Tips and Troubleshooting........................................................................................... 9-1
Introduction ...................................................................................................................
Using the Tilt Stand .......................................................................................................
Changing the Information Language .............................................................................
Setting the Grid Display.................................................................................................
Changing Date and Time ..............................................................................................
Saving Battery Life ........................................................................................................
Setting the Power Down Timer ................................................................................
Changing the Auto Set Options .....................................................................................
Using Proper Grounding................................................................................................
Solving Printing and Other Communication Errors ........................................................
Battery Testing of Fluke Accessories ............................................................................
10
8-3
8-4
8-5
8-7
8-7
8-7
8-7
8-10
9-1
9-1
9-2
9-2
9-3
9-4
9-4
9-5
9-6
9-7
9-7
Specifications .............................................................................................................. 10-1
Introduction ...................................................................................................................
Dual Input Oscilloscope.................................................................................................
Vertical.....................................................................................................................
Horizontal ................................................................................................................
Trigger .....................................................................................................................
Advanced Scope Functions .....................................................................................
v
10-1
10-2
10-2
10-3
10-3
10-4
Fluke 125
Users Manual
Dual Input Meter............................................................................................................
Input A and Input B..................................................................................................
Input A .....................................................................................................................
Advanced Meter Functions......................................................................................
Cursor readout ..............................................................................................................
Harmonics Measurements ............................................................................................
Field Bus Measurements ..............................................................................................
Miscellaneous ...............................................................................................................
Environmental ...............................................................................................................
Safety.......................................................................................................................
vi
10-4
10-4
10-7
10-8
10-8
10-9
10-9
10-10
10-11
10-11
Declaration of Conformity
Declaration of Conformity
for
Fluke 125
ScopeMeter® test tool
Manufacturer
Fluke Industrial B.V.
Lelyweg 14
7602 EA Almelo
The Netherlands
Statement of Conformity
Based on test results using appropriate standards,
the product is in conformity with
Electromagnetic Compatibility Directive 89/336/EEC
Low Voltage Directive 2006/95/EC
Sample tests
Standards used:
EN 61010-1: 2001
Safety Requirements for Electrical Equipment for
Measurement, Control, and Laboratory Use
EN 50081-1 (1992)
Electromagnetic Compatibility.
Generic Emission Standard:
EN55022 and EN60555-2
EN 50082-2 (1992)
Electromagnetic Compatibility.
Generic Immunity Standard:
IEC1000-4 -2, -3, -4, -5
The tests have been performed in a
typical configuration.
This Conformity is indicated by the symbol
i.e. “Conformité Européenne”.
,
0-1
Fluke 125
Users Manual
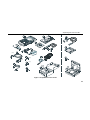
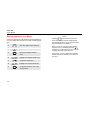
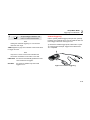
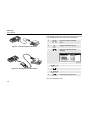
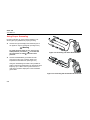
Unpacking the Test Tool Kit
The following items are included in your test tool kit. (see
Figure 1.):
#
Description
1
Fluke Test Tool
2
Rechargeable NiMH Battery Pack
3
Power Adapter/Battery Charger
4
Shielded Test Leads with Black Ground Leads
5
Test Lead Black (for Grounding)
6
Hook Clips (red, gray)
7
Alligator Clips (red, gray, black)
8
Banana-to-BNC Adapters (black)
9
Getting Started Manual (this book)
10
CD-ROM with Users Manuals
11
10:1 Voltage Probe
12
Current Clamp
13
Shipment Box
14
Optically Isolated RS-232/USB Adapter/Cable
15
FlukeView® ScopeMeter® Software for Windows®
16
Hard Carrying Case
0-2
Note
When new, the rechargeable battery pack is not
fully charged. See Chapter 2.
Fluke 125
Model 125
•
•
•
•
•
•
• (1x)
•
•
•
•
•
Fluke 125/S
Model 125
•
•
•
•
•
•
• (2x)
•
•
•
•
•
•
•
Unpacking the Test Tool Kit
1
9
14
10
2
3
(2x)
15
4
6
5
11
7
8
(2x)
12
8
(3x)
13
16
Figure 1. ScopeMeter Test Tool Kit
0-3
Fluke 125
Users Manual
Safely Using the Test Tool
Attention
Carefully read the following safety
information before using the test tool.
Safety Precautions
Specific warning and caution statements, where they
apply, will be found throughout the manual.
A Caution identifies conditions and actions that may
damage the test tool.
A Warning identifies conditions and actions that pose
hazard(s) to the user.
Symbols used on the test tool and in this manual are
explained in the next table.
Warning
To avoid electrical shock, use only Fluke power
supply, Model PM8907 (Power Adapter/Battery
Charger).
0-4
See explanation in
manual
Equal potential inputs
Disposal information
Earth
Recycling information
Conformité
Européenne
Double Insulation
(Protection Class)
Conforms to
applicable Canadian
and US standards
Do no dispose of this product as unsorted municipal
waste. Go to Fluke's website for recycling information.
Warning
Should this test tool be used with AC coupling
selected, or manual operation of amplitude or time
base ranges, the measuring results displayed on
the screen may not be representative of the total
signal. This can result in the presence of
dangerous voltages of more than 42V peak (30V
rms), not being detected. To guarantee user safety,
all signals should first be measured with DC
coupling selected and in fully automatic mode.
This ensures that the full signal content is
measured.
Safely Using the Test Tool
Warning
To avoid electrical shock or fire:
• Use only the power supply, Model PM8907
(Battery Charger / Power Adapter).
• Before use check that the selected/indicated
voltage range on the PM8907 matches the
local line power voltage and frequency.
• For the PM8907/808 universal Battery
Charger/Power Adapter use only line cords
that comply with the local safety regulations.
Note
To accommodate connection to various line
power sockets, the PM8907/808 universal
Battery Charger / Power Adapter is equipped with
a male plug that must be connected to a line cord
appropriate for local use. Since the adapter is
isolated, the line cord does not need to be
equipped with a terminal for connection to
protective ground. Since line cords with a
protective grounding terminal are more commonly
available you might consider using these anyhow.
Warning
To avoid electrical shock or fire if a Test Tool
input is connected to more than 42 V peak (30
Vrms) or on circuits of more than 4800 VA:
• Use only insulated voltage probes, test leads
and adapters supplied with the Test Tool, or
indicated as suitable for the Fluke 125 Test
Tool.
• Before use, inspect voltage probes, test leads
and accessories for mechanical damage and
replace when damaged.
• Remove all probes, test leads and
accessories that are not in use.
• Always connect the battery charger first to
the ac outlet before connecting it to the Test
Tool.
• Do not apply input voltages above the rating
of the instrument. Use caution when using
1:1 test leads because the probe tip voltage
will be directly transmitted to the Test Tool.
• Do not use exposed metal BNC or banana
plug connectors.
• Do not insert metal objects into connectors.
• Always use the Test Tool only in the manner
specified.
0-5
Fluke 125
Users Manual
Max. Input Voltages
Input A and B directly................................600 V CAT III
Input A and B via BB120...........................300 V CAT III
Input A and B via STL120 .........................600 V CAT III
Max. Floating Voltage
From any terminal to ground .....................600 V CAT III
Voltage ratings are given as “working voltage”. They
should be read as Vac-rms (50-60 Hz) for AC sine
wave applications and as Vdc for DC applications.
Measurement Category III refers to distribution level and
fixed installation circuits inside a building.
The terms ‘Isolated’ or ‘Electrically floating’ are used in this
manual to indicate a measurement in which the Test
Tool’s Shielded Banana inputs or banana jack is
connected to a voltage different from earth ground.
The isolated input connectors have no exposed metal and
are fully insulated to protect against electrical shock.
0-6
If Safety Features are Impaired
Use of the Test Tool in a manner not specified may
impair the protection provided by the equipment.
Before use, inspect the test leads for mechanical damage
and replace damaged test leads!
Whenever it is likely that safety has been impaired, the
Test Tool must be turned off and disconnected from the
line power. The matter should then be referred to qualified
personnel. Safety is likely to be impaired if, for example,
the Test Tool fails to perform the intended measurements
or shows visible damage.
Chapter 1
General Operating Instructions
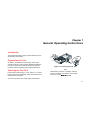
Introduction
This Chapter provides a step-by-step introduction to the
general test tool functions.
Preparations for Use
At delivery, the batteries may be empty and must be
charged for at last 7 hours. Deeply discharged batteries
may even cause the test tool not to start up when it is
turned on. Refer to chapter 8 for charging instructions.
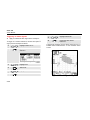
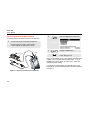
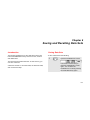
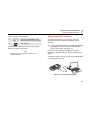
Powering the Test Tool
Follow the procedure (step 1 to 3) in Figure 1-1 to power
the test tool from a standard ac outlet. See Chapter 8 for
battery power instructions.
Figure 1-1. Powering the Test Tool
Note
When battery powered, the battery indicator
informs you about the condition of the battery
from full to empty:
.
The test tool powers up in its last setup configuration.
1-1
Fluke 125
Users Manual
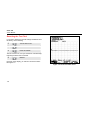
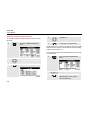
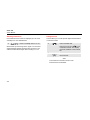
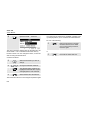
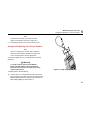
Resetting the Test Tool
If you want to restore the test tool settings as delivered from
the factory, do the following:
c
Turn the test tool off.
d
Press and hold.
e
Press and release.
The test tool turns on, and you should hear a double beep,
indicating the Reset was successful.
f
Release.
Now look at the display; you will see a screen that looks
like Figure 1-2.
1-2
Figure 1-2. The Screen After Reset
General Operating Instructions
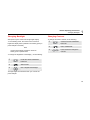
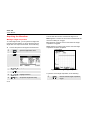
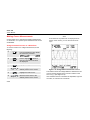
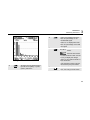
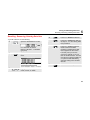
Changing Backlight
Changing Backlight
Changing Contrast
After power-up, the screen has a high bright display.
To change the screen contrast, do the following:
To save battery power, the screen has an economic
brightness display when operated on the battery pack (no
power adapter connected).
Note
Using dimmed display lengthens maximum
battery power operation time.
c
Invoke the LIGHT-CONTRAST
button bar.
d
Select CONTRAST.
e
Press and hold to change the
contrast.
1
To change the brightness of the display,, do the following:
c
Invoke the LIGHT-CONTRAST
button bar.
d
Select LIGHT
e
Dim or brighten the backlight.
The high brightness increases when you connect the
power adapter.
1-3
Fluke 125
Users Manual
Notes
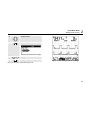
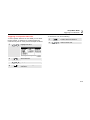
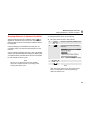
Making Selections in a Menu
How to use the menus is illustrated in the example below
on how to adjust the test tool for use with a certain printer
type:
c
The user options menu pops up.
d
Highlight PRINTER SETUP…
e
Open the PRINTER SETUP
menu
f
Highlight the required printer type
g
Accept the printer type.
h
Highlight the required baud rate
i
Accept the baud rate. The menu
will be closed.
1-4
−
Pressing
a second time closes this
menu and resumes normal measurement.
This toggling enables you to check the menu
without changing your settings.
−
When you do not change an item with the
blue arrow keys, repeatedly pressing
enables you to step through a menu without
changing the setup of the test tool.
−
Gray text in a menu or button bar indicates
that the function is disabled or the status is
not valid.
General Operating Instructions
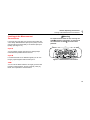
Looking at the Measurement Connections
Looking at the Measurement
Connections
Look at the top of the test tool. The test tool provides two
4-mm safety shielded banana jack inputs (red input A and
gray input B) and a black safety 4-mm banana jack input
(COM). (See Figure 1-3.)
1
Warning
To avoid electrical shock or fire, use only one
COM
(common) connection, or ensure that
are at the same
all connections to COM
potential.
Input A
You can always use the red input A for all single input
measurements possible with the test tool.
Input B
For measurements on two different signals you can use
the gray input B together with the red input A .
Figure 1-3. Measurement Connections
COM
You can use the black COMmon as single ground for low
frequency measurements, and for Continuity, Ohm (Ω),
Diode, and Capacitance measurements.
1-5
Fluke 125
Users Manual
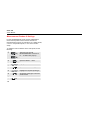
Measurement Probes & Settings
For the SCOPE/METER mode and the HARMONICS
mode various probes can be used for the test tool
measurement functions, for example a 10:1 voltage probe,
a 1mV/°C Temperature probe, or a 10 mV/A current
clamp.
To adapt the test tool readout to the used probe, do the
following:
c
(A)
(B)
The Input A or Input B
MEASUREMENTS menu and a
F1….F4 button bar pops up.
d
Open the INPUT… menu.
e
Highlight SELECT…
f
Open the PROBE on A (B) menu
g
Highlight the required probe type
h
Accept the probe type. The menu
will be closed.
i
1-6
2x
Close the INPUT… menu.
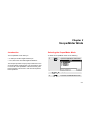
Chapter 2
Scope/Meter Mode
Introduction
Selecting the Scope/Meter Mode
The Scope/Meter mode offers you
To select the Scope/Meter mode do the following:
• a dual-input 40 MHz digital oscilloscope
c
Open the application mode menu.
d
Highlight SCOPE/METER
e
Enter the SCOPE/METER mode.
• two 5,000 counts true-RMS digital multimeters
This Chapter provides a step-by-step introduction to the
Scope and Meter measurements. The introduction does
not cover all of the capabilities of the test tool but gives
basic examples to show how to use the menus perform
basic operations.
2-1
Fluke 125
Users Manual
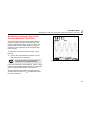
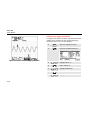
Reading the Screen
The screen is divided into three areas: Reading area,
Waveform area, and Menu area. Refer to Figure 2-1
during the following.
Reading area (A): Displays the numeric readings. If
only input A is on, you will see the input A readings only.
Waveform area (B): Displays the waveforms. The
bottom line displays the ranges/div and the power indicator
(line or battery). If only input A is on, you will see the input
A waveform only.
Note
When battery powered, the battery indicator
informs you about the condition of the battery
from full to empty:
.
Menu area (C): Displays the menu that provides choices
available through the blue function keys.
When you change a setup, a part of the screen is used to
display the choices. The area displays one or more menus
with choices accessed with the arrow keys:
.
2-2
Figure 2-1. The Screen Area's
Scope/Meter Mode
Displaying an Unknown Signal with Connect-and-View™ (Auto Set)
2
Displaying an Unknown Signal with
Connect-and-View™ (Auto Set)
The Connect-and-View™ function enables hands-off
operation to display complex unknown signals. This
function optimizes the position, range, time base, and
triggering and assures a stable display on nearly all
waveforms. If the signal changes, the setup will track
these changes.
To enable the Connect-and-View™ function, do the
following:
•
Connect the red test lead from red input A to the
unknown signal to be measured .
Press to select the AUTO (automatic) or
the MANUAL mode (toggle function).
Figure 2-2. Scope Screen After an Auto Set
In the next example, the screen displays “1.411” in large
numbers and “+1.000” in smaller numbers. A scope trace
gives a graphical representation of the waveform.
The trace identifier (A) is visible at the left side of the
waveform area. The zero icon ( ) identifies the ground
level of the waveform.
-
2-3
Fluke 125
Users Manual
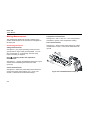
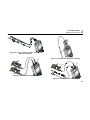
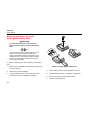
Making Measurements
Temperature measurements
The reading area displays the numeric readings of the
chosen measurements on the waveform that is applied to
the input jack.
See figure 2-6. Use a 1 mV/°C or 1 mV/°F temperature
transmitter to get the correct temperature reading.
Connecting the Inputs
See figure 2-7. Select correct probe settings for voltage
measurement on input A, and current measurement on
input B.
Voltage measurements
See figure 2-3. For proper grounding connect the short
ground leads d to the same ground potential. You can
also use test lead c for grounding. See also Using
Proper Grounding in chapter 9.
Ohm (Ω), continuity, diode, and capacitance
measurements
See figure 2-4. Use the red shielded test lead from input A
and the black unshielded ground lead from COM
(common).
Power measurements
2
1
2
Current measurements
See figure 2-5. Select the probe setting that matches the
used current clamp and its setting (e.g. 1 mV/A), see
Chapter 1, Measurement Probes and Settings.
2-4
Figure 2-3. Volts Measurement Setup
Scope/Meter Mode
Making Measurements
2
Figure 2-4. Ohms, Continuity, Diode, Capacitance
Measurement Setup
Figure 2-6. Temperature Measurement Setup
BB120
10 mV/A - 1 mV/A
BB120
10 mV/A - 1 mV/A
Figure 2-5. Current Measurement Setup
Figure 2-7. Power Measurement Setup
2-5
Fluke 125
Users Manual
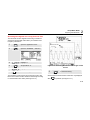
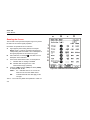
Selecting a measurement function.
f
Highlight Hz.
g
Accept the Hz measurement.
To choose a frequency measurement for Input A, do the
following:
c
Open the A MEASUREMENTS
menu.
Observe that Hz is now the main reading. The former main
reading has now moved to the smaller secondary reading
position. (See Figure 2-8.)
To choose also a Peak-to-Peak measurement for Input B,
do the following:
d
Highlight Hz….
e
Open the Hz-RPM submenu.
2-6
c
Open the B MEASUREMENTS
menu.
d
Highlight ON.
e
Turn Input B on. Observe that the
highlight jumps to the present
main measurement.
Scope/Meter Mode
Making Measurements
f
Highlight PEAK...
g
Open the PEAK submenu.
h
Highlight PEAK-PEAK.
i
Accept the pk-pk measurement.
2
Figure 2-8. Hz and Vpp as Main Readings
Now, you will see a screen like Figure 2-8.
2-7
Fluke 125
Users Manual
Freezing the Screen
Holding a Stable Reading
You can freeze the screen (all readings and waveforms) at
any time.
The Touch Hold® mode captures a stable main (large)
reading on the display. When a new stable reading is
detected, the test tool beeps and displays the new
reading.
c
d
Freeze the screen. HOLD
appears at the bottom of the
reading area.
Resume your measurement.
Use the following procedure for the Touch Hold function:
c
Open the INPUT A menu.
d
Enter the Touch Hold mode,
THOLD appears at the bottom of
the reading area.
e
f
2-8
BEEP)))
Wait until an audible beep: now
you have a stable reading.
Turn Touch Hold off and return to
normal measurement.
Scope/Meter Mode
Making Relative Measurements
2
Making Relative Measurements
Zero Reference displays the present measurement result
with respect to the defined value. This feature is useful
when you need to monitor the measured value in relation
to a known good value.
c
Open the A MEASUREMENTS
menu.
d
Activate the relative
measurement. (ZERO).
Note
In the OHM Ω measurement function the F1
ZERO ON OFF soft key enables you to turn
relative measurements on and off.
Figure 2-9. Making a Relative Measurement
The relative measurement now becomes the main
reading, while the former main measurement has moved
to the smaller secondary reading position. (See Figure
2-9.)
Do step1 and step 2 again to de-activate the relative
measurement.
2-9
Fluke 125
Users Manual
Selecting Auto/Manual Ranges
Press
to automatically adjust the position, range,
time base, and triggering (Connect-and-View). This
assures a stable display on nearly all waveforms. The
bottom line shows the range, the time base for both inputs,
and the trigger information. AUTO appears at the bottom
of the reading area.
Press
a second time to select the manual range.
MANUAL appears at the bottom of the reading area.
Changing the Graphic Representation
on the Screen
From Auto range, you can use the light-gray rocker keys to
change the graphic representation on the screen
manually. This will turn off the Connect-and-View function!
Observe that AUTO at the bottom of the reading area
disappears.
Changing the Amplitude
c
Enlarge the waveform.
d
Reduce the waveform.
Available settings are from 5 mV/div to 500 V/div when
using the test leads.
Changing the Time Base
c
Increase the number of periods.
d
Decrease the number of periods.
Available settings are from 10 ns/div to 5 s/div in normal
mode.
2-10
Scope/Meter Mode
Changing the Graphic Representation on the Screen
2
Positioning the Waveform on the Screen
Considerable flexibility is offered in moving the
waveform(s) around the screen.
c
Press until you have left any open
menu. Observe that the following
main menu appears on bottom of
the screen.
d
Choose A MOVE
e
Position the waveform of INPUT
A on the screen.
Waveform positioning is demonstrated in Figure 2-10.
Figure 2-10. Positioning the Waveform
Observe that the trigger identifier ( ) moves horizontally
on the screen.
Note:
For 3 phase power measurements the waveform
positions are fixed.
2-11
Fluke 125
Users Manual
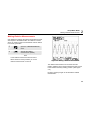
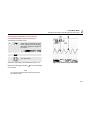
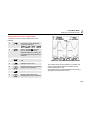
Smoothing Waveforms and Readings
To smooth the waveform, do the following:
c
Open the application menu.
d
Open the SMOOTH.. submenu.
e
Highlight WAVEFORM: SMOOTH
to smooth the input A and input B
waveform.
f
Accept SMOOTH.
g
Highlight READING A: FAST
NORMAL or SMOOTH.
h
Accept your choice and repeat g
and h for reading B.
WAVEFORM SMOOTH suppresses noise without loss of
bandwidth. Waveform samples with and without smoothing
are shown in Figure 2-11.
READING SMOOTH: long averaging, stable reading
READING FAST: short averaging, fast response
Figure 2-11. Smoothing the Waveform
2-12
Scope/Meter Mode
Changing the Graphic Representation on the Screen
2
Displaying the Envelope of a Waveform
The test tool records the envelope (minimum and
maximum) of the live waveforms A and B.
Repeat the first two actions of ‘Smoothing the Waveform’,
and then do the following:
e
f
Highlight ENVELOPE.
(3x)
Start monitoring the envelope of
the waveform.
The screen shows the resultant envelope in a gray
waveform. See Figure 2-12.
You can use ENVELOPE to observe variations in time or
amplitude of input waveforms over a longer period of time.
Figure 2-12. Displaying the Envelope of a Waveform
2-13
Fluke 125
Users Manual
Acquiring the Waveform
The test tool will now have a screen like Figure 2-13.
Making a Single Acquisition
Wait: appears on bottom of the screen to indicate that the
test tool is waiting for a trigger.
To catch single events, you can perform a single shot.
(One time screen update.) To set up the test tool for a
single shot on the input A waveform, do the following:
•
Connect the probe to the signal to be measured.
c
Open the application menu.
d
Open the TRIGGER… submenu.
e
Highlight A.
f
Accept INPUT: A.
g
Highlight SINGLE.
h
2-14
(2x)
Accept the Single shot setup.
Run: appears on bottom of the screen when the single
acquisition is triggered.
Hold: appears on bottom of the screen when the single
acquisition has been completed.
Figure 2-13. Making a Single Acquisition
To perform a next single acquisition, do the following:
i
Wait for another single acquisition
trigger.
Scope/Meter Mode
Acquiring the Waveform
2
Recording Slow Signals over a Long Period of Time
The roll mode function supplies a visual log of waveform
activity and is especially useful when you measure lower
frequency waveforms.
c
Open the application menu..
d
Open the TRIGGER… submenu.
e
Highlight A.
f
Accept INPUT: A.
g
Highlight ROLL
h
(2x)
Start Recording.
The waveform moves across the screen from right to left
like a normal chart recorder. Observe that during recording
no measurements are made. (See Figure 2-14.)
Figure 2-14. Recording Waveforms over Longer Period
of Time
g
Freeze Recording.
Observe that the measurement values are only displayed
after
is pressed. (See figure 2-14.)
2-15
Fluke 125
Users Manual
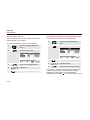
Selecting AC-Coupling
Reversing the Polarity of the Displayed Waveform
Use AC-coupling when you wish to observe a small AC
signal that rides on a DC signal.
To invert the input A waveform, do the following:
To select AC-coupling on input A, do the following:
c
Open the A MEASUREMENTS
menu.
d
Open the INPUT menu:
c
Open the A MEASUREMENTS
menu.
d
Open the INPUT menu.
e
e
Jump to the COUPLING: field
f
Highlight AC.
g
2-16
(2x)
Accept AC-coupling.
2x
Jump to the WAVEFORM: field
f
Highlight INVERT.
g
Accept inverted waveform display.
For example, a negative-going waveform is displayed as
positive-going, providing a more meaningful viewing
perspective in some cases. An inverted display is
identified by trace identifier A on left of the waveform area.
2
Scope/Meter Mode
Triggering on a Waveform
Triggering on a Waveform
Setting Trigger Level and Slope
Triggering tells the test tool when to begin displaying the
waveform. You can select which input signal should be
used, on which edge this should occur, and you can define
the condition for a new update of the waveform. You can
setup the test tool to trigger on video signals.
For quick operation, use the AUTO SET key to
automatically trigger on nearly all signals.
The bottom line of the waveform area identifies the trigger
parameters being used. Trigger icons on the screen
indicate the trigger level and slope. (See Figure 2-15.)
c
Perform an AUTO SET.
To optimize trigger level and slope manually, do the
following:
c
Press until you have left any open
menu.
d
Enable the arrow keys for Trigger
Level and Slope adjustment.
e
Adjust the Trigger Level
continuously. Observe the trigger
icon
on the second time
division line indicates the trigger
level.
f
Trigger on either positive Slope or
negative Slope of the chosen
waveform.
Note:
For 3 phase power measurements the trigger
settings are fixed.
2-17
Fluke 125
Users Manual
Selecting the Trigger Parameters
To trigger on the input A waveform, with automatic screen
update, and to configure the auto range triggering for
waveforms down to 1 Hz, do the following:
Figure 2-15. Screen with all Trigger Information
2-18
c
Open the applications menu.
d
Open the TRIGGER submenu
e
Highlight INPUT: A.
f
Select INPUT: A.
g
Highlight FREE RUN.
h
Select FREE RUN.
i
Highlight >1 Hz
Scope/Meter Mode
Triggering on a Waveform
j
Accept all trigger selections and
return to normal measurement.
Note
Setting the automatic triggering to >1Hz will slow
down the auto range.
TRIG:A appears in gray text on bottom of the screen when
no trigger is found.
2
Isolated Triggering
Use the optically isolated trigger probe (ITP120, optional)
to trigger on an external source, and to isolate the test tool
from a trigger waveform. See Figure 2-16.
To choose the isolated trigger probe, select ‘EXT’ in point
e of the previous example. Trigger level is fixed and is
TTL compatible.
Note
Gray text in a menu or button bar indicates that
the function is disabled or the status is not valid.
FREE RUN: the test tool automatically updates the trace
even if there are no triggers.
ON TRIG.:
the screen is updated only when valid
triggers occur.
Figure 2-16. Isolated Triggering
2-19
Fluke 125
Users Manual
Triggering on Video Signals
•
Apply an interlaced video signal to the red input A.
To trigger on a random video line, continue from point d
of the previous example as follows:
e
Highlight VIDEO on A....
f
Open the VIDEO TRIGGER
submenu.
g
Highlight PAL.
h
Select PAL.
i
Highlight RANDOM.
j
Select RANDOM.
2-20
k
Highlight POSITIVE.
l
Accept the video trigger
selections .
Trigger level and slope are now fixed. (See Figure 2-17.)
Positive video is indicated as a “+” icon on bottom of the
screen.
Figure 2-17. Measuring Video Signals
Scope/Meter Mode
Triggering on a Waveform
Triggering on a Specific Video Line
To view a specific video line in more detail you can select
the line number. To measure on a selected video line,
continue from point h of the previous example as follows:
i
Highlight SELECT
j
Select SELECT
k
Highlight POSITIVE.
l
Accept the video trigger
selections .
2
To choose line 135, do the following:
c
Enable video line selection.
d
Select number 135.
2-21
Fluke 125
Users Manual
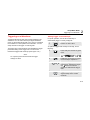
Making Cursor Measurements
Cursors allow you to make precise digital measurements
on waveforms. For 3 phase power measurements cursors
are disabled.
Note
Even when the key labels are not displayed at the
bottom of the screen, you can still use the arrow
keys.
Using Horizontal Cursors on a Waveform
To use the cursors for a voltage measurement, do the
following:
c
From Scope/Meter mode, display
the Cursor Key functions:
d
Press to highlight . Observe
that two horizontal cursor lines
are displayed.
e
Highlight the upper cursor.
f
Move the upper cursor to the
desired position on the screen.
g
Highlight the lower cursor.
h
Move the lower cursor to the
desired position on the screen.
2-22
Figure 2-18. Voltage Measurement with Cursors
The readout shows the voltage difference between the two
cursors and the voltages at the cursors in relation to the
zero icon (-). (See Figure 2-18).
Use horizontal cursors to measure the amplitude, high and
low value, or overshoot of a waveform.
2
Scope/Meter Mode
Making Cursor Measurements
Using Vertical Cursors on a Waveform
To use the cursors for a time measurement, do the
following:
c
From Scope mode, display the
Cursor Key functions.
d
Press to highlight . Observe
that two vertical cursors are
displayed. Markers (-) identify the
point where the cursors cross the
waveform.
e
If necessary, choose the trace A
or B.
f
Highlight the left cursor.
g
Move the left cursor to the desired
position on the waveform.
h
Highlight the right cursor.
i
Move the right cursor to the
desired position on the waveform.
Figure 2-19. Time Measurement with Cursors
The readout shows the time difference ‘t’ between the
cursors and the voltage difference between the two
markers (See Figure 2-19).
The signal frequency is displayed behind 1/t if exactly 1
signal period is between the cursors.
2-23
Fluke 125
Users Manual
Making Rise Time Measurements
To measure rise time, do the following:
c
From Scope mode, display the
Cursor Key functions.
d
Press to highlight (rise time).
Observe that two horizontal
cursors are displayed.
e
If only one trace is displayed,
select MANUAL or AUTO. AUTO
automatically does steps 4 to 6.
For multiple traces select the
required trace A or B.
f
Move the upper cursor to 100% of
the trace height. A marker is
shown at 90%.
g
Highlight the other cursor.
h
Move the lower cursor to 0% of
the trace height. A marker is
shown at 10%.
2-24
Figure 2-20. Risetime Measurement with Cursors
The reading now shows the risetime from 10%-90% of the
trace amplitude and the voltage at the cursors in relation to
the zero icon (-). See Figure 2-20.
i
Turn off the cursors.
2
Scope/Meter Mode
Using the 10:1 Probe for High Frequency Measurements.
Using the 10:1 Probe for High Frequency
Measurements.
The test tool is supplied with a model VP40 10:1 Probe.
Use of this Probe is recommended when you measure
high frequency signals in circuits with a high impedance.
The loading of the circuit by a 10:1 Probe is much lower
than that of a 1:1 Shielded Test Lead.
f
Open the PROBE on A menu
g
Highlight 10:1 V
h
Accept the probe type. The menu
will be closed.
Probe attenuation and probe adjustment must be
observed when using a 10:1 Probe.
Observe that the 10 times attenuation of the Probe is
compensated in the voltage readout.
Probe Attenuation.
Probe Adjustment.
The Probe attenuates the signal 10 times. Proceed as
follows to adapt the Test Tool’s voltage readout to this
attenuation. The example below is for a Probe connected
to input A:
The Probe of model VP40 such as supplied with the Test
Tool is always adapted correctly to its inputs: high
frequency adjustment is not necessary.
Other 10:1 Probes however must be adjusted for optimal
High Frequency performance. How to adjust these Probes
is explained in Chapter 8 under ‘Using and Adjusting 10:1
Scope Probes’.
c
The Input A MEASUREMENTS
menu and a F1….F4 button bar
pops up.
d
Open the INPUT… menu
e
Highlight PROBE: SELECT…
2-25
Fluke 125
Users Manual
2-26
Chapter 3
Harmonics
Introduction
Measuring Harmonics
In the Harmonics function the test tool measures
harmonics to the 33rd (for 400 Hz up to 25th). Related data
such as DC components., THD (Total Harmonic
Distortion), and K-factor are measured.
You can display harmonics of:
Harmonics are periodic distortions of voltage, current, or
power sinewaves. A waveform can be considered as a
combination of various sinewaves with different
frequencies and magnitudes. The contribution of each of
these components to the full signal is measured.
Harmonics power distribution systems are often caused by
non-linear loads such as switched mode DC power
supplies in computers, TV’s and adjustable speed motor
drives. Harmonics can cause transformers, conductors,
and motors to overheat.
• Voltage measurements on Input A
• Current measurements on Input B
• Power measurements calculated from Voltage
measurements on Input A and Current measurements
on Input B.
In the Harmonics mode the test tool always uses the
AUTO mode. The vertical sensitivity range and the time
base range are automatically adjusted to the most suitable
range for the applied input signal. The ranging keys
(mV V and s TIME ns) and the AUTO key are locked.
Input A is forced to measure voltage, input B is forced to
measure current.
3-1
Fluke 125
Users Manual
Performing Harmonics Measurements
d
Open the application mode menu.
e
Highlight HARMONICS
f
Accept your choice. You will see a
screen like figure 3-2
To perform harmonics measurements do the following:
c
Connect the inputs as indicated in figure 3-1
Connect input A for VOLT and for WATT,
connect input B for AMP and for WATT.
10 mV/A - 1 mV/A
BB120
If input A was already set to V, and input B was already set
to AMP, the actual probe settings will be used. If not, a
PROBE menu will be shown to enable you to select the
appropriate probe setting.
To change the probe settings if the PROBE menu is not
automatically opened see Measurement Probes & Settings
in chapter 1 .
Figure 3-1. Input Connections for Harmonics
3-2
Harmonics
Measuring Harmonics
h
3
Select %f to display harmonics
bars as a percentage of the
fundamental signal.
Select %r to display harmonics
bars as a percentage of the total
rms signal
i
Show the waveform
screen.
Show the bars screen.
For the waveform screen use the
F1 key to display the voltage
(input A), the current (input B), or
both waveforms.
Figure 3-2. Harmonics Screen
g
Show the input A voltage (VOLT),
input B current (AMP), or power
(WATT) harmonics.
If the waveform screen is shown,
the arrow keys key are locked.
j
Set cursor measurements ON or
OFF, see Using Cursors below.
3-3
Fluke 125
Users Manual
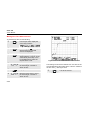
Zooming Harmonics
Using Cursors
If the harmonics bars screen is displayed you can zoom
vertically for a more detailed view.
Cursors allow you to make precise digital measurements
on harmonics bars.
c
Press to vertically zoom in or out.
c
Select CURSOR ON.
Notice the cursor sign |on top
of the harmonic bar. The display
shows the readings of the marked
bar.
Observe the top of the long bars in figure 3-2. The arrow
shape indicates that the harmonics are zoomed in. The
scale at the left side changes when zooming in or out.
d
Move the cursor to select another
harmonics bar.
Note:
In the harmonics waveform mode cursor
measurements are disabled.
3-4
Harmonics
Measuring Harmonics
3
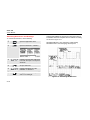
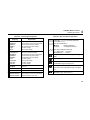
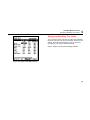
Reading the Harmonics Screen
Depending on the test tool settings the readings show
different measurement units.
Table 3-1 shows the readings for VOLT/AMP/WATT and
CURSOR OFF .
Table 3-2 shows the readings for VOLT/AMP/WATT and
CURSOR ON .
Table 3-1. Harmonics Readings cursor OFF
Mode
Main A
Secondary A
Main B
Secondary B
Volt
V rms
THD
Hz
Amp
Hz
K-Factor
A rms
THD
Watt
W rms
THD
Hz
K-Factor
Table 3-2. Harmonics Readings Cursor ON
Mode
Main A
Secondary A
Main B
Secondary B
Volt
V
Relative value
Hz
Angle (°)
Relative value
(%r or %f)
Amp
Hz
Angle (°)
A
Watt
W rms
Relative value
Hz
(%r or %f)
(%r or %f)
Angle (°)
Figure 3-3. Reading the Harmonics Screen
THD : total harmonic distortion is the amount of harmonics
in a signal as a percentage of the total rms value (%r) or
as a percentage of the fundamental (%f).
K-factor : indicates the losses in transformers due to
harmonic currents.
Relative value : value of the bar marked by the cursor,
%f as a percentage of the fundamental
VOLT/AMP/WATT value,
%r as a percentage of the total rms VOLT/AMP/WATT
value.
Angle°: the phase angle between the harmonic
component and the fundamental voltage or current.
3-5
Fluke 125
Users Manual
3-6
Chapter 4
Field Bus Measurements
Introduction
Fieldbuses are bi-directional, digital, serial control
networks used in process control and industrial
automation.
The test tool can indicate the status of the following
aspects of the OSI model Physical Layer:
•
•
•
•
For supported bus types and protocols see Chapter 10,
section Fieldbus Measurements.
Note
You can perform resistance measurements and
capacitance measurements using the
Scope/Meter mode.
Voltage levels (bias, high level, low level)
Bit width – baud rate
Rise and fall time
Distortion
Moreover the test tool can show the bus signal waveform
in the Eye-pattern mode, see page 4-7.
The test tool operates in full automatic (ranging and
triggering) mode. Test limits are preset, but can be
changed, see page 4-8.
4-1
Fluke 125
Users Manual
Performing Fieldbus Measurements
f
To perform fieldbus measurements do the following:
c
Select User 1 or User 2 if you
want to create a customized set
of limits to test other (non
standard) bus systems. See
page 4-8 for setting the limits.
Default settings are ControlNet for
User1 and Foundation Fieldbus
H1 for User2.
Open the application mode menu.
g
d
Highlight BUSHEALTH.
e
Open the bus selection menu:
Select the bus type.
Accept your choice.
For bus types followed by 3 dots
… a new menu will open:
Use
to select the
required item and press
.
You will see a screen like fig 4.2.
h
i
Select the appropriate input A and
input B test leads or probe type.
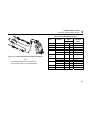
Connect the inputs as indicated in figure 4-1.
Use the test tool inputs as shown in table 4-1.
4-2
Field Bus Measurements
Performing Fieldbus Measurements
4
Table 4-1. Bus Measurement Inputs
B
A
Bus
Subtype
x
-
CAN
x
x
STL120
x
-
VP40
x
-
Coax-BB120
RS-422
ControlNet
Modbus
Use the BB120 Banana-to-BNC Adapter to
connect a BNC cable for bus measurements.
STL120
RS-232
x
-
STL120
RS-485
x
x
STL120
x
-
STL120
DP/RS-485
x
x
STL120
PA/31.25 kBit/s
x
-
STL120
Foundation H1
Note
Advised
Probe
AS-i
Interbus S
Figure 4-1. Fieldbus Measurement Input Connections
Input
A
B
fieldbus
Profibus
Ethernet
Coax
x
-
Coax-BB120
Twisted pair
x
-
VP40
RS-232
x
-
STL120
RS-485
x
x
STL120
4-3
Fluke 125
Users Manual
A
B
C
D
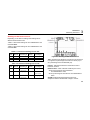
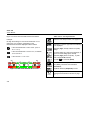
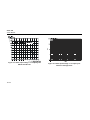
Reading the Screen
The bus test screen (see the example in figure 4-2) shows
the status of the various signal properties.
Information is represented in four columns:
A.
signal property that is being tested, for example
VHigh. Rows 1 to 6 show each signal property and
corresponding data. See table 4-2 for a description of
the signal properties for the various bus types.
B.
status indicator, for example
description of the indicators.
C.
most recent measurement value, for example 3.5.
---
. See table 4-3 for a
indicates that no reading is available
1
2
3
4
5
6
OL indicates that the signal is out of the
measurement range (overload)
D.
used low (LOW) and high (HIGH) test limits (LIMIT),
for example 18.5 31.6V.
LIMIT *
the * indicates that one or more of the
limits are not set to the default value!
N/A
indicates that limit does Not Apply to this
bus type.
The F1…F4 function key labels are explained in Table 4-4.
4-4
Figure 4-2. Field Bus Test Screen Example
4
Field Bus Measurements
Reading the Screen
Table 4-2. Tested Signal Properties
Property
1 VBias
CAN-Rec. H-L
CAN-Rec. H
CAN-Rec. L
V High
Vpk-pk
2 V-Level High-Bias
V-Level Bias-Low
CAN-DOM. H-L
CAN-DOM. H
CAN-DOM. L
V Low
V-Level pk-pk
V-level high
V-level low
3 Data
Data Baud
4 Rise
5 Fall
6 Distortion Jitter
Distortion Overshoot
Distortion Amplitude
Table 4-3. Bus Test Screen Indicators
Explanation
Bias voltage
CAN-recessive high to low level voltage
CAN-recessive high level voltage
CAN-recessive low level voltage
High level voltage
Peak to peak voltage
High level to bias level voltage
Bias level to low level voltage
CAN-dominant high to low level voltage
CAN-dominant high level voltage
CAN-dominant low level voltage
Low level voltage
Peak to peak voltage
High level voltage
Low level voltage
Bit width
Baud rate
Rise time as % of bit width
Fall time as % of bit width
Jitter distortion
Signal distortion, over- and undershoot
Amplitude distortion (AS-i bus)
: bus activity indicators.
Bus activity indicator 1:
: voltage measured
{ (open)
: no voltage measured
Q (filled)
Bus activity indicators 2 and 3:
{ { (both open) : no activity
ÑÑ(blinking) : activity
Busy, the test tool is measuring/processing
data.
No reading available.
Test OK. Measurement results are within 80%
of allowable range, see figure 4-3.
Warning. Measurement results are between
80% and 100% of allowable range, see figure
4-3.
Test failed. Measurement results are out of
allowable range, see figure 4-3.
4-5
Fluke 125
Users Manual
Figure 4-3 shows the bust health indicator boundaries.
Example:
Select the Limit Setup function, see page 4-8.
the high level voltage of a bus must be between +3.0 V
(MIN) and +15.0 V (MAX). Depending on the
measurement result the displayed indicator will be:
If the result is between 4.2 and 13.8V. (10% of
12 V = 1.2 V)
Depending on the bus type select the following
to be displayed:
High-Bias (High, default) or Bias-Low (Low)
voltage.
If the result is between 3 V and 4.2 V, or between
13.8 V and 15 V.
Low level voltage (L), high level voltage (H), or
high to low level voltage (H-L, default).
If the result is < 3 V or >15 V.
High-Bias (High), Bias-Low (Low) , or peakpeak voltage (Pk-Pk, default).
MIN
BAD
Table 4-4. F1...F4 Key Functions
Bit width (
MAX
WEAK
10 %
GOOD
WEAK
80 %
10 %
BAD
Figure 4-3. Bus Health Indicator Boundaries
) or baud rate (Baud)
Select the distortion aspect to be tested:
jitter (Jitter), overshoot and undershoot
(Overshoot),
amplitude distortion (Amplitude) for AS-i.
Select the Eye-pattern screen mode, see
Viewing the Bus Waveform Screen on page
4-7.
4-6
Field Bus Measurements
Viewing the Bus Waveform Screen
4
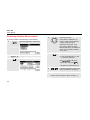
Viewing the Bus Waveform Screen
To view the waveform eye pattern of the bus voltage, do
the following:
c
In the main screen select eye
pattern mode. You will see a
screen like figure 4-4.
The screen shows the waveforms of one bit time triggered
on a positive as well as on a negative edge in persistence
mode.
d
Clear the persisted waveforms
and restart showing the
waveform.
e
Return to the test screen.
f
Exit the Bushealth mode and
enter the Scope/Meter mode.
Figure 4-4. Eye Pattern Screen
Note
to freeze the screen. Pressing
Press
again will clear the persistence waveform and
restart showing the waveform eye pattern.
4-7
Fluke 125
Users Manual
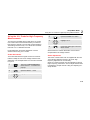
Setting the Test Limits
f
You can change the test limits used to generate the
messages OK
, WARNING
, and NOT OK
.
A * in the SETUP LIMITS screen
indicates that a signal property
has limits that differ from the
default setting.
The test limits apply to the selected bus type. To change
the test limits for another bus type do steps 1-5 on page 42 first.
To change the test limits, do the following:
c
From the test screen open the
SETUP LIMITS menu. You will
see a screen like Figure 4-5. The
header shows the bus type.
d
Select the signal property for
which you want to set the limit.
e
Select the level to be adjusted:
LOW, HIGH or ! WARNING
Press
to set all limits to the
default setting.
4-8
Change the limits.
Press
N/A if a limit should
not be involved in the test.
g
Accept the limits and return to the
test screen.
In the test screen the text LIMIT
will be followed by a * if any of the
limits is not the default limit.
Note
Changed limits will persist until:
- you change them again,
- you reset the test tool; resetting will restore the
default limits.
Field Bus Measurements
Saving and Recalling Test Limits
4
Saving and Recalling Test Limits
You can save a screen, plus the test setup with (adjusted)
test limits, plus the most recent eye pattern trace as a new
dataset. By recalling this dataset you can do a bus test
according to your own pre-defined test limits.
Refer to chapter 6 ‘Saving and Recalling Datasets’.
Figure 4-5. Setup Limits Menu Screen
4-9
Fluke 125
Users Manual
4-10
Chapter 5
Plotting Measurements over Time (TrendPlotTM)
Introduction
Starting/Stopping a TrendPlotTM
The TrendPlot™ function plots a graph derived from the
MAIN (large) readings in the SCOPE/METER mode or in
the HARMONICS mode as a function of time.
To start a TrendPlot™ do the following:
c
Open the application mode menu.
d
Highlight TRENDPLOT
The secondary (small) reading shows:
• the average (AVG) reading and the date and time,
or
• the minimum (MIN) or the maximum (MAX) reading
since the TrendPlot start and the date and time of the
most recent change.
5-1
Fluke 125
Users Manual
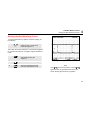
e
Start the TrendPlot. You will see a
screen like figure 5-1.
You can restart a TrendPlot by
pressing the F2 RESTART key.
f
Stop the TrendPlot.
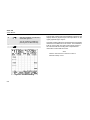
The test tool continuously logs all readings to memory and
displays these as graphs. If input A and input B are on, the
upper graph belongs to input A.
Automatic vertical scaling and horizontal time compression
resizes the TrendPlot to fit on the screen. The TrendPlot is
built up on the screen from left to right until the screen is
full. The automatic time scaling then compresses this
information to about half the screen.
Note
When a new minimum or maximum value is
detected a beep occurs.
Figure 5-1. TrendPlot Reading
5-2
Plotting Measurements over Time (TrendPlotTM)
Changing the TrendPlot Reading
5
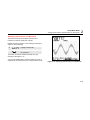
Changing the TrendPlot Reading
Making TrendPlot Cursor Measurements
To toggle the secondary TrendPlot reading between MIN
(minimum), MAX (maximum), and AVERAGE, do the
following:
Cursors allow you to make precise digital measurements
on the plotted graph(s). The display shows the
measurement results and the date and time at the cursor
position.
c
Change MIN into MAX reading.
d
Change MAX into AVERAGE
(AVG) reading.
Note that the date and time stamp now updates
continuously to indicate the most recent change in a
reading.
To use cursors do the following
c
Stop updating the graph and
freeze the screen.
d
Select CURSOR ON.
e
Select the maximum or minimum
plotted reading to be displayed.
From multiple readings during a
time slot, the minimum and the
maximum main are plotted.
f
Move the cursor to the desired
position on the graph.
Note
To resume updating the graph press
again.
5-3
Fluke 125
Users Manual
5-4
Chapter 6
Saving and Recalling Data Sets
Introduction
This Chapter explains how to save data sets into the test
tool’s Flash EEPROM memory and how to view, rename
and delete them.
The test tool has 20 data memories. In each memory you
can save a data set.
A data set consists of the screen data, the waveform data,
and the test tool setup.
Saving Data Sets
To save a data set do the following:
c
Open the SAVE/RECALL mode.
The screen is frozen until you
leave the SAVE/RECALL mode
again. You can leave the
SAVE/RECALL mode by pressing
the SAVE/PRINT key again.
6-1
Fluke 125
Users Manual
d
Open the SAVE ... submenu.
If no free memory locations are available message pops
up that proposes to you to overwrite the oldest data set.
Do one of the following:
c
The menu shows the default name for the data set to be
stored ‘Data n’. The n indicates the first free memory
location number. You can change the name, or save the
data set using the default name.
Continue as follows:
e
Select the character you want to
change.
f
Change the selected character.
The SPACE softkey replaces the
highlighted character with a space
and highlights the next character.
g
When finished save the data set.
The instrument returns to normal signal acquisition again.
6-2
Reject the proposal to overwrite
the oldest data set, then delete
one or more memory locations,
and save again.
or
c
Overwrite the oldest data set .
Saving and Recalling Data Sets
Recalling, Renaming, Deleting Data Sets
Recalling, Renaming, Deleting Data Sets
f
To recall a data set, do the following:
c
Press F4 to recall the data set.
Observe that the recalled
waveform is displayed and that
HOLD appears on the screen.
From this point you can use
cursors for analysis or you can
print the recalled screen. The test
tool returns to signal acquisition if
you press the HOLD/RUN key,
using the setting of the recalled
data set.
Open the RECALL/DELETE
menu.
g
e
Press F1 to delete the data set
Press F2 to rename the data set;
do steps 3…5 of the ‘Saving Data
Sets procedure.
Open the SAVE/RECALL mode.
If no data sets are stored
RECALL DELETE… is disabled
(grey text).
d
6
Go back to the save/print mode.
Highlight the data set you want to
recall, rename, or delete.
6-3
Fluke 125
Users Manual
6-4
Chapter 7
Using a Printer and FlukeView
Introduction
Using a Printer
This Chapter explains how to setup the test tool for
communication with :
To print a (graphic) hard copy of the present screen, you
need to use one of the following:
z
a printer to make a hardcopy of the test tool screen
z
a PC or laptop to use the FlukeView software.
z
The Optically Isolated RS-232 Adapter/Cable
(PM9080, optional) to connect a serial printer to the
OPTICAL PORT of the test tool. See Figure 7-1.
z
The Print Adapter Cable (PAC91, optional) to connect
a parallel printer to the OPTICAL PORT of the test
tool. See Figure 7-2.
7-1
Fluke 125
Users Manual
This example covers how to set up the test tool to print on
a HP Deskjet printer with a baud rate of 9600 baud:
c
Open the USER OPTIONS
menu.
d
Highlight PRINTER SETUP…
Figure 7-1. Connecting a Serial Printer
Open the PRINTER SETUP
submenu.
Figure 7-2. Connecting a Parallel Printer
e
Highlight DESKJET.
f
Select DESKJET.
g
Highlight 9600.
h
Accept the print selections.
Now you are ready to print.
7-2
Using a Printer and FlukeView
Using FlukeView® Software
To print a screen, do the following:
i
Open the SAVE&PRINT menu.
Observe that the screen is frozen.
j
Start printing.
A message that indicates that the test tool is printing
appears on bottom of the screen.
Note:
Printers must be compatible with HP PCL or
EPSON protocol.
7
Using FlukeView® Software
To connect the test tool to a computer for using the
FlukeView software for Windows® (SW90W), do the
following:
z
Use the Optically Isolated RS-232/USB Adapter/Cable
(OC4USB) to connect a computer to the OPTICAL
PORT of the test tool. See Figure 7-3.
For all information relating to installing and using the
FlukeView ScopeMeter software, see the SW90W Users
Manual.
A Software & Cable Carrying Case Kit is optional available
as model number SCC 120.
Figure 7-3. Connecting a Computer
7-3
Fluke 125
Users Manual
7-4
Chapter 8
Maintaining the Test Tool
Introduction
Cleaning the Test Tool
This chapter covers basic maintenance procedures that
can be performed by the user. For complete service,
disassembly, repair, and calibration information, see the
Service Manual. You will find the part number of the
Service Manual in the section ‘Parts and Accessories’ in
this manual.
Clean the test tool with a damp cloth and a mild soap to
avoid abrasion of text on the test tool. Do not use
abrasives, solvents, or alcohol.
Storing the Test Tool
If you are storing the test tool for an extended period of
time, charge the rechargeable battery pack before storing.
It is not necessary to remove the battery pack.
8-1
Fluke 125
Users Manual
Charging the Rechargeable Battery Pack
At delivery, the batteries may be empty and must be
charged to fill them completely. Charging time is 7 hours
(test tool is off). When fully charged, the batteries typically
provide 6 hours of use at full brightness. Operating time is
extended at normal brightness.
When battery powered, the battery indicator on the bottom
of the screen informs you about the condition of the
battery. The battery symbols are:
. The
battery symbol
indicates that there are typically five
minutes of operating time left.
Use the setup as shown in Figure 8-1 to charge the battery
pack and power the instrument.
Turn the test tool off to charge the batteries more quickly.
Note
The test tool uses a trickle charge for the
batteries, so no damage can occur if you leave it
charging for long periods, e.g., through the
weekend.
8-2
Figure 8-1. Charging the Battery Pack
8
Maintaining the Test Tool
Keeping Batteries in Optimal Condition
Keeping Batteries in Optimal Condition
Always operate the test tool on batteries until an
-icon
appears on the bottom line of the screen. This indicates
that the battery level is low and that the batteries need to
be recharged.
Frequent charging of the batteries when they are not
completely empty can reduce the operating time for the
test tool.
To refresh the battery pack, do the following:
•
Be sure that the test tool is line powered.
c
Open the USER OPTIONS menu.
d
Open the BATTERY REFRESH
submenu.
e
Highlight START REFRESH.
f
Start the refresh cycle.
You can refresh the battery pack at any time. This battery
refresh cycle fully discharges and charges the battery pack.
A complete refresh cycle takes about 20 hours and should
be done at least four times a year.
Note
Be sure not to disconnect the Power Adapter
during the complete refresh cycle. Doing so will
interrupt the refresh cycle.
Note
After start of the refresh cycle, the screen will be
black. The backlight is on during discharging
within the refresh cycle.
8-3
Fluke 125
Users Manual
Replacing and Disposing of the
Rechargeable Battery Pack
Warning
To avoid electrical shock, remove the test
leads and probes before replacing the battery
pack.
Note
This instrument contains Ni-MH batteries. Do not
dispose of this battery pack with other solid
waste. Used batteries should be disposed of by a
qualified recycler or hazardous materials handler.
Contact your authorized FLUKE Service Center
for recycling information.
To replace the battery pack, do the following: (See Figure
8-2.)
1.
Disconnect the test leads and probes both at the source
and at the test tool.
2.
Disconnect the Power Adapter.
4.
Lift the battery access cover away from the test tool.
3.
Locate the battery access cover on the bottom rear.
Loosen the screw with a flat-blade screwdriver.
5.
Take the battery pack out of the battery compartment.
6.
Remove the battery plug from the connector.
7.
Install a new battery pack.
8-4
Figure 8-2. Replacing the Battery Pack
Maintaining the Test Tool
Using and Adjusting 10:1 Scope Probes
8
Note
Ensure that the battery pack is placed in the
battery compartment as shown in Figure 8-2.
8.
Reinstall the battery cover and secure the screw.
Using and Adjusting 10:1 Scope Probes
Note
The 10:1 voltage probe VPS40 that is supplied
with Fluke 125 is always adjusted correctly to the
Test Tool and needs no further adjustment.
BB120
You need to adjust other 10:1 scope probes for optimal
response.
Warning
To avoid electrical shock use the BB120
Banana-to-BNC adapter (delivered with the
test tool) to connect a 10:1 scope probe to the
input of the test tool.
Figure 8-3. Adjusting Scope Probes
To adjust probes, do the following:
•
Connect the 10:1 scope probe from the gray input B
jack to the red input A jack. Use the red 4-mm banana
adapter (delivered with the probe) and the banana-toBNC adapter (BB120). See Figure 8-3.
8-5
Fluke 125
Users Manual
c
Open the application mode menu.
d
Highlight SCOPE/METER
e
Enter the SCOPE/METER mode.
f
(A)
(B)
A square wave appears on the
screen.
Adjust the trimmer screw in the
probe housing to give an optimum
square wave.
Open the Input A or the Input B
MEASUREMENTS menu. The
F1….F4 button bar pops up.
g
Open the INPUT… menu
h
Highlight AC ADJUST…
i
Open the PROBE AC ADJUST
submenu.
j
Highlight ADJUST 10:1 PROBE.
8-6
k
l
Return to normal mode.
8
Maintaining the Test Tool
Calibration Information
Note:
Calibration Information
You can ask for the model identity (version and calibration
data) at any time. To display the identity, do the following:
c
Open the USER OPTIONS menu.
d
Open the
VERSION&CALIBRATION
submenu.
The test tool specifications are based on a one
year calibration cycle.
Parts and Accessories
Service Manual
A service manual can downloaded from Fluke’s website
www.fluke.com
Standard Accessories
The next tables list the user-replaceable parts for the
various test tool models. To order replacement parts,
contact your nearest service center.
The screen gives you information about the model number
with software version, the calibration number with latest
calibration date, and the latest battery refresh date.
e
Return to normal mode.
Recalibration must be carried out by qualified personnel
only. Contact your local Fluke representative for
recalibration.
8-7
Fluke 125
Users Manual
Standard Accessories (cont)
Item
Ordering Code
Ni-MH Battery Pack
BP120MH
Power Adapter/Battery Charger, available models:
Universal Europe 230V, 50Hz
North America 120V, 60Hz
United Kingdom 240V, 50Hz
Japan 100V, 60Hz
Australia 240V, 50Hz
Universal 115V/230V *
* UL listing applies to PM8907/808 with UL listed line plug adapter for
North America. The 230 V rating of the PM8907/808 is not for use in
North America. For other countries, a line plug adapter complying
with the applicable National Requirements must be used.
Set of two Shielded Test Leads (Red and Gray), designed for use only
with the Fluke ScopeMeter 120 series test tool.
Set contains the following replaceable part:
Ground Lead with Alligator Clip (Black)
PM8907/801
PM8907/803
PM8907/804
PM8907/806
PM8907/807
PM8907/808
STL120
5322 320 11354
One 10:1 Scope Probe VP40
VPS40 (is VP40 probe including
hook clip and ground lead)
AC Current Clamp 40 A/400 A
i400s
8-8
Maintaining the Test Tool
Parts and Accessories
8
Standard Accessories (cont)
Item
Ordering Code
Test Lead for Grounding (Black)
TL75 (red + black lead)
Set of two Hook Clips (Red and Gray)
HC120
Set of three Alligator Clips (Red, Gray, and Black)
AC120
Banana-to-BNC Adapter (Black).
BB120 (set of two)
Getting Started Manual (English, German, French, Spanish)
4822 872 30795
Getting Started Manual (English, Chinese, Japanese, Korean)
4822 872 30796
Getting Started Manual (French, Spanish, Portuguese, Italian, Dutch,
Danish, Norwegian, Swedish, Finnish, Russian)
4822 872 30797
CD-ROM with Users Manual (All languages)
4022 240 12370
Note:
all manuals can be downloaded from Fluke’s website www.fluke.com
8-9
Fluke 125
Users Manual
Optional Accessories
Item
Ordering Code
Software & Cable Carrying Case Kit (Supplied with Fluke 125/S)
SCC 120
Set contains the following parts:
OC4USB
Optically Isolated RS-232/USB Adapter/Cable
C120
Hard Carrying Case. Supplied with Fluke 125/S
®
®
®
FlukeView ScopeMeter Software for Windows
SW90W
Optically Isolated RS-232 Adapter/Cable.
PM9080
Hard Carrying Case.
C120
Compact Soft Case
C125
Isolated Trigger Probe
ITP120
Print Adapter Cable for Parallel Printers
PAC91
8-10
Chapter 9
Tips and Troubleshooting
Introduction
This Chapter gives you information and tips on how you
can make the best use of the test tool.
Using the Tilt Stand
The test tool is equipped with a tilt stand, allowing viewing
from an angle. You can also use the tilt stand to hang the
test tool at a convenient viewing position. Simply tilt the
stand and hang the test tool. Typical positions are shown
in Figure 9-1.
Figure 9-1. Using the Tilt Stand
9-1
Fluke 125
User Manual
Changing the Information Language
Setting the Grid Display
When you operate the test tool, messages appear on the
screen. These messages are always displayed in a box,
and can be displayed in various languages.
To choose a dotted grid, do the following:
If you want to change the language of the messages into
e.g. Italian, do the following:
c
Open the USER OPTIONS menu.
d
Open the LANGUAGE SELECT
submenu.
e
Highlight ITALIANO (Italian).
f
Accept ITALIANO as language.
9-2
c
Open the USER OPTIONS menu.
d
Highlight GRID TYPE.
e
Open the GRID TYPE submenu.
f
Choose DOTS.
g
Accept the new grid display.
Use LINES when you need a cross hatch pattern based on
the horizontal time and vertical divisions on the screen.
Use DOTS when you need vertical and horizontal division
dots as added reference points to the screen.
Tips and Troubleshooting
Changing Date and Time
Changing Date and Time
i
Jump to DAY.
The test tool has a date and time clock. To change the
date to (e.g.) 20 June, 2007, do the following:
j
Choose 20.
k
Jump to FORMAT.
l
Choose DD/MM/YY.
c
Open USER OPTIONS menu.
9
Accept the new date.
You can change the time in a similar way by opening the
TIME ADJUST submenu. (steps d and e.)
d
Highlight DATE ADJUST.
e
Open DATE ADJUST submenu.
f
Choose 2007.
g
Jump to MONTH.
h
Choose 06.
9-3
Fluke 125
User Manual
Saving Battery Life
When operated on the battery pack (no Power Adapter
connected), the test tool conserves power by shutting itself
down. If you have not pressed a key for at least 30 minutes,
the test tool turns itself off automatically.
e
Open the submenu.
f
Highlight AFTER 5 MINUTES
g
Accept the new power down time.
Note
If the Power Adapter is connected, there is no
automatic power shutdown.
Although automatic power shutdown will not occur if
TrendPlot is on, the backlight will dim. Recording will
continue until the battery pack is low. The remaining
battery capacity ensures that the recorded data will not be
lost.
Setting the Power Down Timer
The power shutdown time is set to 30 minutes after the last
key press. To set the power shutdown to five minutes, do
the following:
c
Open the USER OPTIONS menu.
d
Highlight POWER DOWN ...
9-4
Tips and Troubleshooting
Changing the Auto Set Options
Changing the Auto Set Options
f
On delivery or after a reset , the Auto Set function
captures waveforms from 15 Hz and faster and sets the
input coupling to DC.
g
To configure Auto Set for capturing slow waveforms down
to 1 Hz, do the following:
Note
Setting the Auto Set adjust to 1 Hz will slow down
the Auto Set response. The display will show
LF-AUTO.
c
Open the User Options menu.
d
Highlight AUTOSET ADJUST...
e
Open the AUTOSET ADJUST
submenu.
9
Highlight SIGNAL > 1 Hz.
2x
Accept the new Auto Set
configuration.
To configure Auto Set to maintain the actual input coupling
(AC or DC), continue from step 3 as follows:
f
Select COUPLING.
g
Highlight UNCHANGED.
h
Accept the new Auto Set
configuration.
9-5
Fluke 125
User Manual
Using Proper Grounding
Incorrect grounding can cause various problems. This
Section gives you guidelines for proper grounding.
z
Use the short ground lead(s) when measuring DC or
AC signals on input A and input B. (See Figure 9-2.)
Warning
To avoid electrical shock or fire, use only one
COM (common) connection , or ensure that
all connections to COM
are at the same
potential.
z
Figure 9-2. Grounding with Short Ground Lead
Use the unshielded black ground lead to COM
(common) for Ohm (Ω), Continuity, Diode, and
Capacitance measurements. (See Figure 9-3.)
Using the unshielded ground lead is also possible for
single or dual input measurements for waveforms with a
frequency up to 1 MHz. This may add some hum or
noise to the waveform display due to the unshielded
ground lead.
Figure 9-3. Grounding with Unshielded Ground Lead
9-6
Tips and Troubleshooting
Solving Printing and Other Communication Errors
Solving Printing and Other
Communication Errors
RS-232 communication may cause problems. When
experiencing communication problems, try the following
remedies:
z
Make sure that you have selected the correct printer
type. (To select printer type, see Chapter 7.)
z
Make sure that the baud rate matches with the printer
or computer. (To set the baud rate, see Chapter 7.)
z
PM9080: make sure that the interface cable is
connected to the correct port on the printer or
computer. If necessary use a 9 pin to 25 pin adapter
or gender changer.
z
OC4USB: make sure that the OC4USB cable’s COM
port matches the application program’s (e.g.
FlukeView) COM port. See also the OC4USB
Instruction Sheet.
z
OC4USB: make sure that the drivers for the USB
cable are installed properly.
9
Battery Testing of Fluke Accessories
When using battery operated Fluke accessories, always
check the battery condition of the accessory first on a
Fluke multimeter.
9-7
Fluke 125
User Manual
9-8
Chapter 10
Specifications
Introduction
Performance Characteristics
FLUKE guarantees the properties expressed in numerical
values with the stated tolerance. Specified non-tolerance
numerical values indicate those that could be nominally
expected from the mean of a range of identical
ScopeMeter test tools.
Specifications are based on a one year calibration cycle.
Environmental Data
Safety Characteristics
The test tool has been designed and tested in accordance
with Standards ANSI/ISA-82.02.01, EN 61010-1: 2001,
CAN/CSA-C22.2 No.61010-1-04 (including CCSAUS
approval), Safety Requirements for Electrical Equipment
for Measurement, Control, and Laboratory Use.
This manual contains information and warnings that must
be followed by the user to ensure safe operation and to
keep the instrument in a safe condition. Use of this
equipment in a manner not specified by the manufacturer
may impair protection provided by the equipment.
The environmental data mentioned in this manual are
based on the results of the manufacturer’s verification
procedures.
10-1
Fluke 125
Users Manual
Dual Input Oscilloscope
Vertical
Frequency Response
DC Coupled:
excluding probes and test leads (via BB120): ................
DC to 40 MHz (-3 dB)
with STL120 1:1 shielded test leads: .............................
DC to 12.5 MHz (-3 dB)
DC to 20 MHz (-6 dB)
with VP40 10:1 probe:....................................................
DC to 40 MHz (-3 dB)
Input Impedance
excluding probes and test leads .................1 MΩ//12 pF
with BB120 .................................................1 MΩ//20 pF
with STL120 .............................................1 MΩ//225 pF
with VP40 10:1 Probe.............................. 5 MΩ//15.5 pF
Sensitivity ........................................... 5 mV to 500 V/div
Display Modes...............................................A, -A, B, -B
Max. Input Voltage A and B
direct, with test leads, or with VP40 Probe ..... 600 Vrms
with BB120 ..................................................... 300 Vrms
(For detailed specifications, see “Safety”, Figs. 4-1/4-2)
Max. Floating Voltage
from any terminal to ground ........................... 600 Vrms
up to 400 Hz
AC Coupled (LF roll off):
excluding probes and test leads..............<10 Hz (-3 dB)
with STL120 ............................................<10 Hz (-3 dB)
with 10 MΩ 10:1 Probe .............................<1 Hz (-3 dB)
Resolution ................................................................ 8 bit
Rise Time
excluding probes, test leads............................. <8.75 ns
Max. Vertical Move ....................................... ±4 divisions
10-2
Vertical Accuracy ........................±(1% + 0.05 range/div)
10
Specifications
Dual Input Oscilloscope
Horizontal
Trigger
Scope Modes................................... Normal, Single, Roll
Screen Update ...............................Free Run, On Trigger
Ranges
Normal:
equivalent sampling ........................ 10 ns to 500 ns/div
real time sampling ....................................1 μs to 5 s/div
Single (real time) ......................................1 μs to 5 s/div
Roll (real time)..........................................1s to 60 s/div
Source ..............................................................A, B, EXT
EXTernal via optically isolated trigger probe ITP120
(optional accessory)
Sampling Rate (for both channels simultaneously)
Equivalent sampling (repetitive signals) .........................
up to 1.25 GS/s
Real time sampling:
1 μs to 5 ms/div ...........................................25 MS/s
10 ms to 60 s/div ...........................................5 MS/s
Time Base Accuracy
Equivalent sampling ................... ±(0.4% +0.04 time/div)
Real time sampling..................... ±(0.1% +0.04 time/div)
Sensitivity A and B
@ DC to 5 MHz ............................ 0.5 divisions or 5 mV
@ 40 MHz .................................................. 1.5 divisions
@ 60 MHz ..................................................... 4 divisions
Slope ................................................... Positive, Negative
Video on A .......................... interlaced video signals only
Modes ............................................... Lines, Line Select
Standards .......................... PAL, NTSC, PAL+, SECAM
Polarity .............................................. Positive, Negative
Sensitivity ..........................................0.6 divisions sync.
Glitch Detection ..................≥40 ns @ 20 ns to 5 ms/div
≥200 ns @ 10 ms to 60 s/div
Glitch detection is always active.
Horizontal Move ........................................... 10 divisions
Trigger point can be positioned anywhere across the
screen.
10-3
Fluke 125
Users Manual
Advanced Scope Functions
Dual Input Meter
Display Modes
Normal ....... Captures up to 40 ns glitches and displays
analog-like persistence waveform.
Smooth ...... Suppresses noise from a waveform.
Envelope.... Records and displays the minimum and
maximum of waveforms over time.
The accuracy of all measurements is within ± (% of
reading + number of counts) from 18 °C to 28 °C.
Add 0.1x (specific accuracy) for each °C below 18 °C or
above 28 °C. For voltage measurements with 10:1 probe,
add probe uncertainty +1%. More than one waveform
period must be visible on the sceen.
Auto Set (Connect-and-View™)
Continuous fully automatic adjustment of amplitude, time
base, trigger levels, trigger gap, and hold-off. Manual
override by user adjustment of amplitude, time base, or
trigger level.
Input A and Input B
DC Voltage (VDC)
Ranges.........................500 mV, 5V, 50V, 500V, 1250V
Accuracy .......................................... ±(0.5% +5 counts)
Normal Mode Rejection (SMR)...........................>60 dB
@ 50 or 60 Hz ±1%
Common Mode Rejection (CMRR)........ >100 dB @ DC
>60 dB @ 50, 60, or 400 Hz
Full Scale Reading .....................................5000 counts
True RMS Voltages (VAC and VAC+DC)
Ranges.........................500 mV, 5V, 50V, 500V, 1250V
Accuracy for 5 to 100% of range
DC coupled:
DC to 60 Hz (VAC+DC) ............... ±(1% +10 counts)
1 Hz to 60 Hz (VAC) .................... ±(1% +10 counts)
10-4
10
Specifications
Dual Input Meter
AC or DC coupled:
60 Hz to 20 kHz........................ ±(2.5% +15 counts)
20 kHz to 1 MHz.......................... ±(5% +20 counts)
1 MHz to 5 MHz......................... ±(10% +25 counts)
5 MHz to 12.5 MHz.................... ±(30% +25 counts)
5 MHz to 20 MHz (excl. test leads or probes)..........
±(30% +25 counts)
AC coupled with 1:1 (shielded) test leads
60 Hz (6 Hz with 10:1 probe) .......................... -1.5%
50 Hz (5 Hz with 10:1 probe) ............................. -2%
33 Hz (3.3 Hz with 10:1 probe) .......................... -5%
10 Hz (1 Hz with 10:1 probe) ........................... -30%
DC Rejection (only VAC).................................... >50 dB
Common Mode Rejection (CMRR)........ >100 dB @ DC
>60 dB @ 50, 60, or 400 Hz
Full Scale Reading ..................................... 5000 counts
The reading is independent of any signal crest factor.
Peak
Modes ........................ Max peak, Min peak, or pk-to-pk
Ranges.........................500 mV, 5V, 50V, 500V, 1250V
Accuracy:
Max peak or Min peak ........................ 5% of full scale
Peak-to-Peak ................................... 10% of full scale
Full Scale Reading ....................................... 500 counts
Frequency (Hz)
Ranges................. 1 Hz, 10 Hz, 100 Hz, 1 kHz, 10 kHz,
100 kHz,1 MHz, 10 MHz, and 70 MHz
Frequency Range in Continuous Autoset ......................
15 Hz (1 Hz) to 50 MHz
Accuracy:
@1 Hz to 1 MHz ............................ ±(0.5% +2 counts)
@1 to 10 MHz ............................... ±(1.0% +2 counts)
@10 to 70 MHz.............................. ±(2.5% +2 counts)
(50 MHz in Autorange)
Full Scale Reading ..................................10 000 counts
RPM
Max reading ................................................. 50.00 kRPM
Accuracy ............................................. ±(0.5% +2 counts)
Duty Cycle (PULSE)
Range...........................................................2% to 98%
Frequency Range in Continuous Autoset ......................
15 Hz (1 Hz) to 30 MHz
Accuracy (Logic or Pulse waveforms):
@1Hz to 1 MHz ............................. ±(0.5% +2 counts)
@1 MHz to 10 MHz ....................... ±(1.0% +2 counts)
Pulse Width (PULSE)
Frequency Range in Continuous Autoset ......................
15 Hz (1 Hz) to 30 MHz
Accuracy (Logic or Pulse waveforms):
@1 Hz to 1 MHz ............................ ±(0.5% +2 counts)
@1 MHz to 10 MHz ....................... ±(1.0% +2 counts)
Full Scale Reading ..................................1000 counts
10-5
Fluke 125
Users Manual
Amperes (AMP) ..................................with current clamp
Ranges ......... same as VDC, VAC, VAC+DC, or PEAK
Scale Factors ..0.1 mV/A, 1 mV/A, 10 mV/A, 100 mV/A,
400 mV/A, 1 V/A, 10 mV/mA
Accuracy ....... same as VDC, VAC, VAC+DC, or PEAK
(add current clamp uncertainty)
Temperature (TEMP).... with optional temperature probe
Range ........................................200 °C/div (200 °F/div)
Scale Factor................................ 1 mV/°C and 1 mV/°F
Accuracy ............as VDC (add temp. probe uncertainty)
Decibel (dB)
0 dBV ........................................................................ 1V
0 dBm (600Ω /50Ω).............................................. 1 mW
referenced to 600Ω or 50Ω
dB on ...................................... VDC, VAC, or VAC+DC
Full Scale Reading..................................... 1000 counts
Crest Factor (CREST)
Range .................................................................1 to 10
Accuracy ............................................... ±(5% +1 count)
Full Scale Reading....................................... 100 counts
Phase
Modes ...................................................... A to B, B to A
Range .................................................0 to 359 degrees
Accuracy up to 1 MHz....................................2 degrees
Accuracy 1 MHz to 5 MHz .............................5 degrees
Resolution ....................................................... 1 degree
10-6
Power
Configurations ...................................................1 phase
.......................... 3 phase 3 conductor balanced loads
(3 phase: fundamental component only,
AUTOSET mode only)
Power Factor (PF) ............. ratio between Watts and VA
Range...................................................... 0.00 to 1.00
Watt.....................................RMS reading of multiplying
corresponding samples of input A (volts)
and input B (amperes)
Full Scale reading......................................999 counts
VA .............................................................Vrms x Arms
Full Scale Reading ....................................999 counts
VA Reactive (VAR)..................................... √((VA)2-W2)
Full Scale Reading ....................................999 counts
Vpwm
Purpose.............. to measure on pulse width modulated
signals, like motor drive inverter outputs
Principle ...... readings show the effective voltage based
on the average value of samples over a
whole number of periods of the fundamental
frequency
Accuracy ......................... as Vrms for sinewave signals
10
Specifications
Dual Input Meter
Input A
Ohm (Ω)
Ranges......................50Ω, 500Ω, 5 kΩ, 50 kΩ, 500 kΩ,
............................................................. 5 MΩ, 30 MΩ
Accuracy: ......................................... ±(0.6% +5 counts)
.........................................50 Ω ±(2 % + 20 counts)
Full Scale Reading:
50 Ω to 5 MΩ........................................... 5000 counts
30 MΩ ..................................................... 3000 counts
Measurement Current ..........................0.5 mA to 50 nA
decreases with increasing ranges
Open Circuit Voltage ............................................... <4V
Continuity (CONT)
Beep..................................... <(30Ω ±5Ω) in 50 Ω range
Measurement Current ........................................ 0.5 mA
Detection of shorts of ..........................................≥1 ms
Diode
Measurement Voltage:
@0.5 mA ...........................................................>2.8V
@open circuit........................................................<4V
Accuracy.............................................. ±(2% +5 counts)
Measurement Current.........................................0.5 mA
Polarity ..................................... + on input A, - on COM
Capacitance (CAP)
Ranges ................. 50 nF, 500 nF, 5 μF, 50 μF, 500 μF
Accuracy............................................ ±(2% +10 counts)
Full Scale Reading .....................................5000 counts
Measurement Current............................ 5 μA to 0.5 mA
increases with increasing ranges
Dual slope integrating measurement with parasitic
serial and parallel resistance cancellation.
10-7
Fluke 125
Users Manual
Advanced Meter Functions
Cursor readout
Zero Set
Set actual value to reference
Sources:
A, B
Fast/Normal/Smooth
Meter settling time Fast: 1s @ 1 μs to 10 ms/div.
Meter settling time Normal: 2s @ 1 μs to 10 ms/div.
Meter settling time Smooth: 10s @ 1 μs to 10 ms/div.
Single Vertical Line:
Average, Min and Max Readout
Average, Min, Max and Time from Start of Readout (in
ROLL mode; instrument in HOLD)
Min, Max and Time from Start of Readout (in
TRENDPLOT mode; instrument in HOLD)
Touch Hold (on A)
Captures and freezes a stable measurement result.
Beeps when stable. Touch Hold works on the main
meter reading, with thresholds of 1 Vpp for AC signals
and 100 mV for DC signals.
TrendPlot
Graphs meter readings of the Min and Max values from
15 s/div (120 seconds) to 2 days/div (16 days) with time
and date stamp. Automatic vertical scaling and time
compression.
Displays the actual and Minimum, Maximum, or average
(AVG) reading.
Fixed Decimal Point
Possible by using attenuation keys.
10-8
Dual Vertical Lines:
Peak-Peak, Time Distance and Reciprocal Time
Distance Readout
Average, Min, Max and Time Distance Readout (in
ROLL mode; instrument in HOLD)
Dual Horizontal Lines:
High, Low and Peak-Peak Readout
Rise or Fall Time:
Transition Time, 0%-Level and 100%-Level Readout
(Manual or Auto Leveling; Auto Leveling only possible in
Single Channel Mode)
Accuracy:
As Oscilloscope Accuracy
10
Specifications
Harmonics Measurements
Harmonics Measurements
Number of Harmonics
......................................................... DC..33 (< 60 Hz)
.......................................................... DC..24 (400 Hz)
Readings / Cursor readings (fundamental 40…70 Hz)
V rms / A rms ......................... fund. ±(3 % + 2 counts)
................................................ 33st ±(5 % + 3 counts)
Watt...................................... fund. ±(5 % + 10 counts)
............................................ 33st ±(10 % + 10 counts)
Frequency of fundamental............................± 0.25 Hz
Phase Angle............................ fund. ±3° ... 33st ± 15°
K-factor (in Amp and Watt)...............................± 10 %
Time base .............................................................. fixed
Field Bus Measurements
Type
AS-i
CAN
Interbus S
ControlNet
Modbus
Foundation
Fieldbus
Profibus
Ethernet
RS-232
RS-485
Subtype
RS-485
RS-232
RS-485
H1
DP
PA
Coax
TP
Protocol
NEN-EN50295
ISO-11898
EIA-485
61158 type 2
RS-232/EIA-232
RS-485/EIA-485
61158 type 1, 31.25 kBit/s 1 MBit/s - 2.5 MBit/s
EIA-485
61158 type 1
10Base2
10BaseT
EIA-232
EIA-485
10-9
Fluke 125
Users Manual
Miscellaneous
Display
Size.....................................72 x 72 mm (2.83 x 2.83 in)
Resolution ............................................ 240 x 240 pixels
Waveform Display:
Vertical ............................................. 8 div of 20 pixels
Horizontal...................................... 9.6 div of 25 pixels
Backlight .................. Cold Cathode Fluorescent (CCFL)
Power
External:..............................via Power Adapter PM8907
Input Voltage..........................................10 to 21V DC
Power..........................................................5W typical
Input Connector...........................................5 mm jack
Internal:............................... via Battery Pack BP120MH
Battery Power.................... Rechargeable Ni-MH 4.8V
Operating Time ............... 6 hours with bright backlight
6.30 hours with dimmed backlight
Charging Time ...................... 7 hours with test tool off
60 hours with test tool on
12 .. 20 hours with refresh cycle
Allowable ambient temperature:
during charging.................. 0 to 45 °C (32 to 113 °F)
10-10
Memory
Number of Data set Memories ..................................20
Mechanical
Size .......................232 x 115 x 50 mm (9.1 x 4.5 x 2 in)
Weight .................................................... 1.2 kg (2.5 lbs)
including battery pack
Interface ...................................RS-232, optically isolated
To Printer ..........................supports Epson FX, LQ, and
®
®
HP Deskjet , Laserjet , and Postscript
Serial via PM9080 (optically isolated RS-232
adapter/cable, optional).
Parallel via PAC91 (optically isolated print adapter
cable, optional).
To PC ........................ Dump and load settings and data
Serial via OC4USB (optically isolated RS-232/USB
®
adapter/cable, optional), using SW90W (FlukeView
®
software for Windows ).
10
Specifications
Environmental
Environmental
Environmental ....................... MIL-PRF-28800F, Class 2
Temperature
Operating ................................ 0 to 50 °C (32 to 122 °F)
Storage .................................-20 to 60 °C (-4 to 140 °F)
Humidity
Operating:
@0 to 10 °C (32 to 50 °F)..................noncondensing
@10 to 30 °C (50 to 86 °F)................................. 95%
@30 to 40 °C (86 to 104 °F).................................75%
@40 to 50 °C (104 to 122 °F)...............................45%
Storage:
@-20 to 60 °C (-4 to 140 °F) ...............noncondensing
Altitude
Operating ..........................................5 km (16 400 feet)
Max. Input and Floating Voltage 600 Vrms upto 2 km,
> 2 km 300 Vrms <5 km.
Storage ........................................... 12 km (40 000 feet)
Vibration (sinusoidal) ....................................................
........... MIL28800F, class 2, 3.8.4.2, 4.5.5.3.1: Max. 3g
Shock ...............................................................................
......... MIL28800F, class 2, 3.8.5.1, 4.5.5.4.1: Max. 30g
Electromagnetic Compatibility (EMC)
Emission......................................... EN 50081-1 (1992):
EN55022 and EN60555-2
Immunity......................................... EN 50082-2 (1992):
IEC1000-4-2, -3, -4, -5
(See also Tables 1 to 3)
Enclosure Protection .......................... IP51, ref: IEC529
Safety
Designed for measurements on 600 Vrms Measurement
Category III, Pollution Degree 2, per:
•
ANSI/ISA S82-02.01
•
EN/IEC 61010-1: 2001
•
CAN/CSA-C22.2 No.61010-1-04 (including CCSAUS
approval)
Max. Input Voltage Input A and B
Direct on input or with leads .......................... 600 Vrms
for derating, see Figure 10-1.
With Banana-to BNC Adapter BB120 ............. 300 Vrms
for derating, see Figure 10-1.
Max. Floating Voltage
from any terminal to ground............................ 600 Vrms
up to 400 Hz
10-11
Fluke 125
Users Manual
Figure 10-1. Max. Input Voltage v.s. Frequency for
BB120 and STL120
10-12
Figure 10-2. Max. Input Voltage v.s. Frequency for
VP40 10:1 Voltage Probe
10
Specifications
Safety
The Fluke 125, including standard accessories, conforms with the EEC directive 89/336 for EMC immunity, as defined by
IEC1000-4-3, with the addition of the following tables.
Trace disturbance with STL120
Table 1
No visible disturbance
Frequency range 10 kHz to 27 MHz
Frequency range 27 MHz to 1 GHz
E= 3 V/m
E= 10 V/m
100 mV/div to 500 V/div
100 mV/div to 500 V/div
500 mV/div to 500 V/div
100 mV/div to 500 V/div
Table 2
Disturbance less than 10% of full scale
Frequency range 10 kHz to 27 MHz
Frequency range 27 MHz to 1 GHz
E= 3 V/m
E= 10 V/m
20 mV/div to 50 mV/div
10 mV/div to 20 mV/div
100 mV/div to 200 mV/div
-
(-): no visible disturbance
Test tool ranges not specified in tables 1 and 2 may have a disturbance of more than 10% of full scale.
10-13
Fluke 125
Users Manual
Multimeter disturbance:
•
•
VDC, VAC, and VAC+DC with STL120 and short ground lead.
OHM, CONT, DIODE, and CAP with STL120, and black test lead to COM.
Table 3
Disturbance less than 1% of full scale
E= 3 V/m
E= 10 V/m
Frequency range 10 kHz to 27 MHz
VDC, VAC, VAC+DC
OHM, CONT, DIODE
CAP
500 mV to 1250V
50 Ω to 30 MΩ
50 nF to 500 μF
500 mV to 1250V
50 Ω to 30 MΩ
50 nF to 500 μF
Frequency range 27 MHz to 1 GHz
VDC, VAC, VAC+DC
OHM, CONT, DIODE
CAP
500 mV to 1250V
50 Ω to 30 MΩ
50 nF to 500 μF
500 mV to 1250V
50 Ω to 30 MΩ
50 nF to 500 μF
Test tool ranges not specified in table 3 may have a disturbance of more than 10% of full scale.
10-14
Index
—1—
10 :1 Probe, 2-25
—A—
AC coupling, 0-4
AC120 Alligator Clips, 8-9
Accessories, 8-7
AC-Coupling, 2-16
Acquiring the Waveform, 2-14
Acquisition Modes, 10-3
Adjusting Scope Probes, 8-5
Advanced Meter Functions, 10-8
Advanced Scope Functions, 10-4
Alligator Clips, 8-9
Altitude, 10-11
Amperes Measurement, 10-6
Amplitude, 2-10
Auto Set, 2-3, 10-4
Auto Set Configuration, 9-5
Auto/Manual, 2-10
Automatic Power Shutdown, 9-4
Avoid Electrical Shock, 1-5
—B—
Backlight, 1-3
Banana Jack Inputs, 1-5
Banana-to-BNC Adapter, 8-9
Bandwidth, 10-2
Battery Charger, 8-8
Battery Disposing, 8-4
Battery Indicator, 1-1, 2-2
Battery Life, 9-4
Battery Pack, 0-2, 8-2, 8-8
Battery Power, 10-10
battery refresh, 8-3
Battery Refresh Date, 8-7
Battery Replacing, 8-4
BB120 Adapters, 8-9
Blue Function Keys, 2-2
BP120MH Battery Pack, 8-8
Bright Display, 1-3
Bus test limits, 4-4
bus type, 4-2
BUSHEALTH, 4-2
—C—
C120 Hard Case, 8-10
C125 Compact Soft Case, 8-10
Capacitance, 9-6, 10-7
Case, 8-10
Cat.III, 0-6
1
Fluke 125
Users Manual
Caution, 0-4
Changing the Amplitude, 2-10
Changing the Time Base, 2-10
Charge Time, 10-10
Charger, 8-8
Charging, 8-2
Cleaning, 8-1
Common, 1-5
Communication Errors, 9-7
Compact Soft Case, 8-10
Computer, 3
Connect-and-View function, 2-3
Connecting a Computer, 4
Connecting the Inputs, 2-4
Continuity, 9-6, 10-7
Contrast, 1-3
Crest Factor, 10-6
Current Measurement, 10-6
Cursors, 2-22, 10-8
—D—
Data set, 6-1
Dataset name, 6-2
Date, 9-3
DC Voltage (VDC), 10-4
DC-Coupling, 2-16
Decibel (dB), 10-6
2
Declaration of Conformity, 0-1
Deleting Data Sets, 6-3
Dimmed Display, 1-3
Diode, 9-6, 10-7
Display, 10-10
Disposing Batteries, 8-4
Duty Cycle, 10-5
FlukeView, 3, 8-10
FREE RUN, 2-19
Freeze Recording, 2-15
Freezing the Screen, 2-8
Frequency (Hz), 10-5
Frequency Response, 10-2
Function Keys, 2-2
—E—
—G—
Earth Ground, 0-6
Electrical Shock, 0-5
Electrically Floating, 0-6
Electromagnetic Compatibility, 0-1,
10-11
Emission, 10-11
Envelope, 10-4
Envelope of a Waveform, 2-13
Environmental, 10-11
Environmental Data, 10-1
Eye pattern, 4-7
Glitch Detection, 10-3
glitches, 10-4
Gray Text, 1-4, 2-19
Grey INPUT B, 1-5
Grid Display, 9-2
ground, 0-6
Ground Test Lead, 8-9
Grounding Problems, 9-6
—F—
Fast/Smooth, 10-8
Field Bus Measurements, 10-9
Fieldbus, 4-1
Fixed Decimal Point, 10-8
—H—
Hard Carrying Case, 8-10
Harmonics, 3-1
Harmonics Measurements, 10-9
HC120 Hook Clips, 8-9
High Frequency Measurements, 2-25
Holding a Stable Reading, 2-8
Hook Clips, 8-9
Index (continued)
Horizontal Cursors, 2-22
Horizontal Move, 10-3
Humidity, 10-11
Hz, 10-5
—M—
—O—
OC4USB, 3, 8-10
Ohm (Ω), 9-6, 10-7
Operating Time, 10-10
Optical Interface, 7-1, 7-3, 10-10
K-factor, 3-1, 3-5
Maintenance, 8-1
Making Measurements, 2-4
Manual, 8-9
Manual Override, 10-4
Manual Ranges, 2-10
Max. Floating Voltage, 0-6, 10-2, 1011
Max. Input Voltage, 10-2, 10-11
Max. Input Voltages, 0-6
Maximum (MAX) Reading, 5-3
Measurement Category III, 0-6
Measurement Connections, 1-5
Measurements, 2-4
Mechanical, 10-10
mechanical damage, 0-5
Memory, 10-10
Menu Area, 2-2
Meter A Measurement, 2-6
Meter B Measurement, 2-6
Min Max Reading, 5-3
Multimeter Disturbance, 10-14
—L—
—N—
Language, 9-2
Level, 2-17
Ni-MH Battery Pack, 0-2, 8-2
—I—
Immunity, 10-11
Information Language, 9-2
Input A, 1-5
Input B, 1-5
Input Coupling, 2-16
Input Impedance, 10-2
insulated
isolated, 0-5
Isolated, 0-6
Isolated Trigger Probe, 2-19, 8-10
Isolated Triggering, 2-19
ITP120, 2-19, 8-10
—K—
—P—
PAC91, 8-10
Parallel Print Cable, 8-10
Parallel Printer, 2
Parts, 8-7
Peak, 10-5
Performance Characteristics, 10-1
Phase, 10-6
PM8907, 8-8
PM9080, 1, 8-10
Polarity, 2-16
Positioning the Waveform, 2-11
Power Adapter, 8-8, 9-4
Power Down Timer, 9-4
Power Measurement, 10-6
Powering the Test Tool, 1-1
Print Cable, 8-10
Printing, 7-1
Printing Errors, 9-7
Probe, 8-5, 8-8, 10-2
3
Fluke 125
Users Manual
Probe 10:1, 2-25
Probe Adjustment, 2-25
Probe Attenuation, 2-25
Probe Settings, 1-6
Pulse Width, 10-5
—R—
Reading Area, 2-2, 2-4
Reading the Screen, 2-2
Recalibrating, 8-7
Recalling Data Sets, 6-3
Record a Waveform, 2-13
Recording Slow Signals, 2-15
recycling information, 0-4
Red INPUT A, 1-5
Refreshing the Batteries, 8-7
Relative Measurements, 2-9
Renaming Data Sets, 6-3
Replaceable Parts, 8-7
Replacing Batteries, 8-4
Resetting the Test Tool, 1-2
Reversing the Polarity, 2-16
Rise Time, 10-2
Rise Time Measurements, 2-24
RMS Voltages, 10-4
Roll Mode Function, 2-15
4
RPM, 2-6, 10-5
RS-232 Adapter/Cable, 1, 8-10
RS-232 Communication Errors, 9-7
RS-232/USB Adapter/Cable, 3
—S—
Safety, 10-11
Safety Characteristics, 10-1
Safety Precautions, 0-4
Safety Requirements, 0-1
Sampling Rate, 10-3
Saving Data Sets, 6-1
SCC 120, 3, 8-10
Scope Modes, 10-3
Scope Probes, 8-8
Scope/Meter Mode, 2-1
Sensitivity, 10-2
Serial Printer, 2
Service Manual, 8-7
Shielded Test Leads, 8-8
Shock, 10-11
Single Shot, 2-14
Slope, 2-17, 10-3
Slow Signals, 2-15
Smooth, 2-12, 10-4
Software, 8-10
Software Version, 8-7
Specifications, 10-1
Stable Reading, 2-8
Stand, 9-1
STL120 Test Leads, 8-8
Storing, 8-1
SW90W Software, 7-3, 8-10
—T—
Temperature Measurement, 10-6
Temperature, Environmental, 10-11
Test Leads, 8-8
Test Limits, 4-8, 4-9
THD, 3-1, 3-5
Tilt Stand, 9-1
Time, 9-3
Time Base, 2-10
Time Base Accuracy, 10-3
Time Base Ranges, 10-3
time measurement, 2-23
TL75, 8-9
Touch Hold® function, 2-8, 10-8
Trace Disturbance, 10-13
TrendPlot™ function, 10-8
TrendPlot™ Function, 5-1
Trigger, 10-3
Trigger Icons, 2-17
Trigger Level, 2-17
Index (continued)
Trigger Parameters, 2-18
Trigger Sensitivity, 10-3
Triggering, 2-17
True RMS Voltages, 10-4
—Z—
Zero Reference, 2-9
—U—
Unpacking, 0-2
USB Adapter/Cable, 8-10
User Manual, 8-9
Using a Printer, 7-1
Using FlukeView Software, 3
—V—
Vertical Accuracy, 10-2
Vertical Cursors, 2-23
Vibration, 10-11
Video Line, 2-21
Video on A, 10-3
Video Signals, 2-20
VP40 Probe, 2-25
VPS40 Probe Set, 8-8
Vpwm Measurement, 10-6
—W—
Warning, 0-4
Waveform Area, 2-2
5