1
Gould 400 Series
Digital Storage Oscilloscopes
Operators Manual
Gould 400 Series
Digital Storage Oscilloscopes
Operators Manual
Copyright@1990 Gould lnc., Instruments Division
(Gould Electronics Ltd.)
400 Operators Manual
Contents
Introduction
Getting Started
1
Advanced Features
2
The Menus
3
Performance Checking
4
Waveform Processing
5
Battery Unit Operation
6
Alphabetical Summary
7
Appendix 1 Error Messages
A1
Appendix 2 Specification
A2
Appendix 3 Remote
Operation
A3
Appendix 4 Front & Back
Pictures
I Service Facilities
Contents
400 Operators Manual
Introduction
2.5
1. Getting Started
1.1 Safety and Power Requirements
1.1.1 International Safety Warning
1.1.2 Grounding
1.1.3 Live Parts
1.1.4 Ventilation and Dust
1.1.5 Operating Temperatures
1.1.6 Power & Frequency
Requirements
1.1.7 Fuse Requirements
1.2 Using the Buttons
1.3 Start-Up Display
1.4 Obtaining a Trace
1.4.1 AUTO SETUP
1.4.2 Channel Selection (Off/On/lnv)
1.4.3 Coupling (AC/DC/Gnd)
2.6
Data Transfer
2.6.1
Syntax
2.6.2
Receiving Data
2.6.3
Error Status
2.7
Real Time Clock
3.1
Additional Buttons
3.1.1
The Numeric Buttons
3.1.2
Menu Traces
3.1.3
Control
3.1.4
Post Store
3.2
3.3
Control Master Menu
Status Menu
3.3.1
Mode
3.3.2
Max/Min
3.3.3
V/Div
3.3.4
Probe set
3.3.5
Timebase
3.3.6
Trigger
3.4
Display and Trigger Menu
3.4.1
Probe ratio
3.4.2
Max/Min
3.4.3
Dot Join
3.4.4
Averaging
3.4.5 Trig Pos'n
3.5
3.6
3.7
Display Intensity
Reference Trace
RS423 Interface Menu
3.7.1
RS423 Plot Connections
3.7.2
RS423 Data Connections
1.6 Vertical Adjustments
1.6.1 VOLTS/DIVISION
1.6.2 Position
1.6.3 Variable/Uncalibrated
1.6.4 Add
1.7 Manually Obtaining a Trace
1.8 Operating Hints
1.8.1 Intensities too low
1.8.2 Trace off the top or bottom
of screen
1.8.3 Trace not being acquired
1.8.4 Trace unstable
1.8.5 Trace has flat top or bottom
Advanced Features
2.1 Trigger Control
2.1.1 Selecting Source and Coupling
2.1.2 Level
2.1.3 Trigger Point (T)
2.1.4 Slope (+/-)
2.1.5 Trigger Mode (Norm/Auto)
2.1.6 Trigger Delay
2.2 Capture Facilities
2.2.1 Trace Hold
2.2.2 S/Shot and Run
2.2.3 Acquisition Status-AFTS
2.3 Display Modes
2.4 Cursor Measurements
2.4.1 Cursor and Datum Selection
2.4.2
The Cursor& Datum Lines
2.4.3 Making Measurements
Internal Colour Plotter
O
Pens ti
Pen Changing
Paper Selection
Paper Loading
Internal plotting
External plots
Plot positioning and scaling
3. The Menus
1.5 Horizontal Adjustments
1.5.1 TIME/DIVISION
1.5.2 Aliases
1.5.3 Position
1.5.4 Magnification
2.
Plot
2.5.1
2.5.2
2.5.3
2.5.4
2.5.5
2.5.6
2.5.7
2.5.8
3.8 Special Functions Menu
3.9 Post Store Master Menu
3.10 Save Trace Menu
3.11 Recall Memory Menu
3.12 Plot Menu
4.
Performance checking
4.1 Risetime
4.2 Bandwidth
4.3 Trigger sensitivity
4.4 Trigger bandwidth
4.5 Timebase calibration
4.6 Vertical Calibration
4.7
Max-Min (Alias Detector)
Contents
400 Series Operators Manual
5.
Waveform Processing Functions
5.1 Cursor Measurements
Single Function Buttons
Voltage and Time
1.2b
The Toggles
5.1.2
Peak-Peak
1.2c
Pressure Sensitive Buttons
5.1.3
Max-Min
1.3
Start-Up Display
5.1.4
Risetime (falltime)
1.4
Obtaining a trace
5.1.5
Overshoot (preshoot)
1.4.1
An AUTO SETUP Display
5.1.6
Pulse Width
1.5
Horizontal Controls
5.1.7
Frequency, Period, Duty Cycle
1.5.2
Alias Generation
5.1.8
RMS
1.6
Vertical Controls
5.1.9
Area
2.1
Trigger Controls
2.1.6
Trace Capture with Delay
2.2
Capture Controls
5.2.1
Filter Frequency
2.4
The Cursor and Datum Line Controls
5.2.2
Filter Current Trace
2.4.2
The Cursor and Datum Lines
5.2.3
Invert Current Trace
2.5.5
Paper Loading
5.2.4
Integrate Signal
2.5.8a
Relative Plot Positions
5.2.5
Integrate Current Trace
2.5.8b
Plot Dimensions
3
Menu Overview
3.1
Numeric Buttons
3.2
Control Master Menu
3.3
A Status Menu
5.3 Trace arithmetic
5.4 Persistence/Limits Testing
7.
1.2a
5.1.1
5.2 Trace Manipulation
6.
Figure List
5.4.1
Limits
3.4
A Display and Trigger Menu
5.4.2
Persistence
3.5
Display Intensity Menu
3.6
Reference Trace Menu
3.7
An RS423 Interface Menu
3.7.1
400to Gould 6120 or HP7475 Connections
3.7.2a
400 to IBM-PC/XT Connections
3.7.2b
400 to IBM-PC/AT Connections
3.8
Special Functions Menu
3.9
Post Storage Master Menu
3.10
Save Trace Menu
3.11
Recall Trace Menu
3.12
Plot Menu
5.1a
Cursor Measurements Menu
5.1b
Example of Calculations on trace
5.1.1
Voltage and Time Measurement
5.1.2
Peak to Peak Measurement
5.1.3
Max-Min Measurement
5.1.4
Risetime Measurement
5.1.5
Overshoot Measurement
5.1.6
Pulse Width Measurement
5.1.7
Freq. Period and Duty Cycle Measurement
5.1.9
Area Measurement
5.2
Trace Manipulation Menu
5.4
Persistence/Limits Testing Menu
6
Battery Unit Interconnections
6.2
Battery Unit Front Panel Indicators
A2
400 Series Dimensions
A3.2
DC Power Connections
A4a
A4b
A4c
Rear View
RS423 Connections
Front Panel Controls
Battery Unit Operation
Alphabetical Summary of controls
Appendix 1: Error Messages
Appendix 2: Specification
Appendix 3: Remote DC operation of the DSO
Appendix 4: Front and Back Pictures
Service Facilities
400 Operators Manual
Introduction
Introduction
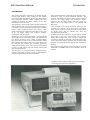
The Gould 400 series instruments are Digital Storage
Oscilloscopes (DSOs). They include all the features
expected of advanced modern oscilloscopes designed for
the professional engineer, whilst retaining the userfriendliness essential for those learning to use such
instruments for the first time.
The 400 range consists of three basic models; the 400 the
420 and the 450. All versions can be fitted with a battery
unit which provides the instrument with a fully automatic
built in Nickel Cadmium battery and charger which
allows uninterrupted operation of the DSO in the event
of an AC supply failure and complete operation
independent of an AC supply.
Obtaining a trace is especially simple - just connect the
signal and press the Auto Setup button - the 400 does the
rest. Having obtained a trace, readily accessible datum
lines and a cursor make it easy to take automatic timing
and voltage measurements directly from the display. On
the 420 and 450 models, the waveform processing
function increases the power of the cursor measurements
in terms of both capture and post storage analysis and
measurement functions.
More advanced features of the 400 series include a comprehensive range of menu-controlled functions. For
example, the Display and Trigger menu operates features
such as the trigger delay and pre-trigger display
functions. The pre-trigger display function allows the
signal prior to the trigger point to be captured and
displayed.
Three complete traces can be stored for future use and
recalled to the display via the Save Trace and Recall
Trace menus respectively. With the built in battery back
up facility, these will be retained even when the
instrument is switched off.
In addition to the above features, the 420 and 450 instruments have a built in 4 colour plotter and a battery
backed Real Time Clock. This provides a simple and
convenient method of obtaining permanent hard copy
plots of the screen display. The plots will contain the date
and time of acquisition together with the date and time of
plotting.
The 450 has all the features of the 420 and has a signal
bandwidth of 50MHz and an extra timebase range of
50ns/div.
The innovative use of ergonomically designed pressure
sensitive push button controls provides a combination of
precision and flexibility for ease of operation.
Numbers circled in the text refer to the controls shown
on the front panel picture in Appendix 3.
Getting Started 1.1-1.1.6
1.1 Safety and Power Requirements
1.1.1 International Safety Warning
(as required for I.E.C. 348 Cat I)
This instrument has been designed and tested in accordance
with IEC publication 348, and has been supplied in a safe
condition. This manual contains information and warnings
which must be observed to keep the instrument in a safe
condition. The instrument should not be switched on if it is
damaged and it should not be used under wet conditions.
For the correct and safe use of this instrument it is essential that
both operating and service personnel follow generally accepted
safety procedures in addition to the safety precautions specified
in this manual.
Whenever it is likely that safety-protection has been impaired,
the instrument must be made inoperative and be secured against
any unintended operation. Qualified maintenance or repair
personnel should be informed. Safety protection is likely to be
impaired if, for example the instrument shows visible damage
or fails to perform the intended measurements correctly.
1.1.2 Grounding
THE INSTRUMENT MUST BE GROUNDED.
AC
The instrument must be operated with a protective ground
connected via the yellow/green conductor of the supply cable.
This is connected to the instrument before the line and neutral
connections when the supply plug is inserted into the socket on
the back of the instrument. If the final connection to the supply
is made elsewhere, ensure that the ground connection is made
before line and neutral.
400 Series Operators Manual
they should be removed only by suitably qualified personnel
for maintenance and repair purposes.
WARNING: Removing the covers may expose voltages in
excess of 8000V at the side of the display tube; these
may be present for up to one minute after the
instrument has been disconnected from the power
source.
1.1.4 Ventilation and Dust
The instrument relies on forced air cooling via a fan and
ventilation slots. Adequate ventilation can usually be achieved
by leaving a 75mm (3" gap) around the instrument.
The instrument should not be operated in dusty environments.
If the CRT filter requires cleaning it can be easily removed by
pressing in its right hand edge as shown by the moulded arrow.
1.1.5 Operating Temperatures
The instrument is designed to be operated in an environment
having an ambient temperature of between 0 and 50 degrees C,
(0 to 45 degrees if the battery unit is fitted) and to operate with
full accuracy between 15 and 35 degrees C.
Note: Direct sunlight, radiators and other heat sources
should be taken into account when assessing the ambient
temperature.
The instrument may occasionally be subjected to temperatures
between 0 and -10ºC without degradation of its safety.
DC
If the unit is disconnected from the AC supply, and powered
from an isolated DC source or the internal battery unit, the unit
will not be grounded. Independent provision must be made to
maintain the case at a safe potential, by grounding the safety
ground terminal on the DSO rear panel. The safety ground
terminal is connected to the instrument case, to the ground of
the input signals (outer of the BNC connectors), and also
internally to the negative side of the DC supply.
WARNING: Any interruption of the protective ground
conductor inside or outside the instrument is likely to
make the instrument dangerous. Intentional
interruption is prohibited.
Signal connections to the instrument should be connected after
the ground connection is made and disconnected before the
ground connection is removed, i.e. the supply lead must be
connected whenever signal leads are connected.
1.1.3 Live Parts
The instrument should not be operated with covers removed.
The covers protect the user from live parts and
1.1.6 Power and Frequency Requirements
The instrument uses less than 85V A (200V A if battery unit
fitted) and operates from line voltages of 90V to 130V, and
190V to 265V, at 45 to 400Hz. Under the extreme conditions of
90V and 45Hz, the instrument will still operate correctly even if
there is a half cycle dropout in the line supply.
The instrument may be powered from a direct current supply in
the range 12V to 33V. The unit cannot be damaged by applying
power to both inputs simultaneously.
Before connecting the instrument to the supply, ensure that the
rear panel AC supply voltage selectors are set to the appropriate
voltage.
Access to the voltage selector can only be made if the AC
supply connector is removed, and is by hinging open the panel
connector from its top edge. The selector barrel can then be
moved to the required setting. This same operation provides
access to the AC supply fuse, which must be changed to suit
the supply voltage as shown in table 1.1. 7.
The AC power connection is via a standard IEC, CEE 22
connector and the DC power input is via the supplied 0.25"
spade connector (Gould part No. 457839.) See appendix 4 for
polarity details.
400 Operators Manual
Figure 1.2a Single Function Buttons
Figure 1.2b The Toggles
Figure 1.2c The Pressure Sensitive Buttons
Getting Started
Getting Started 1.1.7-1.4.1
CAUTION: The negative DC terminal is connected to the
safety ground terminal and the instrument case.
Care should be taken to avoid ground loops when,
for example, the instrument is used in a vehicle and
powered by that vehicle's supply.
400 Series Operators Manual
1.3 Start-Up Display
.
When switched on with the POWER button (1) the instrument
will go through its automatic self-calibration sequence and then
display information similar to that shown in Figure 1.3.
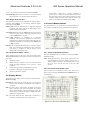
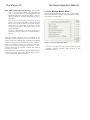
1.1.7 Fuse Requirements
The fuse arrangement shown in table 1.1. 7 must be followed,
and additionally in the UK, a 3A fuse (5A if the battery unit is
fitted) should be fitted in the line supply plug .
Supply
Voltage
230V
115V
12VDC
230V
115V
Slow Blow
Gould Suggested types.
Fuse Rating
Part No Manufacturer/Type No
IEC (ULlCSA) DSO
0.5A (0.6A)
457452 BeswickrrDC488,
Littlefuse/239,
Schurter/FSP
lA
(1.2A) 457454 BeswickrrDC488,
Littlefuse/239
Schurter/FSP
5A (6A)
457979 HRC type
Beswick/S505,
Wickman 19181
BATTERY UNIT
lA
(1.2A) 457454 BeswickrrDC488,
Littlefuse/239,
Schurter/FSP
2A (2.5A) 457455 BeswickrrDC488,
Littlefuse/239,
Schurter/FSP
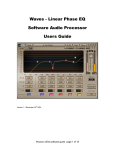
Figure 1.3 Start-Up Display
The trace is visible across the centre of the screen. At the top
will be the sensitivity of the two input channels and the
timebase speed. It any input is inactive, information for that
channel will not be displayed.
Users with no previous experience of a DSO will find that the
400 responds like a conventional Real Time Oscilloscope while
it is repetitively triggered, but in the absence of further valid
triggers, it retains the last trace for continuous display.
Table 1.1.7 Fuse ratings
Note: For different DC voltages, the DC fuse rating multiplied
by the voltage used should equal60W. e.g. at 30V a 2A
fuse is required. For additional safety under extreme
fault conditions, the DC fuse is a high rupture current
(HRC) type. This fuse should have a 1500A break
capacity.
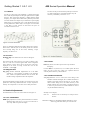
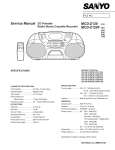
1.4 Obtaining a Trace
See Figure 1.4
1.4.1 AUTO SETUP
To display an input signal, connect it via either the CHI socket
9 or the CH2 socket (12) and press AUTO SETUP (24) .
Assuming you've applied a regular signal, say a 2kHz sinewave with an amplitude of perhaps 5V peak to peak, it will
almost immediately be represented on the display. An example
is shown in Figure 1.4.1.
()
1.2 Using the Buttons see appendix 3
There are three types of buttons. The first type usually have
only one function: when pressed, that one function will be
activated e.g. AUTO SETUP (24). See Figure 1.2a.
The second type are toggles: each press of the button either
switches something on or off e.g. Add (10) , or selects the
next item in a sequence e.g. Off/On/lnv (13) . See Figure
1.2b.
The third type are Pressure Sensitive: the effect caused depends
upon how hard the button is pressed. For example, a gentle
press of a Pos'n (8) button will move the trace slowly. If the
button is pressed harder, the trace will move more quickly. See
Figure 1.2c.
It the display is very dim or has completely disappeared see
section 1.8.1.
AUTO SETUP will attempt to arrange the display so that two
to five complete cycles appear, with the amplitude set so
that the height of the trace is between two and five
screen divisions. Also, it selects Auto trigger to ensure
that the screen is frequently updated and a trace will be
visible.
If signals are connected to both channels, the
highest amplitude takes priority.
Getting Started 1 .4.2-1 .5.1
400 Series Operators Manual
1.4.3 Coupling (AC/DC/Gnd)(14)
These buttons control the type of coupling between the input signal
and the instrument. DC is the most generally applicable, and
AUTO SETUP will normally set this control to DC, where
possible.
The input impedance is I M ohm in parallel with a capacitance of
28pF.
AC
This is used to remove any DC component from input
signals. Suitable input signals (i.e. the bandwidth) are from
4Hz to 20MHz.
Gnd The input signal is internally disconnected from the inputs and
the amplifier grounded. A OV reference signal is displayed.
DC The input signal is directly coupled to the instrument so all
frequency components of the input signal will be displayed.
The bandwidth will be from DC to 20MHz.
Figure 1.4 Obtaining a Trace
1.5 Horizontal Adjustments
Figure 1.4.1 An AUTO SETUP Display
1.4.2 Channel Selection (Off/On/lnv) (13)
A channel may be switched on or off with its Off/On/Inv button. If
the channel is on, its trace can be displayed in either normal or
inverted mode.
Off The channel is deactivated.
On The trace is a true representation of the input signal. Inv The
input signal is inverted before being displayed. If
there is any DC component in the signal this will also be
inverted and could cause the trace to disappear from the
screen. Such an unwanted DC component can be removed
by selecting AC coupling. Any vertical shift applied to the
trace is not inverted. The trigger point remains at the same
point on the waveform regardless of inversion.
Figure 1.5 Horizontal Controls
1.5.1 TIME/DIVISION
TIME/DIV (33) These buttons control the sweep rate of the trace.
The timebase can be varied from 100ns/div to 50s/div in a I,
2, 5 sequence of values. The button marked 'ns' decreases
the time/div, the button marked 'sec' increases the time/div.
With a timebase of say 200/Ls, each horizontal screen division
represents 200/Ls worth of signal. The timebase is shown near the
top of the display - e.g. TB=200/Ls.
Assuming a 2kHz signal is applied as mentioned earlier, when the
timebase is set to 500ms/div, an interesting phenomenon may
appear: an 'alias'.
Getting Started 1 .5.2-1 .6.3
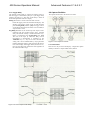
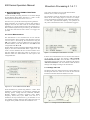
1.5.2 Aliases
An alias is a false image. The instrument is a digital oscilloscope
and so takes frequent samples of the input signal in order to update
the trace. Thus, if the signal frequency is higher than the sample
frequency, one sample will be taken from a particular point on the
waveform and the next sample may be taken from a point slightly
further along on a subsequent cycle. It will then display the wave
as being much slower than it really is. See Figure 1.5.2. This effect
is only likely to occur if there are more than 100 cycles of
waveform across the screen.
400 Series Operators Manual
are 20mV to 50V per division at the probe tip. See Section
3.4.1. If the Uncal light is on, then these buttons vary the
sensitivity continuously. See Section 1.6.3.
Figure 1.5.2 Alias Generation
There is a 'Max/Min' glitch detection feature which can be used to
detect aliases. With dot join on, this usually results in a filled-in
wave envelope being seen on the screen, indicating a high
frequency. See Section 3 A.
1.5.3 Position
Position (26) These buttons move all traces to the right or
left.
The position of the cursor (Section 2.4) is fixed in relation to the
trace so it will move with the applied shift. With x-magnified
traces (Section 1.5.4), the cursor can be off the part of the trace
displayed on the screen. To bring it back into view use the
CURSOR < > buttons(5)
1.6.2 Position
1.5.4 Magnification
If Trace Hold is on (Section 2.2) or a S/Shot capture has been
made, any part of the trace which was captured off-screen
vertically will be shown by a horizontal line.
.
Mag (32) Switches horizontal magnification on or off When
switched on, a xl0 expansion is applied to any displayed
trace, which will expand around the centre of screen. The
timebase setting is adjusted to reflect the expansion.
The instrument displays 50 dots (samples) per screen division, each
plotted dot value being obtained from the 512 byte acquisition
memory. At an expansion of x 10. there are five dots per division.
Pos'n (8) These move their respective traces up and down
the display.
1.6.3 Variable/Uncalibrated
Var (15) When this is set to 'Uncal', the coarse setting of the
attenuator remains unchanged, but a variable attenuation is
applied to the input signal in the range of 1 to 004. Thus,
with an initial setting of IV, the actual sensitivity of the
channel could be set by this control to anywhere between I
V and 2.5V per division. The V/DIV buttons are used to
vary the uncalibrated sensitivity.
1.6 Vertical Adjustments
Each channel has its own set of vertical controls. See Figure 1.6.
Example screen display:
CH1 =5V
Channel is set to a sensitivity of 5 Volts per screen
division.
1.6.1 VOL TS/DIVISION
V/DIV (11) Adjusts the sensitivity of the instrument over discrete
calibrated ranges from 2m V to 5V per screen division in
1,2,5 steps. With a x10 probe the ranges
CH2>20mV Channel 2 is uncalibrated and the attenuator is set to a
sensitivity greater than 20m V per screen division.
400 Series Operators Manual
1.6.4 Add
Add (10) Displays the sum, or if one channel is inverted the
difference, of the input signals. The original traces
disappear and the resultant trace is displayed as a
Channel 2 trace.
1.7 Manually Obtaining a Trace
This subsection describes how to obtain a trace without using
AUTO SETUP.
You may need to consult later sections of the manual as not all
of the operating features have been discussed so far.
1.
When switched on, the instrument will go through its
power-up sequence, checking the internal calibration.
2.
Decide to which channel you are going to apply the
signal (CH1 or CH2).
3.
Make sure the chosen channel is active by setting the
Off/On/lnv (13) for that channel to On.
4.
Set the AC/DC/Gnd button (14) for the chosen channel to Gnd.
5.
If necessary, turn that channel's Uncal light out by
pressing Var once. (15)
6.
Make sure that horizontal mag is not selected. (32)
7.
Adjust the TIME/DIV setting (33) to give a timebase
of 5μs.
8.
Set the display Mode (31) to Refr.
9.
Set the TRIGGER Norm/Auto button (20) to Auto.
10.
Use the CHl/CH2/Ext/Line button (17) to choose the
source for trigger signals.
11.
Set the trigger coupling with the hf rej/AC/DC button.
12.
If necessary adjust the position of the trace using the
Position and Pos’n buttons. (26) & (8)
13.
Ensure that Trace Hold (25) is not selected.
14.
Select Run. (27)
15.
Apply the signal through a BNC connector to the chosen
CH input socket. (9) or (12)
16.
Set the AC/DC/Gnd button (14) for the channel to
either DC or AC, as appropriate.
17.
Adjust the gain of the chosen channel using the V/ DIV
buttons (11) . For intermediate settings, set Uncal on
by pressing the Var button once. (15)
(18)
18.
Adjust the timebase setting using the TIME/DIV buttons. (33)
19.
If the display is unstable, adjust the trigger Level. (22)
1.8 Operating Hints
The following list gives some of the more commonly met
problems in operating digital oscilloscopes, how to correct
them, and a brief explanation of what was wrong.
Getting Started 1.6.4 - 1.8.5
You may need to consult later sections of the manual as not all
of the operating features have been discussed so far.
1.8.1 Problem: Traces and Alphanumerics very dim or
completely disappeared.
Intensities too low
- Press the control button (7) to get the control master
menu, then press numeric button 3 to select the intensity
menu. Further presses of numeric button 3 will increase
the brightness of the alphanumerics on the display. The
traces can now be intensified using numeric button I.
Note:- The display may not become visible until the numeric
button 3 has been pressed several times.
1.8.2 Problem: Trace off the top or bottom of the screen. Too
much vertical shift
- correct with that channel's Pos’n buttons. (8)
Input has large DC offset
- AC couple input signal.
- Correct with Pos’n buttons. (8)
- Use a less sensitive range.
1.8.3 Problem: Trace not being acquired.
Instrument in single capture mode
- Press Run. (27)
Trigger level incorrect
- Select Auto and DC trigger, then adjust the level
control until the trigger level indicator bars are lined up
with the centre of the trace.
Trigger source on the wrong input
- Change trigger source. (CH1, CH2, Ext, Line) (17)
Trigger coupling on an unsuitable setting
- Change trigger coupling. (hf rej, AC, DC) (18)
Trace Hold on
- Release Trace Hold. (25)
Timebase on very slow acquisition
-Adjust TIME/DIV. (33)
1.8.4 Problem: Trace is unstable even when triggered.
Alias
- Check for alias using Max/Min (glitch
detection), and select a faster timebase range.
Noisy input
- Select hf rej trigger coupling. (18)
- Adjust trigger Level. (22)
Trigger on Auto
- With low frequency inputs (below 20Hz), Auto trigger
will initiate triggers overriding the input triggers. Select
Norm trigger. (20)
1.8.5 Problem: Trace has a very flat top or bottom.
Trace captured when off screen vertically and Pos’n shift has
been used
- Use less sensitive V/DIV range when acquiring trace. (11)
- Re-position trace prior to capture.
Advanced Features 2.1-2.1.5
2 Advanced Features
2.1 Trigger Control
Trigger facilities discussed here are controllable directly from
the front panel. For the more advanced menu-controlled
facilities see Section 3.4.
The power-down trigger setting will be retained on future
power-up.
400 Series Operators Manual
Table 2. 1. 1 Useful Frequency Ranges of Coupling
Types
Coupling
hfrej
Input
10Hz to 15kHz
AC
DC
4Hz to 20M Hz
DCt020MHz
2.1.2 Level
The trigger level is the threshold at which the instrument will
respond to potential triggers; the trace actually has to pass
through the level indicated for a trigger to be valid. See Section
2.1.3.
The level is indicated on the display by two bars, one on each
side. of the screen, and is adjusted by the level buttons. (22)
For an internal trigger the range is approximately +/- 10
divisions and on external approximately +/ - 3V. If the trigger
signal is AC coupled, the level bars will be offset from the
actual trigger position on the screen by any DC offset present.
2.1.3 Trigger Point (T)
The trigger point is indicated on the display by a 'T' near the
bottom of the screen underneath the trigger. An arrow next to
the T indicates that the trigger point is off the screen.
2.1.4 Slope (+/-)
A trigger is generated when the selected source signal passes
through the chosen trigger level. This transition may be either
on a rising or a falling edge. The rising edge is considered to be
a positive slope and the falling edge a negative slope.
Figure 2. 1 Trigger Controls
+/- (19)This button selects positive (+) or negative (-)
slope triggers.
2.1.5 Trigger Mode (Norm/Auto)
2.1.1 Selecting Source and Coupling
The lowest button in the TRIGGER section of the front panel
selects the source of the trigger.
CH1/CH2/Ext/line (17) Steps through the possible sources
of trigger signals. When Ext is selected, the source is the
'EXT TRIG' socket (16) in the lower right corner of the
front panel.
Selecting line is meaningful only if the instrument is
powered from the mains. Triggering is then from an
internal pulse having a fixed phase relation to the mains
voltage waveform. To change this phase relationship,
use the trigger delay buttons. See Section 2.1.6.
hf rej/AC/DC (18) Steps through the available trigger coupling options; hf rej is a 15kHz low-pass filter ('high
frequency reject'). All the couplings can be used with
any source except Line, with which the input coupling is
not selectable.
The trigger system operates in either Normal or Auto mode.
In Normal mode, display captures can only occur when a valid
trigger input has been received.
In Auto mode, if no valid trigger has been received for some
time the instrument will generate its own trigger and initiate a
capture. This ensures that the screen is constantly updated
irrespective of the input signal. However, if valid input triggers
are received at a rate of 20Hz or more, the instrument will start
all captures with these triggers and not generate its own.
Auto/Norm (20)This button selects which trigger mode the
instrument is operating in.
Trig'd (21) This LED lights up when the instrument is
receiving valid trigger signals.
400 Series Operators Manual
Advanced Features 2.1.6-2.2.1
2.1.6 Trigger Delay
2.2 Capture Facilities
The amount of data which is acquired for display before or
after the trigger is determined by the pre or post trigger delay
selected, see figure 2.1.6. The value of this delay is shown in
the bottom right hand of the trace display.
The capture facilities allow the traces to be frozen.
Pretrig This allows a section of the trace that occurred
before the trigger point to be included in the display. The
amount of pre-trigger visible can be set with the front
panel PreTrig/Delay buttons. (23) Pre-trigger can be
set anywhere between 0% and 100% of screen width, in
steps as small as 0.4%.
Trig Delay With this set, the oscilloscope will acquire a trace
following both the specified trigger and a specified
delay. The amount of delay is shown beside the 7 key.
Delay is controlled by the PreTrig/Delay keys. (23)
The size of the steps by which the delay can be
incremented or decremented is controlled by the
TIME/DIV keys, i.e., step size is 0.04 x the time/ div
setting. This can be demonstrated by varying both the
timebase and delay settings, while observing the last two
lines of the Display and Trigger Menu (See section 3.4).
Once set, the delay time remains the same regardless of
the selected timebase range.
Figure 3.4a Trace Capture with Delay
Figure 2.2 The Capture Controls
2.2.1 Trace Hold
There are two ways to freeze the display: a single-shot capture
whereby a full trace is acquired then frozen (Section
Advanced Features 2.2.2-2.4.2
2.2.2), or by pressing one of the buttons labelled Trace Hold.
Trace Hold: (25) Freezes the relevant trace or traces the moment
they are pressed. A second press releases the trace( s).
2.2.2 Single Shot and Run
These buttons are used to set the instrument into either a captureand-freeze mode (S/Shot), or a free running continuous capture
and re-capture mode (Run).
S/Shot (30) Arms the instrument for a single-shot triggered
acquisition. The Arm'd light will be illuminated to show
that the button has been pressed.
400 Series Operators Manual
socket input to control the Y (vertical) component. It
provides an X- Y display of the data captured by the time
base and trigger systems. The timebase should be set slow
enough to capture the whole of the signal of interest. This
mode is not available with magnified traces (Mag).
2.4 Cursor Measurements
The instrument allows you to take direct measurements from the
screen display automatically, using inbuilt datum lines and cursor.
Arm'd (29) Illuminates after the S/Shot button has been pressed;
it will stay lit until either a valid trigger has been received
or until the Run button is pressed.
Stor'd (28) Illuminates on completion of a single-shot
acquisition. This is after the instrument has been Arm'd,
triggered and a complete trace acquired. The light will stay
on until the instrument is re-armed by pressing S/Shot again
or Run is pressed.
Run (27) This button puts the instrument in continuous capture
mode: the instrument will automatically rearm itself after
each capture is completed so that the display will be
updated with each triggered sweep.
Figure 2.4 The Cursor and Datum Line Controls
2.2.3 Acquisition Status - AFTS
2.4.1 Cursor and Datum Selection
These characters appear on the screen and can be used with the
Arm'd and Stor'd lights to determine the 'status of the acquisition
in progress.
The cursor and datum lines are switched on or off using the Select
Trace button. (4)
Select Trace (4) Successive presses of this button places the
cursor and datum lines on to the displayed traces in turn. i.e.
channel, channel 2, reference, off, channel etc. If any of the
traces are not in use the lines skip to the next valid
selection.
A
Stands for 'Armed'.
F
Indicates that the acquisition store has been filled with
enough pre-trigger information to be ready for a fresh
acquisition.
T
Stands for 'Triggered': the instrument has received or
generated a valid trigger; acquisition has begun.
2.4.2 The Cursor and Datum Lines
S
'Stored': acquisition is complete.
There are three lines, as indicated in Figure 2.4.2. Movement of
them is aCH1eved using the DATUM and CURSOR buttons, as
described below.
2.3 Display Modes
The following three display modes are directly selectable using the
Mode button. (31)
Refreshed The instrument will imitate the style of a conventional
realtime 'scope: the display is plotted from left to right as it
is acquired.
Roll This mode is like a chart recorder: the display scrolls from
right to left until a trace has been acquired. The scrolling
effect is most noticeable on the slower timebase ranges. The
rolling display is frozen by the trigger in S/Shot mode and is
unaffected by trigger in Run.
X-V This mode allows the CH1 socket input to control the X
(horizontal) component of the trace, and the CH2
Figure 2.4.2 The Cursor and Datum lines
400 Series Operators Manual
Dat
Selecting this option on the Dat/Pos/Mag button (3)
allows the position of the datum lines to be controlled
using the DATUM buttons. (2)
DATUM (2) Used for moving the two datum lines. CURSOR
(5) Moves the cursor to the right and left along the trace.
Pos/Mag These selections on the Dat/pos/mag button (3)
allow the DATUM buttons to control post storage
position and magnitude. They can only be used with
stored waveforms. Pressing menu button 1 (opposite the
restore message) will cancel the effect of pos and mag
on the selected trace i.e. the one with the cursor on it.
Pos
This option on the Dat/Pos/Mag button (3) allows both
X and Y shift to be applied to the trace on which the
cursor is placed, using the POST STORAGE/ DATUM
keys. (2)
Advanced Features 2.4.3-2.5.5
The normal pen sequence is:
Pen No.
1
2
3
4
Colour
Black
Blue
Green
Red
The pen holder is colour coded with this colour sequence.
When pens are fitted in this order, trace 1, the border and all the
alphanumerics are plotted in black, trace 2 in blue, the reference
trace in green and the graticule in red. The cursor and datum
lines and their measurements are plotted in the same colour as
the trace to which they relate. The cursor colour also applies to
the HPGL output on both the 420 and 450.
2.5.3 Pen Changing
Mag The vertical magnitude of the selected trace can be varied
from X4 to XO.062, using the POST STORAGE/DATUM keys. (2) The magnification factor is
displayed near the top centre of the CRT.
Underneath the plotter lid at the front of the plotter there are
two small blue buttons. The right hand button when viewed
from the front of the OSO is the Pen change button, and the left
hand one is the paper advance button.
No horizontal magnification is available using this
control, but x10 magnification may be applied to all
stored traces using the horizontal mag button. See
Section 1.5.4).
CAUTION: When changing a pen, extreme care should
be taken not to damage any of the plotter mechanism.
NEVER move the pen carriage by hand.
2.4.3 Making Measurements
The instrument displays, at the bottom of the screen, the time
and voltage difference between the intersection of the
horizontal and vertical datum lines and the cursor.
The choice of points between which to make the measurements
can influence the accuracy: while the measurements made will
always be within the design limits, placement of the cursor at
the desired position is easier at those points where the slope of
the waveform is at its steepest. For example, on a standard sine
wave, the most accurate measurements of wavelength are likely
to be made if they are taken between two OV crossing points.
To change a pen, ensure that the instrument is switched on and
then proceed as follows:
1.
Press the pen change button once. This rotates the pen
carriage and moves the carriage to the right hand side of
the plotter.
2.
Gently press the white grooved eject lever towards the
front of the instrument. The top pen will be ejected from
the pen carriage and can be removed from the plotter.
3.
Insert the tip of the new pen into the carriage guide hole.
Gently snap the other end of the pen into place.
4.
When the pen has been changed, press the left hand
button - the paper advance button - and the carriage will
move back to the left hand side ready for the next plot.
2.5.4 Paper selection
2.5 Plot
2.5.1 Internal Colour Plotter Operation
When the internal colour plotter is fitted to the 400 OSO, plots
of the instrument's display can be sent to it by selecting internal
on the Plot Menu, see section 3.12.
The internal plotter is automatically selected on power up if it
is fitted. If required the plot output can be directed via the
RS423 port to an external plotter by selecting RS423 on the
Plot Menu, see section 3.12.
2.5.2 Pens
Only use Gould pens - part number 04101175 for a pack of 4; 1
of each colour.
Only use Gould paper - Part number 04101165 for a pack of 8
rolls. Other paper types may damage the mechanism.
2.5.5 Paper Loading
CAUTION: When loading paper, extreme care should be taken
not to force any of the plotter mechanism. NEVER pull
paper through by hand, always use the paper advance
button to prevent damage to the plotter mechanism.
1.
2.
3.
With scissors, cut the end of the paper square.
Open the plotter cover by depressing the catch and
lifting the cover until it is fully open.
Remove the shaft from the paper cradle and if the plotter
has been used previously remove the plastic or
cardboard tube from the shaft.
Advanced Features 2.5.6-2.5.8
4.
5.
6.
7.
7.
Insert the shaft through the paper roll and fit the roll into
the paper cradle.
Feed the paper from the top of the roll as shown in
figure 2.5.5 below and push it through the slot in the rear
of the printer mechanism.
Press the paper advance button - the left hand blue
button at the front of the printer assembly - until the
paper reappears at the front.
Feed enough paper through to pass through the top
cover, ensure that it is running around the mechanism
smoothly and that it is straight.
Close the plotter cover and ensure that it latches shut.
400 Series Operators Manual
If the plot button is pressed while the plot is in progress, the
plot will be aborted. Any changes to the instrument status
during a plot will have no effect on the plot as the data has
already been transferred and stored in the plot buffer.
2.5.7 External plots
A plot of the display can be sent to an external plotter by
pressing the plot button @ . The parameters for the plotter
and the plot format can be set as described in section 3.7 and
3.12.
The display is held while a plot is in progress.
Plots can be aborted by a second press of the plot button. If the
plot is aborted, the pen will be left in a random position and the
external plotter may need to be reset to restore the pen to its
start position.
2.5.8 Plot positioning and scaling
The output plot from the 400 has the relative positions shown in
figure 2.5.8a. These may be shifted and scaled to position the
plot exactly over a pre-defined grid using the following
procedure with reference to figure 2.5.8b.
The sides of the pre-defined grid are X and Y, the exact
positions of PI and P2 are found by calculating the dimensions
A, B, C and D:
Measure the vertical dimension of the required grid, note
this as Y.
Figure 2.5.5. Paper Loading
Measure the horizontal dimension of the required grid,
note this as X.
U sing these values of X and Y, A, B, C and D can be
calculated as follows:
2.5.6 Internal Plotting
When a plot is initiated, the Hold All lamp lights and the
message "PLOTTING - PRESS PLOT TO ABORT" appears
on the screen. After about 9 seconds the hold All lamp goes out
indicating that the data has been transferred to the plot buffer
and that the instrument can be used again. The plotting
message will remain on the screen until the plot is complete
when it will disappear.
In Auto Plot Mode, the instrument is re-armed after the plot
data has been transferred to the plot buffer, but the front panel
controls will remain in-active during plots.
Measure and mark the exact positions of PI and P2 from the
grid edges using figure 2.5.8b and the values obtained above.
The PI and P2 points can now be set on the plotter, refer to the
plotter manual for details.
400 Series Operators Manual
Figure 2.5.8a Relative Plot Positions
Figure 2.5.8b Plot Dimensions
Advanced Features
Advanced Features 2.6-2.7
2.6 Data Transfer
Trace data for either CH1, CH2, or the reference trace can be
transferred to and from the 400 oscilloscope and a computer.
There are four I/O commands which are used for the data
transfer, they are: ST1, STI, ST3, and ST? The first three
commands are used to transfer data and the fourth one to
interrogate the 400 for its error status.
2.6.1 Syntax
To receive the data for trace one, the computer sends "STl".
The 400 then responds with:
400 Series Operators Manual
For binary transfer, the 400 will cease receiving when the
amount of data indicated by the length field has been received.
Unless the selected trace for received data is held or acquisition
is not armed, the selected memory data could be overwritten
almost immediately by a fresh acquisition.
Note: The number base for received data is set by the #X field
of the incoming string and not by the menu selection. See
section 3.7
The strings for the horizontal and vertical ranges must be
exactly as follows, anything else will result in error status 102
being generated, as will sending 50ns to a 400 or 420.
STl =20m V, 10us, # HdataCRLF
Where #H is:
#H for hexadecimal number base, #0
for octal number base,
#B for binary number base,
or nothing for decimal number base.
Data is: the trace information as described below.
CRLF is: carriage return, line feed.
If the 400 receives ST3 and the reference trace is unused, the
400 will respond with "ST3=UNUSED"
Note: When data is being sent to the 400 #D may be used for
decimal number base.
For decimal, octal and hexadecimal, the "data" field consists of
501 data points separated by commas.
For binary transfer, the "data" field is as follows:
"lldddd ... ddddcc"
Where: II is a 2-byte count of the data that follows including
the 2-byte checksum. This will have the value
01F7 (hex) or 503 (decimal). dddd ... dddd is
501 bytes of trace data.
cc is a 2-byte checksum of the preceding data
including the 2-byte length.
The most significant byte is sent first for both the length and
checksum fields.
Note that there are no comma separators between data bytes
during binary transfer.
2.6.2 Receiving Data
The computer may send strings to the 400 at any time in the
same syntax as above. The 400 converts the data into a binary
form in an internal memory, and when all the data has been
collected, transfers the entire memory to the destination trace
store.
For decimal, octal, and hexadecimal the 400 will cease
receiving as soon as a CR or LF is received, and then only
transfer the data received to the required store.
2s
Is
0.5s
50s
20s
10s
5s
0.2s 0.ls
50ms 20ms10ms 5ms
2ms
1ms
0.5ms 0.2ms 0.1ms 50us
20us 10us
5us
2us
1μs
0.5μs 0.2μs 0.1μs 50ns
5V
2V
IV
O.SY 0.2V 0.1V 50mV
20mV 10mV 5mV 2mV
2.6.3 Error Status
If the 400 receives "ST?", it will respond with a decimal error
status string as follows:
o No error
96 Invalid command
102 Syntax error
103 Number out of range
104 Length error - Binary transfer only 105
Checksum error - Binary transfer only
If an error condition is detected, the 400 will not make the
transfer of data between its internal memory and the
destination.
2.7 Real Time Clock (420 and 450 only)
A real time clock is fitted to the 420 and 450 instruments. This
enables the current date and time together with the date and
time of acquisition to appear on any screen plot, and to be
transferred to and from a computer if the data transfer facility is
used. See section 2.6. When trace data is transferred to the DSO
the date and time are checked to ensure that they are valid and
syntax error 102 is returned if they are invalid.
The clock will be kept running for at least ten years, even with
the power disconnected, by its own internal battery back-up.
The date and time are set via the special functions menu. See
section 3.8.
400 Series Operators Manual
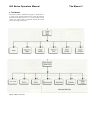
3. The Menus
The menu structure is summarised in Figure 3. The numbers 1
to 9 refer to the numeric buttons used to select the particular
menus and menu items (Section 3.1.1). All front panel controls
remain "live" when menus are displayed, allowing the control
status to be changed at any time.
Figure 3 Menu Overview
The Menus 3
The Menus 3.1-3.2
3.1 Additional Buttons
3.1.1 The Numeric Buttons
The buttons 1 to 7 (36) are used in conjunction with the menu
system to provide a large number of extra functions not
otherwise available directly from the front panel. Pressing these
buttons when the menus are displayed operates the menu
functions described in Sections 3.2 to 3.12. Buttons 0, 8 and 9
have extra functions described below.
400 Series Operators Manual
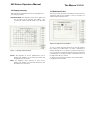
3.2 Control Master Menu
Each entry on the Control Master Menu is also a menu, covering one set of functions. The text is lined up with the numeric
buttons 1-7 on the side of the display. To obtain any secondary
menu simply press the relevant button.
Figure 3.2 Control Master Menu
The options available on the Control Master Menu are as
follows:
STATUS Displays information about the present setup of the
instrument. See section 3.3.
AND TRIGGER Controls probe sensitivity,
averaging, interpolation, the glitch detect function, and
trigger delay. See section 3.4.
DISPLAY
DISPLAY
Figure 3. 1 The Numeric Buttons
3.1.2 0: Menu/Traces
Menu/Traces: (35)Toggles the display between the traces and
the last used menu.
3.1.3 9: Control
Control: (7) The current display, whatever it may be, is
replaced with the Control Master Menu.
3.1.4 8: Post Store
Post Store: (6) Brings the Post Storage Master Menu onto the
display.
INTENSITY
The
brightness
of
the
alphanumerics, graticule, cursor and traces can all be
adjusted independently. See section 3.5.
REFERENCE TRACE Either one of the currently displayed
traces can be copied to the reference trace. See section
3.6.
RS423 INTERFACE Setting the RS423 output protocol.
See section 3.7.
SPECIAL FUNCTIONS Enables the user to disable the auto-
calibration, calibrate either channel, or force a full
calibration. See section 3.8.
400 Series Operators Manual
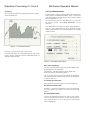
3.3 Status Menu
This menu allows the various horizontal, vertical and trigger
settings of the instrument to be viewed. A typical display is
shown in Figure 3.3.
The Menus 3.3
3.3.4 Probe Set: The probe gain settings are shown as x l ,
x10 or x100. These may be set using the Display and
Trigger Menu. See Section 3.4.
3.3.5 Timebase: The sweep rate of the timebase is shown in s,
ms, /-LS or ns per division.
3.3.6 Trigger This section of the display shows the selected
trigger options. The choices of source are CH1, CH2,
Ext and Line. The available couplings are AC, DC and
high frequency reject. These are discussed in Section
2.1.
The trigger level is shown in terms of the number of
screen divisions above the bottom of the graticule. The
trigger slope is shown as either +ve (rising edge) or -ve
(falling edge).
Figure 3.3 A Status Menu
3.3.1 Mode: There are three possible display modes:
Refresh, Roll and X- Y. They are described in Section
2.3.
3.3.2 Max/Min: The glitch detector is selected using the
Display and Trigger Menu. See Section 3.4.
3.3.3 V/Div: The input sensitivity of the channels is shown in
volts per division. The range is 2mV to 5V per division.
If Add mode is selected, a + sign is shown between the
channels.
Along with the input sensitivity of the channels, other
information is also shown. The symbols used are as
follows:
-
Trace inverted
>
Uncalibrated
~
AC coupled
=
Calibrated
↑
Trace off top of display
↓
Trace off bottom of display
Following this is the trigger delay setting, given in s, ms,
/-LS or ns as appropriate. For pre-trigger operation, the
figure is given as a percentage; 0% places the trigger
point at the left-hand edge of the screen and 100% on the
right-hand edge.
The Menus 3.4
400 Series Operators Manual
3.4 Display and Trigger Menu
This menu controls probe ratios, maximin detection, interpolation, and the trigger delay function.
3.4.1 Probe Ratio: An independent probe attenuation ratio
can be set for each of the two input channels with
successive presses of buttons 1 and 2. The ratios
available are xl, x10 and x100. Thereafter, probes of the
chosen ratios may be attached to the appropriate inputs;
the new sensitivities at the probe tip will be displayed
correctly.
3.4.2 MaxiMin: Using the number 3 key, the maximin or glitch
detection function can be switched on or off.
The Max-Min function is designed to detect narrow
glitches which may occur between samples. It operates
on the signal before it is placed in the acquisition store
and can detect very narrow glitches, down to 2f.Ls wide.
Any glitches detected will at least be displayed as a
spike. They will be detected whether they are positive
(max) or negative (min). The function works in the
timebase ranges of 100 microseconds per division down
to 50s per division.
3.4.3 Dot Join Button 4 selects the dot-joining function.
On some X-magnified or high speed traces, gaps can be
visible between the sample points; if Off is selected, the
points alone will be displayed. Selecting On causes the
data to be automatically joined by straight lines.
3.4.4 Averaging It is possible to improve the signal to noise
ratio of repetitive signals by averaging them. This
function, which converts the display into a weighted
average of previous acquisitions is toggled On and Off
by button 5. Button 6 is used to determine the averaging
factor to be used in the algorithm
Where: n
A
an
f
d
=
=
=
=
=
The data point (1 to 501)
New value at n
Old value at n
averaging factor (2 to 256)
Latest value at n
e.g. In continuous mode, if 8 acquisitions are selected,
any single acquisition that deviates from an otherwise
consistent level, contributes 1/8 of its deviation to the
display. In S/Shot only the selected number of
acquisitions contribute to the resultant held display.
3.4.5 Trig Pos’n: This displays the current value of either the
pretrigger percentage or the post trigger delay time. The
value can be altered as described in section 2.1.6. Figure
2.1.6 shows the display relative to the trigger position
for both pre and delay trigger values.
Figure 3.4 Display and Trigger Menu with
Trigger Delay Selected.
400 Series Operators Manual
The Menus 3.5-3.6
3.5 Display Intensity
3.6 Reference Trace
This menu allows independent control over the brightness of
various display features.
The menu provides the option of temporarily storing a trace for
comparison with the two Channels. It will be lost when it is
replaced with an alternative trace.
TRACES/CURSOR: The brightness of the cursor, datum lines
and all traces will be adjusted. The number 1 key
increases the intensity and the number 2 key decreases
it.
Figure 3.6 Reference Trace Menu
Figure 3.5 Display Intensity Menu
ALPHA: The brightness of all the alphanumerics will be
adjusted. The number 3 key increases the intensity and
the number 4 key decreases it.
GRAT: The brightness of the graticule (or grid) will be
adjusted. The number 5 key increases the intensity and
the number 6 key decreases it.
To copy a currently displayed and held trace into the reference
trace, simply press either button 2 or button 3 depending on
whether the held trace is in Channel or Channel 2 respectively.
A copy of the trace will then be automatically taken. If the trace
is not held prior to pressing the button, a fresh acquisition will
be made before the copy is taken.
To display a previously stored reference trace, use the button
to toggle the selection to On.
The Menus 3.7
3.7 RS423 Interface Menu
This menu allows the parameters of the RS423 output to the
remote plotter or other data handling device to be set.
400 Series Operators Manual
FF represents the top of the screen.
The maximum number of characters per trace
transfer is 1522
Binary:
Each data point is sent as a single byte.
00000000 represents the bottom of the screen,
10000000 represents the middle of the screen, and
11111111 represents the top of the screen.
The maximum number of characters per trace
transfer is 525
BLOCK LENGTH: Successive press of button 4 changes the
block length from 0 to 80 in steps of 10 i.e. the sequence
0, 10,20,30,40,50,60,70,80, 0 ... A block length of 0
selects infinite length blocks.
During data output from the 400, if the next value to be
sent would exceed the block length, then a CRLF is sent
instead of the comma. Block length has no effect on
binary transfers, all bytes of data are always sent.
Figure 3.7 An RS423 Interface Menu
Data is always output with no parity, one start bit, eight data
bits and one stop bit.
The data that is output is the complete waveforms, including
the reference trace, plus information about the timebase and
volts per division. The data is output in a form suitable for
HPGL plotters, such as the Gould 6120. See section 3.12.
SPEED: This is selected with button 1. The data rate may be
3.7.1 RS423 Plot Connections
The RS423 port is configured at the factory as shown in table
3.7.1. The instrument can be connected to a Gould colorwriter
6120 or a HP7475 plotter using the Gould plotter cable part
number 0409-1232. The connections of this cable are shown in
figure 3.7.1.
Pin No.
Name
Description
1
OV
Protective Ground
2
RXD
Receive Data
NUMBER BASE: Button 3 sequentially selects from decimal,
3
TXD
Transmit Data
hexadecimal, octal, and binary as the number base to be
used in any data transmission from the 400. See section
2.6
4
CTS
Clear to send
5
RTS
Request to send
The value range for the data points for each number base
is as follows:
7
OV
Signal Ground
9
OV
Ground
75,150,300,600, 1200,2400,4800 or 9600 baud.
HANDSHAKE: Key 2 is used to select from handshaking Off,
XON-XOFF, or CTS-RTS.
Decimal:
Each data point is sent as a signed decimal number. 128 represents the bottom of the screen,
o represents the middle of the screen, and
128 represents the top of the screen.
The maximum number of characters per trace
transfer is 2522
Octal:
Each data point is sent as three unsigned octal digits.
000 represents the bottom of the screen,
200 represents the middle of the screen, and
377 represents the top of the screen.
The maximum number of characters per trace
transfer is 2023
Hexadecimal:
Each data point is sent as two unsigned hex digits. 00
represents the bottom of the screen,
80 represents the middle of the screen, and
Table 3.7. 1 Standard RS423 Pin Connections
Figure 3.7.1 400 to Gould 6120 or HP7475 Connections
3.7.2 RS423 Data Connections
To connect the 400 to a computer use the connections shown in
figure 3.7 .2a or figure 3.7 .2b. A prewired cable for each of
these arrangements is available; part number 0410-9248 for the
PC/XT and part number 0410-1247 for the AT.
The Menus 3.8
400 Series Operators Manual
3.8 Special Functions
This menu controls the selection of auto calibration and can
force the instrument to perform a full calibration.
Figure 3. 7.2a 400 to IBM-PC/XT Connections
Figure 3.8 Special Functions Menu
Figure 3. 7.2b 400 to IBM-A T Connections
AUTO-CAL: successive presses of button I enables and
disables the
procedure.
instrument's
automatic
re-calibration
When Auto-cal is enabled, the change of any vertical or
timebase range will, after a 2 second pause, initiate a
calibration of the new operating conditions. If the
operating conditions are not changed, a recalibration is
initiated at 15 minute intervals, alternating between
channels 1 and 2. Each calibration takes about one
second.
If the occasional interruption of the normal function of
the instrument is unacceptable to the user the Auto-cal
facility can be disabled as described above. Recalibration
is then recommended 30 minutes after switch on from
cold, and additionally if there is a significant change in
the ambient operating temperature.
CALIBRATE CURRENT SETUP: Pressing button 2 forces the
instrument to recalibrate for the vertical range and mode
and the timebase range that it is currently set at. The
actual calibration occurs approximately 2 seconds are
pressing the button. This feature does not operate when
the instrument is in Roll mode.
FULL CALIBRATION: Button 3 forces the instrument to
perform a complete internal recalibration ignoring
existing information. All internal memories are cleared
including the instrument status data and any stored
traces. To obtain the best results from this calibration,
the instrument must have been operating for a minimum
of 1/2 hour. This calibration should only be required if
there have been repairs to the signal processing sections
of the unit or if the internal battery maintaining the status
memories has been totally discharged or disconnected.
The Menus 3.9
REAL TIME CLOCK (420 and 450 only): The real time
clock is set using buttons Menu. The entire date and
time is displayed, with one section highlighted. The
highlighted element is selected using button 5 and can
then be increased or decreased using button 4 or 6 as
appropriate.
400 Series Operators Manual
3.9 Post Storage Master Menu
The Post Storage Master Menu provides access to three further
menus which control the operation of the three battery-backed
trace memories, and the plotter.
Once the correct date and time has been set, pressing
button 7 enters the data. This makes it easy to set a time
that is a few seconds in advance of real time and then
press button 7 at a time signal. If the menu is exited
without pressing button 7, then the date and time will
remain unchanged.
The clock is kept running even with the power disconnected for at least ten years by its own internal battery
back-up.
Note: No channel calibrations will be performed if the
instrument is armed, in a data capture cycle, in continuous roll
mode or if Auto-cal is disabled, they will simply be postponed
until these conditions end. Full calibration is always available.
If the unit is unable to complete any of the above self calibrations. an error message will appear. See appendix 1. These
messages should only occur if there is a major fault requiring
the unit to be serviced.
When performing a full calibration connect a son termination
to the Ext Trig input. This ensures that the trigger input is
correctly calibrated for a son source signal.
Figure 3.9 Post Storage Master Menu
Lines 4 to 7 only appear on a 420 or 450 instrument and are the
waveform processing functions. Their operation is fully
described in section 5.
400 Series Operators Manual
The Menus 3.10-3.11
3.10 Save Trace Menu
3.11 Recall Memory Menu
This menu allows you to store up to three traces, including the
reference trace, to the battery-backed memories.
Traces previously saved using the Save Trace menu can be recalled
using this menu.
Figure 3. 10 Save Trace Menu
Figure 3. 11 Recall Memory Menu
Because these memories are battery-backed, the traces stored in
them will not be lost even when the instrument is powered down.
RECALL MEMORY One of the three memories may be recalled
by pressing the button 1,2 or 3. Having chosen a memory,
you will be asked into which display trace you would like to
place it.
SAVE TRACE: Using the 1, 2 or 3 keys selects either Trace 1,
Trace 2 or the Reference Trace respectively to be saved.
Once the trace has been selected, a fresh option will appear,
described below.
SAVE TRACE TO MEMORY: Any of the three battery backed
memories may be selected.
RECALL MEMORY TO TRACE Pressing button 5, 6 or 7 will
cause the trace data from the previously selected memory to
be displayed on trace 1, trace 2, or the reference trace.
NOTE: Unless the selected trace is held, or acquisition
is not armed, the selected memory data could be overwritten soon after it is displayed.
The Menus 3.12
3.12 Plot menu
This menu allows the user to set the format of the plot sent to
the internal colour plotter or to the external plotter via the
RS423 interface. Refer to Section 3.7 for RS423 connections.
Figure 3.12 Plot Menu
PLOT MODE: This can be set to either Single or Auto with
successive presses of the number 1 button. In Single plot
mode one press of the Plot button wil1 produce one plot
output. In Auto mode, a press of the plot button will
initiate a plot. The sequence thereafter continues
automatically. At the end of the plot the trigger circuit is
rearmed for the next acquisition, and at the end of an
acquisition, the plot is started. An external plotter must
have an auto feed facility to function correctly in this
mode. If it does not, then the feed command from the
400 may confuse the plotter.
PLOT WITH GRATICULE: The user has the option of
including the screen grid in the plots with On or
excluding it with Off.
GRAT LINE TYPE: A solid or broken graticule can be
selected for the plot, by successive presses of button 3.
PLOT WITH CURSORS: If On is selected, then any plots
made will include the cursor and datum lines. Otherwise,
they will be omitted.
PLOT OUTPUT: This line only appears if the instrument is
fitted with an internal colour plotter. The internal plotter
is automatical1y selected on power up if it is fitted. If
required the plot output can be directed, via the RS423
port, to an external plotter by selecting RS423 with
button 5.
ADVANCE PAPER: Pressing button 6 when the internal
plotter is selected causes the paper to be advanced
approximately 15mm per press. This line only appears if
the internal plotter is selected on line 5.
400 Series Operators Manual
Performance Checking 4.1-4.5
400 Series Operators Manual
4. Performance Checking
4.
The aim of this section is to allow the user of a 400 oscilloscope to verify the major analogue performance parameters.
Should any of these fail to be within specification then it is
recommended that the instrument be re- calibrated. A skilled
technician with the aid of the service manual should be able to
perform this task; alternatively return the instrument to your
Gould distributor.
The measured frequency should be greater than 20MHz.
4.1 Risetime
Equipment required:
Fast edge pulse generator <Ins: Bradley oscilloscope
calibrator type 192 or Tektronix PG506 or similar; 50
Ohm precision coaxial cable;
50 Ohm precision terminator.
Increase the frequency on the signal generator until
the peak to peak amplitude reduces to 4.2 divisions.
4.3 Trigger Sensitivity
Equipment required:
Signal generator: Tektronix SG503 or similar; 50
Ohm coaxial cable;
50 Ohm terminator.
Connect the signal generator to a channel input through the
coax cable and the terminator, which should be at the 400 end
of the cable.
1.
Select 100mY per division on the input channel and set
the timebase to 50jLs per division.
2.
Select Auto trigger.
Connect the pulse generator to a channel input through the coax
cable and the terminator, which should be at the 400 end of the
cable.
3.
Set the signal generator to 50kHz or similar reference
frequency and adjust the amplitude to give 0.3 of a
division peak to peak.
1.
Select 100mY per division on the input channel and set
the timebase to Suss per division.
4.
Select AC Coupling and Norm on the trigger controls.
2.
Set the generator to give 600mY peak to peak at a
repetition rate of 1 MHz and adjust the trigger level to
give a stable trace.
It should be possible to find a suitable trigger level to obtain a
stable triggered picture.
3.
Select the cursor and change the time base to 500ns per
division.
4.4 Trigger Bandwidth
4.
Apply x10 trace magnification using the Mag button to
give 50ns per division, and adjust the horizontal Position
buttons to centre the fast edge.
5.
Position the cursor and datum lines on the edge such that
the cursor is 60m Y below the high level and the datum
lines cross 60m Y above the low level.
The rise time can now be read from the cursor line on the
bottom row of text. This figure should not be greater than 18ns.
4.2 Bandwidth
Equipment required:
Levelled signal generator: Tektronix SG503 or
similar;
50 Ohm coaxial cable;
50 Ohm terminator.
Connect the signal generator to a channel input through the
coax cable and the terminator, which should be at the 400 end
of the cable.
1.
Select 5mY per division on the input channel and set the
timebase to 50jLs per division.
2.
Set the amplitude of the signal generator to give six
divisions at 50kHz or similar reference frequency.
3.
Change the timebase range to 500ns per division.
Equipment required:
Levelled signal generator: Tektronix SG503 or
similar;
50 Ohm coaxial cable;
50 Ohm terminator.
Connect the signal generator to a channel input through the
coax cable and the terminator, which should be at the 400 end
of the cable.
1.
Select 100m Y per division on the input channel and
500ns per division on the timebase.
2.
Set the signal generator to 20MHz and adjust its
amplitude to give one and one half divisions on the
screen.
It should be possible to adjust the trigger level to give a stable
triggered trace.
4.5 Timebase Calibration
Equipment required:
Time calibrator: Bradley oscilloscope calibrator type 192
or Tektronix TG501 or similar;
50 Ohm coaxial cable;
50 Ohm terminator.
Connect the calibrator to a channel input through the coax cable
and the terminator, which should be at the 400 end of the cable.
Performance Checking 4.6-4.7
400 Series Operators Manual
1.
Select a suitable timebase range to view the signal and
set the channel attenuator to give between two and five
vertical divisions of signal.
2.
Select DC Coupling and Norm on the trigger controls.
3.
Adjust the trigger level to give a stable trace.
4.
Change the timebase to 500ns per division.
4.7 Max-Min (Alias Detector)
5.
Set the calibrator to produce markers every 500ns.
Equipment required:
6.
Select the cursors.
With the cursor and time datum on identical positions on any
two markers, the time difference should read in multiples of
500ns to within 1 %.
Note: Failure of this specification point is indicative of a
major system fault and the instrument should be serviced immediately.
4.6 Vertical Calibration
The peak to peak measurement should be 25m V to within 3%
and the trace should be 5 divisions high to +/- 0.1 divisions.
These measurements should be repeated on all the attenuator
ranges, each time setting the calibrator to 5 screen divisions for
the selected range.
Signal generator: Tektronix SG503 or similar; 50
Ohm coaxial cable;
50 Ohm terminator.
Connect the signal generator to an input channel through the
coax and the terminator, which should be at the 400 end of the
cable.
1.
Set the timebase to 500ns per division and select 100m
V per division on the input channel.
2.
Set the generator to give approximately 5 divisions at 1
MHz and adjust the trigger level to give a stable trace.
3.
Select 20ILs per division on the timebase. You should
notice that the screen picture will change considerably
with small changes in input frequency.
4.
Carefully adjust the frequency of the signal generator to
produce a sine wave of approximately 2 to 5 cycles. This
is an alias.
5.
Select the Max-Min function from the Display and
Trigger Menu.
Equipment required:
Oscilloscope calibrator: Bradley type 192 or similar;
Coaxial cable.
Connect the vertical calibration output of the oscilloscope
calibrator to the 400 through the coax cable.
1.
Set the timebase to 500ILs per division and select 5m V
per division for the input channel.
2.
Set the calibrator to give 25mV peak to peak, i.e. 5
screen divisions.
3.
Adjust the trigger level to give a stable picture.
4.
Switch the cursor on.
If Max-Min is functioning correctly and dot join is off then two
roughly horizontal lines will be displayed. These will be at the
peak levels of the input signal.
400 Series Operators Manual
Waveform Processing 5.1-5.1.1
5. WAVEFORM PROCESSING FUNCTIONS
(420 and 450 only)
If any of the calculations are set to either Pulse Width or
Risetime, lines 5,6 and 7 are displayed.
All the waveform processing functions are accessed through
the Post-Storage Master Menu. Selections 1, 2 and 3 on this
menu perform as described in section 3.9 to 3.12.
The calculation results are displayed in the three lines at the
bottom of the trace display; figure 5.1b shows an example.
Cursor measurements on timebase speeds of 200 and 100ns/div,
i.e. when ETS - equivalent time sampling - is in operation, are
only valid on traces that the cursor is on and that are triggered.
Selections 4 to 7 provide the waveform processing functions.
When performing any waveform processing that modifies a
displayed trace, the new data could be overwritten almost
immediately by a fresh acquisition unless the selected trace is
held or further acquisitions are prevented e.g. the instrument is
in single shot mode and the trace stored or no triggers are
provided.
5.1 Cursor Measurements
The 400 DSO has 3 user controlled lines for use with this
section of facilities. Their operation is fully described in section
2.4. The cursor is moved along the selected trace using the
◄► cursor buttons (5) the two datum lines are moved using
the datum buttons (2) the time datum line with ◄► and the
voltage datum with ▲ and ▼.
Pressing button 4 on the Post Storage Master Menu changes the
display to the Cursor Measurements Menu - figure 5.1a. The
cursor is used to determine the trace of interest and the cursor
and time datum lines define the portion of the trace to be
measured. Most trace measurements are with respect to the
voltage datum line.
Figure 5. 1 b. Example of Calculations on Trace
If all the cursor measurements are set to off, the cursor data line
on the display will show the message; "TRI CURSOR
MEASUREMENTS OFF", and if the data is invalid for the
measurement selected, the cursor line will display the message
"TRI INVALID DATA". The trace number in both the above
messages will change according to the selected trace.
5.1.1 Voltage and Time
The display shows the voltage between the voltage datum line
and the point where the cursor line crosses the trace and the
time between the time datum line and the cursor line.
Figure 5.1a. Cursor Measurements Menu
Three calculations are possible using buttons 2, 3 and 4. Each
calculation is selected from a roll around list containing the
following options. Voltage and Time, Peak-Peak, Max-Min,
Risetime (falltime), Overshoot (preshoot), Pulse Width,
Frequency, Period, Duty Cycle, RMS, Area and off. A
calculation can only be selected once e.g. if calculation 1 is set
to its default of Voltage and time, then Voltage and time will
not appear in the possible selections for calculations 2 or 3.
Figure 5.1.1. Voltage and time Measurement
Waveform Processing 5.1.2-5.1.4
400 Series Operators Manual
5.1.2 Peak-Peak
5.1.4 Risetime (falltime)
The display will show the peak to peak voltage difference
between the most positive and negative points of the trace
between the cursor and the time datum.
Position the cursor and the time datum at the 0% and 100%
points of the waveform. The software will calculate the rise or
fall time between the low and high percentage points of the
waveform.
Figure 5.1.2. Peak to Peak Measurement
Figure 5.1.4. Risetime Measurement
5.1.3 Max-Min
The display shows the voltages of the maximum and minimum
points of the waveform between the cursor and time datum
measured with respect to the voltage datum.
The default percentage points are 10% and 90%. Using buttons
5, 6 and 7 these values can be changed. Button 5 selects the
point to be changed, either Risetime High or Risetime Low.
When the appropriate point is selected, it can be changed by
pressing button 6 or 7 as required. Low can be set from 0 to
49% in 1 % steps and high from 51 to 100% also in 1 % steps.
Percentages set are retained even on power down, but are reset
to their default vales if a full calibration is performed.
If Pulse Width is also selected as one of the calculations,
pressing button 5 steps around 4 entries; Risetime Low,
Risetime high, Pulse Width Left and Pulse Width Right.
Figure 5.1.3. Max-Min Measurement
400 Series Operators Manual
5.1.5 Overshoot (preshoot)
Position the cursor and the time datum at the 0% and 100%
points of the waveform. The software calculates the overshoot
as a percentage of the voltage difference between the 0% and
100% points.
Waveform processing 5.1.5-5.1.8
The default percentage points are 50% and 50%. Using buttons
5, 6 and 7 these values can be changed. Button 5 selects the
point to be changed, either Pulse Width Left or Pulse Width
Right. When the appropriate point is selected, it can be changed
by pressing button 6 or 7 as required. Both of them can be set
from 5% to 95% in 1 % steps.
Percentages set are retained even on power down, but are reset
to their default vales if a full calibration is performed.
If Risetime is also selected as one of the calculations, pressing
button 5 steps around 4 entries; Pulse Width Left, Pulse Width
Right, Risetime Low and Risetime High.
5.1. 7 Frequency, Period, Duty Cycle
The three parameters frequency, period and duty cycle of a
waveform are displayed with this selection. The voltage datum
defines the zero crossing voltage. The cursor and time datum
must enclose at least three zero crossings.
If the voltage datum does not cross the trace, the mean of the
waveform will be taken as the zero crossing line.
Figure 5.1.5 Overshoot Measurement
The frequency is the inverse of the period calculated above.
The duty cycle is the ratio of the mark or space at the time
datum to whole pulse period expressed as a percentage.
5.1.6 Pulse Width
The software measures the time between the 50% points of a
pulse. The time datum and cursor should be positioned on
either side of the pulse to be measured. Both positive or
negative pulses can be measured.
The first pulse between the time datum and the cursor is
measured and if the leading edge of the pulse is noisy, the
noise may be taken as a pulse and be measured rather than the
pulse of interest.
Figure 5.1.7. Freq. Period and Duty Cycle Measurement
5.1.8 RMS
This selection calculates and displays both the RMS voltage
with respect to the voltage datum and the AC-RMS voltage
with respect to the mean of the trace. Both voltages are calculated on the waveform bounded by the cursor and time
datum.
Figure 5.1.6. Pulse Width Measurement
Waveform Processing 5.1.9-5.2.4
400 Series Operators Manual
5.1.9 Area
5.2 Trace Manipulation
This selection calculates the area bounded by the trace and the
cursor and datum lines.
Pressing button 5 on the Post Storage Master Menu changes the
display to the Trace Manipulation Menu - figure 5.2. The trace
to be manipulated is selected with the cursor and the required
function with button 2, 3 or 5.
If no trace has the cursor on it when button 2, 3 or 5 is pressed,
the warning message "NO TRACE SELECTED" will be
displayed.
Trace manipulations are with respect to the voltage datum line.
After any trace manipulation has been performed pressing
button 7 labelled Restore, will return the display to the original
stored waveform.
Figure 5.1.9. Area Measurement
The result is given in volt-seconds or similar units.
If the trace falls below the voltage datum then the area will be
negative. Positive and negative areas are added algebraically to
obtain the displayed result.
Figure 5.2. Trace Manipulation Menu
5.2.1 Filter Frequency
The trace can be filtered by a single low pass filter and the 3dB
point displayed on the trace display.
The frequency of the filter applied to the waveform when
button 2 is pressed is selected using button 1.
One of six filter stages can be chosen from the roll-around list.
The actual frequencies available depend on the current timebase
as shown in table 5.2.1.
5.2.2 Filter Current Trace
Pressing button 2 causes the software to perform the filtering.
5.2.3 Invert Current Trace
If button 3 is pressed, the selected trace will be inverted about
the voltage datum. The original trace can be 'Restored' using
button 1.
5.2.4 Integrate Scaling
To allow an integrated waveform to fit on the screen a scaling
factor can be applied to the integrate function. Pressing button 4
steps around the factors xl, xO.5, xO.2 and xO.1. The selected
factor is highlighted.
400 Series Operators Manual
Timebase
50s
20s
10s
5s
2s
Is
500ms
200ms
100ms
50ms
20ms
10ms
5ms
2ms
1ms
500J.Ls
200J.Ls
100J.Ls
50J.Ls
20J.Ls
10J.Ls
5J.Ls
2J.Ls
1J.Ls
500ns
200ns
100ns
(450 only) 50ns
Waveform Processing 5.2.5-5.3
F1
F2
F3
F4
F5
F6
111mHz
278m Hz
556mHz
1. 11Hz
2.78Hz
5056Hz
l1.1Hz
27.8Hz
55.6Hz
111Hz
278Hz
556Hz
1. 11KHz
2.78KHz
5.56KHz
11.1KHz
27.8KHz
55.6KHz
111KHz
278KHz
556KHz
l.l1MHz
2.78MHz
5.56MHz
11.1MHz
27.8MHz
55.6MHz
111MHz
4504mHz
114mHz
227mHz
455mHz
1.14Hz
2.27Hz
4055Hz
1104Hz
22.7Hz
45.5Hz
114Hz
227Hz
455Hz
1.14KHz
2.27KHz
4.55KHz
1104KHz
22.7KHz
45.5KHz
114KHz
227KHz
455KHz
1.14MHz
2.27MHz
4.55MHz
l104MHz
22.7MHz
45.5MHz
21.3mHz
53.2mHz
106m Hz
213mHz
532mHz
1.06Hz
2.13Hz
5032Hz
1O.6Hz
2103Hz
53.2Hz
106Hz
213Hz
532Hz
1.06KHz
2.13KHz
5032KHz
10.6KHz
2103KHz
53.2KHz
106KHz
213KHz
532KHz
1.06MHz
2.13MHz
5.32MHz
1O.6MHz
21.3MHz
1O.3mHz
25.8mHz
51.5mHz
103mHz
258mHz
515mHz
1.03Hz
2058Hz
5.15Hz
1003Hz
25.8Hz
5105Hz
103Hz
258Hz
515Hz
l.03KHz
2.58KHz
5.15KHz
1003KHz
25.8KHz
5105KHz
103KHz
258KHz
515KHz
1.03MHz
2.58MHz
5.15MHz
1O.3MHz
5.05mHz
12.6mHz
25.3mHz
50.5mHz
126mHz
253mHz
505mHz
1.26Hz
2053Hz
5.05Hz
12.6Hz
2503Hz
50.5Hz
126Hz
253Hz
505Hz
1.26KHz
2.53KHz
5.05KHz
12.6KHz
2503KHz
5005KHz
126KHz
253KHz
505KHz
1.26MHz
2.53MHz
5.05MHz
2.51mHz
6.27mHz
12.5mHz
25.1mHz
62.7mHz
125mHz
251mHz
627mHz
1.25Hz
2.51Hz
6.27Hz
12.5Hz
25.1Hz
62.7Hz
125Hz
251Hz
627Hz
1.25KHz
2051KHz
6.27KHz
12.5KHz
25.1KHz
62.7KHz
125KHz
251KHz
627KHz
1.25MHz
2.51MHz
Table 5.2. 1. Filter Frequencies
5.2.5 Integrate Current Trace
When button 5 is pressed, the display will show the integrated
waveform of the selected trace. The voltage datum is taken as
zero for integration and the cursor reads out the value in Vs volt-seconds - or similar units.
5.3 Trace Arithmetic
Pressing button 6 on the Post Storage Master Menu selects the
Trace Arithmetic Menu, figure 5.
Using buttons 1,2 and 3 the traces involved and the calculation
required can be chosen with the selected option being
highlighted.
When multiply is selected the scale line next to button 5
appears so that a scale factor can be applied to the calculation
result to allow it to fit on the screen.
The result of the arithmetic will be stored in the highlighted
trace selected with button 4.
Pressing button 7 - Execute - causes the calculation to happen.
Figure 5.3. Trace Arithmetic Menu
Waveform Processing 5.4-5.4.2
5.4 Persistence/Limits Testing
Button 7 on the Post Storage Master Menu selects the Persistence/Limits Menu - figure 5.4.
400 Series Operators Manual
allowing it to be examined. This screen picture can be plotted,
and with the internal colour plotter, the upper and lower limits
will be in the same colour as the reference trace to distinguish
them from the failed trace.
During limits testing the trigger level and position markers are
not displayed.
Test Limits and Display Limits cannot be turned on if the DSO
is in X- Y mode or if X-Mag is turned on. Similarly, XMag or
X - Y mode cannot be selected if either Test Limits or Display
Limits is on. If any of these situations occur one of the
following messages will be displayed as appropriate.
NO LIMITS DISPLAY IN XY
NO XY WHEN LIMITS DISPLAYED
NO LIMITS DISPLAY IN X-MAG NO
LIMITS TESTING WITH X-MAG
NO X-MAG WHEN LIMITS DISPLAYED
NO X-MAG WITH LIMITS TESTING
Figure 5.4. Persistence/Limits Testing Menu
5.4.1 Limits
The upper and lower limits to be tested against are set by
displaying the desired limit trace on the screen and then
pressing either button 1 or 2 as required. When a limit has been
successfully set, the message LIMIT SET is displayed. Limit
traces may be sent to or read from the 400 with an external
computer, using the mnemonics STU for the upper limit and
STL for the lower limit, using the data transfer facility
described in section 2.6.
The band between the upper and lower limits will be crosshatched and the limits testing will be performed on all the data
points of both the upper and lower limit traces within the area
bounded by the cursor and time datum lines.
Limit testing may be turned On or Off or set to Stop-on-fail by
pressing button 3. When turned On, each successive acquisition
is tested and a warning message displayed when a trace is
outside the limits. This warning and trace will be overwritten
by the next acquisition.
If the limits mode is set to Stop-on-fail, acquisitions are halted
when a trace that is outside the limits is captured,
Also, Display Limits cannot be turned on if persistence is on.
Trying to select this mode results in the message; NOT WHEN
PERSISTENCE.ON.
A record of all failing traces can be automatically plotted by
setting the limits testing mode to stop on fail, and selecting
Auto Plot from the plotter menu. Any acquired trace that then
falls outside the limits will be plotted. If the plot button is not
pressed to initiate a continuous sequence, only the first failing
trace will be acquired and plotted.
5.4.2 Persistence
The 400 is not capable of variable persistence but either the
number of acquisitions accumulated before the display is
cleared or the absolute time between display clearances can be
set from the Persistence/Limits Menu.
The choice of Persistence for time or number of acquisitions is
made using button 5 with the actual time of number of cycles
set by button 6 or 7 as appropriate.
When using the persistence mode, the trigger level and position
markers are not displayed.
If Display Limits is on, then persistence cannot be selected and
the message NOT WHEN LIMITS DISPLAYED is shown if
button 5 is pressed.
400 Series Operators Manual
6.0 Battery Unit Operation
The 400-107 battery unit option for the 400 series DSOs
provides the instruments with a fully automatic built in Nickel
Cadmium battery and charger which allows uninterrupted
operation of the DSOs in the event of an AC supply failure and
complete operation independent of an AC supply.
The battery is fully protected against damage from overcharge
or over-discharge and automatically receives a fast recharge
followed by a continuous trickle charge when AC power is
restored or re-applied to the unit.
A DSO with the battery option operates as an integral unit. All
the normal functions of the DSO with the exception of line
trigger are available and function according to the main
operators manual. Full operation of the DSO is also available
while the battery is recharging.
In the following text, battery unit refers to the option and DSO
refers to the main oscilloscope. The circled numbers in this
section refer to the numbered controls in figure 6.2
An AC supply is applied to the battery unit. This charges the
batteries and is linked through the battery unit to power the
DSO. The battery unit then also provides a DC supply to the
DSO for use in the absence of an AC supply.
Figure 6. Battery Unit Interconnections
Battery Unit Operation 6.1
The battery unit is electrically connected to the DSO by two
rear panel cables; one for the AC supply and one for the DC
supply.
CAUTION: Before use ensure that the connections between
the battery unit and the DSO are correct, see figure 6.0.
6.1 AC Supply Operation
To operate either the DSO or the battery unit the master on/off
switch (37) on the front of the battery unit must be turned on.
If the instrument has been unused for a period of a month or
more at 20°C or for a week or more at 50°C, individual cells
within the batteries may have lost different amounts of charge.
24 hours operation on charge is required prior to discharge.
With an AC supply applied to the battery unit, and the master
power switch (37) turned on, the batteries are on charge. See
section 6.3.
When the DSO power is also switched on, the DSO operates
from the AC supply. Normal operation of the oscilloscope is
possible, and the batteries remain on charge.
Battery Unit Operation 6.2-6.5
6.2 DSO Battery Operation
400 Series Operators Manual
Limited battery capacity is available to operate the DSO if the
AC supply is removed for any reason during fast charge. After
full discharge, the battery capacity will be approximately half
the elapsed recharge period.
If the unit is used outside the temperature range of + 15°C to +
35°C, the normal operation may be limited as discussed in
section 6.5.
6.4 Alarm Conditions
Figure 6.2 Battery Unit Front panel indicators
If no AC supply is available, the DSO can be powered from the
battery unit simply by turning both the Master power switch
(37) and the DSO power switch (1) on. If the DSO is in
use on an AC supply that is interrupted, the operation of the
DSO is uninterrupted as it changes to DC operation.
The alarm lamp (38) will flash if the DSO attempts to draw
power from the batteries while an AC supply is present. i.e.
when the DSO should operate from the AC supply. This
condition only occurs if the interconnecting AC cable is not
connected or the DSO's AC supply fuse is open.
Once this condition is detected, the battery supply to the DSO is
automatically switched off.
When the fault has been remedied, the alarm condition can be
cleared by turning the master power switch (37) off for at
least 10 seconds and then on again.
When the batteries approach full discharge their output is
automatically cut off to prevent damage due to deep discharge.
In this state no lamps on the battery unit will be illuminated.
The alarm lamp (38) will be illuminated constantly if the
battery temperature trip operates - see section 6.5 - or if a
severe fault blows the internal battery protection fuse.
Replacement of this fuse requires removal of the instrument
covers and it should only be attempted by suitably qualified
personnel. See section 1.1.3.
Similarly, there will be no lamps illuminated if there is no AC
supply and the DSO is switched off, whether or not the battery
unit is switched on.
6.5 Extreme Temperature Operation
Whenever the batteries are supplying power to the DSO the
Using battery lamp (41) is illuminated.
and Storage
6.3 Battery Recharge
To recharge the batteries, the master on/off switch (37) on
the front of the battery unit must be on and AC power supplied
to the rear socket.
After any period of battery operation the battery unit will
power up in fast charge mode when the AC supply is restored
or re-applied. After a time period dependant on the discharge
time, which allows at least 80% of the charge withdrawn to be
replaced, the unit reverts to standby charge mode. This
replenishes approximately 5% of the total battery capacity per
hour, and is maintained continuously to hold the batteries in
the fully charged state.
The batteries will be charged by the AC supply whether or not
the DSO itself is turned on.
When AC is applied, either indicator (39) or indicator (40)
will be illuminated to show the charge mode.
The DSO may be powered from the battery unit at any ambient
temperature up to +45°C. However, the internal battery
temperature detector may inhibit full fast charge at
temperatures above 35°C. In this condition, both the standby
charge lamp (40) and the alarm lamp (38) will be on
constantly.
Charging is interrupted until the battery temperature reduces
naturally to below the trip temperature, when the alarm lamp
will be extinguished. Standby charge will then be resumed. At
least 24 hours standby charge may then be required to regain
full charge.
Although the battery unit may be stored at temperatures up to
50°C, and operated at temperatures up to 45°C, it is
recommended that the period of such usage is limited. Prolonged exposure to high temperatures will adversely affect the
battery life.
Indicator (39) shows that the battery is on fast charge, and
indicator (40) shows that the battery is on standby charge.
The battery unit may be used or recharged at temperatures
down to O°C but repeated recharge below 15°C may adversely
affect the battery life.
No harm can be caused to the batteries by leaving them on
standby charge for indefinite periods, although if they have
been left in this mode for a long time, one cycle of full discharge and fast recharge may be required to obtain maximum
capacity.
The batteries will not be damaged by storage in the discharged
state, however, it is recommended that they are fully charged
before being unused for long periods. 24 hours operation on
charge is recommended before use, after the unit has been
unused for more than a month at 20°C or a week at 50°C.
400 Series Operators Manual
6.6 Independent Operation of DSO
In any circumstances if the battery facility is not required the
AC supply link from the battery unit to the DSO can be
disconnected and an AC supply fed directly into the DSO. In
this mode, the master power switch (37) must be off or the
DC cable disconnected from the DSO.
This mode of operation allows the use of the DSO on an AC
supply above the 45°C limit for battery operation, but below
the 50°C limit for the DSO alone.
Similarly, if the DC cable from the battery unit is removed
from the DSO, an external DC supply can be used to power the
DSO. For example, a high capacity battery could operate the
DSO remote from an AC supply for long periods. The batteries
cannot be re-charged from an external DC supply.
Battery Unit Operation 6.6
Alphabetical Summary
7. Alphabetical Summary of Controls
As part of AC/DC/Gnd, AC removes DC components
from signals of between 4Hz and 20MHz. As part of hf
rej/ AC/DC it sets AC coupling for the trigger signal,
which may be between 10Hz and 20MHz.
AC
(14) Controls the type of coupling between the
instrument and the input signal. AC is used to remove
DC components from signals of between 4Hz and
20MHz. DC couples the input signal directly to the
instrument, so all frequency components of the signal up
to 20MHz will be displayed. Gnd internally disconnects
the inputs from the instrument; a 0V reference signal is
displayed instead.
400 Series Operators Manual
External trigger source (connected via EXT TRIG
socket).
Ext
EXT TRIG Socket (16) for the connection of external triggers
of up to +/-250Y peak.
Gnd Part of AC/DC/Gnd, Gnd disconnects the input signal
from the instrument and displays a 0V reference signal
instead.
AC/DC/Gnd
Add
(18) Selects trigger coupling. The hf rej (high
frequency reject) option is a 15kHz low-pass filter. Any
coupling may be used with any trigger source except
Line where the coupling is not selectable.
hf rej/AC/DC
Part of Off/On/Inv; this option is used to invert the
display of a channel's trace - i.e. to negate it so that it is
displayed upside down.
Inv
(10)
Displays the sum (or difference if one channel is
inverted) of the channels. The original traces disappear
and the resultant trace is displayed as a new Channel 2
trace.
Arm'd
(29) Illuminates after S/Shot is pressed; it will stay lit
until either a valid trigger has been received or the Run
button has been pressed.
(20) Selects the trigger mode. Norm means that
valid triggers must be received to initiate captures. Auto
triggering is the same as Norm except that if no valid
trigger has been received for some time, an artificial
trigger will be generated: the instrument will generate its
own triggers if no valid trigger has been received for
0.05s (i.e. 20Hz is the lower limit).
(22) Adjusts the trigger level, which is indicated by
two trigger bars on the display.
Line Mains frequency triggers. Input coupling may not be
selected with this option.
Mag
(32) Used to control the horizontal magnification of the
traces; when selected, a xl0 expansion around the centre
of the screen is applied to the traces. The timebase
setting is altered to reflect the expansion.
(24)
Will attempt to arrange the display so
that two to five complete cycles appear, with the
amplitude set so that the height of the trace is between
two and five screen divisions. Also, it selects Auto
trigger to ensure that the screen is frequently updated
and a trace will be visible. If the frequency of the input
signal is less than 20Hz, this function may not operate
correctly.
AUTO SETUP
Level
(3) this allows the vertical magnitude of a stored waveform to be varied using the
POST STORAGE/DATUM keys.
Mag part of Dat/Pos/Mag
(35) Swaps the display between the last used
menu and the trace display.
Menu/Traces
(31) Selects one of three display modes. Refreshed
mode is the normal oscilloscope mode whereby the trace
is plotted from left to right. Roll mode is like a chart
recorder: the display scrolls from right to left as the trace
is acquired. X-Y mode takes the CH1 (X) input as the x
(horizontal) component and the CH2(Y) input as the y
(vertical) component.
Auto/Norm
Mode
CH1/CH2/Ext/Line (17) Steps through trigger sources.
CH1(X) (9) One of two channel signal input sockets, this one
Norm Part of Auto/Norm. The instrument will only initiate
being for the connection of signals up to +/ -400Y peak to
Channel. It is used for the X component of an X- Y mode trace.
It can also be a trigger source if selected using
CH1/CH2/Ext/Line.
ns (33) Decreases the horizontal TIME/DIV.
(12) As CH1, but CH2 is used for the Y component
of an X- Y trace, where CH1 is the X component.
CH2(Y)
CURSOR
(7)
These two buttons control the movement of the
captures when a valid trigger is received when in Norm
mode.
Off/On/lnv (13) Switches the channel On or Off. If the
channel is on, its trace can be displayed Inverted (upside
down).
Plot
(34) Produces a plot of the current display on a suitable
plotter. If a plot is in progress, pressing this button will
abort it.
cursor.
Control
Dat
DC
(2) Selects the control master menu.
Part of Dat/Pos/Mag (3)
Allows the POST STOR·
AGE/DATUM and CURSOR keys to be used to control the movement of the cursor and datum lines.
.
As part of AC/DC/GND, DC couples the input signal
directly to the instrument so that all frequency components from DC to 20MHz are displayed. As part of hf
rej/AC/DC it couples triggers from DC to 20M Hz to
the instrument.
Pos Part of Dat/Pos/Mag (3) this allows the trace on which
the cursor is placed to be shifted using the POST
STORAGEIDATUM keys.
(8) Moves that channel's trace vertically.
Position (26) Moves all traces horizontally.
Post Store (6) Selects the post storage master menu.
POWER (1) Used to switch the instrument on or off.
Pos'n
Alphabetical Summary
400 Series Operators Manual
Pre-Trigger (23) Used in conjunction with the menus to
control the degree of pre-trigger.
Refr Refreshed mode is the normal oscilloscope mode whereby
the trace is plotted from left to right.
Roll This display mode operates like a chart recorder: the
display scrolls from right to left as the trace is acquired.
Run
(27)
Puts the instrument in continuous capture mode;
the instrument automatically re-arms itself after each
acquisition.
Sec (33) Increases the horizontal TIME/DIV.
Select Trace
(4)
Places the cursor onto a displayed trace.
S/Shot (30) Arms the instrument for a single-shot
triggered acquisition sweep (capture). The Arm'd light
will be illuminated to show that this button has been
pressed.
Stor'd
(28) Illuminates on completion of a single-shot
acquisition. It will stay lit until the instrument is rearmed or until Run is pressed.
TIME/DIV (33) Controls the sweep rate of the trace. The
timebase can be varied from 100ns/div to 50s/div in a
1,2,5 sequence of values.
Trace Hold (25) Freezes the relevant trace or traces until
pressed again.
Trig'd (21) This lights up when the instrument is receiving
valid triggers.
Uncal Controlled by the Var button. When lit, the coarse
setting of the attenuator remains unchanged, but a
variable gain is applied to the input signal. This control
applies attenuation in the range of 1 to 0.4. Thus, with an
initial setting of 1 V, the actual sensitivity of the channel
may be set anywhere between 1 V and 2.5V per division.
The V/DIV buttons are used to vary the sensitivity.
Var (15) Toggles between Uncal & Cal.
V/DIV
(11) Adjusts the sensitivity of the instrument over
discrete calibrated ranges from 2mV/div to 5V/div in 1,
2, 5 steps. With a x10 probe the ranges are 20m V/ div to
50V/div at the probe tip. Input voltages must not exceed
+/-400V peak. If the Uncal light is on, then these
buttons control the sensitivity over an uncalibrated
continuous range of values.
mode takes the CH1(X) input as the x (horizontal)
component and the CH2(Y) input as the y (vertical)
component.
+/- (19) Selects triggering on positive or negative slopes.
X-V
Appendix 1 Error Messages
Appendix 1: Error Messages
When something is wrong, an error message will be displayed
in inverse text near the bottom of the display. Also in some
cases a message appears to confirm that an action has occurred.
Brief explanations of when these messages occur are given
below in alphabetical order.
1. CALIBRATION DISABLED
If Calibrate channel or 2 is pressed when Auto-cal is
disabled.
2. LEVEL FIXED WHEN SOURCE=LINE
If the trigger level controls are touched when line trigger
is selected.
3. NO ADD IN XY MODE
If trying to select ADD when in X- Y mode.
4. NO ADD WHEN HELD
If the add button is pressed when either or both CH1 or
CH2 are held.
400 Series Operators Manual
15. NO X-MAG IN XY MODE
If X-MAG is pressed when in X-Y mode.
16. NO X-MAG WHEN LIMITS DISPLAYED
If X-MAG is pressed while display limits is on.
17. NO X-MAG WITH LIMITS TESTING
If X-MAG is pressed while the instrument is in limits
testing mode.
18. NO XY WHEN LIMITS DISPLAYED
If XY is pressed while display limits is on.
19. NO XY WHEN CHANNELS ADDED
If trying to select X-Y mode when channel ADD is on.
20. NO XY WITH X-MAG
If trying to select X- Y mode when X-MAG is on.
21. NOT WHEN LIMITS DISPLAYED
If persistence is turned on while display limits is on.
22. NOT WHEN PERSISTENCE ON
If display limits is turned on while the instrument is in
persistence mode.
5. NO BINARY WITH X-ON X-OFF
If X-ON X-OFF is selected and binary number base is
also selected.
23. PLOTTING - PRESS PLOT AGAIN TO ABORT
Appears whilst plot is in progress.
6. NO CURSORS IN XY
If either the Datum or Cursor position keys or the select
trace button is pressed when in X-Y mode.
24. TR1 CURSOR MEASUREMENTS OFF
If all three cursor measurement options are set to off, this
message appears.
7. NO HORIZONTAL MAG
If the post storage <l or l> keys are pressed when the
cursor and X-MAG are on.
25. TR1 INVALID DATA
If the data is invalid for the measurement selected.
8. NO LIMITS DISPLAY IN XY
If limit display is turned on while the instrument is in XY mode.
9. NO LIMITS DISPLAY IN X-MAG
If limit display is turned on while the instrument is in XMAG mode.
10. NO LIMITS TESTING ON REF TRACE
If limit testing is turned on while the cursor is on the
reference trace.
11. NO LIMITS TESTING WITH X-MAG
If limit testing is turned on while the instrument is in XMAG mode.
12. NO POST STORAGE IN XY
If the cursor is selected and then the unit is switched to
X-Y mode and then a post storage key is pressed.
13. NO TRACE SELECTED
If the cursor is off and either the restore, cursor position
or post storage movement keys are pressed.
14. NO X-MAG IN ACTIVE ROLL
a) If the X-MAG key is pressed while the instrument is
in ROLL mode on timebase ranges slower than
20ms/div, with the traces not stored or either channel not
held.
b) If in ROLL mode on timebase ranges faster than
50ms/div with continuous acquisitions and X-MAG on,
and then the timebase range is changed to be 50ms/div
or slower.
26. TRACE COPIED
To confirm that a trace has been copied to the reference
trace.
(Note also that if a trace is copied to the reference trace,
the reference trace is automatically turned on as well).
27. TRACE MEMORY UNUSED
a) If trying to turn the reference trace on when it has not
been previously copied/saved.
b) If an attempt is made to recall a backup memory when
that memory has not been previously saved.
28. TRACE NOT YET STORED
If the cursor is selected and a post-storage key pressed
but the trace is not stored or held.
29. TRACE RECALLED
To confirm that a trace has been recalled.
30. TRACE SAVED
To confirm that a trace has been saved.
31. USE CH1 POS'N KEYS IN XY
If either horizontal position key is pressed when in X-Y
mode.
32. WAITING FOR TRIGGER
If S/SHOT has been selected but no trigger has been
detected within 2s.
400 Series Operators Manual
33. X-MAG RESTORED WHEN STORED/HELD
If the traces are stored or held in ROLL mode. Then if
X-MAG is selected and either S/SHOT or RUN is
pressed, or either channel unheld.
i.e. X-Mag has been turned off while the display is in
active roll mode, but it will be restored when the display
is once again stored or held.
Appendix 1 Error Messages
34. O.IILS TO IOOILS/DIV, NO MAX-MIN
If max/min is selected when timebase is faster than
100μs/DIV.
Appendix 2 Specification
Appendix 2: Specification
DISPLAY
CRT: 5 inch diagonal screen
Raster scan, vertically scanned
Graticule: Electronically generated 8 x 10 divisions with
0.2 sub divisions
Intensity: Separate controls for Traces, Graticule and
Alphanumerics
VERTICAL SYSTEM
Two identical channels, CH1 and CH2. Inputs via BNC
connectors
Sensitivity: 2mV/div to 5V/div in 1-2-5 sequence
Accuracy: +/- 2.5% of reading +/- 1 digitising level
(1/30 of a division)
Variable Sensitivity: >2.5:1 range allowing continuous
adjustment of sensitivity between ranges
Input Impedance: lMnl28pF
Input Coupling: DC-GND-AC
Bandwidth:
400and420:
DC: 0-20MHz (-3dB) AC:
450:
4Hz-20MHz (-3dB) DC: 0 50MHz (-3dB) AC: 4Hz 50MHz (-3dB)
Input protection: 400V DC or peak AC at 10kHz or less
400 Series Operators Manual
Auto/Normal Mode: In Auto the timebase free runs
when insufficient signal (20Hz - 20M Hz) is present or
when the selected level is outside the range of the
input signal.
Source: CH1, CH2, External or Line
Coupling: DC, AC, high frequency reject filter
Slope: +ve or -ve
Sensitivity 400 and 420:
Internal DC Coupled <0.3 div DC to 2M Hz
<1.5 div DC to 20MHz
AC Coupled <0.3 div 10Hz to 2 MHz
<1.5 div 4Hz to 20MHz
External DC Coupled <150mV DC to 2MHz
<600mV DC to 20MHz
AC Coupled <150mV 10Hz to 2MHz
<600m V 4Hz to 20MHz
Sensitivity 450:
Internal DC Coupled <0.3 div DC to 2MHz
<1.5 div DC to 50MHz
AC Coupled <0.3 div 10Hz to 2MHz
<1.5 div 4Hz to 50MHz
External DC Coupled < 150m V DC to 2MHz
<600mV DC to 50MHz
AC Coupled <150mV 10Hz to 2MHz
<600mV 4Hz to 50MHz
Range:
Internal +/- 10 divisions
External +/- 3V
Expansion: Post storage x 0.062 to x 4.00
External input impedance: 100K!1/10pF
HORIZONTAL SYSTEM
(Timebase)
External input protection: 250V DC or peak AC
Sweep rate:
400 and 420:
450:
27 ranges in 1-2-5 sequence
28 ranges in 1-2-5 sequence
Transient capture: 500ns/div to 50s/div.
Repetitive sampling:
400 and 420:
200 and 100ns/div
450:
200,100 and 50ns/div
Sample rate accuracy: +/- 0.01 % of sample time
Expansion: x 10 with linear dot interpolation
TRIGGER DELAY
Trigger delay range: 20ns to 5000s
Trigger delay accuracy: +/- 0.01 %, +/- 1 ns
Pre-trigger: 0 to 100% of sweep in 0.4% steps
Resolution: 2% of time/div, 20ns min
TRIGGER SYSTEM
Variable level control with Auto/Normal facility,
resolution of less than 0.1 div.
Trigger jitter: 50s/Div to 0.5fLs/Div, +/- 2% of time/Div
(unexpanded), +/- 2ns
0.2fLS/Div and 0.lfLs/Div, +/- 2ns
DISPLAY MODES
Refreshed: Stored data and display updated by triggered
sweep
Roll: Stored data and display updated continuously for
timebases 50ms/div to 50sec/div. Trigger stops the
updating process
Refresh and roll operate as repetitive single shot for
timebase ranges faster than 50ms/div
Dot join: Dots are joined by vertical raster lines. Linear dot
interpolation is provided when the trace is Xexpanded
X-Y: X-Y display is 8 x 8 divisions. Stored data and display
are updated by triggered sweep. There is no dot
joining, x 10 expansion or cursor in this mode. CH1 is
used as the X (8 bit resolution 25 steps/div) and CH2
as the Y (7 bit resolution 15 levels/div) deflection
Single trace: CH1 or CH2
Dual trace: CH1 and CH2
Appendix 2 Specification
400 Series Operators Manual
Add: CH1 and CH2 can be added to give the algebraic sum of
the two channels. Addition is post storage
Invert: Both channels may be independently inverted Single
Shot: Freezes store at the end of a single triggered sweep
Display trace hold:(all) Freezes the display immediately
Channel 1 Trace hold: Freezes channel 1 display
immediately
Channel 2 Trace hold: Freezes channel 2 display
immediately
Reference trace: One reference trace can be displayed in
addition to the two input channels. This can display a
waveform memory of a trace copied from CH1 or CH2
ACQUISITION SYSTEM
Maximum sample rate: 100 megasamples/sec simultane-
ously on each channel
Vertical resolution: 8 Bits (1 in 256) 30 levels per division
Record length: 501 points per channel
ACQUISITION MODES
Normal mode: Transient and repetitive signal capture.
(Repetitive capture is only on timebase ranges 100 or
200ns/div, which gives an equivalent sample rate of
2ns/sample on the 100ns/div range.)
X-Y Mode: Bandwidth 20MHz (-3dB) 50MHz on 450.
Phase difference <4° @20MHz. Acquisition rate
dependent on the timebase range.
Averaging: Averages can be set from 2 to 256 in binary
sequence, selected from the menu system. Averaging
operates continuously or, using single shot for the set
number of acquisitions. (weighted average)
Peak detection: Minimum pulse width Zus, 100% probability
of capture. Operates on timebase range 100p..s/ div or
slower
MEMORY
Waveform memory: 3 reference memories are selectable for
waveform data storage. These memories are Nonvolatile
Set-Up: The control set-up is retained on memory during
Cursor: The measurement cursor can be assigned to a trace
and measurements made in time and voltage with
respect to the datums
Cursor measurement display: 6 Voltage and 6 Time
displayed on screen
Accuracy: Voltage +/- 2.5% of reading, +/- 1 digitising level
(1/30 of a division)
Time +/- 0.01%, of reading +/- 1 digit
Resolution: Voltage 0.4% of F.S.D.
Time 0.2% of F.S.D.
Trigger Indication: On screen trigger level and trigger point
indication
Alphanumerics: Display on screen to indicate vertical sen-
sitivity and input coupling for each channel, timebase
speed and pre-trigger or trigger delay. Arrow for off
screen indication of trigger point and traces
MENU SELECTION
Control master menu: Selects menus for prime functions:-
Status, display and trigger facilities, display intensity,
reference trace control, RS423 interface, and special
functions
Menu/traces: Alternately switches between trace display and
the last menu selection
Post storage master menu: Selects menus for fast access
to save/recall trace and plot output parameters
AUTO SET UP
Automatically sets the front panel controls to display any
applied repetitive input signal for frequencies greater than
20Hz. Trigger and timebase priority is CH1, CH2 and Line
RS423 INTERFACE
Serial interface port for bi-directional waveform data and
associated range parameter transfer
Baud rate: 75, 150,300,600, 1200,2400,4800,9600
Data bits: 8
Parity: None
Start-stop: Fixed, one start bit, one stop bit
power down
Retention time: The memory support is trickle charged and
will retain information for 1 month after power down
ON SCREEN MEASUREMENTS and
ALPHANUMERIC DISPLAY
Datum Lines: Horizontal and vertical full screen amplitude
time and voltage datums
DIGITAL PLOTTER OUTPUT
The instrument can directly output to suitable HPGL
format plotters via the RS423 interface port
Plot mode: Manual or auto selection to output a stored trace
Annotation: Range and scaling annotation, graticule , cursors
and cursor readout can all be included in the plot output
Colors: Color pens automatically selected when
available
Appendix 2 Specification
Internal Color Plotter (420 and 450 only)
Paper type: Gould part No. 04101165 (8 roll pack). Paper
400 Series Operators Manual
Trace Manipulation
Filter
length: 55 metres, equivalent to approximately 300
6 selectable stages of low pass filter for each timebase
range.
plots.
Pen type: Gould part No. 04101175 (4 color pack).
Invert
Inverts the trace about the voltage datum.
Pen life: Minimum of250 metres line length approximately
175 plots.
Integrate
Calculates the indefinite integral and displays the
resultant waveform. A scaling factor of xl, x0.5 , x0.2 or
x0.1 can be applied to the integrated waveform.
WAVEFORM PROCESSING FUNCTIONS
(420 and 450 only)
Cursor Measurements
Voltage and Time
The cursor measures the voltage and time relative to the
voltage and time datum lines respectively.
Peak-Peak
Calculates peak-to-peak voltage of the waveform
bracketed between the time datum and cursor.
Max-Min
Displays maximum and minimum voltage excursions of
a waveform relative to the voltage datum position. The
cursor and datum bracket the waveform of interest.
Risetime (falltime)
Calculates the rise or fall time between the 10% and
90% points of a signal; The 0% and 100% points are set
by the cursor and time datum.
Overshoot (preshoot)
Calculates the over or pre shoot of a signal as a percent
of the 100% point; The 0% and 100% points are set by
the cursor and time datum.
Pulse Width
Calculates the time between 50% points of a pulse, with
the pulse being bracketed between the time datum and
the cursor.
Trace Arithmetic
Add
Adds any two traces and displays the result in a selected
trace.
Subtract
Subtracts any two traces and displays the result in a
selected trace.
Multiply
Multiplies any two traces and displays the result in a
selected trace. A scaling factor of xl, x0.5 , x0.2 or x0.1
can be applied to the multiplied waveform.
Limits testing
Tests a waveform with respect to two definable limit
waveforms and will display a TEST FAILED message if
the acquired signal fall outside the limits. Acquisition
can be continuous or stop-on-fail.
Persistence
Either the time, or number of acquisitions between
screen clearances can be set to give a persisted trace
display. Times of 0.5, 2, 5, 15, 30 or 90 seconds or
multiple acquisitions of 10, 20, 50, 100, 200 or 500
traces can be selected. Both options can be set to infinity
to give a permanent persistence display.
Frequency, Period, Duty Cycle
Calculates the average frequency, period and duty cycle
of a waveform. Uses either the voltage datum as the zero
crossing point or the mean of the waveform. The cursor
and time datum set the limits of the area of interest.
RMS
Calculates the root mean square (RMS) voltage of a
waveform bracketed between the cursor and time datum.
The voltages are calculated with respect to both the
voltage datum (DC-RMS) and the mean of the
waveform (AC-RMS).
Area
Calculates the area under a waveform bracketed between the cursor and the voltage and time datum lines.
REAL TIME CLOCK (420 and 450 only)
24 hour time and date set via a menu. Printed out on
plots to give a permanent record of acquisition time. The
time and date is maintained for approximately ten years
with the instrument's power disconnected.
BATTERY UNIT 400-107
Operation of DSO from fully charged battery:
1.5 hours minimum.
90% recharge time from full discharge: 5 hours maximum
Battery life to 70% capacity:
200 complete discharge cycles at 20°C
100050% discharge cycles at 20°C.
AC supply range: 90 to 130V or 180 to 265V, 45 to 400Hz.
Indication provided for:
Battery in use (discharging)
Battery on fast charge Battery
on standby charge Alarm
conditions
400 Series Operators Manual
ENVIRONMENTAL
Temperature: Full Specification: + 15°C to + 35°C.
Operating:0°C to +50°C.
(0°C to +45°C with battery unit)
Storage: -l0°C to +70°C.
(-l00C to +50°C with battery unit)
Humidity: Operating IEC 68-2-Ca at 45°C with 95% RH.
Non-operating IEC 68-2-Db cycling 25°C to 45 °C
with 95% RH, 6 cycles (144 hours)
Vibration: MIL spec 8100. Random frequency vibrations of
5-500Hz at 1g rms for 15 minutes
IEC 68-2-6 Test Fc.
15 cycles of I minute duration 10 to 55Hz at 0.6mm
peak to peak displacement in each of the three major
axis (4g at 55Hz)
Appendix 2 Specification
WEIGHT
400:
420&450:
400 with battery unit:
400 and 450 with battery unit:
5.5Kg (12Ib) approx.
6.5Kg (14.2Ib) approx.
1l.7Kg (25.7Ib) approx.
12.7Kg (27.9Ib) approx.
DIMENSIONS
See Figure A2.
ACCESSORIES SUPPLIED
Operating manual
Line cord
DC power connector
Safety: Designed for IEC 348 Cat I standard
EMC: EMI to BS6527, VDE 0871 Class A ESD
10kV to IEC 801-2, BS6667-2
MISCELLANEOUS
Calibrator: 1V peak to peak +/- 1%, frequency approx 1
KHz calibration signal on front panel
Ground: Front panel ground reference
POWER REQUIREMENTS
AC Voltage: 90 to l30V or 190 to 265V
Frequency: 45 to70 Hz. 400Hz operation is available as an
option.
DC Voltage: 12 to 33V
Power: 85V A170W approx
OPTIONAL
ACCESSORIES
Rack mounting kit
Carrying case (soft padded)
Carrying case (hard, foam lined)
Front facia cover
Accessory Pouch
Service manual
Probe DC to 100MHz switched x 1 and x I 0
Probe DC to 250MHz 1200V x 100
Probe DC to 7MHz 15kV x 1000
External TV Trigger Unit
PN 04090490
PN 04101221
PN 04101222
PN 04101220
PN 04101223
PN 04101224
PBI2
PBI7
PB27
Appendix 2 Specification
Figure A2 400 Family Dimensions
400 Series Operators Manual
400 Series Operators Manual
Appendix 3: Remote DC Operation
of the 400 series DSOs
As well as the possibility of having an internal battery unit option 107 see section 6- the 400 series DSOs can be operated
from external DC voltages between 11.5 and 33V measured at
the DSO. This has the advantage of uninterruptible operation
which an oscilloscope powered from an inverter type of DC
supply does not have. Inverter type DC supplies are powered
by batteries and generate AC power in the absence of an
incoming AC supply. In order for them to start working they
first have to detect the loss of the AC supply which can take a
few seconds.
Any applications which require continuous operation of a DSO
regardless of AC supply fluctuations or drop-outs, as well as
those requiring a remote power source will benefit from the
versatility of the 400 series' DC power feature. Some examples
of these applications are uninterruptible power supply
development and troubleshooting, and troubleshooting of
supply interference caused by large electric maCH1nes.
The DC operation power dissipation of the 400 is about 60W
and of the 420 and 450 about 62W (67W when printing.) This
dissipation is a constant power load to the source.
Appendix 3 Remote Operation
The diode in series with the external DC source protects the
instrument against reverse polarity voltages and allows both the
AC and DC supplies to be connected at the same with the
source supplying the higher voltage being the one from which
current is drawn.
Table of Annealed Copper wire sizes vs. length for
O.5V drop at 5 Amp current
Diameter
Cross Sectional Area
(mm)
(mm)
0.8
0.98
1.26
1.78
2.26
2.76
3.19
3.57
M
0.5
2.9
0.75
1.25
2.5
4.0
6.0
8.0
10.0
Length
4.35
7.25
14.5
23.2
34.8
46.4
58.0
TableA3.1
This means that less current is drawn at higher voltages and
conversely more current at lower voltages. The user should
ensure that there is sufficient source voltage to overcome cable
and connector voltage losses that may occur because of the
relatively high current involved. See table A3.1.
Figure A3.2 below shows the 400's internal arrangement of the
power connections. It can be seen that current will be drawn
from the AC supply as long as the external DC input voltage is
lower than the AC input voltage minus the two diode voltage
drops in the bridge rectifier.
This simple diode O-Ring of the two power sources means that
switCH1ng from one source to another is very quick there is no
interruption in the operation of the instrument while one source
takes over from the other.
External DC
from battery
unit option or
separate DC
source
FigureA3.2
AC from
internal
transformer
Appendix 4 Front & Back Pictures
Fig. A4a Rear View
Fig. A4b RS423 Connections
400 Series Operators Manual
400 Series Operators Manual
Appendix 4 Front & Back Pictures
Fig. A4c Front Panel Control
Service Facilities
Service Facilities
Gould and its distributors and agents maintain comprehensive
after sales facilities and, whether or not it is still under
guarantee, the instrument should be returned to the local Gould
service centre or distributor through whom it was supplied for
servicing if this is necessary. The type and serial number of the
instrument should always be quoted, together with full details
of any fault and service required.
400 Operators Manual
Equipment returned for servicing must be adequately packed,
preferably in the box in which the product was supplied and
shipped, with transportation charges prepaid. We accept no
responsibility for instruments arriving damaged.
Our Sales and Service Department and those of approved
distributors and agents are ready to assist you at all times.
The Gould Service Department and those of approved distributors and agents can provide maintenance and repair
information by telephone or letter, if required.
PRINCIPAL GOULD SERVICE OFFICES
AUSTRIA
Gould Electronics GmbH,
Niederlassung Wien, Mauerbachstrasse 24, A-1140 Wien.
Telephone (222) 972506. Telex 01-31380.
Fax (222) 97250638
FRANCE
Gould Electronique,
57 Rue Saint Sauveur, Ballainvilliers, 91160 Longjumeau.
Telephone (6) 934-1067. Telex 600824 GOULD.
Fax (6) 934-2073
Adresse postale: B.P. 115,91162 Longjumeau Cedex.
GERMANY
Gould Instruments,
Waldstrasse 66,6057 Dietzenbach
Telephone (06074) 4908-0. Fax (06074) 4908-48.
WL490
UNITED KINGDOM
Gould Electronics Ltd.,
Instrument Systems,
Roebuck Road, Hainault, liford, Essex IG6 3UE. Telephone
081-5001000. Telex 263785. Fax 081-5010116.
U.S.A
Gould Inc., Recording System Division,
3631 Perkins Avenue, Cleveland, Ohio 44114. Telephone
(216) 361-3315. Telex 1961123 GLD RS UT. Fax (216)
881-4256.
And other Gould Agents and Distributors worldwide.
Manual Part Number 457400
Notes
400 Operators Manual Amendment Sheet
November 1990
400 System Reset
Should the system memory become corrupted, the instrument could lock out the front panel operation
or begin to behave erratically. Since the internal system variables are held in non-volatile memory,
turning the set off an on again may not clear them. In this unlikely event a system reset may be
necessary.
A system reset should only be used as a last resort as all the internal memories will be cleared
erasing all reference traces, calibration details, and set-up details.
To perform a system reset, switch the instrument off. Press and hold the Hold All and the Plot buttons.
Keep these buttons pressed and turn the instrument on using the Power button. The instrument will then
start up in its reset condition. This can be confirmed by noting that on power up the instrument
performs a complete calibration.
Amendment to 400 series Operators Manual Part Number 457403
Page 1 of 1 Part No. 460150