1
Agilent
PSA Series Spectrum Analyzers
E4406A Vector Signal Analyzer
GSM with EDGE Measurement Personality
Technical Overview with Self-Guided Demonstration
Option 202
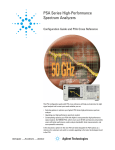
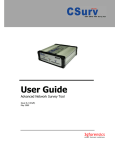
The PSA Series of high-performance
spectrum analyzers and E4406A
vector signal analyzer (VSA) offer
the GSM with EDGE measurement
personality to help you measure radio
systems quickly, easily, and
accurately in the lab or on the
manufacturing line.
Evaluate Your Designs Quickly and Thoroughly in R&D and Manufacturing
The Global System for Mobile
Communications (GSM) digital
cellular standard is a time division
multiple access (TDMA) multiplexing
scheme that uses Gaussian minimum
shift keying (GMSK) modulation.
Making GSM measurements and
meeting standards requirements
presents unique challenges.
Enhanced Data Rates for GSM
Evolution (EDGE), which is also
TDMA but uses 3π/8 8PSK (phase
shift keying) modulation, is an
enhancement to GSM that promises
to deliver true third-generation
(3G) wireless services such as
multimedia and other broadband
applications.
The Agilent PSA Series offers high
performance spectrum analysis up
to 50 GHz with powerful one-button
measurements, a versatile feature
set, and a leading-edge combination
of flexibility, speed, accuracy and
dynamic range. Expand the PSA to
include GSM and EDGE digital signal
analysis capability with the GSM
with EDGE measurement personality
(Option 202).
For many manufacturing needs,
the E4406A VSA, a vector signal
analyzer, is an affordable platform
that also offers the GSM with EDGE
personality.
This technical overview includes
• measurement details
• demonstrations
• PSA Series key specifications for
GSM with EDGE measurements
• ordering information
• related literature
All demonstrations utilize the
PSA Series and the E4438C ESG
vector signal generator; however,
they can also be performed with the
E4406A VSA. Keystrokes surrounded
by [ ] indicate hard keys located on
the front panel, while key names
surrounded by { } indicate soft
keys located on the right edge of
the display.
GMSK power
versus time
page 4
Transmit power
page 10
Phase and
frequency
page 6
EDGE
measurements
page 11
PSA Series spectrum analyzer
Output RF
spectrum
page 8
Key
specifications
page 13
GMSK
transmitter
band spurious
page 10
Ordering
information
page 15
E4406A vector signal analyzer
2
Demonstration preparation
The following options are required for
the ESG and the PSA Series.
Product type
Model number
Required options
ESG vector
signal generator
E4438C
001 or 002 – baseband generator
402 – TDMA personalities
PSA Series
spectrum analyzer
E4440A/E4443A/E4445A/
E4446A/E4448A
B7J – Digital demodulation hardware
202 – GSM with EDGE measurement
personality
Since many essential EDGE transmitter
measurements are similar to GSM
measurements, the greater part
of this guide addresses GSM measurements. The last part concentrates
on the EDGE measurements,
particularly where they are different
from GSM. The PSA Series with this
optional measurement personality
can make complex GSM and EDGE
measurements easy.
Instructions
Begin by connecting the ESG’s 50 Ω RF
output to the PSA’s 50 Ω RF input
with a 50 Ω RF cable. Turn on the
power in both instruments. For multislot measurements, the PSA will need
an external trigger signal from the ESG.
Connect the “EVENT 1” output on the
rear panel of the ESG to the “TRIGGER
IN” input on the rear panel of the PSA
with a 50 Ω BNC connector cable.
On the PSA:
Keystrokes
On the ESG:
Choose GSM 900 frequency band.
[Preset] [Frequency] {More} {Freq Channels}
{Channel Band} {GSM/Edge Bands}
{P-GSM Base} {Freq Channels On}
Select GSM mode and data format.
{Mode} {Real Time TDMA} {GSM}
{Data Format Framed}
Turn on GSM modulation.
{GSM On}
Set the amplitude to –10 dBm.
[Amplitude] [-10] {dBm}
Turn on RF output.
[RF On]
Perform factory preset.
(Skip this step for E4406A VSA.)
[System] {Power On/Preset} {Preset Type}
{Factory}
Enter the GSM with EDGE mode in the analyzer.
[Preset] [Mode] {GSM (w/EDGE)}
Verify setup for GSM 900 band.
[Mode Setup] {Radio} {Band} {P-GSM}
Set center frequency to absolute RF channel
number (ARFCN1) 1 (935.2 MHz).
[FREQUENCY] {ARFCN} [1] [Enter]
1. Absolute radio frequency channel number
3
GMSK power versus time
GSM is a TDMA multiplexing scheme
with eight time slots, or bursts,
per frequency channel. If the burst
does not occur at exactly the right
time, or if the burst is irregular, then
adjacent channels can experience
interference. Because of this,
industry standards specify a tight
mask for the fit of the TDMA burst.
Easily measure the RF envelope of a
GSM/EDGE burst, and receive pass/fail
result based on the GSM/EDGE
standard. This measurement provides
a visual display of power versus time,
helping you see transient characteristics
at the edges of a burst or power
control throughout the burst.
This measurement also allows you
to focus on the rise and fall time of
the burst or the whole burst, and
provides an on-screen mask to help
you visually determine where any
violations may occur.
Instructions
On the PSA:
Activate power versus time measurement.
[MEASURE] {GMSK Pwr vs Time}
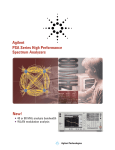
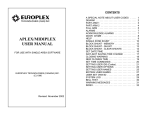
Zoom in on RF envelope (Figure 1).
[AMPLITUDE] {Ref Value} [–10] {dBm}
{Scale/Div} [0.2] {dB}
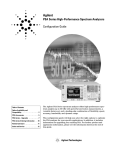
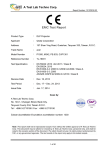
View the shape of the rising and falling parts
of the burst (Figure 2).
[Trace/View] {Rise & Fall}
Expand the rising edge display.
You can toggle between the three display
sections by pressing the [Next Window] key.
[Next Window] until the upper left part of the
display is highlighted in green, [Zoom]
Zoom in on the trace.
[AMPLITUDE] {Ref Value} [–8.5] {dBm}
{Scale/Div} [0.5] {dB}
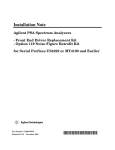
Turn on averaging and display maximum and
minimum averaged traces (Figure 3).
Observe the different types of averaging
available under the {Avg Type} menu.
[Meas Setup] {Avg Bursts On} {Avg Type}
{Max & Min}
Deactivate averaging and view full display.
{Avg Bursts Off} [Zoom]
Figure 1.
GSM power versus
time measurement
You control the following unique
GSM/EDGE power versus time
measurement parameters:
• measurement time (defaults to
1 slot)
• power control level
• burst search threshold
• number of bursts to average over
• RBW filter width and shape
• average mode and type
In this section, measure power versus
time for the GSM signal, then view
only the rising and falling portions of
the burst.
4
Keystrokes
Figure 2.
Rising and falling
edges of GSM burst
Figure 3.
Rising edge
with averaging
The PSA is also able to measure
power versus time for multiple slots
at the same time. Multi-slot views
give information about the entire
GSM frame. This is especially useful
for examining slots that transmit at
different power levels within a
single frame.
Now experiment with the multi-slot
capabilities of the PSA.
Instructions
Keystrokes
On the ESG:
Add another timeslot.
[Mode] {Real Time TDMA} {GSM}
{Configure Timeslots} {Timeslot #} [2] {Enter}
{Timeslot Type} {Normal All} {Timeslot On}
On the PSA:
Enable the external trigger.
[Meas Setup] {Trig Source} {Ext Rear}
Switch to multi-slot view in the power versus
time measurement.
[Trace/View] {Multi-Slot}
View the entire frame (8 slots) (Figure 4).
[Meas Setup] {Meas Time} [8] [Enter]
Figure 4.
Multi-slot power
versus time
5
GMSK phase and frequency
Phase and frequency error are the
measures of modulation quality
for GSM systems. Since GSM
systems use relative phase to
transmit information, phase and
frequency accuracy are critical to
the system’s performance. In a real
system, poor phase error will reduce
the ability of a receiver to correctly
demodulate.
Instructions
Demodulation and signal analysis
required by industry standards is
further complicated by the challenges
of triggering and synchronizing to
the actual GSM signal. The Agilent
PSA Series has multiple trigger and
synchronization options to make
measurements simple.
Diagnose and correct modulation
errors with displays of phase error
versus time and demodulated bits.
GSM phase and frequency parameters:
•
•
•
•
•
burst averaging
average mode
mean or max averaging type
selectable test limits
IQ origin offset on/off
In this section, a one-button measurement
captures the phase and frequency error
information.
6
Keystrokes
On the PSA:
Measure GMSK phase and frequency error.
[MEASURE] {GMSK Phase & Freq}
Enable the external trigger.
The two vertical, white bars in the RF Envelope
plot in the lower, left part of the display indicate
which timeslot is being measured.
[Meas Setup] {Trig Source} {Ext Rear}
Make the measurements on timeslot 2 (Figure 5).
Notice the bars in the lower, left display move
to timeslot 2 with zoom.
[FREQUENCY] {Timeslot On} [2] {Enter}
View the polar vector diagram (Figure 6).
[Trace/View] {I/Q Measured}
View the demodulated I and Q bits (Figure 7).
{Data Bits}
Figure 5.
Phase and
frequency error
Figure 6.
I/Q polar vector plot
Figure 7.
I and Q
demodulated bits
7
GMSK output RF spectrum (ORFS)
The modulation process in a
transmitter causes the continuous
wave (CW) carrier to spread spectrally.
This is referred to as “spectrum
due to modulation and wideband
noise.” Defects in the transmit chain
may cause the spectrum to spread
excessively, resulting in interference
with other frequency bands.
Measuring the spectrum due to
modulation can be thought of as
making an adjacent channel power
(ACP) measurement where several
adjacent channels are considered.
GSM transmitters ramp RF power
rapidly. The transmitted RF carrier
power versus time measurement
is used to ensure that this process
happens at the correct times and
happens fast enough. However, if
RF power is ramped too quickly,
undesirable spectral components
will arise in the transmitted signal.
This upsets the “spectrum due to
switching,” which again results in
interference with other frequency
bands.
This exercise explores the ORFS
measurement using the PSA.
8
Instructions
Keystrokes
On the ESG:
Return to a single timeslot signal.
{Timeslot #} [2] {Enter} {Timeslot Off}
On the PSA:
Set analyzer to make measurements on
default timeslot.
[FREQUENCY] {Timeslot Off}
Activate the ORFS measurement (Figure 8).
The default setting measures spectrum due to
modulation at multiple offsets. This measurement
takes about one second to complete.
[MEASURE] {GMSK Output RF Spectrum}
Examine spectrum due to modulation at a
single offset (250 kHz) (Figure 9).
[Meas Setup] {Meas Method} {Single Offset}
Now measure the spectrum due to switching.
{Meas Type} {Switching}
Go back to multi-offset measurement.
Observe that this measurement is completed
in about 2 seconds.
{Meas Method} {Multi-Offset}
Restore the default measurement.
{More} {Restore Meas Defaults} [Return]
View ORFS with mask (Figure 10).
This measurement takes several seconds
to complete.
{Meas Method} {Swept}
Figure 8.
ORFS spectrum due
to modulation
Spectrum due to modulation
and spectrum due to switching
measurements are usually grouped
together and known as the output
RF spectrum (ORFS). The GSM
3GPP (Third-Generation Partnership
Project) specifications have particular
restrictions on ORFS for a series
of frequencies. Verification of
compliance with the 3GPP requires
up to 80 dB of dynamic range. The
PSA Series has more than enough
dynamic range to accomplish this,
and a complete ORFS measurement
(modulation and switching) can be
performed in 3 seconds1. Another
great feature of the PSA’s ORFS
measurement is its ability to
represent the spectrum due to
modulation data in either a traditional
table format or a spectrum trace
with a mask. Both the table and
the mask use a pass/fail indicator
to signify compliance with the
3GPP specification.
Figure 9.
ORFS spectrum due
to modulation and
switching at 250 kHz
Figure 10.
ORFS with mask
GSM/EDGE output RF spectrum
parameters:
• burst averaging
• measurement types from
modulation and switching,
modulation, switching, or full
frame modulation
• multi offset, single offset or swept
method
• short, standard, or custom
frequency offsets
• fast averaging
• RBWs at various offsets
1. Remote operation with SCPI commands.
9
Transmit power
Carrier power is the measure of
in-channel power for GSM systems.
Mobile devices and base stations
must transmit enough power with
sufficient modulation accuracy to
maintain a call of acceptable quality
without the power leaking into other
frequency channels or timeslots. GSM
systems use dynamic power control
to ensure that each link is maintained
with minimum power. This gives two
fundamental benefits: overall system
interference is kept to a minimum
and, in the case of mobile stations,
battery life is maximized.
Instructions
Keystrokes
On the PSA:
Measure transmit power (Figure 11).
[MEASURE] {Transmit Pwr}
Move the threshold level to –40 dB.
Notice the horizontal, white level bar move down.
[Meas Setup] {Threshold Lvl} [–40] {dB}
Figure 11.
Transmit power
measurement
In this section, measure the mean
transmitter carrier power and view the
signal with high dynamic range.
GMSK transmitter band spurious
Transmitter band spurious is a
measurement that identifies
undesirable energy in wrong parts
of the transmitter band. This
measurement reveals little more
than the switching due to modulation
and wideband noise measurement,
however, it is a swept measurement
with no time gating.
Instructions
Keystrokes
On the ESG:
Increase the GSM signal amplitude.
[Amplitude] [15] {dBm}
On the PSA:
Measure transmitter band spurious emissions
(Figure 12).
[MEASURE] {More} {GMSK Tx Band Spur}
Figure 12.
GMSK transmitter
band spurious
Make this one-button measurement on
the PSA. Sufficient power is required
at the input for optimum dynamic range,
and the PSA will automatically set
the attenuation level whenever the
measurement is restarted ([Restart] key).
10
10
EDGE measurements
EDGE has the same spectral
characteristics as GSM, as well as
the same symbol rate and frame
structure (Table 1). Therefore,
many of the EDGE measurements
are almost, if not exactly, identical
to the GSM measurements. The only
measurement that is significantly
different between the two signal
formats is modulation accuracy.
The critical metric for GSM is phase
error. For EDGE, the modulation
quality metric is error vector
magnitude (EVM).
Table 1. Representative specifications for GSM and EDGE signal formats
Modulation
Bits/symbol
Data bits per burst
Symbol rate
Filter
GSM
EDGE
GMSK
1
114
270.833 kHz
0.3 Gaussian
3π/8 8PSK
3
342
270.833 kHz
Linearized Gaussian
Instructions
On the ESG:
Choose GSM 900 frequency band.
[Preset] [Frequency] {More} {Freq Channels}
{Channel Band} {GSM/Edge Bands}
{P-GSM Base} {Freq Channels On}
Select EDGE mode and data format.
{Mode} {Real Time TDMA} {EDGE}
{Data Format Framed}
Turn on EDGE modulation.
{EDGE On}
Set the amplitude to –10 dBm.
[Amplitude] [–10] {dBm}
Turn on RF output.
[RF On]
EDGE EVM settings:
• averaging amount, type
• selectable limits based on test
conditions
• extreme limits on/off
• droop compensation on/off
• frequency error tolerance range
(wide/narrow)
Keystrokes
On the PSA:
This measurement lets you easily
analyze the EVM of an EDGE radio
with a constellation diagram and a
tabular list of measurement results.
This display helps diagnose modulation
or amplification distortions that
lead to bit errors in the receiver.
Agilent’s unique algorithm provides
a zero-ISI (inter-symbol interface)
constellation that maintains the
same pinpoint accuracy and methods
for diagnosis as the traditional
Make the EDGE power versus time measurement
(Figure 13).
Observe the greater amplitude variations within
the burst compared to the GSM signal.
[MEASURE] {More} {EDGE Pwr vs Time}
Measure EDGE ORFS.
[MEASURE] {More} {EDGE Output RF
Spectrum}
Activate the EDGE EVM measurement (Figure 14).1
[MEASURE] {More} {EDGE EVM}
This exercise explores some of the
EDGE measurements with emphasis
on the EVM measurement.
Figure 13.
EDGE power
versus time
View error and EVM plots.
[Trace/View] {I/Q Error}
Examine the demodulated data bits (Figure 15).
{Data Bits}
1. Though the EDGE signal has considerable inter-symbol-interference (ISI),
Agilent’s proprietary ISI compensation algorithm provides both a clear constellation diagram and
accurate EVM measurements.
11
Figure 14.
EDGE EVM
measurement with
polar vector plot
Figure 15.
EDGE demodulated
data bits
12
PSA Series
Key Specifications1
GSM with EDGE measurement personality
The following specifications apply to models E4443A/45A/40A only.
Models E4446A and E4448A have similar, but not warranted performance.
Power versus time measurement (GSM/EDGE)
Minimum carrier power at RF input
Absolute power accuracy for in-band signal
(excluding mismatch error)
Attenuation > 2 dB
Power ramp relative accuracy
(referenced to mean transmitted power)
RF input range = auto, +6 dB to noise
Mixer Level ≤ –12 dBm
0 to +6 dB
0 to noise
Mixer level ≤ –18 dBm, +6 dB to noise
Measurement floor
Time resolution
Burst to mask uncertainty
Output RF spectrum measurement (GSM/EDGE)
Minimum carrier power at RF input
ORFS relative RF power uncertainty
Due to modulation
Offsets ≤ 1.2 MHz
Offsets ≥ 1.8 MHz
Due to switching
ORFS absolute RF power accuracy,
attenuation > 2 dB
Dynamic range, spectrum due to modulation
Offset frequency
100 kHz
200 kHz
250 kHz
400 kHz
600 kHz
1.2 MHz
1.8 MHz
6.0 MHz
Dynamic range, spectrum due to switching
Offset frequency
400 kHz
600 kHz
1.2 MHz
1.8 MHz
–40 dBm (nominal)
–0.11 ±0.66 dB (-0.11 ±0.18 dB, typical)
±0.13 dB
±0.13 dB
±0.08 dB
±0.08 dB
–88 dBm + input attenuation (nominal)
200 ns
±0.2 bit (approximately ±0.7 µs)
–20 dBm (nominal)
±0.15 dB
±0.25 dB
±0.15 dB (nominal)
±0.72 dB (±0.18 dB, typical)
GSM/EDGE
67.3 dB
74.5 dB
76.9 dB
GSM
81.5 dB
85.6 dB
91.0 dB
90.3 dB
94.0 dB
EDGE
81.3 dB
85.1 dB
89.4 dB
90.2 dB
93.7 dB
72.1 dB
75.9 dB
80.2 dB
84.6 dB
1. For specifications on the E4406A VSA, please refer to the E4406A VSA data sheet,
literature number 5968-3030E.
13
PSA Series
Key Specifications,
continued
Phase and frequency error measurement (GSM)
Carrier power range at RF input
Phase error
RMS floor
RMS measurement accuracy
Peak phase error accuracy
Frequency error accuracy
I/Q origin offset
DUT maximum offset
Analyzer noise floor
Burst sync time uncertainty
Trigger to T0 time offset, relative offset accuracy
EVM measurement (EDGE)
Carrier power range at RF input
EVM
Operating range
Floor (RMS)
Accuracy EVM range, 1% to 10%
Frequency error accuracy
Trigger to T0 time offset relative offset accuracy
Ordering Information
+27 to –45 dBm (nominal)
0.5°
± 0.5°
± 2.0°
5 Hz +(transmitter frequency x frequency
reference accuracy)
–15 dBc (nominal)
–50 dBc (nominal)
± 0.1 bit (approximately ± 0.4 µs)
± 5.0 ns (nominal)
± 24 to –45 dBm (nominal)
0 to 25% (nominal)
0.5% (0.3% typical)
±0.5%
± 1 Hz + (transmitter frequency x frequency
reference accuracy)
± 5.0 ns (nominal)
PSA Series spectrum analyzer
General purpose measurements
E4443A
E4445A
E4440A
E4446A
E4448A
E444xA-226
3 Hz to 6.7 GHz
3 Hz to 13.2 GHz
3 Hz to 26.5 GHz
3 Hz to 44 GHz
3 Hz to 50 GHz
E444xA-219
E444xA-241
Options
To add options to a product, use the following
ordering scheme:
Model
E444xA (x = 0, 3, 5, 6 or 8)
Example options E4440A-B7J
E4448A-1DS
E444xA-266
Digital demodulation hardware
E444xA-1DS
E444xA-B7J
Digital demodulation
hardware (required for cellular
communication measurement
personalities)
Cellular communication measurements
E444xA-BAF
E444xA-210
E444xA-202
E444xA-B78
E444xA-214
E444xA-204
E444xA-BAC
E444xA-BAE
E444xA-211
14
W-CDMA measurement
personality (requires Option B7J)
HSDPA measurement personality
(requires Options B7J and BAF)
GSM w/ EDGE measurement
personality (requires Option B7J)
cdma2000 measurement
personality (requires Option B7J)
1xEV-DV measurement personality
(requires Options B7J and B78)
1xEV-DO measurement
personality (requires Option B7J)
cdmaOne measurement
personality (requires Option B7J)
NADC, PCD measurement
personality (requires Option B7J)
TD-SCDMA measurement
personality
Phase noise measurement
personality
Noise figure measurement
personality
Flexible digital modulation
analysis measurement
personality
Programming code compatibility suite
Hardware
E444xA-B7J
E4440A-122
E444xA-123
E444xA-124
E444xA-AYZ
E4440A-BAB
100 kHz to 3 GHz built-in
preamplifier
Digital demodulation hardware
80 MHz bandwidth digitizer
(E4440A only, excludes H70)
Switchable MW preselector
bypass (E4440A/43A/45A
only, excludes AYZ)
Y-axis video output
External mixing
(E4440A/46A/48A only,
excludes 123)
Replaces type-N input
connector APC 3.5
connector (E4440A only)
Amplifiers
E444xA-1DS
100 kHz to 3 GHz built-in
preamplifier
Ordering Information,
continued
Inputs and outputs
E4406A vector signal analyzer
E4440A-BAB
E4406A 7 MHz to 4 GHz
E444xA-H70
Replaces type "N" input
connector with APC 3.5
connector
70 MHz IF output (excludes
Option 122)
Connectivity software
E444xA-230
E4440A-235
BenchLink web remote
control software
PSA wide bandwidth digitizer
calibration wizard (requires
Option 122)
Accessories
E444xA-1CM
E444xA-1CN
E444xA-1CP
E444xA-1CR
E444xA-045
E444xA-0B1
E444xA-0B0
Rack mount kit
Front handle kit
Rack mount with handles
Rack slide kit
Millimeter wave accessory kit
Extra manual set including
CD ROM
Delete manual set
Warranty and service
Standard warranty is 36 months.
R-51B
Return-to-Agilent warranty and
service plan
For 3 years, order 36 months of the appropriate
calibration plan shown below.
E444xA-UK6
To add options to a product, use the following
ordering scheme:
Model
E4406A
Example options E4406A-BAH
Digital demodulation measurements
E4406A-BAF
E4406A-210
E4406A-B78
E4406A-214
E4406A-202
E4406A-204
E4406A-BAH
E4406A-BAC
E4406A-BAE
E4406A-HN1
Standard calibration
Standards compliant calibration
Service manual and calibration
software
Commercial calibration certificate with test data
W-CDMA measurement
personality
(Requires Option BAF)
cdma2000 measurement
personality
(Requires Option B78)
EDGE with GSM measurement
personality
1xEV-DO measurement
personality
GSM measurement personality
cdmaOne measurement
personality
NADC, PDC measurement
personality
WIDEN/IDEN measurement
personality
Inputs and outputs
E4406A-B7C
Calibration1
R-50C-001
R-50C-002
E444xA-OBW
Options
I/Q inputs
Connectivity software
E444xA-230
BenchLink Web Remote
Control Software
Warranty and service
Standard warranty is 36 months.
R-51B
Return-to-Agilent warranty and
service plan
Calibration1
For 3 years, order 36 months of the appropriate
calibration plan shown below.
R-50C-001
R-50C-002
Standard calibration
Standards compliant calibration
1. Options not available in all countries.
15
Product Literature
Selecting the Right Signal Analyzer
for Your Needs, selection guide,
literature number 5968-3413E
PSA Series literature
PSA Series, brochure,
literature number 5980-1283E
PSA Series, data sheet,
literature number 5980-1284E
Agilent Technologies’ Test and Measurement
Support, Services, and Assistance
Agilent Technologies aims to maximize the value you
receive, while minimizing your risk and problems.
We strive to ensure that you get the test and measurement capabilities you paid for and obtain the
support you need. Our extensive support resources
and services can help you choose the right Agilent
products for your applications and apply them successfully. Every instrument and system we sell has
a global warranty. Two concepts underlie Agilent’s
overall support policy: “Our Promise” and “Your
Advantage.”
E4406A VSA literature
E4406A VSA, brochure,
literature number 5968–7618E
E4406A VSA, data sheet,
literature number 5968–3030E
Application literature
Understanding GSM/EDGE
Transmitter and Receiver
Measurements for Base Stations
and Components, application note,
literature number 5968–2320E
Measuring EDGE Signals New
and Modified Techniques and
Requirements, application note,
literature number 5980–2508E
For more information on the
E4406A VSA or the PSA Series,
please visit:
www.agilent.com/find/vsa
www.agilent.com/find/psa
Agilent Email Updates
www.agilent.com/find/emailupdates
Get the latest information on the products and
applications you select.
Agilent Direct
www.agilent.com/find/agilentdirect
Quickly choose and use your test equipment
solutions with confidence.
Our Promise
Our Promise means your Agilent test and measurement equipment will meet its advertised performance and functionality. When you are
choosing new equipment, we will help you with
product information, including realistic performance
specifications and practical recommendations from
experienced test engineers. When you receive your
new Agilent equipment, we can help verify that it
works properly and help with initial product operation.
Your Advantage
Your Advantage means that Agilent offers
a wide range of additional expert test and
measurement services, which you can purchase
according to your unique technical and business
needs. Solve problems efficiently and gain a
competitive edge by contracting with us for
calibration, extra-cost upgrades, out-of-warranty
repairs, and onsite education and training, as well
as design, system integration, project management,
and other professional engineering services.
Experienced Agilent engineers and technicians
worldwide can help you maximize your productivity,
optimize the return on investment of your Agilent
instruments and systems, and obtain dependable
measurement accuracy for the life of those products.
Agilent Open
www.agilent.com/find/open
Agilent Open simplifies the process of connecting
and programming test systems to help engineers
design, validate and manufacture electronic products. Agilent offers open connectivity for a broad
range of system-ready instruments, open industry
software, PC-standard I/O and global support,
which are combined to more easily integrate test
system development.
www.agilent.com
For more information on Agilent
Technologies’ products, applications or
services, please contact your local Agilent
office. The complete list is available at:
www.agilent.com/find/contactus
Phone or Fax
United States:
(tel) 800 829 4444
(fax) 800 829 4433
Canada:
(tel) 877 894 4414
(fax) 800 746 4866
China:
(tel) 800 810 0189
(fax) 800 820 2816
Europe:
(tel) 31 20 547 2111
Japan:
(tel) (81) 426 56 7832
(fax) (81) 426 56 7840
Korea:
(tel) (080) 769 0800
(fax) (080)769 0900
Latin America:
(tel) (305) 269 7500
Taiwan:
(tel) 0800 047 866
(fax) 0800 286 331
Other Asia Pacific Countries:
(tel) (65) 6375 8100
(fax) (65) 6755 0042
Email: [email protected]
Contacts revised: 05/27/05
Product specifications and descriptions
in this document subject to change without notice.
© Agilent Technologies, Inc. 2005, 2004, 2002
Printed in USA, July 20, 2005
5988-2389EN