1
IntelliVue Information Center
INSTRUCTIONS FOR USE
Release E
English
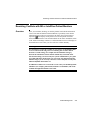
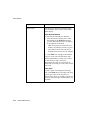
Printing History
Notice
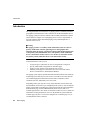
Instructions for use
Equipment specifications are subject to alteration without notice. All changes
will be in compliance with regulations governing manufacture of medical
equipment.
Printed in the USA.
Document number
M3150-9001E
© 2001, 2002 Philips Electronics North America Corporation
All rights are reserved. Reproduction in whole or in part is prohibited without
the prior written consent of the copyright holder.
Unauthorized copying of this publication may not only infringe copyright but
also reduce the ability of Philips Electronics to provide accurate and up-to-date
information to users and operators alike.
Printing History
New editions of this document will incorporate all material updated since the
previous edition. Update packages may be issued between editions and contain
replacement and additional pages to be merged by a revision date at the bottom
of the page. Note that pages which are rearranged due to changes on a previous
page are not considered revised.
The documentation printing date and part number indicate its current edition.
The printing date changes when a new edition is printed. (Minor corrections and
updates which are incorporated at reprint do not cause the date to change.) The
document part number changes when extensive technical changes are
incorporated.
First Edition ..................................................................................December, 2002
ii
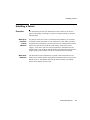
Warnings
Warnings
The warnings described below refer to the following devices:
•
•
•
IntelliVue M3150 Information Center
IntelliVue M3151 Information Center Client
Philips Recorder
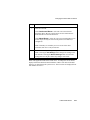
Warning
Some pace pulses can be difficult to reject. When this happens, the pulses
are counted as a QRS complex, and could result in an incorrect HR and
misdetection of cardiac arrest or some arrhythmias. Keep pacemaker
patients under close observation. See Chapter 5, “ST/AR Arrhythmia
Monitoring,” for specific warnings about monitoring paced patients.
Warning
This device provides ST level change information; the clinical significance
of the ST level change information should be determined by a physician.
Warning
Always confirm Information Center observations with clinical observation
of patient at the bedside before administering interventions.
iii
About this Book
About this Book
Overview
This User’s Guide can be used with the family of IntelliVue Information Centers
and the Philips Recorder. The IntelliVue Information Centers include the:
•
•
IntelliVue M3150 Information Center
IntelliVue M3151 Information Center Client
The terms “Information Center” and “central” are used throughout this book to
refer to all three models listed above. Specific differences between the various
models are noted in the text where applicable.
This User’s Guide contains information specific to the Information Center
including information on performing day-to-day tasks and troubleshooting
common problems, as well as detailed information about all clinical
applications. It also provides a complete list of alarm and INOP messages and
configuration choices. Sections that contain information about telemetry have
this telemetry transmitter icon next to the title:
Note—For specific information on using the Philips Telemetry System, please
refer to the your Philips Telemetry System Instructions for Use manual.
The on-line Information Center Help provides a Quick Guide for completing
basic tasks and troubleshooting problems. The on-line Quick Guide also
provides user information for the Philips Telemetry System.
Note—Not all functionality described in this manual may be available to you.
For information about your computer, printer, or other hardware, please consult
the accompanying documentation. To verify that the device is installed and
working correctly see the “Performance Assurance” section of the Philips
Information Center Service Manual.
iv
About this Book
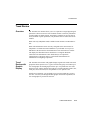
Document
Conventions
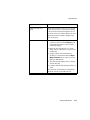
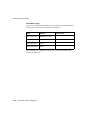
Procedures
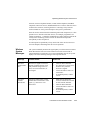
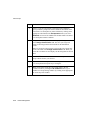
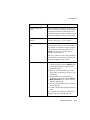
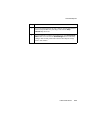
Procedures are indicated in text by the heading “Task Summary” followed by
the following table:
Step
Action
1
2
3
Bold Typeface
Objects of actions in procedures appear in bold typeface. Note the following
example:
Click the Update button.
Warnings
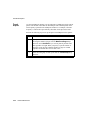
Warning
Warnings are information you should know to avoid injuring patients and
personnel.
Cautions
Caution
Cautions are information you should know to avoid damaging your equipment
and software.
Notes
Note—Notes contain additional information on the Information Center usage.
v
About this Book
vi
Contents
1. Introduction to the Information Center. . . . . . . . . . . . . . . . . . . . . . . . . . . . . . 1-1
The IntelliVue Information Center . . . . . . . . . . . . . . . . . . . . . . . . . . . . . . . . . . . . . . . . . . . . . . . . 1-2
Philips Patient Care System . . . . . . . . . . . . . . . . . . . . . . . . . . . . . . . . . . . . . . . . . . . . . . . . . . 1-2
IntelliVue Clinical Network with Database Server . . . . . . . . . . . . . . . . . . . . . . . . . . . . . . . . 1-5
Large Network Central Database System . . . . . . . . . . . . . . . . . . . . . . . . . . . . . . . . . . . . . . . 1-7
Intended Use . . . . . . . . . . . . . . . . . . . . . . . . . . . . . . . . . . . . . . . . . . . . . . . . . . . . . . . . . . . . . . . . . 1-9
The Information Center Features . . . . . . . . . . . . . . . . . . . . . . . . . . . . . . . . . . . . . . . . . . . . . . . . 1-10
Recordings and Reports . . . . . . . . . . . . . . . . . . . . . . . . . . . . . . . . . . . . . . . . . . . . . . . . . . . . 1-11
Point-of-Care Equipment . . . . . . . . . . . . . . . . . . . . . . . . . . . . . . . . . . . . . . . . . . . . . . . . . . . 1-11
Information Center Display Screens . . . . . . . . . . . . . . . . . . . . . . . . . . . . . . . . . . . . . . . . . . . . . . 1-14
Main Screen . . . . . . . . . . . . . . . . . . . . . . . . . . . . . . . . . . . . . . . . . . . . . . . . . . . . . . . . . . . . . 1-14
System Message Area. . . . . . . . . . . . . . . . . . . . . . . . . . . . . . . . . . . . . . . . . . . . . . . . . 1-14
Patient Sectors. . . . . . . . . . . . . . . . . . . . . . . . . . . . . . . . . . . . . . . . . . . . . . . . . . . . . . . 1-15
Patient Sector Buttons. . . . . . . . . . . . . . . . . . . . . . . . . . . . . . . . . . . . . . . . . . . . . . . . . 1-16
Patient Window . . . . . . . . . . . . . . . . . . . . . . . . . . . . . . . . . . . . . . . . . . . . . . . . . . . . . . . . . . 1-18
Single Display. . . . . . . . . . . . . . . . . . . . . . . . . . . . . . . . . . . . . . . . . . . . . . . . . . . . . . . 1-18
Dual Displays . . . . . . . . . . . . . . . . . . . . . . . . . . . . . . . . . . . . . . . . . . . . . . . . . . . . . . . 1-18
Information/Icons on the Patient Window . . . . . . . . . . . . . . . . . . . . . . . . . . . . . . . . . 1-20
Adjustments on the Patient Window. . . . . . . . . . . . . . . . . . . . . . . . . . . . . . . . . . . . . . 1-20
Patient Window Buttons . . . . . . . . . . . . . . . . . . . . . . . . . . . . . . . . . . . . . . . . . . . . . . . 1-20
Application Buttons . . . . . . . . . . . . . . . . . . . . . . . . . . . . . . . . . . . . . . . . . . . . . . . . . . 1-22
Basic Task Buttons . . . . . . . . . . . . . . . . . . . . . . . . . . . . . . . . . . . . . . . . . . . . . . . . . . . 1-23
Using Standby . . . . . . . . . . . . . . . . . . . . . . . . . . . . . . . . . . . . . . . . . . . . . . . . . . . . . . . . . . . . . . . 1-24
Telemetry, M3 and IntelliVue Patient Monitors . . . . . . . . . . . . . . . . . . . . . . . . . . . . . . . . . 1-24
Task Summary . . . . . . . . . . . . . . . . . . . . . . . . . . . . . . . . . . . . . . . . . . . . . . . . . . . . . . 1-25
Other Bedside Monitors . . . . . . . . . . . . . . . . . . . . . . . . . . . . . . . . . . . . . . . . . . . . . . . . . . . . 1-25
Task Summary . . . . . . . . . . . . . . . . . . . . . . . . . . . . . . . . . . . . . . . . . . . . . . . . . . . . . . 1-25
EASI 12-lead Review and Report . . . . . . . . . . . . . . . . . . . . . . . . . . . . . . . . . . . . . . . . . . . . . . . . 1-26
Task Summary . . . . . . . . . . . . . . . . . . . . . . . . . . . . . . . . . . . . . . . . . . . . . . . . . . . . . . . . . . . 1-26
Viewing Other Patients over the IntelliVue Clinical Network . . . . . . . . . . . . . . . . . . . . . . . . . . 1-28
Viewing a Bed Temporarily. . . . . . . . . . . . . . . . . . . . . . . . . . . . . . . . . . . . . . . . . . . . . . . . . 1-28
Task Summary . . . . . . . . . . . . . . . . . . . . . . . . . . . . . . . . . . . . . . . . . . . . . . . . . . . . . . . . . . . 1-28
Overview Beds. . . . . . . . . . . . . . . . . . . . . . . . . . . . . . . . . . . . . . . . . . . . . . . . . . . . . . . . . . . 1-29
Types of Access . . . . . . . . . . . . . . . . . . . . . . . . . . . . . . . . . . . . . . . . . . . . . . . . . . . . . . . . . . 1-29
Full Control if Multiple Viewers . . . . . . . . . . . . . . . . . . . . . . . . . . . . . . . . . . . . . . . . . . . . . 1-30
Consulting Beds over the Philips CareNet . . . . . . . . . . . . . . . . . . . . . . . . . . . . . . . . . . . . . . . . . 1-30
Contents-1
Consulting Beds . . . . . . . . . . . . . . . . . . . . . . . . . . . . . . . . . . . . . . . . . . . . . . . . . . . . . . . . . . 1-30
Guidelines for Ensuring Correct Data . . . . . . . . . . . . . . . . . . . . . . . . . . . . . . . . . . . . . . . . . 1-31
Optimizing Wireless System Performance . . . . . . . . . . . . . . . . . . . . . . . . . . . . . . . . . . . . . . . . . 1-32
Minimizing Data Loss . . . . . . . . . . . . . . . . . . . . . . . . . . . . . . . . . . . . . . . . . . . . . . . . . . . . . 1-32
Low Signal Strength . . . . . . . . . . . . . . . . . . . . . . . . . . . . . . . . . . . . . . . . . . . . . . . . . . 1-32
Interference . . . . . . . . . . . . . . . . . . . . . . . . . . . . . . . . . . . . . . . . . . . . . . . . . . . . . . . . . 1-32
Wireless System Messages . . . . . . . . . . . . . . . . . . . . . . . . . . . . . . . . . . . . . . . . . . . . . . . . . 1-33
Configuration . . . . . . . . . . . . . . . . . . . . . . . . . . . . . . . . . . . . . . . . . . . . . . . . . . . . . . . . . . . . . . . 1-34
Using the On-line Help/Quick Guide . . . . . . . . . . . . . . . . . . . . . . . . . . . . . . . . . . . . . . . . . . . . . 1-35
2. Patient Management. . . . . . . . . . . . . . . . . . . . . . . . . . . . . . . . . . . . . . . . . . . . . . 2-1
Introduction . . . . . . . . . . . . . . . . . . . . . . . . . . . . . . . . . . . . . . . . . . . . . . . . . . . . . . . . . . . . . . . . . . 2-2
Admitting a Patient . . . . . . . . . . . . . . . . . . . . . . . . . . . . . . . . . . . . . . . . . . . . . . . . . . . . . . . . . . . . 2-3
Overview . . . . . . . . . . . . . . . . . . . . . . . . . . . . . . . . . . . . . . . . . . . . . . . . . . . . . . . . . . . . . . . . 2-3
With M3 or IntelliVue Patient Monitors . . . . . . . . . . . . . . . . . . . . . . . . . . . . . . . . . . . . 2-3
With Other Bedsides . . . . . . . . . . . . . . . . . . . . . . . . . . . . . . . . . . . . . . . . . . . . . . . . . . . 2-3
Task Summary . . . . . . . . . . . . . . . . . . . . . . . . . . . . . . . . . . . . . . . . . . . . . . . . . . . . . . . . . . . . 2-4
Changing Patient Information . . . . . . . . . . . . . . . . . . . . . . . . . . . . . . . . . . . . . . . . . . . . . . . . . . . . 2-8
Overview . . . . . . . . . . . . . . . . . . . . . . . . . . . . . . . . . . . . . . . . . . . . . . . . . . . . . . . . . . . . . . . . 2-8
With M3 or IntelliVue Patient Monitors . . . . . . . . . . . . . . . . . . . . . . . . . . . . . . . . . . . . 2-8
Task Summary . . . . . . . . . . . . . . . . . . . . . . . . . . . . . . . . . . . . . . . . . . . . . . . . . . . . . . . . . . . . 2-8
Resolving Conflicts with M3 or IntelliVue Patient Monitors . . . . . . . . . . . . . . . . . . . . . . . . . . . . 2-9
Overview . . . . . . . . . . . . . . . . . . . . . . . . . . . . . . . . . . . . . . . . . . . . . . . . . . . . . . . . . . . . . . . . 2-9
Task Summary . . . . . . . . . . . . . . . . . . . . . . . . . . . . . . . . . . . . . . . . . . . . . . . . . . . . . . . . . . . 2-10
Care Groups. . . . . . . . . . . . . . . . . . . . . . . . . . . . . . . . . . . . . . . . . . . . . . . . . . . . . . . . . . . . . . . . . 2-12
Overview . . . . . . . . . . . . . . . . . . . . . . . . . . . . . . . . . . . . . . . . . . . . . . . . . . . . . . . . . . . . . . . 2-12
Setting up a Care Group. . . . . . . . . . . . . . . . . . . . . . . . . . . . . . . . . . . . . . . . . . . . . . . . . . . . 2-12
Assigning a Bed to a Care Group. . . . . . . . . . . . . . . . . . . . . . . . . . . . . . . . . . . . . . . . . . . . . 2-15
Viewing Care Groups. . . . . . . . . . . . . . . . . . . . . . . . . . . . . . . . . . . . . . . . . . . . . . . . . . . . . . 2-16
Discharging a Patient . . . . . . . . . . . . . . . . . . . . . . . . . . . . . . . . . . . . . . . . . . . . . . . . . . . . . . . . . 2-18
Overview . . . . . . . . . . . . . . . . . . . . . . . . . . . . . . . . . . . . . . . . . . . . . . . . . . . . . . . . . . . . . . . 2-18
With M3 and IntelliVue Patient Monitors. . . . . . . . . . . . . . . . . . . . . . . . . . . . . . . . . . 2-18
With Other Bedsides . . . . . . . . . . . . . . . . . . . . . . . . . . . . . . . . . . . . . . . . . . . . . . . . . . 2-19
Task Summary . . . . . . . . . . . . . . . . . . . . . . . . . . . . . . . . . . . . . . . . . . . . . . . . . . . . . . . . . . . 2-19
Discharging for Transport . . . . . . . . . . . . . . . . . . . . . . . . . . . . . . . . . . . . . . . . . . . . . . . . . . . . . . 2-21
Overview . . . . . . . . . . . . . . . . . . . . . . . . . . . . . . . . . . . . . . . . . . . . . . . . . . . . . . . . . . . . . . . 2-21
Task Summary . . . . . . . . . . . . . . . . . . . . . . . . . . . . . . . . . . . . . . . . . . . . . . . . . . . . . . . . . . . 2-21
Transferring Patient Data to a New Bed . . . . . . . . . . . . . . . . . . . . . . . . . . . . . . . . . . . . . . . . . . . 2-23
Overview . . . . . . . . . . . . . . . . . . . . . . . . . . . . . . . . . . . . . . . . . . . . . . . . . . . . . . . . . . . . . . . 2-23
Task Summary . . . . . . . . . . . . . . . . . . . . . . . . . . . . . . . . . . . . . . . . . . . . . . . . . . . . . . . . . . . 2-23
Contents-2
Fixed and Flexible Monitoring . . . . . . . . . . . . . . . . . . . . . . . . . . . . . . . . . . . . . . . . . . . . . . . . . .2-26
Fixed Monitoring . . . . . . . . . . . . . . . . . . . . . . . . . . . . . . . . . . . . . . . . . . . . . . . . . . . . . . . . .2-26
Flexible Monitoring . . . . . . . . . . . . . . . . . . . . . . . . . . . . . . . . . . . . . . . . . . . . . . . . . . . . . . .2-26
Assigning a Bed and/or Equipment to a Sector . . . . . . . . . . . . . . . . . . . . . . . . . . . . . . . . . . . . . .2-27
Overview. . . . . . . . . . . . . . . . . . . . . . . . . . . . . . . . . . . . . . . . . . . . . . . . . . . . . . . . . . . . . . . .2-27
Task Summary . . . . . . . . . . . . . . . . . . . . . . . . . . . . . . . . . . . . . . . . . . . . . . . . . . . . . . . . . . .2-28
Changing Equipment for a Sector . . . . . . . . . . . . . . . . . . . . . . . . . . . . . . . . . . . . . . . . . . . . . . . .2-29
Overview. . . . . . . . . . . . . . . . . . . . . . . . . . . . . . . . . . . . . . . . . . . . . . . . . . . . . . . . . . . . . . . .2-29
Patient Settings . . . . . . . . . . . . . . . . . . . . . . . . . . . . . . . . . . . . . . . . . . . . . . . . . . . . . . 2-29
Task Summary . . . . . . . . . . . . . . . . . . . . . . . . . . . . . . . . . . . . . . . . . . . . . . . . . . . . . . . . . . .2-31
Assigning an Overview Bed to a Sector . . . . . . . . . . . . . . . . . . . . . . . . . . . . . . . . . . . . . . . . . . .2-32
Overview. . . . . . . . . . . . . . . . . . . . . . . . . . . . . . . . . . . . . . . . . . . . . . . . . . . . . . . . . . . . . . . .2-32
Fixed monitoring. . . . . . . . . . . . . . . . . . . . . . . . . . . . . . . . . . . . . . . . . . . . . . . . . . . . . . . . . .2-32
Flexible Monitoring . . . . . . . . . . . . . . . . . . . . . . . . . . . . . . . . . . . . . . . . . . . . . . . . . . . . . . .2-32
Overview Bed Controls . . . . . . . . . . . . . . . . . . . . . . . . . . . . . . . . . . . . . . . . . . . . . . . . . . . .2-32
Task Summary . . . . . . . . . . . . . . . . . . . . . . . . . . . . . . . . . . . . . . . . . . . . . . . . . . . . . . . . . . .2-33
Clearing (Unassigning) a Sector . . . . . . . . . . . . . . . . . . . . . . . . . . . . . . . . . . . . . . . . . . . . . . . . .2-34
Fixed Monitoring . . . . . . . . . . . . . . . . . . . . . . . . . . . . . . . . . . . . . . . . . . . . . . . . . . . . . . . . .2-34
Flexible Monitoring . . . . . . . . . . . . . . . . . . . . . . . . . . . . . . . . . . . . . . . . . . . . . . . . . . . . . . .2-34
Task Summary . . . . . . . . . . . . . . . . . . . . . . . . . . . . . . . . . . . . . . . . . . . . . . . . . . . . . . . . . . .2-34
3. Recordings and Reports . . . . . . . . . . . . . . . . . . . . . . . . . . . . . . . . . . . . . . . . . . . 3-1
Introduction . . . . . . . . . . . . . . . . . . . . . . . . . . . . . . . . . . . . . . . . . . . . . . . . . . . . . . . . . . . . . . . . . .3-2
Types of Recordings . . . . . . . . . . . . . . . . . . . . . . . . . . . . . . . . . . . . . . . . . . . . . . . . . . . . . . . .3-3
Alarm Recordings . . . . . . . . . . . . . . . . . . . . . . . . . . . . . . . . . . . . . . . . . . . . . . . . . . . . . . . . . .3-4
Making a Delayed Recording . . . . . . . . . . . . . . . . . . . . . . . . . . . . . . . . . . . . . . . . . . . . . . . . . . . .3-5
Overview. . . . . . . . . . . . . . . . . . . . . . . . . . . . . . . . . . . . . . . . . . . . . . . . . . . . . . . . . . . . . . . . .3-5
Task Summary . . . . . . . . . . . . . . . . . . . . . . . . . . . . . . . . . . . . . . . . . . . . . . . . . . . . . . . . . . . .3-6
Action of Patient Sector Button . . . . . . . . . . . . . . . . . . . . . . . . . . . . . . . . . . . . . . . . . . . . . . .3-7
Making an Alarm/Delayed Recording Continuous . . . . . . . . . . . . . . . . . . . . . . . . . . . . . . . .3-7
Extending a Delayed Recording at the M3 Monitor. . . . . . . . . . . . . . . . . . . . . . . . . . . . . . . .3-7
Making a Delayed Recording for All Beds . . . . . . . . . . . . . . . . . . . . . . . . . . . . . . . . . . . . . .3-8
Saving a Strip from the Patient Sector . . . . . . . . . . . . . . . . . . . . . . . . . . . . . . . . . . . . . . . . . . . . . .3-8
Overview. . . . . . . . . . . . . . . . . . . . . . . . . . . . . . . . . . . . . . . . . . . . . . . . . . . . . . . . . . . . . . . . .3-8
Task Summary . . . . . . . . . . . . . . . . . . . . . . . . . . . . . . . . . . . . . . . . . . . . . . . . . . . . . . . . . . . .3-8
Selecting the Waves that are Saved . . . . . . . . . . . . . . . . . . . . . . . . . . . . . . . . . . . . . . . . 3-8
Making Real-Time Recordings . . . . . . . . . . . . . . . . . . . . . . . . . . . . . . . . . . . . . . . . . . . . . . . . . . .3-9
Overview. . . . . . . . . . . . . . . . . . . . . . . . . . . . . . . . . . . . . . . . . . . . . . . . . . . . . . . . . . . . . . . . .3-9
Task Summary . . . . . . . . . . . . . . . . . . . . . . . . . . . . . . . . . . . . . . . . . . . . . . . . . . . . . . . . . . . .3-9
Controls and Indicators on the Philips 2-Channel Recorder Module . . . . . . . . . . . . . . . . . . . . .3-11
Contents-3
Controls and Indicators on the M3160A 4-Channel Recorder . . . . . . . . . . . . . . . . . . . . . . . . . . 3-12
Recording Priority . . . . . . . . . . . . . . . . . . . . . . . . . . . . . . . . . . . . . . . . . . . . . . . . . . . . . . . . . . . . 3-13
Recording Status Messages . . . . . . . . . . . . . . . . . . . . . . . . . . . . . . . . . . . . . . . . . . . . . . . . . . . . . 3-14
Main Screen Messages. . . . . . . . . . . . . . . . . . . . . . . . . . . . . . . . . . . . . . . . . . . . . . . . . . . . . 3-14
Recorder Messages at the M3 Monitor . . . . . . . . . . . . . . . . . . . . . . . . . . . . . . . . . . . . . . . . 3-15
Annotation . . . . . . . . . . . . . . . . . . . . . . . . . . . . . . . . . . . . . . . . . . . . . . . . . . . . . . . . . . . . . . . . . . 3-16
Re-Annotation . . . . . . . . . . . . . . . . . . . . . . . . . . . . . . . . . . . . . . . . . . . . . . . . . . . . . . . . . . . 3-16
Loading Paper into the 2-Channel Recorder . . . . . . . . . . . . . . . . . . . . . . . . . . . . . . . . . . . . . . . . 3-17
Task Summary . . . . . . . . . . . . . . . . . . . . . . . . . . . . . . . . . . . . . . . . . . . . . . . . . . . . . . . . . . . 3-17
Testing . . . . . . . . . . . . . . . . . . . . . . . . . . . . . . . . . . . . . . . . . . . . . . . . . . . . . . . . . . . . . . . . . 3-19
Task Summary . . . . . . . . . . . . . . . . . . . . . . . . . . . . . . . . . . . . . . . . . . . . . . . . . . . . . . . . . . . 3-19
Loading Paper into the 4-Channel Recorder . . . . . . . . . . . . . . . . . . . . . . . . . . . . . . . . . . . . . . . . 3-20
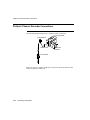
Philips 2-Channel Recorder Connections . . . . . . . . . . . . . . . . . . . . . . . . . . . . . . . . . . . . . . . . . . 3-22
M3160A 4-Channel Recorder Connections . . . . . . . . . . . . . . . . . . . . . . . . . . . . . . . . . . . . . . . . 3-23
Ordering Information for Supplies for Recorders . . . . . . . . . . . . . . . . . . . . . . . . . . . . . . . . . . . . 3-23
Paper. . . . . . . . . . . . . . . . . . . . . . . . . . . . . . . . . . . . . . . . . . . . . . . . . . . . . . . . . . . . . . . . . . . 3-23
Cleaning Kit . . . . . . . . . . . . . . . . . . . . . . . . . . . . . . . . . . . . . . . . . . . . . . . . . . . . . . . . . . . . . 3-23
Printing Reports. . . . . . . . . . . . . . . . . . . . . . . . . . . . . . . . . . . . . . . . . . . . . . . . . . . . . . . . . . . . . . 3-24
Printer Status Message . . . . . . . . . . . . . . . . . . . . . . . . . . . . . . . . . . . . . . . . . . . . . . . . . . . . . 3-24
Printer Messages at the M3 Monitor . . . . . . . . . . . . . . . . . . . . . . . . . . . . . . . . . . . . . . . . . . 3-24
Cleaning the Philips 2-Channel Recorder Printhead. . . . . . . . . . . . . . . . . . . . . . . . . . . . . . . . . . 3-25
4. Alarm Management and Setup . . . . . . . . . . . . . . . . . . . . . . . . . . . . . . . . . . . . . 4-1
Overview . . . . . . . . . . . . . . . . . . . . . . . . . . . . . . . . . . . . . . . . . . . . . . . . . . . . . . . . . . . . . . . . . . . . 4-2
M3 Monitors . . . . . . . . . . . . . . . . . . . . . . . . . . . . . . . . . . . . . . . . . . . . . . . . . . . . . . . . . . . . . 4-2
IntelliVue Patient Monitors . . . . . . . . . . . . . . . . . . . . . . . . . . . . . . . . . . . . . . . . . . . . . . . . . . 4-3
Alarm Indicators . . . . . . . . . . . . . . . . . . . . . . . . . . . . . . . . . . . . . . . . . . . . . . . . . . . . . . . . . . . . . . 4-3
Alarm Levels and Priorities. . . . . . . . . . . . . . . . . . . . . . . . . . . . . . . . . . . . . . . . . . . . . . . . . . . . . . 4-4
Active Alarm Sound . . . . . . . . . . . . . . . . . . . . . . . . . . . . . . . . . . . . . . . . . . . . . . . . . . . . . . . . . . . 4-6
Alarm Messages . . . . . . . . . . . . . . . . . . . . . . . . . . . . . . . . . . . . . . . . . . . . . . . . . . . . . . . . . . . . . . 4-7
Arrhythmia Alarm Messages . . . . . . . . . . . . . . . . . . . . . . . . . . . . . . . . . . . . . . . . . . . . . . . . . 4-8
Arrhythmia INOP Messages . . . . . . . . . . . . . . . . . . . . . . . . . . . . . . . . . . . . . . . . . . . . . . . . 4-11
Alarm Adjustments . . . . . . . . . . . . . . . . . . . . . . . . . . . . . . . . . . . . . . . . . . . . . . . . . . . . . . . . . . . 4-13
Overview . . . . . . . . . . . . . . . . . . . . . . . . . . . . . . . . . . . . . . . . . . . . . . . . . . . . . . . . . . . . . . . 4-13
Adjusting Alarms . . . . . . . . . . . . . . . . . . . . . . . . . . . . . . . . . . . . . . . . . . . . . . . . . . . . . . . . . 4-13
Turning Alarms On/Off . . . . . . . . . . . . . . . . . . . . . . . . . . . . . . . . . . . . . . . . . . . . . . . . . . . . 4-15
Task Summary . . . . . . . . . . . . . . . . . . . . . . . . . . . . . . . . . . . . . . . . . . . . . . . . . . . . . . 4-16
Arrhythmia Analysis Off . . . . . . . . . . . . . . . . . . . . . . . . . . . . . . . . . . . . . . . . . . . . . . . . . . . 4-21
Alarm Adjustment Effects . . . . . . . . . . . . . . . . . . . . . . . . . . . . . . . . . . . . . . . . . . . . . . . . . . 4-22
Timeout Periods . . . . . . . . . . . . . . . . . . . . . . . . . . . . . . . . . . . . . . . . . . . . . . . . . . . . . . . . . . . . . 4-23
Contents-4
Overview. . . . . . . . . . . . . . . . . . . . . . . . . . . . . . . . . . . . . . . . . . . . . . . . . . . . . . . . . . . . . . . .4-23
Clearing the Timeout Period. . . . . . . . . . . . . . . . . . . . . . . . . . . . . . . . . . . . . . . . . . . . . . . . .4-24
Alarm Chaining . . . . . . . . . . . . . . . . . . . . . . . . . . . . . . . . . . . . . . . . . . . . . . . . . . . . . . . . . . . . . .4-24
Overview. . . . . . . . . . . . . . . . . . . . . . . . . . . . . . . . . . . . . . . . . . . . . . . . . . . . . . . . . . . . . . . .4-24
Alarm Groupings . . . . . . . . . . . . . . . . . . . . . . . . . . . . . . . . . . . . . . . . . . . . . . . . . . . . . . . . .4-24
Alarm Announcing . . . . . . . . . . . . . . . . . . . . . . . . . . . . . . . . . . . . . . . . . . . . . . . . . . . . . . . .4-25
Alarm Behavior and Timeout periods . . . . . . . . . . . . . . . . . . . . . . . . . . . . . . . . . . . . . . . . .4-25
Alarm Priority Chains . . . . . . . . . . . . . . . . . . . . . . . . . . . . . . . . . . . . . . . . . . . . . . . . . . . . . .4-26
Silencing Alarms . . . . . . . . . . . . . . . . . . . . . . . . . . . . . . . . . . . . . . . . . . . . . . . . . . . . . . . . . . . . .4-28
Overview. . . . . . . . . . . . . . . . . . . . . . . . . . . . . . . . . . . . . . . . . . . . . . . . . . . . . . . . . . . . . . . .4-28
Alarm Behavior . . . . . . . . . . . . . . . . . . . . . . . . . . . . . . . . . . . . . . . . . . . . . . . . . . . . . . 4-28
Alarm Reminders. . . . . . . . . . . . . . . . . . . . . . . . . . . . . . . . . . . . . . . . . . . . . . . . . . . . . 4-30
Task Summary . . . . . . . . . . . . . . . . . . . . . . . . . . . . . . . . . . . . . . . . . . . . . . . . . . . . . . . . . . .4-31
Fast Alarm Review Disabled . . . . . . . . . . . . . . . . . . . . . . . . . . . . . . . . . . . . . . . . . . . . 4-31
Fast Alarm Review Enabled . . . . . . . . . . . . . . . . . . . . . . . . . . . . . . . . . . . . . . . . . . . . 4-31
Suspending/Unsuspending Alarms . . . . . . . . . . . . . . . . . . . . . . . . . . . . . . . . . . . . . . . . . . . . . . .4-32
Telemetry . . . . . . . . . . . . . . . . . . . . . . . . . . . . . . . . . . . . . . . . . . . . . . . . . . . . . . . . . . . . . . .4-32
Bedside Monitors . . . . . . . . . . . . . . . . . . . . . . . . . . . . . . . . . . . . . . . . . . . . . . . . . . . . . . . . .4-32
TeleMon . . . . . . . . . . . . . . . . . . . . . . . . . . . . . . . . . . . . . . . . . . . . . . . . . . . . . . . . . . . . . . . .4-32
Telemetry Smart Limits . . . . . . . . . . . . . . . . . . . . . . . . . . . . . . . . . . . . . . . . . . . . . . . . . . . . . . . .4-33
Overview. . . . . . . . . . . . . . . . . . . . . . . . . . . . . . . . . . . . . . . . . . . . . . . . . . . . . . . . . . . . . . . .4-33
Automatically Set Smart Limits . . . . . . . . . . . . . . . . . . . . . . . . . . . . . . . . . . . . . . . . . 4-33
Manually Set . . . . . . . . . . . . . . . . . . . . . . . . . . . . . . . . . . . . . . . . . . . . . . . . . . . . . . . . 4-34
Smart Limits Examples . . . . . . . . . . . . . . . . . . . . . . . . . . . . . . . . . . . . . . . . . . . . . . . . 4-34
Adjusting the Alarm Tone Volume . . . . . . . . . . . . . . . . . . . . . . . . . . . . . . . . . . . . . . . . . . . . . . .4-35
Recording/Storing Alarms . . . . . . . . . . . . . . . . . . . . . . . . . . . . . . . . . . . . . . . . . . . . . . . . . . . . . .4-36
Overview. . . . . . . . . . . . . . . . . . . . . . . . . . . . . . . . . . . . . . . . . . . . . . . . . . . . . . . . . . . . . . . .4-36
Task Summary . . . . . . . . . . . . . . . . . . . . . . . . . . . . . . . . . . . . . . . . . . . . . . . . . . . . . . . . . . .4-36
Storage of Arrhythmia Alarms at the Central . . . . . . . . . . . . . . . . . . . . . . . . . . . . . . . . . . . .4-37
5. ST/AR Arrhythmia Monitoring . . . . . . . . . . . . . . . . . . . . . . . . . . . . . . . . . . . . 5-1
Introduction . . . . . . . . . . . . . . . . . . . . . . . . . . . . . . . . . . . . . . . . . . . . . . . . . . . . . . . . . . . . . . . . . .5-2
Overview. . . . . . . . . . . . . . . . . . . . . . . . . . . . . . . . . . . . . . . . . . . . . . . . . . . . . . . . . . . . . . . . .5-2
Levels of Arrhythmia Analysis . . . . . . . . . . . . . . . . . . . . . . . . . . . . . . . . . . . . . . . . . . . . . . . . . . .5-3
Basic Arrhythmia . . . . . . . . . . . . . . . . . . . . . . . . . . . . . . . . . . . . . . . . . . . . . . . . . . . . . . . . . .5-3
Enhanced Arrhythmia . . . . . . . . . . . . . . . . . . . . . . . . . . . . . . . . . . . . . . . . . . . . . . . . . . . . . . .5-4
How the ST/AR Algorithm Works . . . . . . . . . . . . . . . . . . . . . . . . . . . . . . . . . . . . . . . . . . . . . . . .5-5
Overview. . . . . . . . . . . . . . . . . . . . . . . . . . . . . . . . . . . . . . . . . . . . . . . . . . . . . . . . . . . . . . . . .5-5
Ensuring Accurate Arrhythmia Monitoring . . . . . . . . . . . . . . . . . . . . . . . . . . . . . . . . . . . . . .5-6
Example of Optimized Non-Paced ECG . . . . . . . . . . . . . . . . . . . . . . . . . . . . . . . . . . . 5-11
Contents-5
Example of Optimized Paced ECG . . . . . . . . . . . . . . . . . . . . . . . . . . . . . . . . . . . . . . 5-12
Aberrantly conducted beats . . . . . . . . . . . . . . . . . . . . . . . . . . . . . . . . . . . . . . . . . . . . 5-12
Atrial Fibrillation and Flutter . . . . . . . . . . . . . . . . . . . . . . . . . . . . . . . . . . . . . . . . . . . 5-13
Intermittent Bundle Branch Block . . . . . . . . . . . . . . . . . . . . . . . . . . . . . . . . . . . . . . . 5-13
Paced Patients . . . . . . . . . . . . . . . . . . . . . . . . . . . . . . . . . . . . . . . . . . . . . . . . . . . . . . . . . . . . . . . 5-14
Warnings for Paced Patients . . . . . . . . . . . . . . . . . . . . . . . . . . . . . . . . . . . . . . . . . . . . . . . . 5-14
Repolarization Tails . . . . . . . . . . . . . . . . . . . . . . . . . . . . . . . . . . . . . . . . . . . . . . . . . . 5-16
Learning . . . . . . . . . . . . . . . . . . . . . . . . . . . . . . . . . . . . . . . . . . . . . . . . . . . . . . . . . . . . . . . . . . . 5-17
Overview . . . . . . . . . . . . . . . . . . . . . . . . . . . . . . . . . . . . . . . . . . . . . . . . . . . . . . . . . . . . . . . 5-17
Learning . . . . . . . . . . . . . . . . . . . . . . . . . . . . . . . . . . . . . . . . . . . . . . . . . . . . . . . . . . . . . . . . 5-17
Single Lead Analysis . . . . . . . . . . . . . . . . . . . . . . . . . . . . . . . . . . . . . . . . . . . . . . . . . 5-17
Multilead Analysis . . . . . . . . . . . . . . . . . . . . . . . . . . . . . . . . . . . . . . . . . . . . . . . . . . . 5-17
Multilead Analysis With Changes in One Lead . . . . . . . . . . . . . . . . . . . . . . . . . . . . . 5-18
EASI ECG Monitoring . . . . . . . . . . . . . . . . . . . . . . . . . . . . . . . . . . . . . . . . . . . . . . . . 5-18
Monitoring During Leads Off . . . . . . . . . . . . . . . . . . . . . . . . . . . . . . . . . . . . . . . . . . . . . . . . . . . 5-19
Fallback . . . . . . . . . . . . . . . . . . . . . . . . . . . . . . . . . . . . . . . . . . . . . . . . . . . . . . . . . . . . . . . . 5-19
Multilead Analysis . . . . . . . . . . . . . . . . . . . . . . . . . . . . . . . . . . . . . . . . . . . . . . . . . . . 5-19
Singlelead Analysis. . . . . . . . . . . . . . . . . . . . . . . . . . . . . . . . . . . . . . . . . . . . . . . . . . . 5-19
EASI ECG Monitoring. . . . . . . . . . . . . . . . . . . . . . . . . . . . . . . . . . . . . . . . . . . . . . . . . . . . . 5-19
Extended Monitoring (Telemetry) . . . . . . . . . . . . . . . . . . . . . . . . . . . . . . . . . . . . . . . . . . . 5-19
Status Messages. . . . . . . . . . . . . . . . . . . . . . . . . . . . . . . . . . . . . . . . . . . . . . . . . . . . . . . . . . . . . . 5-20
Rhythm Status Messages . . . . . . . . . . . . . . . . . . . . . . . . . . . . . . . . . . . . . . . . . . . . . . . . . . . 5-20
Ectopic Status Messages . . . . . . . . . . . . . . . . . . . . . . . . . . . . . . . . . . . . . . . . . . . . . . . . . . . 5-22
False Alarms . . . . . . . . . . . . . . . . . . . . . . . . . . . . . . . . . . . . . . . . . . . . . . . . . . . . . . . . . . . . . . . . 5-24
6. Patient Data Review . . . . . . . . . . . . . . . . . . . . . . . . . . . . . . . . . . . . . . . . . . . . . . 6-1
The Information Center Review Windows . . . . . . . . . . . . . . . . . . . . . . . . . . . . . . . . . . . . . . . . . . 6-2
Overview . . . . . . . . . . . . . . . . . . . . . . . . . . . . . . . . . . . . . . . . . . . . . . . . . . . . . . . . . . . . . . . . 6-2
Review Window Features . . . . . . . . . . . . . . . . . . . . . . . . . . . . . . . . . . . . . . . . . . . . . . . . . . . 6-4
Using Strips in Review Windows . . . . . . . . . . . . . . . . . . . . . . . . . . . . . . . . . . . . . . . . . . . . . 6-6
Alarm Review . . . . . . . . . . . . . . . . . . . . . . . . . . . . . . . . . . . . . . . . . . . . . . . . . . . . . . . . . . . . . . . . 6-9
Overview . . . . . . . . . . . . . . . . . . . . . . . . . . . . . . . . . . . . . . . . . . . . . . . . . . . . . . . . . . . . . . . . 6-9
Using Alarm Review . . . . . . . . . . . . . . . . . . . . . . . . . . . . . . . . . . . . . . . . . . . . . . . . . . . . . . 6-10
Fast Alarm Review. . . . . . . . . . . . . . . . . . . . . . . . . . . . . . . . . . . . . . . . . . . . . . . . . . . . . . . . 6-17
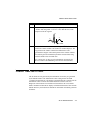
Trend Review . . . . . . . . . . . . . . . . . . . . . . . . . . . . . . . . . . . . . . . . . . . . . . . . . . . . . . . . . . . . . . . 6-19
Overview . . . . . . . . . . . . . . . . . . . . . . . . . . . . . . . . . . . . . . . . . . . . . . . . . . . . . . . . . . . . . . . 6-19
Trend Review with Graphic Display . . . . . . . . . . . . . . . . . . . . . . . . . . . . . . . . . . . . . . . . . . 6-19
Trend Review with Tabular Display . . . . . . . . . . . . . . . . . . . . . . . . . . . . . . . . . . . . . . . . . . 6-22
Event Review . . . . . . . . . . . . . . . . . . . . . . . . . . . . . . . . . . . . . . . . . . . . . . . . . . . . . . . . . . . . . . . 6-24
Overview . . . . . . . . . . . . . . . . . . . . . . . . . . . . . . . . . . . . . . . . . . . . . . . . . . . . . . . . . . . . . . . 6-24
Contents-6
Cursor/Event Information . . . . . . . . . . . . . . . . . . . . . . . . . . . . . . . . . . . . . . . . . . . . . . 6-24
Event Bars. . . . . . . . . . . . . . . . . . . . . . . . . . . . . . . . . . . . . . . . . . . . . . . . . . . . . . . . . . 6-25
Using Event Review . . . . . . . . . . . . . . . . . . . . . . . . . . . . . . . . . . . . . . . . . . . . . . . . . . . . . . .6-26
Reports . . . . . . . . . . . . . . . . . . . . . . . . . . . . . . . . . . . . . . . . . . . . . . . . . . . . . . . . . . . . . . . . .6-28
Strip Reports . . . . . . . . . . . . . . . . . . . . . . . . . . . . . . . . . . . . . . . . . . . . . . . . . . . . . . . . 6-28
Event Summary Report . . . . . . . . . . . . . . . . . . . . . . . . . . . . . . . . . . . . . . . . . . . . . . . . 6-29
Wave Review . . . . . . . . . . . . . . . . . . . . . . . . . . . . . . . . . . . . . . . . . . . . . . . . . . . . . . . . . . . . . . . .6-31
Overview. . . . . . . . . . . . . . . . . . . . . . . . . . . . . . . . . . . . . . . . . . . . . . . . . . . . . . . . . . . . . . . .6-31
Navigation Choices . . . . . . . . . . . . . . . . . . . . . . . . . . . . . . . . . . . . . . . . . . . . . . . . . . . 6-31
No Data/Invalid Data . . . . . . . . . . . . . . . . . . . . . . . . . . . . . . . . . . . . . . . . . . . . . . . . . . . . . .6-32
Using Wave Review . . . . . . . . . . . . . . . . . . . . . . . . . . . . . . . . . . . . . . . . . . . . . . . . . . . . . . .6-33
Reports . . . . . . . . . . . . . . . . . . . . . . . . . . . . . . . . . . . . . . . . . . . . . . . . . . . . . . . . . . . . . . . . .6-36
Strip Reports . . . . . . . . . . . . . . . . . . . . . . . . . . . . . . . . . . . . . . . . . . . . . . . . . . . . . . . . 6-36
Duration Reports . . . . . . . . . . . . . . . . . . . . . . . . . . . . . . . . . . . . . . . . . . . . . . . . . . . . . 6-37
ST Review . . . . . . . . . . . . . . . . . . . . . . . . . . . . . . . . . . . . . . . . . . . . . . . . . . . . . . . . . . . . . . . . . .6-38
Overview. . . . . . . . . . . . . . . . . . . . . . . . . . . . . . . . . . . . . . . . . . . . . . . . . . . . . . . . . . . . . . . .6-38
Navigation Choices . . . . . . . . . . . . . . . . . . . . . . . . . . . . . . . . . . . . . . . . . . . . . . . . . . . 6-38
Using the ST Cursor Buttons . . . . . . . . . . . . . . . . . . . . . . . . . . . . . . . . . . . . . . . . . . . . . . . .6-40
Using ST Review . . . . . . . . . . . . . . . . . . . . . . . . . . . . . . . . . . . . . . . . . . . . . . . . . . . . . . . . .6-40
12-Lead Review . . . . . . . . . . . . . . . . . . . . . . . . . . . . . . . . . . . . . . . . . . . . . . . . . . . . . . . . . . . . . .6-42
Overview. . . . . . . . . . . . . . . . . . . . . . . . . . . . . . . . . . . . . . . . . . . . . . . . . . . . . . . . . . . . . . . .6-42
12-Lead Review with 12 Lead Captures. . . . . . . . . . . . . . . . . . . . . . . . . . . . . . . . . . . . . . . .6-42
Using this Window . . . . . . . . . . . . . . . . . . . . . . . . . . . . . . . . . . . . . . . . . . . . . . . . . . . 6-42
EASI Derived 12-Lead Review . . . . . . . . . . . . . . . . . . . . . . . . . . . . . . . . . . . . . . . . . . . . . .6-44
Navigation Choices . . . . . . . . . . . . . . . . . . . . . . . . . . . . . . . . . . . . . . . . . . . . . . . . . . . 6-44
Using This Window . . . . . . . . . . . . . . . . . . . . . . . . . . . . . . . . . . . . . . . . . . . . . . . . . . . 6-45
12-Lead Export Window . . . . . . . . . . . . . . . . . . . . . . . . . . . . . . . . . . . . . . . . . . . . . . . . . . .6-46
Export Data to Holter System . . . . . . . . . . . . . . . . . . . . . . . . . . . . . . . . . . . . . . . . . . . . . . . . . . .6-48
Overview. . . . . . . . . . . . . . . . . . . . . . . . . . . . . . . . . . . . . . . . . . . . . . . . . . . . . . . . . . . . . . . .6-48
Task Summary . . . . . . . . . . . . . . . . . . . . . . . . . . . . . . . . . . . . . . . . . . . . . . . . . . . . . . . . . . .6-48
Changing the Waves that are Stored . . . . . . . . . . . . . . . . . . . . . . . . . . . . . . . . . . . . . . . . . . . . . .6-50
Overview. . . . . . . . . . . . . . . . . . . . . . . . . . . . . . . . . . . . . . . . . . . . . . . . . . . . . . . . . . . . . . . .6-50
Task Summary . . . . . . . . . . . . . . . . . . . . . . . . . . . . . . . . . . . . . . . . . . . . . . . . . . . . . . . . . . .6-50
Scheduled Reports . . . . . . . . . . . . . . . . . . . . . . . . . . . . . . . . . . . . . . . . . . . . . . . . . . . . . . . . . . . .6-52
Overview. . . . . . . . . . . . . . . . . . . . . . . . . . . . . . . . . . . . . . . . . . . . . . . . . . . . . . . . . . . . . . . .6-52
All Reports . . . . . . . . . . . . . . . . . . . . . . . . . . . . . . . . . . . . . . . . . . . . . . . . . . . . . . . . . . . . . .6-52
Trend Report . . . . . . . . . . . . . . . . . . . . . . . . . . . . . . . . . . . . . . . . . . . . . . . . . . . . . . . . . . . . .6-54
Alarm Report . . . . . . . . . . . . . . . . . . . . . . . . . . . . . . . . . . . . . . . . . . . . . . . . . . . . . . . . . . . .6-56
Event Report . . . . . . . . . . . . . . . . . . . . . . . . . . . . . . . . . . . . . . . . . . . . . . . . . . . . . . . . . . . . .6-57
Wave Report . . . . . . . . . . . . . . . . . . . . . . . . . . . . . . . . . . . . . . . . . . . . . . . . . . . . . . . . . . . . .6-58
Contents-7
Summary/Unit Report . . . . . . . . . . . . . . . . . . . . . . . . . . . . . . . . . . . . . . . . . . . . . . . . . . . . . 6-60
Information Center Web Access . . . . . . . . . . . . . . . . . . . . . . . . . . . . . . . . . . . . . . . . . . . . . . . . . 6-62
Overview . . . . . . . . . . . . . . . . . . . . . . . . . . . . . . . . . . . . . . . . . . . . . . . . . . . . . . . . . . . . . . . 6-62
Intended Use . . . . . . . . . . . . . . . . . . . . . . . . . . . . . . . . . . . . . . . . . . . . . . . . . . . . . . . . . . . . 6-63
Accessing the Information Center Web . . . . . . . . . . . . . . . . . . . . . . . . . . . . . . . . . . . . . . . . 6-63
Notes on Use . . . . . . . . . . . . . . . . . . . . . . . . . . . . . . . . . . . . . . . . . . . . . . . . . . . . . . . . 6-65
Multilead ECG . . . . . . . . . . . . . . . . . . . . . . . . . . . . . . . . . . . . . . . . . . . . . . . . . . . . . . . . . . . 6-65
Alarm Review . . . . . . . . . . . . . . . . . . . . . . . . . . . . . . . . . . . . . . . . . . . . . . . . . . . . . . . . . . . 6-65
Trend Review . . . . . . . . . . . . . . . . . . . . . . . . . . . . . . . . . . . . . . . . . . . . . . . . . . . . . . . . . . . . 6-66
Displaying Data in Tabular Format. . . . . . . . . . . . . . . . . . . . . . . . . . . . . . . . . . . . . . . 6-66
Event Review . . . . . . . . . . . . . . . . . . . . . . . . . . . . . . . . . . . . . . . . . . . . . . . . . . . . . . . . . . . . 6-66
Wave Review . . . . . . . . . . . . . . . . . . . . . . . . . . . . . . . . . . . . . . . . . . . . . . . . . . . . . . . . . . . . 6-67
ST Review . . . . . . . . . . . . . . . . . . . . . . . . . . . . . . . . . . . . . . . . . . . . . . . . . . . . . . . . . . . . . . 6-67
12-Lead Review . . . . . . . . . . . . . . . . . . . . . . . . . . . . . . . . . . . . . . . . . . . . . . . . . . . . . . . . . . 6-67
7. ST for Bedside Monitors . . . . . . . . . . . . . . . . . . . . . . . . . . . . . . . . . . . . . . . . . . 7-1
Overview . . . . . . . . . . . . . . . . . . . . . . . . . . . . . . . . . . . . . . . . . . . . . . . . . . . . . . . . . . . . . . . . . . . . 7-2
The Measurement. . . . . . . . . . . . . . . . . . . . . . . . . . . . . . . . . . . . . . . . . . . . . . . . . . . . . . . . . . 7-3
Information Center’s ST/AR ST Algorithm . . . . . . . . . . . . . . . . . . . . . . . . . . . . . . . . . . . . . 7-4
Displayed ST Data . . . . . . . . . . . . . . . . . . . . . . . . . . . . . . . . . . . . . . . . . . . . . . . . . . . . . . . . . 7-4
EASI ST Analysis . . . . . . . . . . . . . . . . . . . . . . . . . . . . . . . . . . . . . . . . . . . . . . . . . . . . . . . . . 7-4
Enabling ST Review for Bedside Monitors . . . . . . . . . . . . . . . . . . . . . . . . . . . . . . . . . . . . . . . . . 7-5
Overview . . . . . . . . . . . . . . . . . . . . . . . . . . . . . . . . . . . . . . . . . . . . . . . . . . . . . . . . . . . . . . . . 7-5
Adjusting Measurement Points . . . . . . . . . . . . . . . . . . . . . . . . . . . . . . . . . . . . . . . . . . . . . . . 7-5
CANNOT ANALYZE ST INOP . . . . . . . . . . . . . . . . . . . . . . . . . . . . . . . . . . . . . . . . . . . . . . . . . 7-7
ST Data Summary . . . . . . . . . . . . . . . . . . . . . . . . . . . . . . . . . . . . . . . . . . . . . . . . . . . . . . . . . . . . . 7-8
8. Alarm Paging. . . . . . . . . . . . . . . . . . . . . . . . . . . . . . . . . . . . . . . . . . . . . . . . . . . . 8-1
Introduction . . . . . . . . . . . . . . . . . . . . . . . . . . . . . . . . . . . . . . . . . . . . . . . . . . . . . . . . . . . . . . . . . . 8-2
Setting Up Caregivers and Receivers . . . . . . . . . . . . . . . . . . . . . . . . . . . . . . . . . . . . . . . . . . . . . . 8-3
Overview . . . . . . . . . . . . . . . . . . . . . . . . . . . . . . . . . . . . . . . . . . . . . . . . . . . . . . . . . . . . . . . . 8-3
Task Summary . . . . . . . . . . . . . . . . . . . . . . . . . . . . . . . . . . . . . . . . . . . . . . . . . . . . . . . . . . . . 8-3
Removing Receivers . . . . . . . . . . . . . . . . . . . . . . . . . . . . . . . . . . . . . . . . . . . . . . . . . . . . . . . . . . . 8-5
Overview . . . . . . . . . . . . . . . . . . . . . . . . . . . . . . . . . . . . . . . . . . . . . . . . . . . . . . . . . . . . . . . . 8-5
Task Summary . . . . . . . . . . . . . . . . . . . . . . . . . . . . . . . . . . . . . . . . . . . . . . . . . . . . . . . . . . . . 8-5
Changing a Caregiver/Receiver Assignment . . . . . . . . . . . . . . . . . . . . . . . . . . . . . . . . . . . . . . . . 8-6
Overview . . . . . . . . . . . . . . . . . . . . . . . . . . . . . . . . . . . . . . . . . . . . . . . . . . . . . . . . . . . . . . . . 8-6
Task Summary . . . . . . . . . . . . . . . . . . . . . . . . . . . . . . . . . . . . . . . . . . . . . . . . . . . . . . . . . . . . 8-6
Assigning Patients to Caregivers. . . . . . . . . . . . . . . . . . . . . . . . . . . . . . . . . . . . . . . . . . . . . . . . . . 8-7
Overview . . . . . . . . . . . . . . . . . . . . . . . . . . . . . . . . . . . . . . . . . . . . . . . . . . . . . . . . . . . . . . . . 8-7
Contents-8
Task Summary . . . . . . . . . . . . . . . . . . . . . . . . . . . . . . . . . . . . . . . . . . . . . . . . . . . . . . . . . . . .8-7
Automatic Alarm Paging . . . . . . . . . . . . . . . . . . . . . . . . . . . . . . . . . . . . . . . . . . . . . . . . . . . . . . . .8-9
Overview. . . . . . . . . . . . . . . . . . . . . . . . . . . . . . . . . . . . . . . . . . . . . . . . . . . . . . . . . . . . . . . . .8-9
Task Summary . . . . . . . . . . . . . . . . . . . . . . . . . . . . . . . . . . . . . . . . . . . . . . . . . . . . . . . . . . . .8-9
INOPs . . . . . . . . . . . . . . . . . . . . . . . . . . . . . . . . . . . . . . . . . . . . . . . . . . . . . . . . . . . . . 8-10
Manual Paging . . . . . . . . . . . . . . . . . . . . . . . . . . . . . . . . . . . . . . . . . . . . . . . . . . . . . . . . . . . . . . .8-11
Sending Text Messages . . . . . . . . . . . . . . . . . . . . . . . . . . . . . . . . . . . . . . . . . . . . . . . . . . . . . . . .8-12
Overview. . . . . . . . . . . . . . . . . . . . . . . . . . . . . . . . . . . . . . . . . . . . . . . . . . . . . . . . . . . . . . . .8-12
Task Summary . . . . . . . . . . . . . . . . . . . . . . . . . . . . . . . . . . . . . . . . . . . . . . . . . . . . . . . . . . .8-12
9. Information Center Configuration . . . . . . . . . . . . . . . . . . . . . . . . . . . . . . . . . . 9-1
Information Center Unit Settings Menus . . . . . . . . . . . . . . . . . . . . . . . . . . . . . . . . . . . . . . . . . . . .9-2
Overview. . . . . . . . . . . . . . . . . . . . . . . . . . . . . . . . . . . . . . . . . . . . . . . . . . . . . . . . . . . . . . . . .9-2
Accessing the Unit Settings Menus . . . . . . . . . . . . . . . . . . . . . . . . . . . . . . . . . . . . . . . . . . . .9-4
Using the Unit Settings Menus . . . . . . . . . . . . . . . . . . . . . . . . . . . . . . . . . . . . . . . . . . . . . . . .9-5
Printing the Unit Settings . . . . . . . . . . . . . . . . . . . . . . . . . . . . . . . . . . . . . . . . . . . . . . . . . . . .9-5
Arrhythmia Alarms Unit Settings . . . . . . . . . . . . . . . . . . . . . . . . . . . . . . . . . . . . . . . . . . . . . . . . .9-6
Record/Store/Page Alarms Unit Settings . . . . . . . . . . . . . . . . . . . . . . . . . . . . . . . . . . . . . . . . . . .9-10
ST Unit Settings (telemetry) . . . . . . . . . . . . . . . . . . . . . . . . . . . . . . . . . . . . . . . . . . . . . . . . . . . .9-13
Trend Groups Unit Settings . . . . . . . . . . . . . . . . . . . . . . . . . . . . . . . . . . . . . . . . . . . . . . . . . . . . .9-15
Event Groups Unit Settings . . . . . . . . . . . . . . . . . . . . . . . . . . . . . . . . . . . . . . . . . . . . . . . . . . . . .9-22
Stored Waves Unit Settings . . . . . . . . . . . . . . . . . . . . . . . . . . . . . . . . . . . . . . . . . . . . . . . . . . . . .9-27
Scheduled Reports Unit Settings . . . . . . . . . . . . . . . . . . . . . . . . . . . . . . . . . . . . . . . . . . . . . . . . .9-29
Overview. . . . . . . . . . . . . . . . . . . . . . . . . . . . . . . . . . . . . . . . . . . . . . . . . . . . . . . . . . . . . . . .9-29
Printing Behaviors . . . . . . . . . . . . . . . . . . . . . . . . . . . . . . . . . . . . . . . . . . . . . . . . . . . . . . . .9-29
All Reports . . . . . . . . . . . . . . . . . . . . . . . . . . . . . . . . . . . . . . . . . . . . . . . . . . . . . . . . . . . . . .9-31
Trend Report Unit Settings . . . . . . . . . . . . . . . . . . . . . . . . . . . . . . . . . . . . . . . . . . . . . . . . . .9-33
Alarm Report Unit Settings . . . . . . . . . . . . . . . . . . . . . . . . . . . . . . . . . . . . . . . . . . . . . . . . .9-35
Event Report Unit Settings . . . . . . . . . . . . . . . . . . . . . . . . . . . . . . . . . . . . . . . . . . . . . . . . . .9-36
Wave Report Unit Settings . . . . . . . . . . . . . . . . . . . . . . . . . . . . . . . . . . . . . . . . . . . . . . . . . .9-37
Summary Report Unit Settings . . . . . . . . . . . . . . . . . . . . . . . . . . . . . . . . . . . . . . . . . . . . . . .9-38
Recording Unit Settings . . . . . . . . . . . . . . . . . . . . . . . . . . . . . . . . . . . . . . . . . . . . . . . . . . . . . . . .9-39
Volume Control Unit Settings . . . . . . . . . . . . . . . . . . . . . . . . . . . . . . . . . . . . . . . . . . . . . . . . . . .9-40
Telemetry Frequency Unit Settings . . . . . . . . . . . . . . . . . . . . . . . . . . . . . . . . . . . . . . . . . . . . . . .9-41
Introduction. . . . . . . . . . . . . . . . . . . . . . . . . . . . . . . . . . . . . . . . . . . . . . . . . . . . . . . . . . . . . .9-41
Learning a New Transmitter Code . . . . . . . . . . . . . . . . . . . . . . . . . . . . . . . . . . . . . . . . . . . .9-41
Radio Frequency (RF) Trouble Shooting . . . . . . . . . . . . . . . . . . . . . . . . . . . . . . . . . . . . . . .9-42
Enabling the RF INOP. . . . . . . . . . . . . . . . . . . . . . . . . . . . . . . . . . . . . . . . . . . . . . . . . 9-42
Contents-9
10. Information Center
Safety and Specifications . . . . . . . . . . . . . . . . . . . . . . . . . . . . . . . . . . . . . . . . . . . 10-1
Regulatory and Safety Specifications . . . . . . . . . . . . . . . . . . . . . . . . . . . . . . . . . . . . . . . . . . . . . 10-2
Declaration . . . . . . . . . . . . . . . . . . . . . . . . . . . . . . . . . . . . . . . . . . . . . . . . . . . . . . . . . . . . . . 10-2
Authorized EU Representative. . . . . . . . . . . . . . . . . . . . . . . . . . . . . . . . . . . . . . . . . . . . . . . 10-2
Avoiding EMI . . . . . . . . . . . . . . . . . . . . . . . . . . . . . . . . . . . . . . . . . . . . . . . . . . . . . . . . . . . . . . . 10-3
Information Center Software Specifications . . . . . . . . . . . . . . . . . . . . . . . . . . . . . . . . . . . . . . . 10-4
Display . . . . . . . . . . . . . . . . . . . . . . . . . . . . . . . . . . . . . . . . . . . . . . . . . . . . . . . . . . . . . . . . . 10-4
M3150 Information Center . . . . . . . . . . . . . . . . . . . . . . . . . . . . . . . . . . . . . . . . . . . . . . . . . . . . . 10-5
Features . . . . . . . . . . . . . . . . . . . . . . . . . . . . . . . . . . . . . . . . . . . . . . . . . . . . . . . . . . . . . . . . 10-5
Options . . . . . . . . . . . . . . . . . . . . . . . . . . . . . . . . . . . . . . . . . . . . . . . . . . . . . . . . . . . . . . . . . 10-5
M3151 Information Center Client. . . . . . . . . . . . . . . . . . . . . . . . . . . . . . . . . . . . . . . . . . . . . . . . 10-6
Features . . . . . . . . . . . . . . . . . . . . . . . . . . . . . . . . . . . . . . . . . . . . . . . . . . . . . . . . . . . . . . . . 10-6
Options . . . . . . . . . . . . . . . . . . . . . . . . . . . . . . . . . . . . . . . . . . . . . . . . . . . . . . . . . . . . . . . . . 10-6
M3154 Database Server . . . . . . . . . . . . . . . . . . . . . . . . . . . . . . . . . . . . . . . . . . . . . . . . . . . . . . . 10-7
Features . . . . . . . . . . . . . . . . . . . . . . . . . . . . . . . . . . . . . . . . . . . . . . . . . . . . . . . . . . . . . . . . 10-7
Options . . . . . . . . . . . . . . . . . . . . . . . . . . . . . . . . . . . . . . . . . . . . . . . . . . . . . . . . . . . . . . . . . 10-8
M3169 Small Database Server . . . . . . . . . . . . . . . . . . . . . . . . . . . . . . . . . . . . . . . . . . . . . . . . . . 10-8
Features . . . . . . . . . . . . . . . . . . . . . . . . . . . . . . . . . . . . . . . . . . . . . . . . . . . . . . . . . . . . . . . . 10-8
Options . . . . . . . . . . . . . . . . . . . . . . . . . . . . . . . . . . . . . . . . . . . . . . . . . . . . . . . . . . . . . . . . . 10-8
Release E Hardware Performance Requirements . . . . . . . . . . . . . . . . . . . . . . . . . . . . . . . . . . . . 10-9
ECG Performance Disclosure/Specifications . . . . . . . . . . . . . . . . . . . . . . . . . . . . . . . . . . . . . . 10-14
Specifications for the Philips 2-Channel Recorder . . . . . . . . . . . . . . . . . . . . . . . . . . . . . . . . . . 10-17
Declaration . . . . . . . . . . . . . . . . . . . . . . . . . . . . . . . . . . . . . . . . . . . . . . . . . . . . . . . . . . . . . 10-17
Specifications for the M3160A 4-Channel Recorder . . . . . . . . . . . . . . . . . . . . . . . . . . . . . . . . 10-18
Installation Information. . . . . . . . . . . . . . . . . . . . . . . . . . . . . . . . . . . . . . . . . . . . . . . . . . . . . . . 10-19
Environment. . . . . . . . . . . . . . . . . . . . . . . . . . . . . . . . . . . . . . . . . . . . . . . . . . . . . . . . . . . . 10-19
Archetypical Input Power Source Requirements . . . . . . . . . . . . . . . . . . . . . . . . . . . . . . . . 10-19
Grounding Information Center and Recorder . . . . . . . . . . . . . . . . . . . . . . . . . . . . . . . . . . 10-19
Condensation . . . . . . . . . . . . . . . . . . . . . . . . . . . . . . . . . . . . . . . . . . . . . . . . . . . . . . . . . . . 10-20
Explanation of Symbols . . . . . . . . . . . . . . . . . . . . . . . . . . . . . . . . . . . . . . . . . . . . . . . . . . . . . . 10-20
During Power Transitions/Loss. . . . . . . . . . . . . . . . . . . . . . . . . . . . . . . . . . . . . . . . . . . . . . . . . 10-22
If Connection to the M3154/M3169 Database Server is Lost. . . . . . . . . . . . . . . . . . . . . . . . . . 10-23
Local Database Mode. . . . . . . . . . . . . . . . . . . . . . . . . . . . . . . . . . . . . . . . . . . . . . . . . . . . . 10-23
Remote Diagnostics . . . . . . . . . . . . . . . . . . . . . . . . . . . . . . . . . . . . . . . . . . . . . . . . . . . . . . 10-25
Maintenance . . . . . . . . . . . . . . . . . . . . . . . . . . . . . . . . . . . . . . . . . . . . . . . . . . . . . . . . . . . . . . . 10-25
A. Trend Definitions . . . . . . . . . . . . . . . . . . . . . . . . . . . . . . . . . . . . . . . . . . . . . . . A-1
Contents-10
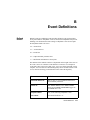
B. Event Definitions . . . . . . . . . . . . . . . . . . . . . . . . . . . . . . . . . . . . . . . . . . . . . . . B-1
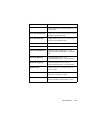
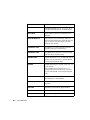
Defined Events . . . . . . . . . . . . . . . . . . . . . . . . . . . . . . . . . . . . . . . . . . . . . . . . . . . . . . . . . . . B-1
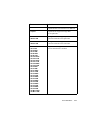
Alarm Defined Events . . . . . . . . . . . . . . . . . . . . . . . . . . . . . . . . . . . . . . . . . . . . . . . . . . . . . B-4
C. ST/AR Configuration Reporting . . . . . . . . . . . . . . . . . . . . . . . . . . . . . . . . . . C-1
First Character Codes . . . . . . . . . . . . . . . . . . . . . . . . . . . . . . . . . . . . . . . . . . . . . . . . . . . . . . C-2
Second Character Codes . . . . . . . . . . . . . . . . . . . . . . . . . . . . . . . . . . . . . . . . . . . . . . . . . . . . C-2
Third and Fourth Character Codes . . . . . . . . . . . . . . . . . . . . . . . . . . . . . . . . . . . . . . . . . . . . C-4
Fifth Character Codes . . . . . . . . . . . . . . . . . . . . . . . . . . . . . . . . . . . . . . . . . . . . . . . . . . . . . . C-7
Sixth Character Codes . . . . . . . . . . . . . . . . . . . . . . . . . . . . . . . . . . . . . . . . . . . . . . . . . . . . . C-9
Seventh Character Code . . . . . . . . . . . . . . . . . . . . . . . . . . . . . . . . . . . . . . . . . . . . . . . . . . . C-12
D. Sales and Support Offices . . . . . . . . . . . . . . . . . . . . . . . . . . . . . . . . . . . . . . . . D-1
Contents-11
Contents-12
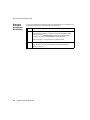
This chapter provides an overview of the IntelliVue Information Center. It
includes the following sections:
•
•
•
•
•
•
•
•
•
•
•
The IntelliVue Information Center . . . . . . . . . . . . . . . . . . . . . . . . . . . . 1-2
Intended Use . . . . . . . . . . . . . . . . . . . . . . . . . . . . . . . . . . . . . . . . . . . . . 1-9
The Information Center Features . . . . . . . . . . . . . . . . . . . . . . . . . . . . 1-10
Information Center Display Screens. . . . . . . . . . . . . . . . . . . . . . . . . . 1-14
Using Standby. . . . . . . . . . . . . . . . . . . . . . . . . . . . . . . . . . . . . . . . . . . 1-24
EASI 12-lead Review and Report. . . . . . . . . . . . . . . . . . . . . . . . . . . . 1-26
Viewing Other Patients over the IntelliVue Clinical Network . . . . . . 1-28
Consulting Beds over the Philips CareNet . . . . . . . . . . . . . . . . . . . . . 1-30
Optimizing Wireless System Performance. . . . . . . . . . . . . . . . . . . . . 1-32
Configuration . . . . . . . . . . . . . . . . . . . . . . . . . . . . . . . . . . . . . . . . . . . 1-34
Using the On-line Help/Quick Guide . . . . . . . . . . . . . . . . . . . . . . . . . 1-35
Introduction to the Information Center
1-1
Introduction
1
Introduction to the Information
Center
The IntelliVue Information Center
The IntelliVue Information Center
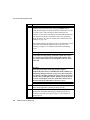
The IntelliVue Information Center is part of the Philips Patient Care System.
The IntelliVue Information Center consists of:
•
•
•
•
•
the Information Center Software, including the ST/AR ST Segment and
Arrhythmia Algorithm Software
the NT Workstation
an uninterruptible power supply (UPS)
the Philips Recorder
accessory printer (optional)
There are two different models to meet your specific patient monitoring needs.
These include the:
•
•
IntelliVue M3150 Information Center
IntelliVue M3151 Information Center Client
Note—In this book the term “Information Center” is used for both models.
Differences in features or functionality are called out where appropriate.
For a description of the features and available options with each of the models
refer to Chapter 10, “Information Center Safety and Specifications.”
Philips
Patient Care
System
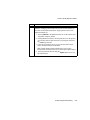
The Information Center displays information via the Philips CareNet network
and/or IntelliVue Clinical Network, received from point-of-care equipment
connected to the network.
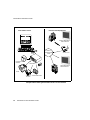
The illustrations on the following pages show an Philips Patient Care System
with an Philips CareNet network and the IntelliVue Clinical Network.
1-2
Introduction to the Information Center
The IntelliVue Information Center
Point-of-Care Equipment
Information Center
Information Center
Philips Telemetry System
Philips
CareNet
Switch
Information
Center Software
NT
Workstation
UPS
Philips Compatible
Bedside Monitors
Printer
2-Channel
Recorder
4-Channel
Recorder
Philips Patient Care System with CareNet
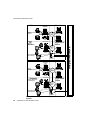
Introduction to the Information Center
1-3
The IntelliVue Information Center
Point-of-Care Equipment
Information Center
Wireless M3/IntelliVue
Patient Monitors
IntelliVue
Clinical Network
Switch
Information Center
Information Center
Software
Access Point
NT
Workstation
UPS
Wired M3/IntelliVue
Patient Monitors
Printer
4-Channel
Recorder
2-Channel Recorder
Philips Patient Care System with IntelliVue Clinical Network
1-4
Introduction to the Information Center
The IntelliVue Information Center
IntelliVue
Clinical
Network
with
Database
Server
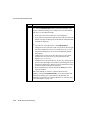
The IntelliVue M3185 Clinical Network with the M3154 Database Server or the
M3169 Database Server, enables transmission of data between centrals,
providing access to both real-time and stored data within and across clinical
units. The patient data storage includes full disclosure waveforms and
physiologic parameters for up to 48 hours per patient, up to 4 waves per patient,
and up to 150 30-second alarm records and saved strips, with up to 4 waves per
event.
The IntelliVue Clinical Network with the M3169 Database server stores data for
up to 48 patients and supports up to 3 M3150 Information Centers for
monitoring patients and up to 3 M3151 Information Center Clients for reviewing
patient data.
The IntelliVue Clinical Network with the M3154 Database Server stores data for
up to 96 patients and supports up to 8 M3150 Information Centers for
monitoring patients and up to 8 M3151 Information Center Clients for reviewing
patient data.
The IntelliVue Clinical Network is based on industry standard components and
cabling.
The following illustration shows an example of a IntelliVue Clinical Network
connecting centrals in separate clinical units.
Introduction to the Information Center
1-5
The IntelliVue Information Center
Work Area
CCU
Information
Center
Philips
Compatible
Bedside Monitors
Information
Center Client
Intellivue
Philips
CareNet
Switch
Information
Center Client
Clinical Network
Switch 1
Philips Telemetry System
ED
Physician’s Office
Wireless
M3/IntelliVue
Patient
Monitors
Information
Center Client
Access Point
Intellivue
Clinical Network
Switch 2
Information
Center
Wired M3/IntelliVue
Patient Monitors
M3154/M3169
Database Server
Philips Patient Care System with IntelliVue Clinical Network and
Database Server
1-6
Introduction to the Information Center
The IntelliVue Information Center
Large
Network
Central
Database
System
The Large Network Central Database System allows up to 10 M3154 Database
Servers to be interconnected on the hospital network. This connectivity provides
clinicians with the ability to transfer patients across care units that are on
separate database servers. In addition, for systems with the M3185 Application
Server, the Large Network Central Database System allows you to view, through
the Information Center Web Access, near-realtime waves, parameters and
alarms, as well as review all retrospective data for up to 960 patients across care
units that are on separate database servers (see “Information Center Web
Access” on page 6-62).
The following illustration shows an example of a Large Network Central
Database System.
Introduction to the Information Center
1-7
The IntelliVue Information Center
CCU
Philips
Compatible Bedside
Monitors
Work Area
Information
Center
Philips
CareNet
Switch
IntelliVue
Clinical
Network
Switch
Information Center
Clients
Philips Telemetry
System
Access Point
Physician’s
Office
IntelliVue
Clinical
Network
Core
Switch
Information
Center
Information
Center Client
Wired M3/IntelliVue
Patient Monitors
M3154
Database
ICU
Philips
Compatible Bedside
Monitors
Work Area
Information
Center
Philips
CareNet
Switch
IntelliVue
Clinical
Network
Switch
Information Center
Clients
Hospital Network
ED
Wireless
M3/IntelliVue
Patient Monitors
Philips Telemetry
System
Stepdown
Access Point
Physician’s
Office
Wireless M3/IntelliVue
Patient Monitors
IntelliVue
Clinical
Network
Core
Switch
Information
Center
Information
Center Client
Wired M3/IntelliVue
Patient Monitors
M3154
Database
Philips Patient Care System with Large Network Central Database
System
1-8
Introduction to the Information Center
Intended Use
Intended Use
The intended use of the Information Center Software is to display physiologic
waves, parameters, and trends, format data for strip chart recordings and printed
reports, and provide the secondary annunciation of alarms from other networked
medical devices at a centralized location. The Information Center Software
provides for the retrospective review of alarms, physiologic waves and
parameters from its database.
An additional intended use of the Information Center Software is to provide
primary annunciation of alarms and configuration and control access for
networked telemetry monitors.
This product is not intended for home use.
Rx only.
Introduction to the Information Center
1-9
The Information Center Features
The Information Center Features
The Information Center Software allows you to:
•
View waves and physiological parameter information sent over the
monitoring network. Up to 24 waves can be displayed on a single main
screen. Up to 32 waves can be displayed on dual displays with two main
screens.
•
Be alerted to patient alarms that have been detected by networked
monitoring devices and respond to the alarms.
•
Perform ST/AR multilead arrhythmia analysis on up to two leads of ECG.
ST/AR ST segment monitoring provides ST elevation and depression
measurements for telemetry-monitored patients.
Note—ST/AR analysis for M3 and IntelliVue Patient Monitors is done at
the monitor. ST analysis for all bedside monitors is done at the monitor.
1-10
•
Make strip chart recordings on a Philips Recorder and (if a printer is
available) printed reports requested from the point-of-care and/or the
Information Center.
•
Access a retrospective review of up to 48 hours of patient data, including
full disclosure waves and parameters, alarms, ST segments, events, trends,
EASI derived reconstructed 12 lead ECG and captured conventional 12
lead ECG.
•
View real-time data for a patient being monitored by another Information
Center connected via Philips CareNet. If connected via the IntelliVue
Clinical Network, you can view both real-time and stored data for a
patient monitored on another central, and that central can be in the same
clinical unit or in another unit.
•
Provide the clinical operator with secondary notification of patient alarms
and wave snippets on a small paging device through the integration of the
Data Critical Statview™ paging system (available in limited geographies)
with the Information Center.
Introduction to the Information Center
The Information Center Features
Recordings
and Reports
•
Provide the management of grouping of beds per nursing assignment
(‘Care Groups’). A single Care Group is typically named for a caregiver
who is responsible for multiple patients within a single care unit. A Care
Group can be assigned a color that will display as the background for the
bed label on the Information Center. Color by Care Group helps the
caregiver to quickly identify beds within their Care Group.
•
Export ECG waveform data from the Information Center to an Zymed
Holter for Windows™ - Model 2010 for analysis.
Recordings can be requested from the Information Center or from networked
products.
If a printer is connected, reports requested from the Information Center or from
networked products can be printed.
Point-ofCare
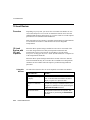
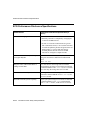
Equipment
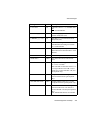
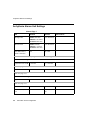
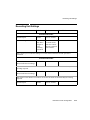
The Information Center communicates with the following monitoring devices:
•
Bedside monitors: IntelliVue Patient Monitor, CMS, V26 and V24, M3
(wired and wireless), and Compact Configurable Monitor 78352C/54C.
Note—In this book the term “M3” refers to Revision D.0 of the M2, M3,
and M4 bedside monitors. Differences in features or functionality are
called out where appropriate.
•
Philips Telemetry System and Hewlett-Packard M1403 Digital UHF
Telemetry System with Option C03. The telemetry system must be
Release C or greater. If the Philips transmitter is connected to the
TeleMon bedside monitor, it is referred to as “docked”.
Introduction to the Information Center
1-11
The Information Center Features
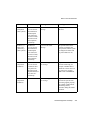
The Information Center provides the following functionality for point-of-care
equipment connected via Philips CareNet or the IntelliVue Clinical Network.
M3 Bedside
Monitors
connected via
the IntelliVue
Clinical Network
Bedside
Monitors
connected via
Philips CareNet
Telemetry
IntelliVue
Patient
Monitors
connected
via the
IntelliVue
Clinical
Network
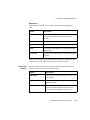
Central monitoring
(patient management
alarm annunciation,
etc.)
Yes
Yes
Yes
Yes
ST/AR Arrhythmia
monitoring at the
central
No -- provided by
bedside monitor.
Yes
Yes
Yes -- ST/AR
Arrhythmia
functionality is
available at the
central but is
provided by the
bedside
monitor.
Arrhythmia control
and review at the
bedside.
Arrhythmia control
is at the bedside;
review is available
at the bedside and
at the central.
Yes - CMS patient
monitors must be
Rev. C or greater.
N.A.
Yes
ST/AR ST segment
monitoring at the
central
No - if present, ST
segment
monitoring is
provided from the
bedside.
Yes - with limited
functionality at the
Information
Center.
Yes
No - if present,
ST segment
monitoring is
provided from
the bedside.
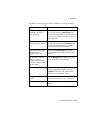
Function
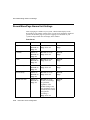
1-12
Introduction to the Information Center
Primarily provided
from the bedside.
The Information Center Features
M3 Bedside
Monitors
connected via
the IntelliVue
Clinical Network
Bedside
Monitors
connected via
Philips CareNet
Telemetry
IntelliVue
Patient
Monitors
connected
via the
IntelliVue
Clinical
Network
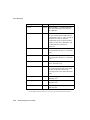
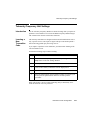
ST trends and waves
in ST Review
Yes
Yes
Yes
Yes
EASITM ECG
capability
No
Yes - CMS patient Yes
monitors must be
Rev. B.0 or greater.
V26 and V24
monitors must be
Rev. C.0 or greater.
Yes
Central printing of
recordings and reports
requested from the
point-of-care
Yes
Yes
Yes
Function
Note—Reports are
not available if
requested from M3
wireless monitors
to be printed at the
central printer.
However, they can
be printed on a
local printer.
Yes recordings via
patient button
on transmitter
(if configured)
or from
TeleMon (if
transmitter
docked).
EASI is a trademark of Zymed Inc.
Introduction to the Information Center
1-13
Information Center Display Screens
Information Center Display Screens
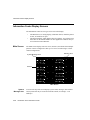
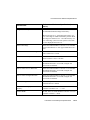
The Information Center has two types of screens on the display:
•
•
Main Screen
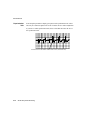
The Main Screen, or resting display, (illustration below) which has patient
sectors; no windows are open.
The Patient Window, which displays data for a patient. You perform most
tasks either on the Patient Window or other application windows that you
access from the Patient Window.
The Main Screen displays real-time waves, numerics, and alarms from multiple
patients. It can be configured to show up to 32 waves in either single- or dualcolumn configurations.
Date and Time
System Message Area
xxxxx
xx xxxxxxxxxxx xxxx
xx
XX
53
xx
XX
XX
0
53
XX
0
ll
xx
xx
Sectors
xxx x
xx
l
xx
54
xxx x
l
0
xx
xx
59
0
ll
ll
xx
xx
xx
xxx x
xx
l
xx
54
XX
0
60
XX
0
ll
xx
No Bed
XX
60
XX
0
xx
XX
53
XX
0
Main Screen
System
Message Area
1-14
An area at the top of the screen displays system status messages, date and time
and any name that may be associated with this central, for example, “CCU
Hallway1”.
Introduction to the Information Center
Information Center Display Screens
Patient
Sectors
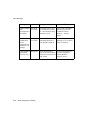
Up to 16 patients can be displayed on the Main Screen. The number of waves
and amount of information in a sector depends on the size of the sector. All
waves are 3.3 seconds in length in a dual-column format and 7.0 seconds in
length in a single-column format (at 25 mm/s speed -- waves at 12.5 mm/s are
twice as long).
In addition to the bed label, waves, and numerics, the information that displays
in a sector can include:
•
•
•
•
•
•
•
•
•
Patient name, if configured.
Heart Rate alarm limits, if configured (not available for M3 monitors).
First line of screen notes, if configured.
Paced indicator (if set).
Alarms off indicators and alarm and INOP messages (if applicable).
The
icon to the right of the bed label for telemetry monitored patients.
Note—If the telemetry transmitter is docked at TeleMon, the icon will
have a box around it.
If the M3 or IntelliVue Patient Monitor is connected to a wireless
IntelliVue Clinical Network, there is a wireless equipment icon
to the
right of the bed label.
An “*” to the left of the bed label for overview beds (see page 1-28).
A
in the upper right-hand corner to indicate that a conflict exists
between patient data at the Information Center and patient data at the M3
or IntelliVue Patient Monitor.
When the cursor is positioned over the bed label, the following information is
displayed:
•
•
Transmitter number, if telemetry monitored.
Monitor label (number), if M3 or IntelliVue Patient Monitor.
When the Patient Window is open, the bed label in the sector for the open
Patient Window has a dashed line around it. For beds assigned to a Care Group
(see “Care Groups” on page 2-12) the bed label in the patient sector will display
the selected color as the background for the bed label. For beds not assigned to a
Care Group, or beds who have the color black assigned, the bed label has white
text on black background.
Introduction to the Information Center
1-15
Information Center Display Screens
Patient Sector
Buttons
All tasks start in the patient sector. Normally, there are no buttons visible in the
sector. Buttons in the sector are activated when the cursor is in the sector. The
sector is then outlined, and the buttons become visible.
There are two buttons available from the patient sector. One is the Patient
Window button, which accesses the Patient Window. The other depends on how
your system is configured. The following table explains the button labels.
Condition
No alarm
pending
Action when Button Clicked
Record
Starts a delayed non-continuous (timed)
recording (can also click anywhere in the
sector except the Patient Window button).
Save
Generates the saving of a 30-second strip
in Alarm Review (can also click
anywhere in the sector except the Patient
Window button).
Record and Save Starts a delayed non-continuous (timed)
recording as well as the saving of a strip
(can also click anywhere in the sector
except the Patient Window button).
Alarm pending Silence
Turns the alarm sound off, and the sector
changes to its normal color (can also click
anywhere in the sector except the Patient
Window button).
Silence/Review
Turns the alarm sound off and the sector
changes to its normal color and opens a
Patient Window with the Fast Alarm
Review for that alarm.
Note—Can click anywhere in the sector
(except on a button) to turn the alarm
sound off without displaying the alarm.
Note—Your central may be configured to not allow silencing of bedside
alarms at the Information Center. In this case a Silence button will only appear
for telemetry beds. In the case of M3 and IntelliVue Patient Monitors, alarms
can be silenced at the central if both the central and M3 or IntelliVue Patient
Monitor are configured with remote silence enabled. If this is not the
configuration, the Silence button is present at the central, but is not active.
1-16
Button Label
Introduction to the Information Center
Information Center Display Screens
Condition
Button Label
Bed in Standby Resume
monitoring
Action when Button Clicked
Bedside Monitor (other than M3 or
IntelliVue Patient Monitor): button is
greyed out, indicating that monitoring
must be resumed at the bedside.
Telemetry, M3, and IntelliVue Patient
Monitors: takes the bed out of Standby,
and the button reverts to the normal label.
Note—If the transmitter is docked at
TeleMon, the bed cannot be put in
Standby.
Note—If there is no bed assigned to a sector, the Sector Setup button is
displayed instead of the Patient Window button. Clicking this button accesses
the appropriate page of the Sector Setup Window.
Introduction to the Information Center
1-17
Information Center Display Screens
Patient
Window
Single Display
When a Patient Window or an application window is open, all the patient sectors
are still visible in the top half of the screen, but are compressed (see the
illustration below). The Patient Window allows you to view up to 4 waves at a
time.
System Message Area
Date and Time
XXX
XX XXX XXX
XX
XX
l
XX
53
ll
XX
XXx
Compressed
Patient Sectors
XX
l
XX
54
ll
XX
0
0
XX
XX
XX
54
ll
0
XX
60
XX
XX
XX
0
53
0
XXXXSSS XXXXXXXX
XX SS SSSS
0
60
XX
XX
0
XX
l
XX
l
0
XX
59
ll
XX
XX
l
XX
54
XX
l
XXX
XXX
XXXX XXXXX
XXX
XXX
XXX
54
XXX
XXX
XXX
Patient
Window
Buttons
0
Basic
Task
Buttons
XXXXX
XXXXX
Basic
Task
Buttons
XXXX
XXXX
XXXX
XXXX XXXX
l
XXXXX XXX
XXXX XXXX
XX
Application Buttons54
XXXX
XX XXXX
XXXXX
XXXXX
XX
0
Patient Window
Display with Patient Window Open
Dual Displays
1-18
Dual displays offer the advantage of enabling clinicians to view the Patient
Window and the data review applications on a full screen. You can view up to 7
waves at a time (may be up to 6 with EASI ECG). A dual display system can be
configured with one or with two main screens.
Introduction to the Information Center
Information Center Display Screens
One Main Screen
One display is used for the Main Screen, and the other is used for a full-screen
Patient Window or application window.
Two Main Screens
• Both displays have patient sectors when Main Screen is active. For
example, for a 16-patient central, the Main Screen of each display
includes 8 sectors. This feature is available for 8, 12, and 16-patient
centrals.
• When an application window is open, all the sectors move to one display,
and the second display has the full-screen application window. To remove
the application window, click the Main Screen button.
Main Screen
53
0
53
0
53
0
53
0
53
0
53
0
53
0
53
0
54
53
0
53
0
53
0
53
0
53
0
53
0
0
Application
Window open
Introduction to the Information Center
1-19
Information Center Display Screens
Information/
Icons on the
Patient
Window
Some of the information/icons that can be displayed in the patient sector also
appear on the Patient Window:
•
•
•
•
Adjustments
on the Patient
Window
Telemetry icon
-- upper left corner
Wireless bedside icon
-- upper left corner
Screen Notes (if available) -- all text that was entered in the Admit
Window -- bottom of sector
Paced indicator (if applicable) -- upper left corner
Depending on the equipment assigned to a sector, clinicians can make the
following adjustments on the Patient Window to parameters:
•
Telemetry beds
– the lead/label for the primary and secondary ECG lead
– the size of the primary and secondary ECG waves (on the display
and recordings)
– the heart rate alarm limits
– SpO2 alarm limits (if SpO2 is on)
•
Bedside monitors with EASI ECG capability
– the size of the primary and secondary ECG waves (on the central
display and recordings)
•
IntelliVue Patient Monitors
– the size of the ECG waves (on the central display and recordings)
– the heart rate alarm limits
Note—If EASI ECG is being used, the label “EASI” is displayed below the
primary waveform.
Patient
Window
Buttons
1-20
The Patient Window provides the following buttons that allow you to perform
actions within the Patient Window:
Button
Description
Continuous Recording
Allows you to select waves to continuously
record.
Stop
Stops any continuous recording in progress.
Introduction to the Information Center
Information Center Display Screens
Button
Description
Suspend Alarms and
Unsuspend Alarms
Suspends/unsuspends alarms at the
Information Center.
(telemetry only)
NBP Alarms
(telemetry docked at TeleMon
only)
Allows you to adjust NBP alarms.
Arrhythmia Analysis
Displays up to two “live” delayed waves,
with beat labels. The beat labels represent
analysis of both the primary and secondary
waves. See Chapter 5, “ST/AR Arrhythmia
Monitoring” for additional information on
arrhythmia monitoring.
Multilead ECG
Displays a snapshot of up to six leads of
ECG, plus a 10-second rhythm strip. You can
use this window to verify that the ECG
waves are optimized for arrhythmia
monitoring.
(if not using EASI ECG)
12-Lead ECG
(if using EASI ECG)
More Waves
Displays the 12 leads derived from the EASI
ECG system, plus a 10-second rhythm strip.
From this window, you can print a 12-lead
report.
Displays additional waves, if available. If
none available, displays the Arrhythmia
analysis data (see “Arrhythmia Analysis”,
above).
Introduction to the Information Center
1-21
Information Center Display Screens
Application
Buttons
When the Patient Window or an application window is open, a “task bar” at the
bottom of the screen allows access to other Information Center applications for
that bed. There are two rows in the task bar.
Top Row
The buttons in the top row change with the active application to provide access
to related applications. The buttons in the table below appear on the Patient
Window.
1-22
Button
Description
Discharge
Accesses the Discharge Window to clear the patient data and
return alarm limits controlled at the central to unit settings.
Sector Setup
Accesses the Sector Setup Window to clear the sector and
assign an overview bed. Additional functionality depends on
whether the central is fixed or flexible. See “Fixed and
Flexible Monitoring” on page 2-26.
Standby
Accesses the Standby Window, enabling you to suspend
monitoring for telemetry, M3 beds, and IntelliVue Patient
Monitors when the patient is temporarily off the unit or out
of antenna range. Enables you to resume monitoring when
the patient returns.
For bedside monitors other than the M3 or IntelliVue Patient
Monitor, you must put bedside monitor in Standby and
resume monitoring at the bedside.
Wave Review
Accesses full disclosure.
Introduction to the Information Center
Information Center Display Screens
Bottom Row
The buttons in the bottom row are available no matter which application is
active.
Button
Description
Arrhythmia Alarms
Accesses a window to adjust arrhythmia monitoring
for a patient. This button is not available for M3
monitors
Trend Review
Accesses graphical and/or tabular trends.
Alarm Review
Accesses stored alarm events and user-saved strips.
Admit
Accesses the Admit Window to enter the patient name
and other data.
All Controls
Provides access to the full array of clinical and support
functions.
Note—A list of the applications associated with each button is displayed when
the mouse cursor rests on the button for approximately 10 seconds.
Basic Task
Buttons
In addition to the buttons in the task bar, the following basic task buttons are
always available, no matter which window is open.
Button
Description
Main Screen
Closes the open window and brings you back to the
resting display.
Patient Window
Brings up the Patient Window when another
application is open.
Patient List
Allows you to switch the patient in the open
window (the application does not change). See
“Viewing a Bed Temporarily” on page 1-28.
Introduction to the Information Center
1-23
Using Standby
Button
Description
Print
If a printer is available, starts a printout of the
screen or a report. This key is available only for the
Arrhythmia Analysis and Multilead ECG Patient
windows, data review applications, and unit
settings windows.
Note—If a printer is not available or is not
configured, the print key is greyed out.
Help
Brings up the on-line Help Window (see “Using the
On-line Help/Quick Guide” on page 1-35).
Using Standby
Standby is used to suspend monitoring for a patient. Control of the Standby
function depends on the monitoring device being used.
Telemetry,
M3 and
IntelliVue
Patient
Monitors
1-24
Standby is used to temporarily suspend monitoring, for example, when the
patient goes out of antenna range. In addition, when the patient is discharged,
the bed can be put in Standby until the new patient is connected.
Introduction to the Information Center
Using Standby
Task Summary
Place the bed in Standby and resume monitoring by performing the following
steps:
Step
Action
1
On the Patient Window, click the Standby button. Click on the
appropriate location, then on Suspend Monitoring. The message
“TELEMETRY STANDBY” or “MONITOR STANDBY” and
location, if selected, are displayed in the sector.
2
The bed can be taken out of Standby by placing the cursor in the
sector and clicking on the Resume Monitoring button.
Other
Bedside
Monitors
The bed is put in Standby and taken out of Standby at the bedside monitor. At
the central, you can select the location that is displayed in the sector, along with
the Standby message.
Task Summary
Select the Standby location by performing the following steps:
Step
1
Action
On the Patient Window, click the Standby button. Select the
location from the list. The “MONITOR STANDBY” message and
location, if selected, are displayed in the sector.
Note—At the central, when the cursor is placed in the sector, a
Resume Monitoring button is available. Clicking on it reminds you
to take the bed out of Standby.
Introduction to the Information Center
1-25
EASI 12-lead Review and Report
EASI 12-lead Review and Report
If the monitoring device has EASI 12-lead capability, you can view all available
leads from the Patient Window. In addition, you can request a 12-lead report.
Note—EASI derived 12-lead ECG’s and their measurements are approximations
to conventional 12-lead ECG’s and should not be used for diagnostic
interpretations.
Task
Summary
Display the 12-leads and print a report by performing the following steps:
Step
1
1-26
Action
On the Patient Window, click the 12-Lead ECG button. A 2.5
second ECG wave is displayed for each of the derived 12 leads.
Note—It is not possible to display the derived 12-lead waves if there
is an INOP condition in any lead. To view the EASI AI, AS, and ES
leads, click on 3 EASI Leads.
Introduction to the Information Center
EASI 12-lead Review and Report
Step
Action
2
To:
• View the most recent ECG data -- click Update Waves.
• Change the wave layout -- click on the wave layout on the top
right side of the window then select wave format (3x4, 6x2, or
12x1) from the list that displays. In 3x4 layout an additional
rhythm lead displays.
• Change the size of the waves -- click on the cal bar and select
the size of the wave you want from the list that displays (x1/2,
x1, x2, x4).
• Change the wave speed (25 mm/s or 50 mm/s) -- click on the
speed on the bottom right of the window and select the speed
from the list that displays. When you select a different speed the
window re-displays with the selected speed.
3
To print a report click the Print button at the top of the window. The
report shows all of the monitored vital signs, the 12 leads, and the
high pass and low pass bandwidth frequencies with:
• 3 rows x 4 columns -- showing 12 2.5-second waves and a 10second rhythm strip at the bottom of the page
• 6 rows x 2 columns -- showing 12 5-second waves
• 12 rows x 1 column -- showing 12 7-second waves.
Introduction to the Information Center
1-27
Viewing Other Patients over the IntelliVue Clinical Network
Viewing Other Patients over the IntelliVue Clinical Network
Information Centers and Clients on the IntelliVue Clinical Network enable you
to view both real-time and stored patient data for patients monitored by other
centrals on the IntelliVue Clinical Network.
There are two ways to do this:
•
View the bed temporarily, in the Patient Window
You select the patient via the Patient List. You can then monitor the
patient or review the data for that bed until you change to another patient
or go to the Main Screen. If configured, you may also be able to admit,
discharge, and transfer data for that bed.
or
Overview a bed in a sector on your central
You use Sector Setup to overview a bed that is monitored by another
networked central. The actions allowed for overview beds depend on how
the system is configured. See “Types of Access” on page 1-29.
•
Viewing a
Bed
Temporarily
You can view data temporarily for any bed monitored by another networked
central. This feature enables you to view patients that are in other clinical units
or that are being monitored by another central in your unit.
Task
Summary
View other patients temporarily by performing the following steps:
Step
1-28
Action
1
Click the Patient Window button in any sector to bring up a Patient
Window.
2
On the Patient Window, click the bed label at the left in the title bar
to display the Patient List. The beds listed are those that are
displayed on this central.
Introduction to the Information Center
Viewing Other Patients over the IntelliVue Clinical Network
Step
Action
3
Click the button to the left of the Patient List for the unit you want.
The Patient List will now contain all beds currently monitored in the
unit you selected.
Note—Click on your unit name to access patients on other centrals
in your unit.
4
Click on the bed you want. That patient’s data will be displayed in
the Patient Window. You can then access any other window for that
patient.
5
You can then access data for another patient or click Main Screen to
remove the window.
Note—You don’t have to return to the Patient Window. For
example, if you are on the Alarm Review Window, you can remain
there and change the patient you are viewing. Other windows you
access will then be for that patient.
Overview
Beds
You can overview a bed on your Main Screen that is monitored by another
networked central. See Chapter 2, “Patient Management” for information on
assigning overview beds.
Types of
Access
Each central on the IntelliVue Clinical Network can be configured to specify the
following types of access control of beds monitored by another central:
•
•
Full Control (read-write) access -- you can view patient data and change
measurement controls (such as alarm limits).
– Telemetry Setup controls are for that central only.
– Functions that affect the central as a whole, rather than a specific
bed, such as volume control are accessible for the local central only.
Read-Only access -- you can view patient data, but measurement controls
cannot be changed. The controls that are available are:
– Record button in the Patient Sector
– Continuous Recording in the Patient Window
– Arrhythmia Analysis Windows -- Update Waves (but not Relearn)
– Alarm Review -- navigation and record or print alarm.
– Event and Wave Review -- navigation.
Introduction to the Information Center
1-29
Consulting Beds over the Philips CareNet
•
Full Control
if Multiple
Viewers
– Trend Review -- navigation.
– ST Review -- navigation, superimpose
– Record All (from All Controls)
– Sector Setup
No access -- you cannot access any bed on that central.
Since more than one Information Center can have access to a bed at the same
time, there may be situations when two or more clinicians are viewing
information for the same patient at the same time. If multiple clinicians have full
control access to the same patient, then, in general, the last operation wins.
Consulting Beds over the Philips CareNet
If you have a Information Center on the Philips CareNet and you have flexible
monitoring configured, you can view real-time patient data for patients
monitored by other centrals on the same CareNet. You do this by assigning a
sector as a consulting bed.
Consulting
Beds
To assign a consulting bed, you assign a sector on the Main Screen to display
that bed. You can use either an empty sector, or you can clear a sector that is
currently being used. See “Assigning a Bed and/or Equipment to a Sector” on
page 2-27 for a task summary.
The following functions are available from consulting beds:
•
•
1-30
Main Screen: same as monitoring central, except there will not be a
pacing indicator. You can make a recording from the patient sector -- you
cannot save a strip (if the system is configured for Save or Record and
Save from the sector). You can also silence alarms.
Alarm recordings (as configured in the consulting central’s Record/Store
Unit Settings).
– If a yellow alarm condition persists after the inhibitory period ends
and the alarm is generated again, that alarm will not produce a
recording at the consulting central.
– If there are multiple red alarms, the consulting central records the
highest priority alarm.
Introduction to the Information Center
Consulting Beds over the Philips CareNet
•
Patient Window: controls for Continuous Recording, the Patient List,
Main Screen button, and All Controls button.
Note— For EASI monitored patients, the leads displayed are fixed at lead
II and V2. The ST values correspond to primary and secondary ECG
waves displayed at the monitoring central and are reflected as ST 1 and
ST 2.
For non-EASI monitored patients, the leads and ST values correspond to
the primary and secondary ECG waves displayed at the monitoring
central.
•
Sector Setup Window: Clear Sector tab (if bed assigned), or Assign Bed/
Equipment tab (if no bed assigned).
All Controls: Sector Setup button, Volume Control button, service-related
applications.
The on-line Help function is available, where applicable.
•
•
Guidelines
for Ensuring
Correct Data
If a bed is monitored by one Information Center and is a consulting bed on
another Information Center, it is important to ensure that patient data is labeled
correctly. To do this, follow the guidelines listed below. For these examples, the
monitoring (primary) central is “Central 1” and the consulting central is “Central
2”.
On Central 1, when you are going to begin monitoring a new
patient:
1. On Central 2, use Clear Sector in Sector Setup to clear any consulting
sectors that have the bed label or the equipment for the new patient.
2. On Central 1, admit the patient.
3. On Central 2, use Assign Bed and Equipment in Sector Setup to assign
the new patient’s bed and equipment.
On Central 1, before you change the equipment and/or bed label for
this patient:
1. On Central 2, use Clear Sector to empty the sector that is consulting the
patient.
2. On Central 1, make the changes (bed, equipment, or both) for the patient.
3. On Central 2, use Assign Bed and Equipment in Sector Setup to assign
the same bed and/or equipment for the patient.
On Central 1, before you discharge this patient:
On Central 2, use Clear Sector to empty the sector that is viewing the patient.
Introduction to the Information Center
1-31
Optimizing Wireless System Performance
Optimizing Wireless System Performance
Bedside monitors with a wireless connection to the IntelliVue Clinical Network
have their advantages, however the flexibility the wireless link offers is not
without its challenges. The reliability and quality of the wireless signal
transmission through the air and hospital walls are governed by a number of
variables that can be difficult to control. A wireless connection from a bedside
cannot be as dependable as a wired connection.
The effect of low signal strength and interference on the display of the patient
information from a wireless bedside at the central station can range from a
momentary period to a lengthy period of data loss. Although data loss due to the
wireless link may be occurring at the central station, monitoring and alarming
continue at the bedside (this differs from telemetry where monitoring and
alarming occur in the central station, so when data loss due to the wireless link
occurs, monitoring cannot continue).
Minimizing
Data Loss
Low Signal
Strength
In order to minimize data loss at the central station due to low signal strength
and interference, there are several things a hospital should do.
Devices called “Access Points” are used to receive the radio signals from the
bedsides. A wireless bedside must be within the coverage area of an associated
access point for proper operation. When a wireless bedside is taken out of the
designated coverage area, data loss at the central station will increase.
Warning
Interference
Various equipment and/or electrical or medical devices that operate in the
2.4 to 2.48 GHz range could interfere with radio transmission of important
medical data to the central station. Facilities utilizing wireless devices need
to manage the use of these devices for safe operation.
The effect of interference on the amount of data loss at the central station
depends on the strength, type and proximity of the interfering device to the
wireless bedside or access point. Any wireless device operating between 2.4 and
2.48 GHz can cause interference with the monitoring wireless network. Likely
sources of interference include microwave ovens, other vendors’ wireless
1-32
Introduction to the Information Center
Optimizing Wireless System Performance
networks, wireless telephone headsets, certain cellular telephones, handheld
computers, transceiver devices, and Bluetooth devices. In cases where the source
of interference is known, removing the device or moving it away from the
wireless bedside or access point will improve the system’s performance.
Since the wireless network used for monitoring emits radio frequencies, it is also
possible for it to interfere with other devices (for example, programmers for
cardiac pacemakers). Contact the manufacturers of other equipment used in the
vicinity of the monitoring wireless network for information on possible
susceptibility to these frequencies.
It is the hospital’s responsibility to keep track of all of the wireless devices in
use in the hospital, and manage their use for safe operation.
Wireless
System
Messages
The system continually monitors the signal quality sent from wireless monitors.
When data transfer from one or more monitors across the wireless link is
compromised due to interference or too many transmitting devices, the system
displays one of the following messages at the top of the screen.
Message
Possible Cause
Excessive
wireless data
loss
Data loss (no signal or excessive
dropout of signal) because of too
many monitors using an Access
Point, excessive interference, or
weak signal.
What to Do
•
•
•
•
Excessive
wireless
interference
Dropout of signal on one or more
monitors due to interference of the
signal, e.g., microwave oven
interference.
•
•
•
•
Turn off unused monitors.
If a microwave is in use, move
monitors away from the
microwave signals.
Locate and remove source of
interference.
If condition persists, contact
service.
Make sure all microwave
ovens are turned off or at least
20 feet from the monitors.
Turn off unused monitors.
Locate and remove source of
interference.
If condition persists, contact
service.
Introduction to the Information Center
1-33
Configuration
Message
Possible Cause
Weak radio
signal
Excessive occurrence of dropped
messages and weak (wireless) radio
errors have occurred between one or
more wireless M3/M4 bedsides and
an access point. This could happen
due to a device being marginally out
of range of an access point or
because of some signal attenuator,
for example a monitor being behind
a large metal cabinet.
What to Do
•
•
Move the monitor within
range of an access point.
If condition persists, contact
service.
Configuration
The Information Center Software is shipped with factory defaults. At
installation, (or at any time after installation), the Information Center Software
can be configured with defaults for the unit in which it is installed.
In addition, adjustments such as changes to alarms being stored and recorded
can be made on a per patient basis.
See Chapter 9, “Information Center Configuration,” for a list of factory defaults
and configuration choices.
1-34
Introduction to the Information Center
Using the On-line Help/Quick Guide
Using the On-line Help/Quick Guide
An on-line Help feature is a Quick Guide that is always available to answer
questions and provide information on using the Information Center.
There are two types of information available:
•
Context-Sensitive: This is information you get when you first click the
Help button. It tells you about the window you’re looking at.
•
Task and Problem-Solving Quick Guide: This is information on
performing tasks and troubleshooting problems. To get to this type of
information, click Quick Guide on any Help Window. You’ll get the
Quick Guide Menu. Click on an item to get to that topic.
In the Help windows, text in green (and underlined) indicates that you can click
on it and get more information.
Note—To print a topic, click the right mouse button and select Print Topics.
Introduction to the Information Center
1-35
Using the On-line Help/Quick Guide
1-36
Introduction to the Information Center
This chapter describes how to manage patient data using the Information Center.
It includes the following sections:
•
•
•
•
•
•
•
•
•
•
•
•
•
Introduction. . . . . . . . . . . . . . . . . . . . . . . . . . . . . . . . . . . . . . . . . . . . . . 2-2
Admitting a Patient . . . . . . . . . . . . . . . . . . . . . . . . . . . . . . . . . . . . . . . . 2-3
Changing Patient Information. . . . . . . . . . . . . . . . . . . . . . . . . . . . . . . . 2-8
Resolving Conflicts with M3 or IntelliVue Patient Monitors . . . . . . . 2-9
Care Groups . . . . . . . . . . . . . . . . . . . . . . . . . . . . . . . . . . . . . . . . . . . . 2-12
Discharging a Patient . . . . . . . . . . . . . . . . . . . . . . . . . . . . . . . . . . . . . 2-18
Discharging for Transport. . . . . . . . . . . . . . . . . . . . . . . . . . . . . . . . . . 2-21
Transferring Patient Data to a New Bed. . . . . . . . . . . . . . . . . . . . . . . 2-23
Fixed and Flexible Monitoring . . . . . . . . . . . . . . . . . . . . . . . . . . . . . . 2-26
Assigning a Bed and/or Equipment to a Sector . . . . . . . . . . . . . . . . . 2-27
Changing Equipment for a Sector. . . . . . . . . . . . . . . . . . . . . . . . . . . . 2-29
Assigning an Overview Bed to a Sector . . . . . . . . . . . . . . . . . . . . . . . 2-32
Clearing (Unassigning) a Sector . . . . . . . . . . . . . . . . . . . . . . . . . . . . . 2-34
Patient Management
2-1
Introduction
2
Patient Management
Introduction
Introduction
The Information Center provides the following applications to manage patients:
Application
Description
Admit
The Admit application connects all stored data to a
patient’s name and puts the name on the display,
recordings, and reports. See “Admitting a Patient” on
page 2-3 for information on admitting patient to the
Information Center.
Discharge
The Discharge application clears a patient’s name and
data from the central database and returns central
settings to unit defaults. See “Discharging a Patient”
on page 2-18 for information on discharging patients.
Sector Setup
The Sector Setup application allows you to:
• Assign a bed and or equipment to a sector
(flexible monitoring only). See page 2-27.
• Change the equipment for a sector (flexible
monitoring only). See page 2-29.
• Assign an overview bed to a sector. See page
2-32.
• Unassign (clear) a sector. See page 2-34.
For patients connected to M3 and IntelliVue Patient Monitors, you can admit,
discharge, transfer, or update patients from either the bedside or the Information
Center. When you admit or discharge a patient being monitored by an M3 or
IntelliVue Patient Monitor on the Information Center that patient is also
admitted or discharged on the bedside.
Note—A related application is Stored Waves. When the patient is first connected
(or at any time) you can change the waves that are stored in the database. See
“Changing the Waves that are Stored” on page 6-50 for more information.
2-2
Patient Management
Admitting a Patient
Admitting a Patient
Overview
You must admit a patient to the Information Center in order for the name to
appear on the display, recordings, or reports. You admit a patient by using the
Admit Window.
With M3 or
IntelliVue
Patient
Monitors
For patients connected to a M3 or a IntelliVue Patient Monitor you can admit
the patient at either the bedside or at the Information Center. When you admit
the patient on the Information Center that patient is also admitted to the bedside
monitor. The patient name, medical record number, paced status, patient
category, screen notes, and Care Group assignment are communicated to the
bedside monitor. For IntelliVue Patient Monitors the additional fields of patient
weight, height, gender, and date of birth are communicated to the bedside.
With Other
Bedsides
The Information Center communicates a patient’s name and medical record
number to the bedside monitor. Other patient information must be entered at the
bedside, however. Information entered on the Admit window at the bedside
monitor is not displayed at the central.
Patient Management
2-3
Admitting a Patient
Task
Summary
Since data collection starts when a patient is connected to the monitor, it is
important that you perform a discharge prior to connecting a new patient. See
“Discharging a Patient” on page 2-18 for information on discharging patients.
Admit a patient to the Information Center by performing the following steps:
Step
1
Action
On the Patient Window for the bed you want to admit, click on the
Admit button.
Note—If the bed to which you want to admit this patient does not
appear on the display and you have flexible monitoring, you can
display the bed by using the Sector Setup Window. See “Assigning
a Bed and/or Equipment to a Sector” on page 2-27.
2
If this patient is on telemetry, be sure the label on the transmitter
matches the transmitter label in the Equipment field.
If the label does not match and you have:
Fixed Monitoring
You must either change the transmitter or admit to the bed label
with that transmitter assigned to it.
Flexible Monitoring
If another patient is not currently admitted to a bed assigned to this
equipment, you can assign the equipment to this bed by using the
Sector Setup Window. See “Changing Equipment for a Sector” on
page 2-29.
2-4
Patient Management
Admitting a Patient
Step
3
Action
On the Admit Window specify a patient to admit by either:
• typing a 1- to 18-character first and last name in the appropriate
Patient Name fields. Only the last name is required. You can
use the Tab key to move from field to field. To avoid any
potential conflicts, be sure to enter a unique patient name in the
name fields.
or
• clicking on a patient name in the Transfer List. If the patient
is in a different care unit, first click on the unit, then on the
name. See “Transferring Patient Data to a New Bed” on page
2-23.
Note—The Transfer List contains a listing of up to four discharged
patients per Information Center for which data from previous
monitoring has been saved. When you select a name from the
Transfer List and then click the Admit Patient button, any data
since you began monitoring will be erased, and the saved patient
data will be retrieved. If you want to keep the current monitoring
data, do not use the Transfer List.
If the patient’s first and last name is 18 characters or less, the
Information Center communicates the patient’s entire name to the
bedside monitor. If the patient’s name is longer than 18 characters,
the Information Center communicates the first 18 characters of the
patient’s last name to the bedside monitor.
4
Enter a 1- to 12-character medical record number for this patient in
the Medical Record Number field. The central communicates the
medical record number to the bedside monitor.
Patient Management
2-5
Admitting a Patient
Step
5
Action
If the patient has a cardiac pacemaker (including demand, fixed, or
any type), click on Patient Paced to display a checkmark in the
box. This enables the ST/AR algorithm to detect and reject pace
pulses (spikes) from the HR count.
Warning
If you do not have a checkmark in the Patient Paced box, pace
pulses could be detected as beats and the monitor may not alarm
for an asystole condition. Keep pacemaker patients under close
observation. See Chapter 5, “ST/AR Arrhythmia Monitoring,”
for specific warnings about monitoring paced patients.
Note—When Patient Paced is checked, the word “Paced” displays
in the lower right corner of the sector and the upper left corner of
the Patient Window. If the bed is a consulting bed for a central on
Philips CareNet, the word “Paced” does not appear.
If the patient is on a bedside monitor, and arrhythmia analysis is off,
this field is greyed out.
6
2-6
Patient Management
Specify what type of patient this is in the Patient Category field.
Your choices include:
• Adult
• Pediatric (if selected, telemetry ST monitoring is not available)
• Neonatal (bedside monitors only)
The patient category you select affects arrhythmia analysis and
alarm limits. If the patient category is changed for a bedside
monitored patient be sure to check the alarm settings at the bedside.
Note—For M3 and IntelliVue Patient Monitors, changing the patient
category does not change alarm limits. You should check for correct
alarm limits at the bedside monitor.
Admitting a Patient
Step
Action
7
Specify the patient’s birth date in the Date of Birth field. You can
specify the date by entering a numeric date or by selecting the date
by clicking on the calendar.
Note—The calendar only allows you to specify the birth date by
clicking on the appropriate date on the calendar. You cannot enter
text into the calendar.
8
Enter the patient’s weight in the Weight field. Depending on how
your system is configured, valid values are:
• Adult/Pediatric— 0 to 999 lbs or 0 to 450 kg
• Neonatal—0 to 9999 g
9
Enter the patient’s height in the Height field. Depending on how
your system is configured, valid values are 0 to 99 in or 0 to 250 cm.
10
Specify a gender in the Gender field by selecting the gender using
the drop down arrow.
11
If you would like to associate text (for example the physician’s
name) with this patient, enter the text in the Screen Notes field.
You can enter up to 60 characters.
The first 34 characters you enter will appear in the patient sector
when in the Main Screen (if configured). All the text will display in
the Patient Window.
Note—If the monitoring device is the M3 or IntelliVue Patient
Monitor, the screen notes text will be displayed in the Admit
window. If a previous screen note was entered, it will be overwritten
by the text entered at the central.
12
Assign this patient to a Care Group if desired by selecting the Care
Group from Care Group field. See “Care Groups” on page 2-12.
13
Review all the fields to be sure they are correct then click the
Admit Patient button. The Information Center admits the patient.
Note—If paging is available on your system, after admitting the patient, you can
assign the patient to a clinician’s receiver (pager). See “Assigning Patients to
Caregivers” on page 8-7.
Patient Management
2-7
Changing Patient Information
Changing Patient Information
Overview
With M3 or
IntelliVue
Patient
Monitors
Task
Summary
You can change patient information such as patient’s name, Care Group
assignment, and medical number by using the Admit Window.
For patients connected to a M3 or a IntelliVue Patient Monitor you can change
the patient information at either the bedside or at the Information Center. When
you change the patient information on the Information Center that information is
also changes on the bedside monitor. The patient name, medical record number,
paced status, patient category, screen notes, and Care Group assignment are
communicated to the bedside monitor. In general, any fields changed at either
the Information Center or the M3/IntelliVue Patient Monitors will be copied to
the other device. The last entry wins. For IntelliVue Patient Monitors the
additional fields of patient weight, height, gender, and date of birth are
communicated to the bedside.
Change patient information by performing the following steps:
Step
2-8
Action
1
On the Patient Window for the bed for which you want to change
information, click on the Admit button.
2
On the Admit Window change the patient information in the
appropriate fields. For information on specific fields see “Admitting
a Patient” on page 2-3.
3
When you have finished modifying the patient information click the
Update button.
Note—Changing the patient name affects all stored data, not just the
data from the update time forward.
Patient Management
Resolving Conflicts with M3 or IntelliVue Patient Monitors
Resolving Conflicts with M3 or IntelliVue Patient Monitors
Overview
Since you can admit, discharge, or transfer patients from both the Information
Center or the M3 and IntelliVue Patient Monitor, a possibility exists that the
information between the two systems does not match. If user intervention is
required a
icon displays in the patient sector for the patient when data
between the Information Center and the bedside do not match. In addition, when
in the Admit or Discharge windows, a Conflict Resolution screen will display on
the Information Center where you can resolve the conflict manually.
Warning
It is important to resolve the conflicts as soon as they are identified. Failure
to do so could result in using incorrect/confusing data to make clinical
decisions. Certain settings, for example, Paced and Patient Category
between the Information Center and the bedside may not match. If the
Paced status setting is set incorrectly the system could mistake a pace pulse
for a QRS and fail to alarm in the case of asystole. It is important that the
Patient Category is set correctly so the ECG can be analyzed correctly and
initial arrhythmia alarm limits set.
In addition if conflicts are not resolved as soon as they are identified patient
identifiers (for example, patient name, medical record number) will not be
available through Information Center Web.
Patient Management
2-9
Resolving Conflicts with M3 or IntelliVue Patient Monitors
Task
Summary
When the Conflict Resolution window displays, resolve the conflict by
performing one of the following:
If you want to
then . . .
Use the patient information from
the Information Center.
Click the Use Information Center
button. The patient information is
retrieved from the Information Center
and you return to the Admit/
Discharge/Transfer window.
When you choose this option the
Information Center settings,
including patient category, are
applied to the bedside monitor. Any
stored bedside data is cleared. The
patient category setting applies to the
algorithms used to process incoming
patient data.
Verify that all bedside alarm settings,
including arrhythmia alarm settings,
are correct.
2-10
Patient Management
Resolving Conflicts with M3 or IntelliVue Patient Monitors
If you want to
then . . .
Use the patient information from
the bedside
Click the Use Bedside Monitor
button. The patient information is
retrieved from the bedside and you
return to the Admit/Discharge/
Transfer window. When you choose
this option the bedside settings are
applied to the Information Center.
Any stored Information Center data is
cleared.
Verify that all bedside alarm settings,
including arrhythmia alarm settings,
are correct.
You do not want the patient
information from either the
Information Center or the bedside.
Click the Clear and Begin New
Patient button. Patient information
and stored data at both the
Information Center and the bedside is
cleared and you return to the Admit/
Discharge/Transfer window where
you can enter new patient
information.
Note—In the event that a patient is admitted on both the IntelliVue Patient
Monitor and the Information Center and there are no differences between patient
name, medical record number, paced or patient category but there are
differences for date of birth, gender, weight, or height the IntelliVue Patient
Monitor bedside value is always used.
Patient Management
2-11
Care Groups
Care Groups
Overview
Care Groups allow you to associate one or more beds with a group. A single
Care Group is assigned to one nurse who is responsible for multiple patients
within a single care unit. A Care Group can have a specific color associated with
it. When a color is assigned to a particular care Group the color appears as the
background for the bed label on the Information Center. Color by bed label
helps the nurse to quickly identify patients in his/her Care Group.
Up to 12 beds can be assigned to a single Care Group and there can be up to 18
Care Groups in a unit. When a bed is assigned to a Care Group the bed remains
in that Care Group across equipment changes, standby/resume, patient admit or
discharge, and power cycles. A bed assigned to a Care Group is removed from
that Care Group when the bed is unassigned from the Information Center that
was monitoring that bed or if the bed label is changed.
With M3 or IntelliVue Patient Monitors
With M3 or IntelliVue Patient Monitors, you can use Care Groups to notify the
nurse of any alarms for the patients in their Care Group through alarm overview
at the bedside. In addition, the nurse can see the current alarm status of each of
the patients within the same Care Group at the bedside (see your appropriate
bedside user documentation for details).
Setting up a
Care Group
To set up a Care Group perform the following steps:
Step
2-12
Action
1
From the All Controls window click the Care Group button under
Patient Management. The Care Group Settings window displays.
2
On the Care Group Settings window click on the Setup tab.
3
Click the New Care Group button.
4
Enter a 1 to 18-character name for the Care Group you are setting
up in the Name field. To avoid any potential confusion when
identifying Care Groups in the system, the name you specify in this
field must be unique.
Patient Management
Care Groups
Step
5
Action
If this is a Care Group with M3 or IntelliVue Patient Monitors,
specify the Auto Alarm setting for this Care Group (see your
bedside monitor User’s Guide) by clicking on the appropriate radio
button in the Auto-alarm field. Choices are:
Choice
Description
Disabled
Selecting this option turns off the Auto
Alarm Pop-up feature at the bedside.
Warning—If the bedside overview status
bar is not enabled and Auto Alarm Pop-up
is disabled, alarming beds will not be
visible in overview at the bedside. Do not
disable the Auto Alarm Pop-up if you use
overview at the bedside as your primary
monitoring source. You must enable Auto
Alarm Pop-up at both the Information
Center and the bedside in order for this
feature to work. At the bedside, you can
turn auto pop-up on/off on a per bed basis.
Red
Selecting this option causes an Auto
Alarm Pop-up window to display at the
bedside when beds in this Care Group
have a red alarm condition.
Red and Yellow
Selecting this option causes an Auto
Alarm Pop-up window to display at the
bedside when beds in this Care Group
have a yellow alarm condition or greater.
Patient Management
2-13
Care Groups
Step
2-14
Action
6
If this is a Care Group with M3 or IntelliVue Patient Monitors,
specify whether a prompt tone will be audible at the bedside when
beds in this Care Group have an alarm condition by clicking on the
appropriate radio button in the Prompt-tone field. If you select
Disabled, no tone will be audible at the bedside when a bed in this
Care Group has an alarm condition.
7
Assign a color to this particular Care Group by clicking on a color
in the Assign Central Color field. The color you assign will
appear as the background for the bed label on the Information
Center.
Note—If you do not want to assign a color to this Care Group click
on the color black in the Assign Central Color field. When you
select the color black no color displays as the background or the bed
label.
8
Click the OK button. The Information Center sets up the Care
Group with the choices you selected.
9
If you would like to set up another Care Group, click on the New
Care Group button and repeat Steps 1 through 8.
10
When you are done setting up Care Groups return to the All
Controls window by clicking the All Controls button or go to
another Care Group Settings window by clicking on the appropriate
tab on the top of the window.
Patient Management
Care Groups
Assigning a
Bed to a
Care Group
From the Admit Window
You can assign a specific patient to a Care Group when admitting the patient or
updating patient information in the Admit window by selecting the Care Group
from the Caregroup field. See page 2-3 for information on using the Admit
window.
From All Controls
To assign a bed(s) to a Care Group from the All Controls window perform the
following steps:
Step
Action
1
From the All Controls window click the Care Group button. The
Care Group Settings window displays.
2
Select the Care Group that contains the beds you want to assign
from the Source Care Group drop-down list. If the bed is not
currently assigned to a Care Group select “Unassigned” from the
Source Care Group list.
3
From the Source Care Group Current Beds field, highlight the
name of the patient/bed you want to assign to the Care Group.
Note—You can select all the beds in the Current Beds field by
clicking the Select All Beds button or select more than one bed
by holding down the Shift key. You can assign up to 12 beds to a
single Care Group.
Note—For M3 and IntelliVue Patient Monitors, the order in which
you assign beds does not necessarily dictate the order in which they
will display in the alarm reflector at the bedside.
4
Select the Care Group to which you want to assign this bed(s) from
the Target Care Group drop-down list.
5
Click the Move button to move the bed(s) to the Target Care
Group.
Patient Management
2-15
Care Groups
Step
Action
6
Click the Update button to assign the bed(s) to the selected Care
Group.
Note—Clicking the Cancel button before you click the Update
button cancels changes and returns the Care Group Settings window
to the state it was in upon entry.
7
When you are done assigning beds to a Care Group return to the All
Controls window by clicking the All Controls button on the
bottom of the screen or go to another Care Group Settings window
by clicking on the appropriate tab on the top of the window.
Note—If you have sectors assigned for consulting beds (see page 1-30) it is
possible to assign the consulting bed to a different Care Group than the primary
Information Center for the bed. This would result in same bed being assigned to
two different Care Group. You should, therefore, only assign patients to Care
Groups at the primary Information Center.
Viewing
Care
Groups
2-16
To view beds assigned to a Care Group perform the following steps:
Step
Action
1
From the All Controls window click the Care Group button.
2
On the Care Group Settings window click on the View tab. The
Care Group Settings window displays the Care Group settings
corresponding to the current bed. A list of all beds assigned to the
Care Group appears on the right side of the window.
Patient Management
Care Groups
Step
Action
3
If you would like to
view
then . . .
the Care Group settings
for a particular bed
highlight the Care Group for the bed
of interest then click on the plus sign.
The Care Group settings for the bed
display.
all the Care Groups
currently assigned to a
unit
on the left side of the window, click
on the plus sign next to All. All bed
assignments for all Care Groups in the
unit display.
a specific Care Group
on the left side of the window, click
on the plus sign next to All then click
on the plus sign next to the Care
Group of interest. The settings for that
Care Group display.
Note—You can print a report of all of the Care Groups in the system
by clicking the Print button.
4
When you are done viewing Care Groups return to the All Controls
window by clicking the All Controls button on the bottom of the
screen or go to another Care Group Settings window by clicking on
the appropriate tab on the top of the window.
Patient Management
2-17
Discharging a Patient
Discharging a Patient
Overview
Important—Discharging from the central clears the central database for a bed. At
that point, data storage begins for that bed. For this reason, you should perform a
discharge prior to connecting a new patient. This ensures that data from a
previous patient is not mixed with the data from the new patient. It also ensures
that alarm limits controlled at the Information Center go back to unit settings.
When you enter the Discharge Window, you are given the choice of saving,
removing the patient data, or if this is an M3 or an IntelliVue Patient Monitor,
discharging for transport.
If you save the data, the patient’s name appears in the “Transfer List” in the
Admit Window. It can then be retrieved if the patient is re-admitted, or, if the
central is connected via the IntelliVue Clinical Network or connected to a Large
Network Central Database System, it can be retrieved if the patient is transferred
to another unit.
If you discharge for transport, the Information Center discharges the patient on
the Information Center and stores the patient data but does not discharge the
patient from the bedside monitor. See “Discharging for Transport” on page 2-21.
With M3 and
IntelliVue
Patient
Monitors
2-18
If this is a patient connected to an M3 or IntelliVue Patient Monitor, discharging
the patient at the Information Center also discharges them from the bedside
monitor and clears both databases. All monitor and measurement server settings
are reset to their defaults including arrhythmia settings. With IntelliVue Patient
Monitors your monitor can be set up with predefined monitor configurations
called profiles. Depending on how your monitor is set up when you discharge a
patient the monitor either continues with the previous profile, or resets to the
default profile configured for that monitor. Refer to your bedside documentation
for details.
Patient Management
Discharging a Patient
With Other
Bedsides
Task
Summary
If this is a bedside monitor other than the M3 or IntelliVue Patient Monitor,
discharging a patient from the Information Center clears the patient name and
medical record number at the bedside monitor. You must, however, discharge
the patient at both the Information Center and the bedside monitor to clear both
databases. Discharge the patient from the Information Center first, then from the
bedside. When you discharge a patient from the Information Center, all pending
reports are cancelled, arrhythmia alarm settings go back to Unit Settings and any
screen notes are cleared. The settings for alarms controlled at the bedside (for
example, HR limits) do not change -- to set these alarms back to the defaults,
consult your bedside monitor documentation.
Discharge a patient by performing the following steps:
Step
Action
1
From the Patient Window click the Discharge button.
2
Unassign the Care Group associated with this patient, if desired, by
clicking in the Unassign Caregroup checkbox.
Patient Management
2-19
Discharging a Patient
Step
3
Action
On the Discharge Window specify whether you want to save or
remove the patient data associated with this patient after discharge
or, if this is an M3 or IntelliVue Patient Monitor, to discharge for
transport by clicking on the appropriate button.
Specify Save Data with Discharge (only available for admitted
patients) if this patient will be transferred to another bed/unit or readmitted soon and you want to save the data. If you are transferring
the patient to a unit over a large network, select the unit to which to
transfer the data by clicking on the unit name in the Transfer
Destination list before clicking the Save Data with Discharge
button. The maximum number of patients for whom data can be
saved is four per central unless the central is connected to the
M3154 Database Server in which case the maximum number of
patients is four times the number of Information Centers. Only
select this option if the patient will be transferred/readmitted soon. If
the list is full, the oldest patient data will be removed and the new
patient data will be added.
Specify Discharge and Remove Data if you want to discard the
patient’s data (the patient’s name will not be available on the
Transfer List).
Specify Discharge for Transport if this is an M3 or IntelliVue
Patient Monitor and you are moving the patient to a new location
with either the monitor or measurement server. See “Discharging for
Transport” on page 2-21 for information on using this option.
4
When the central prompts you whether you are sure you want to
discharge this patient, click the OK button. The central discharges
this patient with the option you selected in Step 3 and returns you to
the Patient Window.
Note—If you have flexible monitoring and want to use a telemetry transmitter in
a different bed, you must clear the sector after discharging the patient. If you
don’t, the transmitter will not be available for any other bed. You clear the
sector by using the Clear Sector page in Sector Setup -- see “Clearing
(Unassigning) a Sector” on page 2-34.
If a patient has been admitted, you must discharge the patient in order to clear
the sector.
2-20
Patient Management
Discharging for Transport
Discharging for Transport
Overview
For those times when you want to transport the patient and use the monitor at the
new location a discharge option, Discharge for Transport, is available. The
Discharge for Transport option is for patients being monitored by an M3 or
IntelliVue Patient Monitor operating via a wired connection to the IntelliVue
Clinical Network. The Discharge for Transport option discharges the patient on
the Information Center and stores the patient data but does not discharge the
patient from the bedside monitor. When you monitor the patient in a different
location and reconnect the monitor to the network the bed will automatically be
admitted on the Information Center at the new location.
Note—The Discharge for Transport option is not available for transporting
patients to units connected to other database servers across a Large Network
Central Database System.
Task
Summary
To transport a patient using the Discharge to Transport perform the following
steps:
Step
Action
1
Prepare the patient for transport.
2
From the Patient Window click the Discharge button. The
Discharge window displays.
3
From the Discharge window click the Discharge for Transport
button. The Information Center moves the patient data to the transfer
list and the message “No patient admitted” displays in the bed’s
sector.
Note—Alternatively, the Transfer key on the M3 or IntelliVue
Patient Monitor can be selected.
4
Disconnect the monitor from wall power and the network. If you
transporting an IntelliVue Patient Monitor patient with a
Measurement Server disconnect the Measurement Server from the
monitor.
Patient Management
2-21
Discharging for Transport
Step
2-22
Action
5
If you have flexible monitoring, clear the sector by using the Sector
Setup window. See page 2-34 for information on clearing a sector.
6
Move the patient with the monitor or Measurement Server to the
new location.
7
If you have flexible monitoring, at the new location assign the bed
label and monitor label by using Sector Setup window. See page
2-27 for information on assigning equipment.
8
Reconnect to wall power and the network at the new location. For
patients with a Measurement Server, reconnect the Measurement
Server to the new monitor. The Information Center retrieves the
patient information from the monitor and re-admits the patient to the
new bed.
Patient Management
Transferring Patient Data to a New Bed
Transferring Patient Data to a New Bed
Overview
The Information Center allows you to transfer a patient to another bed without
losing patient data. Transferring data involves two steps; discharging the patient
from the current bed using the Discharge Window; then re-admitting the patient
to the new bed using the Transfer List in the Admit Window.
The sector for the destination bed must have equipment associated with it
(bedside monitor or a transmitter).
Note—If the central is connected via Philips CareNet, the new bed must be on
the same central. If the central is connected via the IntelliVue Clinical Network,
the new bed can be on any central on the IntelliVue Clinical Network or if the
central is connected via the Large Network Central Database System the new
bed can be on any central connected to the large network. A large network is a
option where multiple database servers can be interconnected on the hospital
network. This connectivity provides clinicians with the ability to transfer
patients across care units that are on separate database servers. A patient can be
transferred to any bed that does not have a patient admitted. However, both the
bed and the equipment must be assigned to the sector to which you are
transferring a patient. If no bed and/or equipment is assigned you must first
assign the bed and/or equipment using the Sector Setup Window then transfer
the patient. See “Assigning a Bed and/or Equipment to a Sector” on page 2-27.
Task
Summary
Transfer data for a patient by performing the following steps:
Step
Action
1
On the Patient Window click the Discharge button.
2
If you are transferring the patient to a unit over a Large Network
Central Database System, select the unit to which to transfer the
data by clicking on the unit name in the Transfer Destination list.
Patient Management
2-23
Transferring Patient Data to a New Bed
Step
3
Action
On the Discharge Window specify that you want to save the patient
data associated with this patient after discharge by clicking on the
Save Data with Discharge button.
This ensures that patient data is retained and remains intact when the
patient is moved to the new bed. The data that is saved includes:
• Patient’s name and ID.
• Alarm history (50 or 150 alarms).
• Events and trends (and ST data for telemetry beds) going back
24/48 hours and full disclosure waves going back 1/24/48
hours. The amount of data that can be retrieved depends on
when the re-admission is done. For example, if a patient is readmitted 10 hours after discharge (and your system has 24
hour trend storage), 14 hours of trends are available on readmission.
Note—For bedside monitors other than the M3 or IntelliVue Patient
Monitor, you still have to discharge the patient at the bedside
monitor to clear the bedside database and reset bedside alarm limits.
4
When the central prompts you whether you are sure you want to
discharge this patient click the OK button. The central discharges
this patient and returns you to the Patient Window.
Note—If you have flexible monitoring and want to use this
equipment for a different bed, you must clear the sector after
discharging the patient. If you don’t, the equipment will not be
available for any other bed. You clear the sector by using the Clear
Sector page in Sector Setup -- see “Clearing (Unassigning) a Sector”
on page 2-34.
5
2-24
Patient Management
On the Patient Window click the Admit Patient button.
Transferring Patient Data to a New Bed
Step
6
Action
On the Admit Window, click on the patient’s name in the Transfer
List.
Note—The names that are displayed when you first enter the Admit
Window are the names of patients that were discharged from this
central. To see the names for all centrals in your care unit, click on
your unit name. To see names for centrals in another unit, click on
that unit name.
7
Click the Admit Patient button. The transfer is now complete.
Note—You cannot modify any of the patient data until after you
click the Admit Patient button. Change the patient information, if
needed, and click Update.
Important—When a patient is admitted from the Transfer List, the
Paced status is not retrieved -- it is set to NO for all monitoring
devices. If the patient is paced, change it after you click the Admit
Patient button.
Note—When transferring patients across a Large Network Central Database
System you can check the status of the transfer in the Transfer Status window.
Access the Transfer Status window by clicking the Transfer Status button on
the All Controls window.
Patient Management
2-25
Fixed and Flexible Monitoring
Fixed and Flexible Monitoring
The functions available to manage the beds on the Main Screen and the
equipment for those beds depend on whether the central is configured for fixed
or flexible monitoring.
Changes are made through the Sector Setup Window. You can access the Sector
Setup Window via the task bar button on the Patient Window or Patient
Management applications, or via All Controls.
Fixed
Monitoring
Fixed monitoring is typically configured for units where the number of beds
equals the number of sectors on the Main Display. The equipment assigned to a
sector cannot be changed.
With fixed monitoring you can temporarily view other beds in the Patient
Window. (See “Viewing a Bed Temporarily” on page 1-28 for instructions.)
In addition, if a sector is configured as an overview (blank) sector at installation,
you can display any bed on the network. If the cursor is placed in an empty
sector, the Sector Setup button is displayed. Clicking this button brings up the
Overview Bed page, where you can select the bed.
Flexible
Monitoring
With flexible monitoring, bed and equipment changes are possible. An example
of a unit with flexible monitoring is the unit that has both bedside monitors and
telemetry beds. Units may need to change patients back and forth between
bedside monitoring and telemetry. Flexible monitoring allows you to make the
appropriate equipment changes. Another example of a unit with flexible
monitoring is the telemetry unit that has more beds than sectors on the Main
Screen. Flexible monitoring allows the unit to make bed label changes as
needed. For example, transmitters can be assigned to different beds as necessary.
If your system is configured for flexible monitoring, you can transition between
SDN based equipment (for example, telemetry) and IntelliVue Clinical
Network-connected wired and wireless bedsides on the same Information
Center.
As with fixed monitoring, if your central is connected to other centrals, you can
use patient sectors to display overview/consulting beds for patients monitored by
those centrals.
Note—All wireless M3 bedside monitors will automatically be configured for
flexible monitoring.
2-26
Patient Management
Assigning a Bed and/or Equipment to a Sector
Assigning a Bed and/or Equipment to a Sector
Overview
If your system is configured for flexible monitoring, the Information Center
allows you to assign a bed and/or equipment to an empty sector.
For centrals connected via the IntelliVue Clinical Network: you use the Assign
Bed/ Equipment page to change the bed and/or equipment that is being
monitored in the sector.
For centrals connected via Philips CareNet: you use the Assign Bed/Equipment
page not only to change the bed and/or equipment that is being monitored in the
sector, but also to assign a sector to be a consulting bed. This enables you to
view real-time patient data for a bed that is being monitored by a primary
central. Information on assigning consulting beds can be found in “Chapter 1.
Introduction to the Information Center” on page 1-1.
You assign a bed and/or equipment for a sector by using the Sector Setup
Window.
If the sector is empty
When the cursor is placed in the sector, one button appears in the sector, Sector
Setup. Clicking on this brings you directly to the Assign Bed/Equipment page
of the Sector Setup Window.
If there is a bed and equipment assigned
You must first use the Clear Sector page of the Sector Setup Window to clear
the sector. See “Clearing (Unassigning) a Sector” on page 2-34. Then, you use
the Assign Bed/Equipment page to assign the bed.
Note—You can use Assign Bed/Equipment to move a telemetry-monitored
patient to another bed and preserve all settings (including alarm limits) as well
as the patient's history. If this central is connected via Philips CareNet, the new
bed must be on a central that is connected to the same CareNet switch. If this
central is connected via the IntelliVue Clinical Network, the new bed can be on
any central that is connected to the IntelliVue Clinical Network. You can do this
whether or not the patient has been admitted.
You can access the Sector Setup Window via the task bar button on the Patient
Window or Patient Management applications, or via All Controls
Patient Management
2-27
Assigning a Bed and/or Equipment to a Sector
Task
Summary
Assign a bed/equipment to a sector by performing the following steps:
Step
Action
1
On the Patient Window for the appropriate sector, click on the
Sector Setup button.
2
On the Sector Setup Window select the Assign Bed/Equipment page
by clicking on the Assign Bed/Equipment tab.
Note—If you have flexible monitoring, this page displays
automatically when you select Sector Setup for sectors that currently
do not have a bed and/or equipment assigned to them.
3
Select the bed you want to assign to the sector by clicking on a bed
name from the list.
Note—The only beds that appear in the list are beds not currently
displayed. Some beds may not be from your unit. Be sure to select
the correct bed label. If the equipment moves between multiple
Information Centers, for example an M3 monitor, the equipment
will need to be cleared from the other Information Center before you
can assign it.
4
Select the equipment you want to assign to the sector by clicking the
appropriate equipment from the list.
5
Once the necessary selections are made and verified, click the OK
button. The Information Center assigns the bed/equipment to the
sector. Once you have assigned equipment to the sector, you can
admit a patient to that bed. See “Admitting a Patient” on page 2-3.
Note—Clicking the Cancel button cancels your changes and returns
you to the Assign Bed/Equipment page.
2-28
Patient Management
Changing Equipment for a Sector
Changing Equipment for a Sector
Overview
The equipment assigned to the bed can be a bedside monitor or telemetry
transmitter. If your system is configured for flexible monitoring, you can change
the equipment that is currently assigned to a bed. You change the equipment
assigned by using the Change Equipment page in the Sector Setup Window.
Note—You can identify the transmitter label that is currently assigned to a bed
by placing your cursor over the bed label in the sector. When you place your
cursor over the bed label a pop-up box indicates the transmitter label.
Patient
Settings
When you change the equipment assigned to a bed a short gap occurs in the
wave data for the patient and the following occurs to patient settings:
•
Transmitter to transmitter
All patient settings remain the same as before the equipment change.
If using Philips transmitters, the items controlled by the Wave Viewer or
TeleMon depend on how the transmitter is set up. For example, the SpO2
sample rate will be the one configured for the transmitter you are
changing to.
•
Bedside monitors (other than M3/IntelliVue Patient Monitors)
to telemetry
All existing arrhythmia settings remain the same. Settings that were not
previously being monitored (for example, SpO2 and ST) default to the
unit settings.
•
Telemetry to bedside monitor other than M3/IntelliVue Patient
Monitor
All existing arrhythmia settings remain the same. However, the local
bedside settings for all other parameters, including high and low HR alarm
limits, go into effect. In addition, if telemetry ST segment monitoring was
enabled, it is turned off (ST monitoring can be enabled at the bedside, if it
is available).
Patient Management
2-29
Changing Equipment for a Sector
•
Bedside/Telemetry to M3/IntelliVue Patient Monitor
All parameter settings will be those in the M3/IntelliVue Patient Monitor.
If there are discrepancies in patient demographics, patient category or
paced status a
icon will display in the upper right-hand corner of the
patient sector to indicate that a conflict exists. You will need to go to the
Admit Window and resolve the conflict. See “Resolving Conflicts with
M3 or IntelliVue Patient Monitors” on page 2-9.
Note—Differences in the height, weight, date of birth, or gender fields at
the Information Center and these fields at the IntelliVue Patient Monitor
will not cause a conflict to occur. If there are differences between the
height, weight, date of birth, or gender fields, then the IntelliVue Patient
Monitor value is always used.
•
M3/IntelliVue Patient Monitor to M3/IntelliVue Patient Monitor
All parameter settings will be those in the new bedside monitor. If there
are discrepancies in patient demographics, patient category or paced status
a
icon will display in the upper right-hand corner of the patient sector
to indicate that a conflict exists. You will need to go to the Admit
Window and resolve the conflict. See “Resolving Conflicts with M3 or
IntelliVue Patient Monitors” on page 2-9.
Note—Differences in the height, weight, date of birth, or gender fields at
the Information Center and these fields at the IntelliVue Patient Monitor
will not cause a conflict to occur. If there are differences between the
height, weight, date of birth, or gender fields, then the IntelliVue Patient
Monitor value is always used.
2-30
•
M3 bedside monitor to telemetry
All parameter settings will be those in the Information Center.
•
IntelliVue Patient Monitor to telemetry
All existing arrhythmia settings remain the same, except the settings for
Multilead, Singlelead, or Arrhythmia off. The Multilead, Singlelead, or
Arrhythmia Off settings reflect the setting of the transmitter when it was
last used. Settings that were not previously monitored (for example, SpO2
and ST) default to unit settings.
Patient Management
Changing Equipment for a Sector
Task
Summary
Change equipment assigned to a sector by performing the following steps:
Step
Action
1
On the Patient Window for the appropriate sector, click on the
Sector Setup button.
2
On the Sector Setup Window select the Change Equipment page by
clicking on the Change Equipment tab.
Note—If you have flexible monitoring, this page displays
automatically when you select Sector Setup for sectors that currently
have a bed and equipment assigned to them.
3
On the Change Equipment page select the new equipment you want
to assign to this sector by clicking on the Bedside Monitor or the
transmitter label on the new equipment list.
Note—Only transmitters that are unassigned to a bed are in the
equipment list. If the transmitter you will be using to monitor a
patient is not on the list, check that it is not assigned to a bed (put
the cursor over the bed label to see the transmitter number). If the
transmitter is assigned to a bed, use the Clear Sector tab to clear
the sector. The transmitter will then be available for assignment to
the new bed.
If the equipment moves between multiple Information Centers, for
example an M3 monitor, the equipment will need to be cleared from
the other Information Center before you can assign it.
4
Verify that the bed and equipment you have selected are correct,
then click the OK button. The bed and/or equipment will be
changed for the sector. If the Bedside Monitor you selected is an M3
or IntelliVue Patient Monitor proceed to Step 5.
Note—Clicking the Cancel button cancels your changes and returns
you to the Change Equipment page.
5
If the Bedside Monitor is an M3 or IntelliVue Patient Monitor verify
that the patient information/settings in the Admit Window are
correct. Resolve any conflicts if necessary. See “Resolving Conflicts
with M3 or IntelliVue Patient Monitors” on page 2-9.
Patient Management
2-31
Assigning an Overview Bed to a Sector
Note—If using Overview while equipment change is taking place, the data from
these beds may momentarily not be available.
Assigning an Overview Bed to a Sector
Overview
If your central is connected to the IntelliVue Clinical Network, you can assign
an overview bed to a sector. An overview bed is a bed that is currently being
monitored by another connected Information Center (the primary central).
You assign an overview bed to a sector by using the Overview Bed page in the
Sector Setup Window. Sectors that have no bed label assigned contain a Sector
Setup button from which you can directly access the Sector Setup Window.
Fixed
monitoring
You can overview a bed in a sector if a sector is configured as an overview
(blank) sector at installation. If the sector already has an overview bed, you must
clear the sector before assigning another overview bed. See “Clearing
(Unassigning) a Sector” on page 2-34.
Flexible
Monitoring
You can assign an overview bed to a sector for:
Overview
Bed
Controls
The controls available when viewing an overview bed depend upon how your
system is configured and whether you have Read-Only or Full Control access.
Read-Only access means you can view the patient data but cannot make any
changes. Full Control access means you can view the patient data and make
changes. For more information, see “Types of Access” on page 1-29.
2-32
•
•
Patient Management
Sectors that currently do not have bed/equipment assigned.
Sectors that display a bed label but do not have equipment assigned.
Assigning an Overview Bed to a Sector
Task
Summary
To assign a sector to a bed currently being monitored by another connected
central perform the following steps:
Step
Action
1
On the Patient Window for the appropriate sector, click on the
Sector Setup button.
2
On the Sector Setup Window select the Overview Bed page by
clicking on the Overview Bed tab.
Note—If fixed monitoring, the Overview Bed page is automatically
displayed for a blank sector.
3
Select the unit you want, then the bed you want to overview by
clicking a bed name from the list.
4
Click the OK button. The Information Center assigns an overview
bed to the sector.
Note—Clicking the Cancel button cancels your changes and returns
you to the Overview Bed page.
Patient Management
2-33
Clearing (Unassigning) a Sector
Clearing (Unassigning) a Sector
Fixed
Monitoring
If your system is configured for fixed monitoring, you must clear the current
overview bed before assigning another overview bed to that sector.
Flexible
Monitoring
If your system is configured for flexible monitoring, you use Clear Sector to
remove the bed/equipment that is currently displayed in a sector.
Note—If a patient is admitted to the bed, you must first discharge the patient
before clearing the sector. See “Discharging a Patient” on page 2-18.
When the sector is empty, you can:
– Assign a new bed/equipment to monitor a bed.
or
– Overview a bed being monitored by another connected Information
Center.
Important—For M3/M4 or IntelliVue Patient Monitors, when you clear the
sector the bed will no longer be available for Overview at other bedsides. See
your user documentation for information on using Overview at the M3/M4 or
IntelliVue Patient Monitor.
You clear a sector by using the Clear Sector page in the Sector Setup Window.
Task
Summary
Clear a sector by performing the following steps:
Step
1
2-34
Patient Management
Action
On the Patient Window for the appropriate sector, click on the
Sector Setup button.
Clearing (Unassigning) a Sector
Step
Action
2
On the Sector Setup Window select the Clear Sector page by
clicking on the Clear Sector tab.
3
On the confirmation box that displays click the OK button. The
Information Center clears the bed/equipment assignment from this
sector and returns you to the Main Screen.
Warning
Clearing a sector can stop monitoring for a bed. Therefore, be
sure to check that the sector you will clear is no longer
monitoring a patient.
Note—Clicking the Cancel button resets the sector assignment to
its initial condition.
Patient Management
2-35
Clearing (Unassigning) a Sector
2-36
Patient Management
This chapter describes the Information Center recordings and reports. It includes
the following sections:
•
•
•
•
•
•
•
•
•
•
•
•
•
•
•
•
Introduction. . . . . . . . . . . . . . . . . . . . . . . . . . . . . . . . . . . . . . . . . . . . . . 3-2
Making a Delayed Recording . . . . . . . . . . . . . . . . . . . . . . . . . . . . . . . . 3-5
Saving a Strip from the Patient Sector . . . . . . . . . . . . . . . . . . . . . . . . . 3-8
Making Real-Time Recordings. . . . . . . . . . . . . . . . . . . . . . . . . . . . . . . 3-9
Controls and Indicators on the Philips 2-Channel Recorder Module . 3-11
Controls and Indicators on the M3160A 4-Channel Recorder . . . . . . 3-12
Recording Priority. . . . . . . . . . . . . . . . . . . . . . . . . . . . . . . . . . . . . . . . 3-13
Recording Status Messages . . . . . . . . . . . . . . . . . . . . . . . . . . . . . . . . 3-14
Annotation . . . . . . . . . . . . . . . . . . . . . . . . . . . . . . . . . . . . . . . . . . . . . 3-16
Loading Paper into the 2-Channel Recorder. . . . . . . . . . . . . . . . . . . . 3-17
Loading Paper into the 4-Channel Recorder. . . . . . . . . . . . . . . . . . . . 3-20
Philips 2-Channel Recorder Connections . . . . . . . . . . . . . . . . . . . . . . 3-22
M3160A 4-Channel Recorder Connections . . . . . . . . . . . . . . . . . . . . 3-23
Ordering Information for Supplies for Recorders. . . . . . . . . . . . . . . . 3-23
Printing Reports . . . . . . . . . . . . . . . . . . . . . . . . . . . . . . . . . . . . . . . . . 3-24
Cleaning the Philips 2-Channel Recorder Printhead . . . . . . . . . . . . . 3-25
Recordings and Reports
3-1
Introduction
3
Recordings and Reports
Introduction
Introduction
The intended use of the Philips Recorder is to provide hardcopy of text,
graphics, and wave data for the Information Center.
You can initiate recordings and reports (if a printer is available) from the
Information Center or from the bedside. See page 3-24 for bedside monitors
from which printing requests cannot be made.
You can make recordings on the Philips 2-Channel Recorder or the M3160A 4Channel Recorder if the 4-Channel Recorder is available on your system. The
Philips 2-Channel Recorder consists of the M1116B strip chart recorder module
housed in a rack. The Philips Recorder rack can contain up to three recorder
modules. Recordings can be automatically generated by alarm events or you can
manually request them. Delayed recordings contain the primary and secondary
waves selected at the bedside, or, for telemetry, on the Patient Window. Delayed
recordings, for bedsides other than the Intellivue Patient Monitors, are always
made on the Philips 2-Channel Recorder. IntelliVue Patient Monitors can make
delayed recordings on the Philips 2-Channel Recorder or the M3160A 4Channel Recorder if the 4-Channel Recorder is available on your system. Real
time recordings can be made on the Philips 2-Channel Recorder or the M3160A
4-Channel Recorder if the 4-Channel Recorder. The clinician selects the waves
for real-time recordings. Continuous recordings can have overlapping waves.
The 2- channel recorder speed is configured at 6.25mm/s, 25 mm/s, or 50 mm/s.
The 4-channel recorder speed is configured at 12.5mm/s, 25 mm/s, or 50 mm/s,
The central can be configured so that clicking in the patient sector has the
following action:
•
•
•
initiates a delayed recording (not available on 4-channel recorders).
saves a strip in Alarm Review and Event Review.
both initiates a delayed recording and saves a strip.
The Philips Recorders are not intended for home use.
Rx only.
3-2
Recordings and Reports
Introduction
Types of
Recordings
The following types of recordings can be made at the central.
Description
Alarm
An alarm recording is a timed non-continuous
recording that is generated automatically (if
configured) when an alarm occurs. The
recording shows waves both before and after the
alarm was announced. Alarm recordings can be
made continuous from the recorder and can be
extended from M3 bedside monitors. Alarm
recordings are made on the 2-Channel Recorder.
Delayed
A delayed recording is a timed non-continuous
recording that shows waves both before and after
it is initiated. Delayed recordings can be made
continuous from the recorder, and can be
extended from M3 bedside monitors. Delayed
recordings are made on the Philips 2-Channel
Recorder.
Real-time
A real-time recording is a continuous recording
that shows waves that occur after you request the
recording. Real-time recordings must be
manually stopped. Real-time recordings can be
directed to the Philips 2-Channel Recorder or the
M3160A 4-Channel Recorder if the 4-Channel
Recorder is available on your system.
Procedure
A procedure recording is a timed recording made
from the bedside (for example, cardiac output).
Recordings and Reports
3-3
Reports
Recording
Introduction
Alarm
Recordings
You can turn off the recording of specific alarms in the Record/Store Window.
See “Chapter 4. Alarm Management and Setup”.
The waves that are recorded are based on the waves
•
•
Primary wave (usually ECG)
Wave corresponding to the alarming parameter. If only the primary wave
is available, a 40-mm single-channel recording is generated.
Note—In order for an alarm recording generated from the M3 or the IntelliVue
Patient Monitor to be made at the central, the recording must be configured On
at both the bedside and the central (in the Record/Store Alarm Window).
Arrhythmia Alarm Recordings
If an arrhythmia alarm recording is running for a patient and other arrhythmia
alarms occur for the same patient (with the same waves), the recording will be
extended to include the superseding alarms.
3-4
Recordings and Reports
Making a Delayed Recording
Making a Delayed Recording
Overview
A delayed recording is a non-continuous, timed recording that shows waves
prior to your record request along with a few seconds of waveforms after your
request. You can make a delayed recording for one patient or for all patients.
Delayed recordings contain the primary and secondary waves selected at the
bedside, or, for telemetry, on the Patient Window. Delayed recordings always
print on the Philips 2-Channel Recorder.
Note—
– For EASI CMS and V24 bedsides, if your system is configured for
second ECG the secondary wave will always be the second channel
of ECG regardless of the secondary wave selected at the CMS or
V24 bedside.
– For M3 bedside monitors, waves for delayed recordings are not
selectable. The pre-set waves for recording are: ECG CH-1 and
Invasive Pressure-1. If Invasive Pressure-1 is not available, the
following waves are substituted (by the following pre-set priority):
Invasive Pressure-2, CO2, ECG CH-2, ECG CH-3, Pleth, Resp.
Delayed recordings can be initiated from the central, or from the bedside. For
telemetry patients, a Nurse Call recording can be initiated when the Patient
Button on the telemetry transmitter is pressed (if configured and turned on).
The length of the recording and the waves are pre-set for your unit. Factory
defaults are 10 seconds pre-event and 2 seconds post-event. In the example
below the arrow indicates when the recording was requested.
Recordings and Reports
3-5
Reports
– For IntelliVue Patient Monitors, the waves that are recorded are
those that are configured for recording at the IntelliVue Patient
Monitor. For IntelliVue Patient Monitors, when selecting waves for
recording only select waves that are available to you at the
Information Center and are visually present in the patient window. If
you select waves that are not available at the Information Center, the
Information Center will substitute the primary ECG and the highest
priority bedside wave on the recording. See your IntelliVue Patient
Monitor user documentation for details.
Making a Delayed Recording
10 seconds PRE-EVENT + 2 seconds POST-EVENT = 12 seconds TOTAL RECORDING
Note—The actual length of a delayed recording may be longer that the pre-set
length to allow for all of the annotations to be printed. In timed recordings, since
the number of seconds of pre-event and post-event wave(s) are pre-set for your
unit, if the event is longer than this amount of time, you will not capture the
entire event. Use Wave Review to see the entire event. See “Wave Review” on
page 6-31.
Task
Summary
When you request a delayed recording the Philips Information Center begins
recording the waves for the sector(s) you selected and stops automatically.
If your system is set up to produce a delayed recording, the label on the button in
the patient sector that appears when the cursor is in the sector will be Record or
Record and Save. You request a delayed recording by performing the following
step:
Step
1
Action
Click on the button (or anywhere in the sector except the Patient
Window button).
3-6
Recordings and Reports
Making a Delayed Recording
Action of
Patient
Sector
Button
Depending on how your system is configured, clicking a button in the patient
sector initiates a delayed recording or the saving of a strip. The action of the
button is shown by the button label.
The labels are:
•
Record -- this generates a paper recording of the primary and secondary
•
Save -- this generates a 30-second strip saved in Alarm Review and Event
•
Record and Save -- this generates both a paper recording and a strip in
waves.
Review.
Alarm Review and Event Review.
Note—Strips can be viewed in Alarm Review if “ALL ALARMS” or “USER-
SAVED STRIPS” is selected. Strips can be viewed in Event Review if “USERSAVED STRIPS” is displayed.
The number of user-saved strips is limited (10 if your Alarm Review has a 50record capacity, or 30 if your Alarm Review has a 150-record capacity). If the
maximum number of strips is reached, when a new strip is saved, the oldest
saved strip is automatically deleted.
You can make an alarm or delayed recording continuous while the recording is
printing by pressing the RUN/CONT key on the recorder module. To terminate a
recording, press the STOP key on the recorder module.
Extending a
Delayed
Recording
at the M3
Monitor
You can extend a delayed recording requested from the bedside by pressing the
Delayed Recording button on the M3 monitor. This causes the recording to run,
then be extended by a pre-set number of seconds. That is, if the recording is preset to run for 12 seconds, the recording will be extended an additional 12
seconds. The recording will be extended for each time the button is pressed.
If the recording was queued (e.g., because the recorder was busy or out of
paper), it cannot be made continuous.
If the recording was queued (for example, because the recorder was busy or out
of paper), it cannot be extended.
Recordings and Reports
3-7
Reports
Making an
Alarm/
Delayed
Recording
Continuous
Saving a Strip from the Patient Sector
Making a
Delayed
Recording
for All Beds
Regardless of whether or not your system is set up to allow delayed recordings
initiated from the patient sector, you can make a delayed recording for all beds
that are displayed. You request a delayed recording for all sectors by performing
the following steps:
Step
Action
1
Get to the All Controls Window for any sector.
2
Click the Record All button in the title bar. The central will initiate
a delayed recording for all sectors that currently have patient data.
Note—Sectors without beds or equipment assigned will not have a
recording printed.
Saving a Strip from the Patient Sector
Overview
Your system can be configured to allow you to click a button in the patient
sector to quickly capture 30 seconds of waveforms that are saved in the
database. You can view these saved strips in either Alarm Review or Event
Review. The strip contains 20 seconds of wave before the button was clicked,
and 10 seconds after.
Task
Summary
If your system is set up to allow saving of strips, the label on the button in the
patient sector that appears when the cursor is in the sector will be Save or
Record and Save. To save a strip, click on the button (or anywhere in the sector
except the Patient Window button).
Selecting the
Waves that are
Saved
The waves that are saved can be selected on a per patient basis in the Stored
Waves Window, Alarm Waves tab. See “Changing the Waves that are Stored”
on page 6-50.
3-8
Recordings and Reports
Making Real-Time Recordings
Making Real-Time Recordings
Overview
A real-time recording is a continuous recording that shows waves that occur
after you request the recording. You select the waves to record and have to
manually stop real-time recordings.
Task
Summary
Make a real-time recording by performing the following steps:
Step
Action
In the Patient Window click on the Continuous Recording
button. The Philips Information Center displays a pop-up box.
2
If a 4-channel recorder is available in your unit, specify whether this
recording is going to the 2-channel or 4-channel recorder by
clicking on the appropriate radio button in the Recorder Type
field. Clicking the 4 Channel button directs the recording to the 4channel recorder. Clicking the 2 Channel button directs the
recording to the 2-channel recorder.
3
Select the waves to record by selecting the waves from the Wave
Settings drop-down list.
Note—You can make wave one an arrhythmia wave by clicking on
the Beat Labels box.
Reports
1
Note—For IntelliVue Patient Monitors, when selecting waves for
recording only select waves that are available to you at the
Information Center. Selecting waves that are monitored but not
displayed in the Patient Window would result in blank sectors
appearing in the recording.
Recordings and Reports
3-9
Making Real-Time Recordings
Step
3-10
Action
4
Specify whether to overlap the waves or not by clicking on the
Overlap box.
With the 2-channel recorder:
• No overlap -- no waves overlapped. The size of the grid is 40
mm for one wave, 20 mm for two waves.
• Overlap -- overlap two waves in one 40 mm sector.
With the 4-channel recorder:
• No overlap -- no waves overlapped. The size of each grid is
100/(number waves selected).
• Overlap -- produces a recording of Wave 1 (50 mm) above
Wave 2-4 (50 mm).
5
Click the Record button. The recording begins and continues until
you click the Stop button in the Continuous Recording box or press
Stop on the recorder module.
Recordings and Reports
Controls and Indicators on the Philips 2-Channel Recorder Module
Controls and Indicators on the Philips 2-Channel Recorder
Module
Reports
A. Continuous light
Lights if the currently printing
recording is continuous.
B. RUN/CONT (continue) key
Makes a currently printing recording
continuous (if possible).
C. STOP key
Stops the currently printing recording.
Recordings and Reports
3-11
Controls and Indicators on the M3160A 4-Channel Recorder
Controls and Indicators on the M3160A 4-Channel Recorder
A
C
D
E
F
B
3-12
A. Power
Light illuminates when power is on.
B. Out of Paper
Illuminates when the paper has not been
properly set or when there is no paper.
C. On Line
Illuminates when the recorder is ready
to accept data. The light flickers on and
off during normal operation.
D. Error
Illuminates to indicate that an error
occurred during data transmission or
there is a problem with the recorder.
E. Stop
Press this button to stop the currently
recording.
F. Feed
Pressing this button causes the printer to
eject paper for as long as the button is
depressed.
Recordings and Reports
Recording Priority
Recording Priority
If all recorder modules are busy or inoperable, recording requests are queued
(stacked). Recordings then print when a recorder module becomes available.
The table below provides the priority (from highest to lowest) and the number of
requests per patient that can be in the queue.
Priority
Real-time
One request per patient is queued. If other
recordings are printing when you request a realtime recording the Philips Information Center
processes the request as follows:
• If a real-time recording is running, a new
real-time request for a different patient is
queued. If the new request is for the same
patient, the new request is not accepted.
• If a timed recording is running, the real-time
request is queued. When the current
recording finishes printing, the real-time
recording starts. The waves will be from the
time the recording starts printing, and not
from the time of the request.
Alarm
Five alarms per patient are queued. New alarm
requests replace the oldest request. If alarms are
older than 1 hour, only 1 alarm is queued.
Delayed
One request per patient is queued. New delayed
requests for the patient replace the pending
request.
Procedure
Ten strips per patient are queued.
If there is no recorder available for 12 hours due to a recorder failure, the
recorder door being left open, or the recorder out of paper, then all recordings in
the queue are deleted. In addition, all recordings in the queue are deleted if
monitoring mode is exited (for example, if the system is rebooted).
Recordings and Reports
3-13
Reports
Recording Requested
Recording Status Messages
Recording Status Messages
Main Screen
Messages
The messages in the table below appear in the status message line at the top of
the Main Screen.
Note—The “X” indicates the position of the 2-channel recorder module in the
rack, for example, Left, Center, Right.
Message
Meaning
X recorder out of paper
No recording can be made on this recorder
module until you replace the paper.
X recorder door is open
No recording can be made on this recorder
module until you close the recorder module
door.
No recorder connected
No recorder module is plugged into the
recorder rack.
X recorder hardware fault
The recorder module is inoperable. Contact
service.
Recorder Rack or Power
There is a fault in the recorder rack or the rack
Supply Fault or No Recorder power supply. Contact service if the message
persists.
4 Channel Recorder Not
Ready
Indicates that either the 4-channel recorder is
out of paper, has no power, the serial recorder
cable is not connected or the recorder had
some internal failure causing it to be offline.
Note—There is a LED on the front of the
recorder that illuminates when there is no
paper in the recorder.
The device name is also indicated in the message (for example “CCU1 Left
recorder door is open”).
3-14
Recordings and Reports
Recording Status Messages
Recorder
Messages at
the M3
Monitor
The messages in the table below appear at the M3 monitor when recordings are
generated.
Recording
Type
Meaning
Alarm
No Alarm Recording
Available
No recorders configured on the
central are functioning; no
recorders are configured on the
central.
Delayed
Delayed Recording
Accepted
Delayed recording request
successfully received at the
central.
Delayed Recording
Running
Delayed recording request is
active.
Delayed Recording
Extended
Delayed recording successfully
extended.
Delayed
Recording Stopped
Delayed recording stopped.
Continuous
Continuous Recording
Running
Continuous (Realtime) recording
request is active.
Recording Stopped
Realtime recording was manually
stopped.
Recordings and Reports
3-15
Reports
Message
Annotation
Annotation
The recording annotation for delayed, real-time, and alarm recordings includes
the following information:
•
•
•
•
•
•
•
•
•
•
•
Patient name (as entered in the Admit Window)
Patient Medical Record number (as entered in the Admit Window)
Bed label
Date and time (time of the first wave data on the recording)
Current alarm text (for alarm recordings only)
If the alarms are suspended, the text “Alarms Suspended”
INOP text (if available)
Patient parameters (associated with the date and time of the recording -subset for alarm recordings)
Rhythm (if available)
Recorder speed
Bandwidth (for ECG waves suitable for ST measurements)
The recording annotation for recordings made from Alarm Review (for both
alarm strips and saved strips) includes the following information:
•
•
•
•
•
•
Patient name (as entered in the Admit Window)
Patient Medical Record number (as entered in the Admit Window)
Bed label
Date and time (time of the first wave data on the recording)
Alarm text specific to the alarm (for alarm strips only)
Recorder speed
Note—Procedure recordings generate their own annotation.
Timed, delayed recordings continue until all of the annotation is complete.
ReAnnotation
3-16
Real-time and delayed recordings that are continued are re-annotated every
50 mm with a subset of the annotation information.
Recordings and Reports
Loading Paper into the 2-Channel Recorder
Loading Paper into the 2-Channel Recorder
A message appears at the top of the screen when the recorder is out of paper.
Task
Summary
To load paper into the recorder perform the following steps:
Step
Action
Insert a new roll with paper feeding from the top. Hold paper lead
then push on the roll until it clicks into place.
2
Tear paper at a 45 degree angle.
Reports
1
Recordings and Reports
3-17
Loading Paper into the 2-Channel Recorder
Step
3-18
Action
3
Feed paper under roller, using left edge of paper as a guide.
4
Pull paper out and close door.
Recordings and Reports
Loading Paper into the 2-Channel Recorder
Testing
You can test to see if the recorder paper is loaded correctly by clicking the
Record button in any Patient Sector that has waves. If no printing appears on the
strip, the paper is loaded backwards. Remove the roll and reload.
Task
Summary
To remove roll:
Step
Action
1
Tear off the paper.
2
Open the recorder door.
3
Pinch the paper at the shelf below the roller, and pull the paper off
the roller.
4
Gently push the excess paper back onto the paper roll to loosen.
5
With the paper rolled loosely, pinch several thicknesses and pull roll
out.
Reports
Recordings and Reports
3-19
Loading Paper into the 4-Channel Recorder
Loading Paper into the 4-Channel Recorder
To load paper into the 4-channel recorder perform the following steps:
Step
3-20
Action
1
Lift the clear plastic cover on the top of the recorder.
2
Remove the old spool from the recorder by pushing up and out on
the two plastic tabs that hold the spool in place.
Recordings and Reports
Loading Paper into the 4-Channel Recorder
Step
Action
Place the new spool in the recorder by pushing down and in on the
two plastic tabs. Be sure that the paper feeds from the top of the roll.
4
Trim the end of the paper to make a clean edge.
5
Insert the paper near the feed slot. The recorder automatically takes
up the paper.
6
Close the plastic cover on the top of the recorder.
Reports
3
Recordings and Reports
3-21
Philips 2-Channel Recorder Connections
Philips 2-Channel Recorder Connections
The following diagram displays the 2-channel recorder connections.
Recorder Rack
To Workstation
To Recorder
Recorder
Module
Power Module
Note—To remove a recorder module press on the two tabs on the bottom of the
module and pull the module out.
3-22
Recordings and Reports
M3160A 4-Channel Recorder Connections
M3160A 4-Channel Recorder Connections
The following diagram displays the 4-channel recorder connections.
4-Channel Recorder
To Serial B Port
Interface Cable to PC
Workstation
To UPS
AC Output
24V Power Supply
Reports
Ordering Information for Supplies for Recorders
Paper
Paper for the 2-Channel Recorder Module
Part Number 40477A
Recorder paper -- 20 rolls
Part Number 40477B
Recorder paper -- 80 rolls
Paper for the 4-Channel Recorder
Part Number PSE 11268
Recorder paper -- 24 rolls
Cleaning Kit
Cleaning Kit for 2-Channel Recorder Module
Part Number M1116-80201
Cleaning Kit for Printhead
Recordings and Reports
3-23
Printing Reports
Printing Reports
If a central printer is connected, you can initiate reports from the Philips
Information Center or from a bedside monitor, with the exception of the wireless
M3 or the Compact Configurable Monitor.
Note—Reports requested from a wired/wireless M3 bedside monitor can be
printed via the IR link on a printer located at the bedside.
See Chapter 6, “Patient Data Review” for a description of the reports that you
can initiate from the Philips Information Center. For operating information on
printers, please see the documentation that was shipped with your printer.
Printer
Status
Message
The message “Printer needs attention” appears in the status message line at the
top of the Main Screen when any of the following occur:
•
•
•
•
•
•
•
•
Printer is out of paper
Printer has a paper jam
Printer memory is full
Printer is not turned on
Printer cable is not connected
Printer has a software or hardware failure
Connectivity to a LAN-connected printer has failed
NT print spool is full
In all cases you should check the status display on the printer and fix the
problem or notify service.
Printer
Messages at
the M3
Monitor
3-24
The messages in the table below appear at the M3 monitor when a report is
requested at the bedside.
Message
Meaning
Printing
The report request was successfully received at
the central.
Printer Not Available
The configured printer is not currently
available due to a network failure or printer
failure.
Recordings and Reports
Cleaning the Philips 2-Channel Recorder Printhead
Cleaning the Philips 2-Channel Recorder Printhead
If you run recordings at low speed (1 or 2cm/min) for extended periods, deposits
of paper debris may collect on the print head making recordings unevenly fainter
in horizontal stripes.
Step
Action
Remove the recorder.
2
Open the recorder door and un-thread the paper from behind the
rubber roller.
3
Tear off or roll up the excess paper into the roll chamber to get it out
of your way.
4
Thread the cloth cleaning strip instead of paper around the rubber
roller until approximately two inches of the leader come out from
the top of the roller.
5
Close the recorder door, aligning both ends of the strip over the top
of the door.
Reports
1
Recordings and Reports
3-25
Cleaning the Philips 2-Channel Recorder Printhead
Step
3-26
Action
6
Holding the top end of the cleaning strip between your thumb and
forefinger. Pull the strip through and out of the recorder.
7
Open the door and ensure that the paper cavity is dust-free. Rethread the paper and replace the recorder.
Recordings and Reports
Introduction
4
Alarm Management and Setup
This chapter describes the alarms detected by the Information Center. It includes
the following sections:
•
•
•
•
•
•
•
•
•
•
•
•
•
Overview. . . . . . . . . . . . . . . . . . . . . . . . . . . . . . . . . . . . . . . . . . . . . . . . 4-2
Alarm Indicators . . . . . . . . . . . . . . . . . . . . . . . . . . . . . . . . . . . . . . . . . . 4-3
Alarm Levels and Priorities . . . . . . . . . . . . . . . . . . . . . . . . . . . . . . . . . 4-4
Active Alarm Sound . . . . . . . . . . . . . . . . . . . . . . . . . . . . . . . . . . . . . . . 4-6
Alarm Messages . . . . . . . . . . . . . . . . . . . . . . . . . . . . . . . . . . . . . . . . . . 4-7
Alarm Adjustments . . . . . . . . . . . . . . . . . . . . . . . . . . . . . . . . . . . . . . . 4-13
Timeout Periods . . . . . . . . . . . . . . . . . . . . . . . . . . . . . . . . . . . . . . . . . 4-23
Alarm Chaining. . . . . . . . . . . . . . . . . . . . . . . . . . . . . . . . . . . . . . . . . . 4-24
Silencing Alarms. . . . . . . . . . . . . . . . . . . . . . . . . . . . . . . . . . . . . . . . . 4-28
Suspending/Unsuspending Alarms . . . . . . . . . . . . . . . . . . . . . . . . . . . 4-32
Telemetry Smart Limits . . . . . . . . . . . . . . . . . . . . . . . . . . . . . . . . . . . 4-33
Adjusting the Alarm Tone Volume . . . . . . . . . . . . . . . . . . . . . . . . . . 4-35
Recording/Storing Alarms . . . . . . . . . . . . . . . . . . . . . . . . . . . . . . . . . 4-36
and Setup
Alarm Management and Setup
4-1
Overview
Overview
The Information Center annunciates all alarm conditions that it detects as well as
those detected by bedside monitors. Control of alarm limits and alarm on/off
status depends on the device where the alarm event is detected.
The Information Center detects the following alarms:
•
•
Arrhythmia alarms for both bedside monitors (other than M3 monitors)
and telemetry.
ST segment alarms for telemetry.
The Information Center detects arrhythmia alarm conditions by comparing ECG
data against a set of pre-defined rules/criteria for the condition. An alarm
condition can be in the form of a rate exceeding a threshold (for example, HR
>xx), an abnormal rhythm (for example, Ventricular Bigeminy), or an ectopic
event (for example, Pair PVCs).
You can adjust the thresholds for arrhythmia alarm conditions through the
Arrhythmia Alarms Window (for monitoring devices other than M3 monitors).
See “Adjusting Alarms” on page 4-13 for information on adjustments available
in the Arrhythmia Alarms Window. You can adjust the thresholds for ST alarms
through the ST Alarms Window. See the Telemetry System Instructions for Use.
Note—Except for telemetry EASI ECG, arrhythmia analysis can be set to off
either for an individual patient or for all patients (under unit settings). In this
case, no arrhythmia alarms are generated by the central. (Asystole and V-Fib
alarms from the bedside/telemetry cardiotach are active.) See “Arrhythmia
Analysis Off” on page 4-21 for more information. Also, no arrhythmia alarms
are generated if alarms are suspended, if ECG alarms are turned off, or if the HR
alarm source is set to Pulse.
M3 Monitors
4-2
If the patient is monitored by a M3 monitor, arrhythmia monitoring is done at
the bedside monitor. All alarms (including arrhythmia alarms) are announced at
the central; all alarm settings are controlled at the monitor. See the M3 User’s
Guide for information.
Alarm Management and Setup
Alarm Indicators
IntelliVue
Patient
Monitors
If the patient is monitored by a IntelliVue Patient Monitor, arrhythmia
monitoring is provided by the bedside monitor. All alarms (including arrhythmia
alarms) are announced at the central. Controls for arrhythmia analysis and alarm
limits are adjustable and viewable at both the Information Center and the
IntelliVue Patient Monitor. See your IntelliVue Patient Monitor user
documentation for information on arrhythmia monitoring and the IntelliVue
Patient Monitors.
Alarm Indicators
The Information Center indicates alarm conditions by using the following
signals:
•
The patient sector turns blue (except for soft INOPs, see page 4-5).
•
An alarm message displays in the patient sector and in the Patient
Window.
– For rate alarm conditions, the message indicates what parameter is in
alarm, the maximum or minimum value, and the alarm limit that was
violated (for example, HR 134>120)
– For event alarm conditions, the message indicates the event that
caused the alarm (for example, Asystole).
•
An alarm tone sounds that is indicative of the alarm type (except for soft
INOPs, see page 4-5).
Note—There is no sound for soft INOPs.
Alarm Management and Setup
4-3
and Setup
All active alarms for bedside monitors are annunciated at both the bedside and at
the Information Center. All alarms for telemetry-monitored beds are only
annunciated at the Information Center.
Alarm Levels and Priorities
Alarm Levels and Priorities
There are three different levels of alarm conditions:
•
•
•
Red
Yellow
Inoperative (INOP).
The Information Center indicates the level of the alarm by:
•
The alarm sound.
Note—Depending on how your system is setup the alarm sounds can be
configured for either Traditional/CareNET or IEC/ISO standard alarm
sounds. See the table below.
•
•
Number of asterisks (*) in the alarm message
The color of the message
The table below lists the levels of alarms in order of their priority.
Alarm Level
Sound
Message
Meaning
Red (***)
Traditional/
CareNet Sound:
Continuous highpitch rapid tone
IEC/ISO Sound:
Repeated bursts of
five rapid highpitch beeps
*** next to the alarm
message
Life threatening, for
example, ASYSTOLE
Yellow (**)
(long yellow)
Traditional/
CareNet Sound:
Continuous
medium- pitch
tone
IEC/ISO Sound:
Repeated bursts of
three rapid lowpitch beeps
** next to the alarm
message
Non-arrhythmia alarm limit
violation.
Note—This does not apply to
HR, which is an arrhythmia
alarm
4-4
Alarm Management and Setup
Alarm Levels and Priorities
Sound
Message
Meaning
Yellow (**)
Arrhythmia
(short yellow)
Traditional/
CareNet Sound:
Noncontinuous
medium-pitch
tone sound (for
several seconds)
IEC/ISO Sound:
Two rapid lowpitch beeps
** next to the alarm
message
Arrhythmia yellow alarm
detected
Yellow (**)
Nurse Call
(Telemetry)
(short yellow)
Traditional/
CareNet Sound:
Noncontinuous
medium-pitch
tone sound (for
several seconds)
IEC/ISO Sound:
Two rapid lowpitch beeps
** next to the alarm
message
The patient button on the
telemetry transmitter has
been pressed (and the system
is configured to alarm and
the patient button is on).
Hard INOP
(inoperative
condition)
Traditional/
CareNet Sound:
Continuous slow
low-pitch tone
IEC/ISO Sound:
Repeated bursts of
two slow lowpitch beeps
no asterisks appear next to
the message
Inoperative condition that
prevents monitoring, for
example, LEADS OFF or
which has a direct effect on
the patient, for example,
NBP CUFF OVERPRESS.
Soft INOP
(inoperative
condition)
none
no asterisks appear next to
the message
Inoperative condition which
prevents the system from
processing signals properly,
for example, NOISY ECG.
Monitoring usually
continues during this INOP
condition.
Alarm Management and Setup
4-5
and Setup
Alarm Level
Active Alarm Sound
Active Alarm Sound
There can be only one alarm sound annunciating at the central monitor at one
time.
4-6
•
If there is an unacknowledged red level alarm in the presence of any other
level alarm the sound for the red alarm will annunciate.
•
If there is no unacknowledged red level alarm condition and there is an
unacknowledged long yellow alarm in the presence of any other yellow or
INOP alarm (acknowledged or unacknowledged) the sound for the long
yellow will annunciate.
•
If there is no unacknowledged red level alarm or long yellow level alarm
condition and there is an arrhythmia or nurse call event, the short yellow
(**) alarm sound will annunciate.
•
If there are no unacknowledged red or long/short yellow alarm conditions
and there is any bed with an unacknowledged hard INOP condition the
sound for the hard INOP annunciates.
Alarm Management and Setup
Alarm Messages
Alarm Messages
There are two alarm condition message areas in the patient sector and the Patient
Window: one area for red and yellow level alarm messages, and the other for
INOPs. If you place the cursor over the alarm condition message, a pull-down
list displays the message with the time of the alarm/INOP condition.
If there is more than one alarm/INOP condition present, there will be an arrow to
the right of the message. In this case, placing the cursor over the alarm/INOP
condition message displays a pull-down list with up to 10 active alarm condition
messages (with times indicated), the oldest alarm condition appearing first. If
there are 10 alarm conditions and a new alarm condition occurs, the oldest alarm
condition is removed from the list and the new alarm condition is added to the
bottom of the list.
Note—For IntelliVue Patient Monitors, the highest priority alarm is always
shown in the alarm conditions message area. Up to 10 current alarms conditions
are shown in the pull-down list. If more than 10 alarms are active, then some
will not be shown in the list. A review of all active bedside alarms is available at
the bedside. See your bedside documentation.
If there are concurrent red and yellow alarm conditions, the red alarm condition
message displays first, and the yellow alarm condition message(s) are available
in the pull-down list.
Cardiac alarms have the highest priority.
•
If there is a red alarm condition, and a new red alarm occurs, the new
alarm message replaces the old.
•
If there is a yellow alarm condition, and a new yellow alarm condition
occurs, the new alarm condition message replaces the old.
•
If there is an INOP condition, and a new INOP condition occurs, the new
INOP condition message replaces the old.
Alarm Management and Setup
4-7
and Setup
•
Alarm Messages
•
If there is a yellow arrhythmia alarm condition, the message displays for 3
minutes unless silenced regardless of whether the alarm condition persists
or not. If silenced and the alarm condition is no longer active, the message
goes away immediately. If the alarm condition is still active the message
remains until the alarm condition clears, whether silenced or not. See page
4-28 for information on yellow alarm behavior and silencing alarms.
Warning
If alarm annunciation is silenced and alarm reminders are configured off,
the alarm condition message will persist but there will be no audible alarm
annunciation.
The table on the following page lists the arrhythmia alarm condition messages.
For a list of ST alarm condition messages (for telemetry monitored patients) see
the Philips Telemetry System Instructions for Use.
Arrhythmia
Alarm
Messages
The following table lists the Arrhythmia alarm conditions and the description of
the criteria required to generate these alarms. In the table below, yyy = patient’s
rate and xxx = limit that was exceeded. The messages that display depend on
whether you have basic or enhanced arrhythmia. See “Levels of Arrhythmia
Analysis” on page 5-3.
Red-level alarm conditions are announced by continuous chiming. Yellow-level
alarm conditions are announced by a tone that sounds for several seconds (to
distinguish them from non-arrhythmia alarm conditions that have a continuous
tone.)
4-8
Message
Level
Description
*** ASYSTOLE
Red
No QRS detected for x seconds. Choices of >
2.5 to 4 seconds a
Note: M3/M4 - No QRS detected for 4
consecutive seconds
*** V-FIB/TACH
Red
Fibrillatory wave (sinusoidal wave
between 2-10 Hz) for 4 consecutive
seconds
Alarm Management and Setup
Alarm Messages
Level
Description
*** V-TACH
Red
Consecutive PVCs >/= V-Tach Run limit
and
HR > V-Tach HR limit
*** TACHY yyy > xxx
Red
Heart Rate (yyy) greater than the
Extreme Tachy limit (xxx)
*** BRADY yyy < xxx
Red
Heart Rate (yyy) less than the Extreme
Brady limit (xxx)
** NON-SUSTAIN VT
Yellow
A run of Vs having a ventricular HR>VTach HR limit, but lasting for less than
the V-Tach Run limit
** VENT RHYTHM
Yellow
A dominant rhythm of adjacent Vs > vent
rhythm limit and ventricular HR<V-Tach
HR limit
** RUN PVCs
Yellow
Run of PVCs greater than 2
** PAIR PVCs
Yellow
Two consecutive PVCs between nonPVCs
** PAUSE
Yellow
No QRS detected for x seconds. Choices
of >1.5 to 2.5 seconds.a
Note—M3/M4- No beat detected for 1.75
x average R-R interval for HR <120, or
no beat for 1 second with HR >120 (nonpaced patient only)
** PACER NOT CAPT
Yellow
No QRS for 1.75 x the average R-R
interval with Pace Pulse (paced patient
only)
** PACER NOT PACE
Yellow
No QRS and Pace Pulse for 1.75 x the
average R-R interval (paced patient only)
** MISSED BEAT
Yellow
No beat detected for 1.75 x average R-R
interval for HR <120, or no beat for 1
second with HR >120 (non-paced patient
only)
Note: M3/M4-this alarm is not available
Alarm Management and Setup
4-9
and Setup
Message
Alarm Messages
Message
Level
Description
** SVT
Yellow
Run of SVPBs >/= SVT Run limit and
with SVT Heart Rate greater than the
SVT HR limit
** R-ON-T PVCs
Yellow
For HR <100, a PVC with R-R interval
<1/3 the average interval followed by a
compensatory pause of 1.25 x average RR interval or 2 such Vs without a
compensatory pause occurring within 5
minutes of each other. (When HR >100,
1/3 R-R interval is too short for
detection.)
** VENT BIGEMINY
Yellow
A dominant rhythm of N, V, N, V
(N=supraventricular beat, V=ventricular
beat)
** VENT TRIGEMINY
Yellow
A dominant rhythm of N, N, V, N, N, V
(N=supraventricular beat, V=ventricular
beat)
** PVCs > xxx/MIN
Yellow
PVCs within one minute exceeded the
PVCs /min limit (xxx)
** MULTIFORM PVCs Yellow
The occurrence of two differently shaped
Vs, each occurring at least twice within
the last 300 beats as well as each
occurring at least once within the last 60
beats
** HR yyy > xxx
Yellow
Heart Rate (yyy) greater than the upper
HR limit (xxx)
** HR yyy < xxx
Yellow
Heart Rate (yyy) lower than the lower
HR limit (xxx)
** IRREGULAR HR
Yellow
Consistently irregular rhythm (irregular
R-R intervals)
a. With a pause/asystole event lasting > 2.5 secs and when the time interval for Asystole is set to 2.5
secs and when the Pause interval is set to 2.5 secs, the system will annunciate for asystole.
4-10
Alarm Management and Setup
Alarm Messages
Arrhythmia
INOP
Messages
The following table lists the Arrhythmia INOP messages and the description of
the criteria required to generate these alarms, along with the action to take.
Message
Level
Description
Action to Take
ALL ARRH
ALRMS OFF
Soft INOP
(no sound)
All of the arrhythmia
alarms are turned off
because one of the
following:
a. Alarms are suspended.
b. HR alarm is turned off at
the bedside
c. HR alarm source at the
bedside is switched to
Pulse
d. “All Arrhythmia Alarms
Off” in the Arrhythmia
Alarms Window is
checked for a telemetry
bed
Depending on the cause:
a. Unsuspend alarms
b. Turn HR alarm on at
bedside
c. Switch HR/Pulse alarm
source to HR at bedside
d. Click “All Arrhythmia
Alarms Off” to remove
the check in the
Arrhythmia Alarms
Window of telemetry
bed
CANNOT
ANALYZE
ECG
Hard INOP
(can be
changed to
Soft INOP
on a per
patient
basis)
The Arrhythmia algorithm
cannot reliably analyze the
ECG data on any
monitored leads.
Note—If a LEADS OFF
condition exists, the
LEADS OFF message has
a higher priority than
CANNOT ANALYZE
ECG and will be displayed
first in the INOP message
area. You can view all
current INOP messages in
the pulldown list.
Improve lead position;
reduce patient motion
If EASI ECG from a
bedside monitor, check that
the ECG module is
M1001B or M1002B.
and Setup
Alarm Management and Setup
4-11
Alarm Messages
Message
Level
ARRHYTHMIA Soft INOP
(no sound)
OFF
(not displayed at
the bedside)
SOME ECG
ALRMS OFF
(can be
configured to be
disabled in Unit
Settings)
Soft INOP
(no sound)
ARRHYTHMIA Hard INOP
REQUIRED
(telemetry only)
4-12
Alarm Management and Setup
Description
Action to Take
Arrhythmia analysis (and
ST, if telemetry) is turned
off -- the bedside/telemetry
cardiotach is used.
You can turn arrhythmia
analysis back on in the
Arrhythmia Alarms
Window -- Analysis
control.
One or more ** level
Arrhythmia alarms have
been manually turned off
Use the Arrhythmia Alarms
Window to review current
status of all alarms
An EASI transmitter is
being used, and arrhythmia
analysis has been turned off
at the central.
Turn arrhythmia analysis
on in the Arrhythmia
Alarms Window -Analysis control
Alarm Adjustments
Alarm Adjustments
Overview
All alarm conditions generated by the Information Center come with unit default
settings (limits and on/off status) that are configured for a unit (see Chapter 9,
“Information Center Configuration”). In addition, you can make adjustments to
alarm settings to accommodate the clinical condition of the individual patient.
Note—Alarm conditions generated at a bedside monitor are controlled only at
that monitor. For M3 monitors, all alarm settings (including arrhythmia) are
controlled at the bedside monitor.
Adjusting
Alarms
Feature
The adjustments to alarm settings that you can make from the Information
Center depend on the point-of-care equipment being used. The table on the next
page summarizes the arrhythmia and ST alarm controls.
M3 bedside
monitors
Arrhythmia • Provided by
Monitoring
bedside
monitor
• Single-lead or
Arrhythmia
Off
• Basic or
enhanced
capability,
depending on
model and
configuration
IntelliVue
Patient
Monitors
Other bedside
monitors
Telemetry
Telemetry with
EASI
transmitters
• Provided by
• Provided by
• Provided by
• Provided by
central
central
central
the bedside
• Multilead or
• Multilead,
• Multilead,
monitor
Single-lead
Single-lead, or Single-lead, or
• Multilead,
Arrhythmia/ST (cannot be
Arrhythmia
Single-lead,
turned off for
Off
or Arrhythmia Off
EASI ECG)
• Basic or
• Basic or
Off
• Basic or
enhanced
enhanced
• Basic or
enhanced
capability
capability
enhanced
capability
capability
and Setup
Alarm Management and Setup
4-13
Alarm Adjustments
Feature
M3 bedside
monitors
Arrhythmia • At bedside
Controls
only
• Relearn
available at
central
Arrhythmia
Analysis
Window
4-14
IntelliVue
Patient
Monitors
Other bedside
monitors
Telemetry
Telemetry with
EASI
transmitters
• At bedside or • At bedside or • At central only • At central
only
central, except
central
for the
However, the
Compact
following
Configurable
controls are not
Monitor
available for an
IntelliVue
Patient
Monitor:
• Unit settings
• Sound at
bedside for
ECG yellow
alarms
• Cannot
analyze ECG
(sound)
Note—You
must enable
remote controls
at the bedside
for them to be
available to use
at the
Information
Center. See
your IntelliVue
Patient Monitor
documentation
for information
on enabling
remote
controls.
Alarm Management and Setup
Alarm Adjustments
Feature
M3 bedside
monitors
IntelliVue
Patient
Monitors
Other bedside
monitors
Telemetry
Telemetry with
EASI
transmitters
STSegment
Monitoring
• Provided by
• Provided by
bedside
bedside
monitor
monitor
• ST analysis is • Waves
done on up to 3 available at
central ST
leads
Review
• Waves
Window
available at
central ST
Review
Window
• Provided by
bedside
monitor
• Limited
functionality
at the central
• Waves
available at
central ST
Review
Window
• Provided by
central for
adult patients
• ST analysis is
done on up to
6 leads
• Waves
available at
central ST
Review
Window
STSegment
Controls
• At bedside
only
• At bedside
• Limited
functionality
at the central
• At central only • At central
only
• At bedside
only
• Provided by
central
• ST analysis is
done on up to
12 leads
• Waves
available at
central ST
Review
Window
Note—When you discharge a patient from the Information Center, the alarm
limits and on/off settings controlled from the Information Center go back to unit
settings. Please review the User’s Guide for the monitoring device to determine
how to return alarm conditions controlled from the monitor back to unit settings.
Turning
Alarms On/
Off
The On/Off adjustments for arrhythmia alarms that you can make at the central
are:
•
Turn all yellow alarm off/on.
•
Turn all red and yellow arrhythmia alarm off/on (telemetry) unless your
system is configured to not allow this.
•
Turn individual yellow arrhythmia alarm off/on.
all ECG alarms off), but cannot be turned off individually. If the HR
alarm condition is turned off at the bedside monitor, or the alarm
condition source is changed to Pulse, all arrhythmia alarm conditions are
turned off. See page 4-32 for information on suspending/unsuspending
alarms.
Alarm Management and Setup
4-15
and Setup
Note—Red alarms can all be turned off by suspending alarms (or turning
Alarm Adjustments
Task Summary
Make adjustments to arrhythmia alarm conditions on the Arrhythmia Alarms
Window.
Step
1
Action
Access the Arrhythmia Alarms Window by clicking on the Arrhyth
Alarms button in the Patient Window.
2
Make the adjustments on the Arrhythmia Alarms Window. The
table below describes each of the available adjustments.
Adjustment
Description
Unit Settings
Click on this button if you want to return all
alarm settings to the pre-set limits for your unit,
for example, PVC Rate > 10 PVCs/min.
Note—This adjustment is not available for
IntelliVue Patient Monitors.
All Yellow On/All Yellow
Off
Click on these if you want to turn on or off all
yellow ** alarms simultaneously. For example,
the last shift turned off several yellow ** alarm
conditions, but you are not familiar with the
patient’s clinical condition and you want all
alarms turned on. Rather than turning each
individual alarm on, you can use this function to
accomplish your goal in one step.
Note—You can still turn on/off individual alarm
after clicking the All Yellow On/All Yellow Off
button.
4-16
Alarm Management and Setup
Alarm Adjustments
Adjustment
Description
Patient Paced
If the patient has a cardiac pacemaker (including
demand, fixed, or any type), there should be a
check in the Patient Paced box, indicating that
pace pulse detection is On.
Warning—If the patient is paced, pace pulse
detection must be On, enabling the ST/AR
algorithm to detect and reject pace pulses
(spikes) from the HR count. Otherwise, pace
pulses could be detected as beats and the
monitor may not alarm for an asystole
condition.
Note—If the Patient Paced status is on, the word
“Paced” displays in the lower right corner of the
sector and on the Patient Window. The word
“Paced” is not displayed on consulting beds for
centrals connected via Philips CareNet.
Analysis
Use this control to specify the type of arrhythmia
analysis (and ST analysis, if telemetry) used by
the system.
Multilead
The system uses the primary and secondary
leads for arrhythmia analysis. This produces
optimal arrhythmia detection.
Bedside Monitors: Select the primary and
secondary leads at the bedside.
Telemetry: Select the primary and secondary
leads on the Patient Window.
The system uses only the primary lead. You may
want to choose this type of analysis when it is
difficult to provide more than one optimized
ECG lead. Make sure that this optimized lead
occupies the first ECG channel when you have
more than 1 ECG lead displayed.
Alarm Management and Setup
4-17
and Setup
Singlelead
Alarm Adjustments
Adjustment
Description
Analysis (continued)
Arrhythmia Off
Select Arrhythmia Off to turn arrhythmia
analysis off for bedside-monitored patients or
Arrhythmia/ST Off to turn arrhythmia analysis
and ST off for telemetry-monitored patients.
Consider doing this if:
• arrhythmia monitoring is not appropriate for
the patient, or
• you are not getting a reliable HR because the
signal is below a minimum amplitude,
unstable, or contains artifact, and you have
tried to improve the system performance by
choosing another lead, changing to Singlelead
Analysis, and changing electrodes.
Note—For patients monitored with telemetry
EASI ECG, selecting ARRHYTHMIA OFF
results in an ARRHYTHMIA REQUIRED
INOP.
If arrhythmia (and ST, for telemetry) analysis is
turned off, the INOP message “ARRHYTHMIA
OFF” appears in the patient sector. The
“ARRHYTHMIA OFF” message is not
displayed at the bedside.
Note—Arrhythmia analysis and arrhythmia/ST
analysis (for telemetry) may be turned off as a
unit setting (for example in a neonatal unit). In
this case, it may be turned on for individual
patients.
See “Arrhythmia Analysis Off” on page 4-21 for
important information about no arrhythmia
analysis.
4-18
Alarm Management and Setup
Alarm Adjustments
Adjustment
Description
All Arrhythmia Alarms Off
Click this button (check in box) to turn all
arrhythmia alarms off. (You still get arrhythmia
events stored, and rhythm status displayed when
arrhythmia alarms are off.) If your system is
configured to not allow the enabling/disabling of
all arrhythmia alarms this field is not available
(greyed-out) for selection.
(telemetry only)
Note—This field is for telemetry monitored
patients only, and is for arrhythmia alarm
conditions only -- the status of ST alarms is not
affected.
All ECG Alarms Off
(telemetry only, when
Analysis is set to
Arrhythmia/ST Off)
Sound at bedside for ECG
yellow alarms
(bedside only)
When arrhythmia monitoring is turned off, the
telemetry cardiotach is used, and the only ECG
alarms are HR, ASYSTOLE, and VFIB. Click
this button (check in box) to turn these alarms
off. If your system is configured to not allow the
enabling/disabling of all ECG alarms this field is
not available (greyed-out) for selection.
This field applies to bedside monitors only.
Setting this to Off inhibits the sound of yellow**
arrhythmia alarm conditions but not the alarm
messages at the bedside monitor. Alarms sounds
and messages will still occur at the Information
Center.
Note—This adjustment is not available for
IntelliVue Patient Monitors.
and Setup
Alarm Management and Setup
4-19
Alarm Adjustments
Adjustment
Description
HR Alarm Limits
Use these fields to set heart rate alarm limits.
You can set the limit based on your assessment
of the patient's clinical condition, unit protocols,
physician orders or medication specified limits
(telemetry and IntelliVue
Patient Monitors)
Or, for telemetry bedsides, you can choose
Smart Limits. Smart Limits automatically set
high and low limits around your patient's current
heart rate. The difference above and below the
patient's HR is pre-set for your unit. See
“Telemetry Smart Limits” on page 4-33 for
additional information on using Smart Limits.
Red Alarms
Use these fields to make adjustments to specific
red alarm limits. In some cases changing a HR
alarm limit will affect other alarm limits. See
“Extreme Bradycardia and Extreme Tachycardia
Alarms” on page 4-22.
Yellow Alarms
Use these fields to make adjustments to specific
yellow alarm limits and to individually turn on/
off yellow alarm conditions.
Note—You cannot turn off or adjust HR limit
alarms at the central for bedside monitors other
than the IntelliVue Patient Monitor.
Cannot Analyze ECG
(sound)
Click on this field if you want the Information
Center to annunciate an INOP sound when the
“Cannot Analyze ECG INOP” occurs. If there is
no check for this field, when this INOP occurs,
there will be a message, but no sound (and the
sector will not turn blue).
Note—This adjustment is not available for
IntelliVue Patient Monitors.
4-20
Alarm Management and Setup
Alarm Adjustments
Arrhythmia
Analysis Off
This section describes the conditions when arrhythmia analysis or, for telemetry,
arrhythmia/ST analysis is turned off.
IMPORTANT: If arrhythmia is turned off, the bedside cardiotach is used. If
arrhythmia/ST is turned off, the telemetry cardiotach is used, and there is no ST
monitoring.
•
•
The only available ECG alarms are: HR limit, Asystole, and VFIB.
There are no telemetry ST alarms.
The following controls on the Arrhythmia Alarms Window are available (others
are greyed out -- for example, alarm limits controls).
•
•
•
The Analysis control is active so that arrhythmia can be turned back on.
For bedsides, no other controls are active -- changing HR limits and
turning HR alarms off must be done at the bedside.
For telemetry, the following controls are active:
– Patient Paced (can also be changed in the Admit Window).
– “All ECG Alarms Off” if enabled in configuration (so that you can
turn off the telemetry HR alarms).
– HR alarm limit controls except Smart Alarms. (HR limits can also be
changed on the Patient Window.)
Note—When arrhythmia is turned off, pace pulse detection is controlled by the
bedside/telemetry cardiotach and is automatically set to ON. If the patient is not
paced, turn pacing detection off at the bedside (this setting will not be reflected
on the Arrhythmia Alarms Window). For telemetry the pacing controls at the
central are active.
If arrhythmia (and ST, for telemetry) analysis is turned off, the INOP message
“ARRHYTHMIA OFF” appears in the patient sector at the central. This
message is not displayed at the bedside.
Alarm Management and Setup
4-21
and Setup
The Arrhythmia Analysis control returns to the unit setting when the patient is
discharged from the central (except M3 beds or when changing equipment from
an IntelliVue Patient Monitor to telemetry), as do the other arrhythmia controls.
Arrhythmia can also be manually turned back on in the Arrhythmia Alarms
Window. You cannot turn central arrhythmia analysis off or on at the bedside.
Alarm Adjustments
Alarm
Adjustment
Effects
In some cases changing an arrhythmia alarm limit at the central will affect other
alarm limits.
Extreme Bradycardia and Extreme Tachycardia Alarms
The difference between the low HR alarm limit and the extreme bradycardia
limit is unit configured. For example, if the low alarm limit is 60 b/min and the
extreme bradycardia limit difference is configured to be 20 b/min, then the
extreme bradycardia limit is 40 b/min. If the difference is configured to be 0,
there will always be an extreme bradycardia alarm when the HR falls below the
HR low limit.
The same is true for the difference between the high HR alarm limit and the
extreme tachycardia limit. In the same way, the extreme tachycardia limit is
determined from the high HR limit.
For safety, the extreme bradycardia and extreme tachycardia limits clamp at a
configured value. For example, the extreme bradycardia limit for neonates has a
default limit clamp at 70 b/min. Thus if the HR low alarm limit is moved to 80
b/min and the extreme bradycardia limit difference is 20 b/min, the extreme
bradycardia limit will be 70 b/min. However, if the clinician moves the HR low
alarm limit to 65, the extreme bradycardia limit will also be 65 and only the
extreme bradycardia alarm will occur if the HR falls below this limit.
See Chapter 9, “Information Center Configuration” for the extreme bradycardia
and extreme tachycardia limit difference defaults, clamps, extreme bradycardia
trigger time, and ranges.
4-22
Alarm Management and Setup
Timeout Periods
Timeout Periods
Overview
Normally, an arrhythmia alarm is annunciated upon the detection of an alarm
condition. However, there are certain situations that can inhibit the audible and
visible indications of the alarm even though the alarm condition was detected.
These situations include:
•
A more serious alarm condition is active.
•
A timeout period is in effect for a higher priority alarm condition in that
chain. See “Alarm Chaining” on page 4-24.
•
A timeout period is in effect for that alarm condition.
Timeout periods and alarm priority chains are explained below.
When a yellow arrhythmia alarm is annunciated, it automatically initiates a
timeout, or inhibitory period. This means that during the timeout the same alarm
condition or another condition lower on the same alarm priority chain will not
annunciate an alarm during the timeout period. If the timeout period is set to 0,
the alarm is immediately reset when the alarm condition is no longer active. The
length of the timeout period is configured for your unit.
When the timeout period has expired, the system is reset, and if the condition
persists, the alarm condition will be annunciated again.
There are two levels of timeout periods:
First level (configured to 0, 1, 2, 3, 4, or 5 minutes) applies to all yellow
ECG alarm conditions that are above Vent Bigeminy on the priority chain
(Non Sustain VT, Vent Rhythm, Run PVCs, Pair PVCs, R-T PVCs, Pacer
Not Capture, Pacer Not Paced, Pause SVT, HR>, HR<). See page 4-26 for
an illustration of the alarm condition priority chain.
•
Second level (configured to 0, 1, 2, 3, 4, 5, 10, or 15 minutes) applies to
Vent Bigeminy and all alarm conditions that are below Vent Bigeminy on
the priority chain (Vent Bigeminy, Vent Trigeminy, PVCs >xx/min,
Multiform PVCs, Irregular HR). See page 4-26 for an illustration of the
alarm condition priority chain.
Alarm Management and Setup
4-23
and Setup
•
Alarm Chaining
If the timeout period is set to 0 and your system is configured for alarm
reminders, the alarm reminder for that level will sound every three minutes
while the alarm condition remains active (if configured). See “Alarm
Reminders” on page 4-30 for information on alarm reminders.
Clearing the
Timeout
Period
The timeout period is cleared if it is ended or a learning phase occurs. See
“Learning” on page 5-17 for information on learning.
Note—A superseding alarm does not clear the timeout period.
Alarm Chaining
Overview
For arrhythmia alarms, the presence of multiple alarm conditions is quite
possible. Announcing all of the detected alarm conditions would be confusing,
and less serious conditions might hide a more serious condition. For this reason,
the alarms are prioritized and put in alarm “chains” so that the most serious or
highest priority alarm condition is announced. The diagram on page 4-26 shows
the alarm priority chains.
Alarm
Groupings
The alarm conditions detected by the ST/AR Arrhythmia system are grouped
into the following categories:
•
•
•
4-24
PVC Alarms (for example, Pairs, Vent Rhythm)
Beat Detection Alarms (for example, Pause, Pacer Not Capt)
Rate Alarms (for example, Extreme Tachy, High/Low HR)
Alarm Management and Setup
Alarm Chaining
Alarm
Announcing
Alarm
Behavior
and Timeout
periods
The Information Center displays and announces:
•
Life threatening (red) alarms are announced first, since they have the
highest priority level.
•
If there are no life threatening red alarm conditions active, the highest
priority yellow alarm in any chain is announced.
•
If alarm conditions in different chains are detected, the alarm condition
that occurred most recently is announced. The exception is Irregular HR,
which only annunciates if no other alarms are annunciating.
During a timeout period for a particular alarm condition the re-occurring alarm
condition or a lower priority alarm condition in the same chain will not
annunciate. However, alarm conditions in another priority chain will still
annunciate. Once a timeout period is completed any active alarm conditions will
annunciate. For example, if there is an active Vent Bigeminy alarm, a PVCs >
xx/min will not become active because it is lower on the same chain. However, a
high HR alarm will become detected because it is on another chain.
Higher priority alarms will supersede the previous alarm condition and the
higher priority alarm condition will annunciate. For example, if a Vent
Trigeminy alarm is active and a Pair PVCs occurs, the Pair alarm will be
annunciated. Only one arrhythmia alarm can be annunciated for a patient at any
one time.
The alarms in each chain are prioritized according to the relative level of
seriousness.
You can view arrhythmia alarm activity in the Patient Data Review applications.
See Chapter 6, “Patient Data Review,” for information on Data Review
applications.
and Setup
Alarm Management and Setup
4-25
Alarm Chaining
Alarm
Priority
Chains
Enhanced Arrhythmia
The diagram below shows the alarm condition priority chains for enhanced
arrhythmia. The alarm conditions in each category are prioritized according to
the level of seriousness (see “Levels of Arrhythmia Analysis” on page 5-3).
(RED ALARMS)
Asystole
V-FIB/TACH
V-Tach
Extreme Tachy
Extreme Brady
(YELLOW ALARMS)
PVC Alarms
Beat Detection Alarms
Rate Alarms
Pause
Non
Sustain VT
SVT
Vent Rhythm
Pacer Not Capture
Pacer Not Pace
Missed Beat
HR>xxx HR<xxx
Run PVCs
Pair PVCs
R-on-T PVCs
First Level timeout period
Vent Bigeminy
Second level timeout period
Vent Trigeminy
PVCs>xx/Min
Chains
Multiform PVCs
Irregular HR
(will occur only if no other
arrhythmia alarm conditions are present)
4-26
Alarm Management and Setup
Alarm Chaining
Basic Arrhythmia
The diagram below shows the alarm condition priorities for basic arrhythmia
and the timeout levels for yellow alarm conditions.
(RED ALARMS)
Asystole
V-FIB/TACH
V-Tach
Extreme Tachy
Extreme Brady
(YELLOW ALARMS)
Beat Detection Alarms
Pacer Not Capture
Pacer Not Pace
HR>xxx HR<xxx
First Level timeout period
Second level timeout period
PVCs>xx/Min
and Setup
Alarm Management and Setup
4-27
Silencing Alarms
Silencing Alarms
Overview
Alarm conditions generated from bedside monitors can be configured to allow or
not allow acknowledgment from the Information Center. Alarms are
acknowledged at the Information Center by using the Silence button (selecting
Suspend can also acknowledge an active alarm see page 4-32). Alarms for
telemetry-monitored patients can only be silenced from the Information Center
or Information Center Client (if configured for Full Control). Silencing an alarm
condition at the Information Center turns off the audible annunciation of an
alarm condition.
Note—For IntelliVue Patient Monitors, if the bedside is configured for audible
non-latching and visual latching alarms and the alarm condition no longer exists
the alarm text will remain at the Information Center but Silence button will not
be available. You must go to the bedside to clear the alarm text for both the
bedside and the Information Center. See your bedside documentation.
Alarm
Behavior
If the alarm annunciation is silenced:
• If the alarm condition is present, the blue background goes away, but the
alarm condition message remains until the condition ends or the timeout
period is over. When the timeout period is over if the condition is present
or re-occurs the alarm is annunciated. There is no additional audible tone,
unless alarm reminders are configured.
• If the alarm condition is no longer present, the alarm indicators are
automatically reset.
Warning
If alarm annunciation is silenced and alarm reminders are configured off,
the alarm condition message will persist until the condition ends but there
will be no audible alarm annunciation.
4-28
Alarm Management and Setup
Silencing Alarms
If the alarm is NOT silenced:
The alarm behavior depends on the type of alarm condition and how your alarm
system is configured. The table below describes the alarm system behavior for
each type of alarm condition.
Type of Alarm
Condition
What happens when alarm condition ends
Red arrhythmia
alarms
Alarm indicators (sound, message, blue highlighting in
sector) remain, whether or not the condition is present
(latching).
Yellow arrhythmia
alarms
Alarm indicators (message, blue highlighting in sector)
are active for a 3-minute period after the alarm is
announced.
• If the alarm condition ends during this period, the
alarm indicators remain until the 3-minutes are over,
then go away.
• If the alarm condition remains after this period, the
indicators remain until the condition clears.
• If the alarm condition ends after this period, the
alarm indicators are automatically reset.
Alarm indicators are automatically reset after the
condition ceases (non-latching).
Telemetry ST and
SpO2 alarms
Alarm indicators are automatically reset (non-latching).
Alarms generated
at the bedside
Alarm indicators (sound, message, blue highlighting in
sector) will be automatically reset (non-latching) or will
remain (latching), depending on how the alarms are
configured at the bedside.
Alarm Management and Setup
4-29
and Setup
INOPS arrhythmia and
telemetry
Silencing Alarms
Alarm
Reminders
Red Alarms
If your Information Center is configured to have alarm reminders, when an
active alarm condition is silenced and the condition persists, the Information
Center repeats the appropriate alarm sound once every three minutes while the
alarm condition remains present.
Only one alarm sound can annunciate at one time. Therefore, if a continuous red
alarm is annunciating for another patient the red alarm reminder will not sound
until the previous alarm sound has cleared. However, if a continuous yellow
alarm is annunciating, the red alarm reminder will annunciate (interrupting the
yellow alarm).
Yellow Alarms
If a yellow arrhythmia alarm is continuous (for example, IRREGULAR HR), an
alarm reminder will sound every 3 minutes as long as the condition exists if:
•
•
Reminders are configured
Timeout is set to 0
Yellow arrhythmia alarm reminders also affect ST alarm indicators. If
configured, after the alarm has been silenced, an alarm reminder will sound
every 3 minutes as long as the condition exists (see page 4-23).
INOPs (telemetry beds only)
If your Information Center is configured to have INOP reminders, the hard
INOP alarm sound for either LEADS OFF or REPLACE BATTERY repeats
once every three minutes while the INOP condition remains active and if there
are no continuous alarm sounds for other patients.
4-30
Alarm Management and Setup
Silencing Alarms
Task
Summary
When there is an annunciating alarm condition, the Record/Save/Record and
Save button in the Patient Sector changes to enable the clinician to silence the
active alarm. The label and action of the button depends on whether or not Fast
Alarm Review is enabled.
Note—Your unit may be configured to not allow silencing of bedside-generated
alarm conditions at the Information Center. In this case, a Silence button would
not appear. If the bedside monitor is M3 or IntelliVue Patient Monitor, both the
monitor and the central must be configured to allow silence of bedside-generated
alarm conditions. Otherwise, the Silence button appears, but is not operative.
Fast Alarm
Review
Disabled
If Fast Alarm Review is not enabled, the button changes to Silence. The
clinician can silence the alarm condition by clicking on the Silence button or by
clicking anywhere in the Patient sector, except the Patient Window button.
Fast Alarm
Review
Enabled
If Fast Alarm Review is enabled, the button changes to Silence/Review.
Clicking the button silences the alarm and opens a Patient Window with the Fast
Alarm Review strip for that alarm. See Chapter 6, “Patient Data Review” for
information on using Fast Alarm Review. If there is an application window open
for any patient, when the Silence/Review button is clicked, the Fast Alarm
Review strip overlays it.
•
•
•
This capability can be enabled for red alarm conditions only, or for red
and yellow alarm conditions.
To silence the alarm condition without displaying it, just click anywhere
in the Patient Sector except the Patient Window button or Silence/
Review button.
If the clinician clicks the Silence/Review button for another alarm
condition, the new one is displayed, and the current one is closed.
Note—If 15 seconds of data that preceded the alarm condition are not available
when an alarm condition is announced, the button label is Silence. Clicking it
Alarm Management and Setup
4-31
and Setup
silences the alarm condition, and no Fast Alarm Review strip is displayed. The
waves for that alarm condition can be viewed in Alarm Review (if the alarm
condition was set up to be stored) or in Wave Review.
Suspending/Unsuspending Alarms
Suspending/Unsuspending Alarms
Telemetry
The Suspend/Unsuspend buttons on the Patient Window allow you to turn all
alarm sounds off/on for telemetry-monitored patients. When you suspend the
alarm sound, a
appears in the patient sector and Patient Window next to all
numerics indicating that all alarm sounds are off for this patient. You also get a
“ALARMS SUSPENDED” message.
The number of minutes that the telemetry alarms remain suspended depends on
the configuration (see the Philips Telemetry System Instructions for Use). If your
unit is configured to suspend alarms for 3 minutes, the alarms automatically turn
back on after the 3 minutes elapses. If your unit is configured to suspend alarms
for an infinite amount of time, you must manually turn the alarms back on.
Note—The alarms suspended status does not change when a patient is
discharged. If alarms are suspended, they remain suspended after the discharge.
Bedside
Monitors
You suspend/unsuspend alarms for bedside monitors at the monitor. When
alarms are suspended, at the central the “ALARMS SUSPENDED” message is
displayed and a
symbol appears next to all parameter numerics.
Note—For M3 bedside monitors, the
symbol only appears next to the
numerics for parameters whose alarms were turned off individually.
TeleMon
4-32
When a telemetry transmitter is docked at TeleMon, you suspend alarms at
TeleMon. Alarms are suspended for three minutes, then turn back on
automatically. When alarms are suspended, at the central the “ALARMS
SUSPENDED” message is displayed and a
symbol appears next to all
parameter numerics.
Alarm Management and Setup
Telemetry Smart Limits
Telemetry Smart Limits
Overview
When setting heart rate or ST alarm limits you can set the limit based on your
assessment of the patient's clinical condition, unit protocols, physician orders or
medication specified limits or you can choose Smart Limits.
Smart Limits are set around the patient’s current numeric values. The amount
above and below the current value (the offset) is configured for the unit and
cannot be adjusted on a per patient basis. You can set Smart high and low limits
for HR and ST only.
When activated, Smart Limits are rounded to the nearest 5 b/min for HR and the
nearest .2 mm for ST.
Automatically
Set Smart
Limits
Smart alarm limits can be configured for the unit to be automatically set when:
•
•
•
When parameter is turned on (ST only).
The telemetry bed is taken out of standby.
At discharge.
Note—At discharge, it is important to first remove the patient from the
transmitter, then discharge the patient from the Information Center. Since
there is no HR coming from the patient on discharge, although Smart
Limits have been activated, no Smart Limits are set. When a new patient
is attached to the transmitter and a HR becomes available, Smart Limits
are set on that HR and ST. If the patient continues to send a HR when you
discharge, Smart Limits will be set on the HR and when a new patient is
admitted the alarms will be based on the previous patient’s values.
When Smart Limits are automatically activated, the unit offset is bound by the
configured unit settings. In this way, Smart Limits will never automatically be
set outside the unit settings.
and Setup
Alarm Management and Setup
4-33
Telemetry Smart Limits
Manually Set
You can manually set Smart Limits from the Arrhythmia Alarms Window or ST
Alarms Window. In this case, Smart Limits are not bound by the unit settings.
However, outside of the unit settings, a tighter offset is used. See Chapter 9,
“Information Center Configuration” for a list of factory default offsets and offset
ranges.
Smart Limits
Examples
Below are examples of how manually set Smart Limits work.
Example of Smart Limits Inside Unit Settings
Unit setting high HR limit = 150
Unit setting low HR limit = 50
Offset inside unit settings = +/- 25
Offset outside unit settings = +/- 10
Current HR = 80
Produces:
High HR limit set to 80 + 25 = 105
Low HR limit set to 80 - 25 = 55
Examples of Smart Limits Outside Unit Settings
Example 1
Unit setting high HR limit = 150
Unit setting low HR limit = 50
Offset inside unit settings = +/- 25
Offset outside unit settings = +/- 10
Current HR = 55
Produces:
High HR limit set to 55 + 25 = 80
Low HR limit set to 55 - 10 = 45
Note—In this example, the current HR less the offset of 25 would fall
outside the unit setting. Therefore, the offset outside the unit setting (10)
is used.
4-34
Alarm Management and Setup
Adjusting the Alarm Tone Volume
Example 2
Unit setting high HR limit = 150
Unit setting low HR limit = 50
Offset inside unit settings = +/- 25
Offset outside unit settings = +/- 10
Current HR = 65
Produces:
High HR limit set to 65 + 25 = 90
Low HR limit set to 65 - 10 = 55 (System uses 50. See note below.)
Note—In this example, the current HR less the outside offset would result
in a low limit of 55. However, the system uses the unit setting of 50, since
this is a wider limit.
Adjusting the Alarm Tone Volume
To adjust the alarm tone volume perform the following steps:
Step
Action
1
On the Patient Window click the All Controls button.
2
On the All Controls Window click the Volume Control button.
3
Place your cursor over the number in the Current Volume box and
use the pop-up arrows to adjust the volume up or down. At the
lowest volume, the tone is still audible.
Note—The alarm tone volume cannot be set to zero.
4
If you want to return the volume back to the default unit setting
click the Set to Default button.
Alarm Management and Setup
4-35
and Setup
To hear the volume you are selecting, click on Test Volume While
Setting. If there is an alarm sounding, the alarm volume will change
accordingly. If there is no alarm sounding, there will be a short
sound to indicate the volume.
Recording/Storing Alarms
Recording/Storing Alarms
Overview
The Record/Store Alarms Window allows you to:
•
•
•
Turn alarm recording on/off for individual patients.
Turn alarm storage on/off for individual patients.
If paging is available on your system, specify the alarms that will generate
an automatic page for a patient. See “Automatic Alarm Paging” on page
8-9.
Turning off recording or storage does not effect audible and visual indicators for
these alarms.
Record determines which recordings start when the alarm is sounded. Store
determines which alarm strips the Information Center stores in memory for
review later in the Alarm Review Window.
Note—You can inhibit the recording of red alarms but not the storage.
Task
Summary
Perform the following steps to turn recording and storage on/off:
Step
1
4-36
Action
On the Patient Window click the All Controls button.
Alarm Management and Setup
Recording/Storing Alarms
Step
Action
2
On the All Controls Window click on the Record/Store button
under Alarm Management and Setup.
3
On the Record/Store Alarms Window specify which alarms to
record or store by clicking on the appropriate check box to the left
of the alarm. A check mark in the box selects the alarm for
recording/storage.
Storage of Red alarms cannot be turned off.
Note—If the central is not the primary monitor, there may be fewer/
more alarms listed on the Record/Store Window than the primary
central can provide. For example, the primary central may be
configured for basic yellow arrhythmia alarms, and your central
may be configured for enhanced alarms. The Arrhythmia Alarms
Window must be reviewed to determine which alarms are available
for this patient.
Note—For All Red Non-Arrhythmia Alarms or All Yellow NonArrhythmia Alarms: if set to Off, no recordings are generated. If set
to On, only the alarms set to be recorded by the bedside will
generate recordings.
Storage of
Arrhythmia
Alarms at
the Central
If there is an arrhythmia alarm, and a superseding arrhythmia alarm occurs
within six seconds of it, the system only stores the latest alarm. For example, if
there is a PAUSE alarm, and in six seconds it is superseded by ASYSTOLE, the
system will only store the ASYSTOLE alarm.
Note—For patients on M3 or IntelliVue Patient Monitors, superseding alarms
are treated as separate alarms. In the example above, two alarms (the PAUSE
alarm and the ASYSTOLE alarm) will be stored.
and Setup
Alarm Management and Setup
4-37
Recording/Storing Alarms
4-38
Alarm Management and Setup
This chapter describes the ST/AR arrhythmia algorithm. It includes the
following sections:
•
•
•
•
•
•
•
•
Introduction. . . . . . . . . . . . . . . . . . . . . . . . . . . . . . . . . . . . . . . . . . . . . . 5-2
Levels of Arrhythmia Analysis. . . . . . . . . . . . . . . . . . . . . . . . . . . . . . . 5-3
How the ST/AR Algorithm Works . . . . . . . . . . . . . . . . . . . . . . . . . . . . 5-5
Paced Patients . . . . . . . . . . . . . . . . . . . . . . . . . . . . . . . . . . . . . . . . . . . 5-14
Learning . . . . . . . . . . . . . . . . . . . . . . . . . . . . . . . . . . . . . . . . . . . . . . . 5-17
Monitoring During Leads Off. . . . . . . . . . . . . . . . . . . . . . . . . . . . . . . 5-19
Status Messages . . . . . . . . . . . . . . . . . . . . . . . . . . . . . . . . . . . . . . . . . 5-20
False Alarms . . . . . . . . . . . . . . . . . . . . . . . . . . . . . . . . . . . . . . . . . . . . 5-24
ST/AR Arrhythmia Monitoring
5-1
Introduction
5
ST/AR Arrhythmia Monitoring
Introduction
Introduction
Overview
The intended use of the ST/AR arrhythmia algorithm is to monitor adult,
pediatric, and neonatal (not telemetry) patients' ECGs for heart rate and
ventricular arrhythmias and produce events/alarms for one or two ECG leads.
The ST/AR arrhythmia algorithm is capable of monitoring both paced and nonpaced patients.
The Information Center provides ST/AR arrhythmia monitoring for patients
that are either on bedside monitors or telemetry that are connected to the
Philips monitoring network. You can use arrhythmia analysis to aid in
assessment of a patient’s condition (for example, heart rate, PVC rate, rhythm,
ectopics) and manage treatment accordingly. In addition to detecting changes
in the ECG, it also offers patient surveillance and alarm generation.
M3 Bedside Monitors
If the patient is monitored by a M3 monitor, arrhythmia monitoring is done at
the bedside monitor. See your M3 user documentation for information specific
to the M3 monitors.
IntelliVue Patient Monitors
If the patient is monitored by a IntelliVue Patient Monitor, ST/AR arrhythmia
algorithm is provided by the IntelliVue Patient Monitor. Controls, however, for
arrhythmia analysis and alarm limits are adjustable and viewable at both the
Information Center and the IntelliVue Patient Monitor. The level of arrhythmia
analysis between the IntelliVue Patient Monitor and the Information Center
may differ. The level of arrhythmia analysis on the monitor (basic or
enhanced) will determine the level of arrhythmia analysis performed for that
patient. See your IntelliVue Patient Monitor user documentation for
information specific to IntelliVue Patient Monitors.
Warning
5-2
During complete heart block or pacemaker failure (to pace or capture), tall
P-waves (greater than 1/5 of the average R-wave height) may be
erroneously counted by the arrhythmia algorithm, resulting in missed
detection of cardiac arrest.
ST/AR Arrhythmia Monitoring
Levels of Arrhythmia Analysis
The number of rhythms being classified, events being detected, and alarms being
called depends on whether your system is configured for basic or enhanced
arrhythmia capability. The sections that follow describes each of these options.
Basic
Arrhythmia
The basic arrhythmia capability configuration provides the basic cardiotach
functions of heart rate and PVC rate, beat annotation, and the detection of the 10
alarms listed below.
•
•
•
•
•
•
•
•
•
•
Asystole
Ventricular Fibrillation
Ventricular Tachycardia
Extreme Tachycardia
Extreme Bradycardia
Pacer Not Capture
Pacer Not Paced
Frequent PVCs (PVC > limit)
High heart rate
Low heart rate
ST/AR Arrhythmia Monitoring
5-3
1 Introduction
Levels of Arrhythmia Analysis
Levels of Arrhythmia Analysis
Enhanced
Arrhythmia
The enhanced arrhythmia capability configuration provides all of the basic
functions, as well as the detection of the 12 additional alarms listed below. In
addition it provides rhythm and ectopic status messages.
Basic Alarms
• Asystole
• Ventricular Fibrillation
• Ventricular Tachycardia
• Extreme Tachycardia
• Extreme Bradycardia
• Pacer Not Capture
• Pacer Not Paced
• Frequent PVCs (PVC > limit)
• High Heart Rate
• Low Heart Rate
Additional Alarms
• Nonsustained V-Tach
• Supraventricular Tach
• Ventricular Rhythm
• Run PVCs
• Pair PVCs
• Pause
• R-on-T PVCs
• Ventricular bigeminy
• Ventricular trigeminy
• Multiform PVCs
• Missed Beat
• Irregular HR
5-4
ST/AR Arrhythmia Monitoring
How the ST/AR Algorithm Works
Overview
ST/AR multi-lead analysis is performed on the user-selected primary and
secondary leads. If only one lead is available for multilead, ST/AR analysis is
performed on the single available lead.
Arrhythmia analysis consists of several steps:
1. The ECG signal is pre-processed to filter out baseline wander, muscle
artifact, and signal irregularities. In addition, if the Patient Paced status =
Yes, pace pulses are detected then rejected from the processing to avoid
seeing them as QRS beats.
2. Beat detection to locate the QRS complexes for further analysis.
3. Feature measurement such as R-wave height, width, and timing.
4. Beats classification. Templates are created and are matched to incoming
beats, and the appropriate beat label is determined.
5. Rhythm and alarm detection. Beat labels are used to produce the values
and events needed to generate rhythms and alarms.
Working in parallel with beat detection and classification, a separate detector
examines continuously for ventricular fibrillation, asystole, and noise.
The quality of the ECG signal is important for accurate arrhythmia analysis. The
section below provides guidelines for optimizing signals for arrhythmia analysis.
ST/AR Arrhythmia Monitoring
5-5
1 Introduction
How the ST/AR Algorithm Works
How the ST/AR Algorithm Works
Ensuring
Accurate
Arrhythmia
Monitoring
For accurate arrhythmia monitoring make sure the ECG waves are optimized for
arrhythmia monitoring by performing the following steps:
Step
1
Action
Once you have selected the optimal lead at the bedside monitor (or at
the Information Center for telemetry), check the arrhythmia alarm
limits by selecting Arrhyth Alarms on the Patient Window and
reviewing the limits in the Arrhythmia Alarms Window.
Note—See page 5-11 for examples of optimized leads.
2
5-6
Verify that the patient paced setting is accurate. (If pacing detection
is on, the word “Paced” should appear in the Patient Window.)
Change if necessary.
ST/AR Arrhythmia Monitoring
How the ST/AR Algorithm Works
Step
Check the arrhythmia beat labels by clicking Arrhythmia Analysis
on the Patient Window. The beat labels indicate how the arrhythmia
system is classifying beats.
N = Normal
V = Ventricular Ectopic
S = Supra-ventricular Premature
P = Paced
' = Pacer spike (If the patient is both atrially and ventricularly paced,
the system will show two’ marks above the waveform aligned with
the atrial and ventricular pacing.)
L = Learning patient's ECG
A = Artifact (noisy episode)
? = Insufficient information to classify beats
I = Inoperative condition (e.g., LEADS OFF)
M = Pause or missed beat
When you click the Arrhythmia Analysis button you get one or two
waves that are delayed by approximately 6 seconds.
In multilead analysis, when you click the Arrhythmia Analysis
button you get up to two waves. The primary lead and the other lead
being used for arrhythmia analysis are both displayed. The primary
wave shows the delayed lead with beat labels. The beat labels
represent analysis of both the primary and secondary waves.
Note—In multilead analysis, the Information Center displays two
waves for locally connected patients. If, however, you are viewing a
patient monitored by another central, the system displays only the
primary wave with beat labels.
ST/AR Arrhythmia Monitoring
5-7
1 Introduction
3
Action
How the ST/AR Algorithm Works
Step
4
Action
If you don't agree with how beats are labeled, you can cause
arrhythmia to relearn the ECG by clicking the Relearn button.
During the learning process beats are labeled with the letter L for the
first valid 15 beats. The beat shape is then learned and a new
template is created. If the beats that are classified as N (normal beat)
look similar to the patient’s ventricular ectopic beats you should
change the lead to one where the normal and ventricular beats look
different (see page 5-11).
Note—Initiate learning only during periods of predominantly normal
rhythm and when the ECG signal is relatively noise-free. See
“Learning” on page 5-17 for additional information the learning
process.
Warning
If you initiate learning during ventricular rhythm the ectopics
may be incorrectly learned as the normal QRS complex. This
may result in missed detection of subsequent events of V-Tach
and V-Fib.
Warning
When using EASI ECG monitoring, Relearn happens
automatically when there is a LEADS OFF INOP condition (see
“Monitoring During Leads Off” on page 5-19). If learning takes
place during ventricular rhythm, the ectopics may be incorrectly
learned as the normal QRS complex. This may result in missed
detection of subsequent events of V-Tach and V-Fib. Be sure to
check the beat labels and initiate a relearn to correct
5-8
5
After relearning is complete, check the delayed arrhythmia wave to
ensure that the algorithm is labeling the beats correctly.
6
If beats are still not classified correctly, check that the ECG is
optimized for arrhythmia monitoring by changing the lead(s) or
moving the electrodes, if needed. See page 5-11 for examples of
optimized ECGs.
ST/AR Arrhythmia Monitoring
How the ST/AR Algorithm Works
Step
For telemetry and bedsides other than the M3 or IntelliVue Patient
Monitor, if changing the lead does not provide accurate analysis of
the beats the minimum threshold for single QRS detection can be
adjusted manually by:
1. Selecting Manual in the QRS Detection box in the bottom of the
Arrhythmia Analysis window.
2. If using Multilead Analysis, choosing whether to use the primary
or secondary lead for QRS detection by selecting the lead from
the Lead drop-down list.
3. Using the up and down arrows to move the horizontal cursor
bars to the desired detection threshold.
Note—When making manual adjustments be sure to place
measurements off the P and T waves capturing the QRS complex.
4. Verifying selections then clicking the Update button to activate
the measurement.
ST/AR Arrhythmia Monitoring
5-9
1 Introduction
7
Action
How the ST/AR Algorithm Works
Step
8
Action
If you want to view all leads that can be obtained from the patient’s
ECG, click the Multilead ECG button on the Patient Window. This
accesses a window showing a few seconds of wave for all available
leads, plus a 10-second rhythm strip.
• If only one lead is sourced then only one lead displays.
• If two leads are being sourced and one of the leads is a chest lead
then the two leads are displayed. If both leads are limb leads then
six leads are displayed.
To:
• View the most recent ECG data -- click Update Waves.
• Change the wave layout click on the wave layout on the top right
side of the window then select wave format (3x4, 6x2, or 12x1)
from the list that displays. In 3x4 layout an additional rhythm
lead displays
• Change the size of the waves place the cursor over the cal bar
and select the size of the wave you want from the list that
displays (x1/2, x1, x2, x4).
• Change the wave speed (25 mm/s or 50 mm/s) by clicking on the
speed on the bottom right of the window and selecting the speed
from the list that displays. When you select a different speed the
window re-displays with the selected speed.
• Print a snapshot of the leads by clicking the Print button on the
top of the window.
Note—If the bedside or telemetry system has EASI 12-lead
capability, click the 12-Lead ECG button. All 12 derived leads will
be displayed, enabling you to determine the optimal leads. For
information on using the 12-Lead ECG Window, see “EASI 12-lead
Review and Report” on page 1-26.
5-10
ST/AR Arrhythmia Monitoring
How the ST/AR Algorithm Works
The graphic below shows an ECG optimized for arrhythmia monitoring a nonpaced patient.
1 Introduction
Example of
Optimized
Non-Paced
ECG
Normal Beat
PVC
Normal QRS:
•
•
Tall (recommended amplitude > 0.5mV), narrow, with R-wave above or
below the baseline (but not biphasic)
T-wave smaller than 1/3 R-wave height; P-wave smaller than 1/5 R-wave
height
Note—In order to comply with the AAMI-EC13 specification, ST/AR internally
removes the gain adjustment before the signal is analyzed for detection and
classification. The detection threshold for the QRS cannot be less than 0.15 mV.
This specification is aimed at preventing the detection of P-waves or baseline
noises as QRS complexes during complete heart block or asystole. This
increasing or decreasing of the gain has no effect on the ECG size for QRS
detection. Therefore, for optimal performance and to prevent false alarms such
as pause or asystole, it is important that leads selected for monitoring are
optimized.
Ectopic beats:
•
•
PVCs wider and different shape from normal beats
PVCs not too tall or too small compared to the normal beat
ST/AR Arrhythmia Monitoring
5-11
How the ST/AR Algorithm Works
Example of
Optimized
Paced ECG
The graphic below shows an ECG optimized for arrhythmia monitoring a paced
patient.
Normal Beat
Pace Pulses/Beats
Normal QRS:
•
•
Tall (recommended amplitude > 0.5mV), narrow, and above or below the
baseline (not biphasic)
T-wave smaller than 1/3 R-wave height; P-wave smaller than 1/5 R-wave
height
Ventricular paced beats:
•
•
•
Aberrantly
conducted
beats
5-12
Paced beat not much larger than the normal QRS, and taller than pace
pulse
Paced beat wider than Normal QRS
Pace pulse large enough to be detected, with no width (no re-polarization)
Since P-waves are not analyzed, it is difficult and sometimes impossible for a
monitoring system to distinguish between an aberrantly conducted
supraventricular beat and a ventricular beat. If the aberrant beat resembles a
ventricular morphology, it is classified as ventricular. You should always select
a lead where the aberrantly conducted beats have an R-wave that is as narrow as
possible to minimize incorrect calls. Any ventricular beats should look different
from these ‘normal beats’. Instead of trying to select two leads with a narrow Rwave, it may be easier to just select one lead and use the single lead arrhythmia
monitoring option. Extra vigilance is required by the clinician for this type of
patient.
ST/AR Arrhythmia Monitoring
How the ST/AR Algorithm Works
Since P-wave morphology is not analyzed, there is no method to discriminate
atrial rhythms. If there is constant variance in the R-R interval, the rhythm is
classified as Irregular.
It is extremely important for accurate analysis of the rhythm to have p-waves
with a amplitude of less than 1/5 the height of the R-wave or < 0.150 mVolts. If
the p-waves are larger than this there is the possibility they can be counted as
QRS complexes.
Intermittent
Bundle Branch
Block
The phenomenon of bundle branch or any of the other fascicular blocks creates a
challenge for the arrhythmia algorithm. If the QRS during the block changes
considerably from the learned normal, the blocked beat may be incorrectly
classified as ventricular, causing false PVC alarms.You should always select a
lead where the Bundle branch block beats have an R-wave that is as narrow as
possible to minimize incorrect calls. Any ventricular beats should look different
from these ‘normal beats’. Instead of trying to select two leads with a narrow Rwave, it may be easier to just select one lead and use the single lead arrhythmia
monitoring option. Extra vigilance is required by the clinician for this type of
patient.
ST/AR Arrhythmia Monitoring
5-13
1 Introduction
Atrial
Fibrillation and
Flutter
Paced Patients
Paced Patients
When monitoring paced patients, it is important to set the pacing status correctly
to enable pace pulse detection. For M3 bedside monitors, you must change the
pacing status at the bedside monitor. For all other point-of-care equipment, you
can change pacing status at the central in either the Admit Window or the
Arrhythmia Alarms Window. When the pacing status is on, the text “Paced”
displays in the lower right corner of the patient sector and the upper left corner
of the Patient Window.
Warnings
for Paced
Patients
Some pace pulses can be difficult to reject. When this happens, the pulses
are counted as a QRS complex, and could result in an incorrect HR and
failure to detect cardiac arrest or some arrhythmias. Keep pacemaker
patients under close observation.
•
During complete heart block or pacemaker failure (to pace or
capture), tall P-waves (greater than 1/5 of the average R-wave height)
may be erroneously counted by the arrhythmia algorithm, resulting
in missed detection of cardiac arrest.
•
When arrhythmia monitoring paced patients who exhibit only
intrinsic rhythm, the monitor may erroneously count pace pulses as
QRS complexes when the algorithm first encounters them, resulting
in missed detection of cardiac arrest.
For patients who exhibit intrinsic rhythm only, the risk of missing
cardiac arrest may be reduced by monitoring these patients with the
low heart rate limit at or slightly above the basic/demand pacemaker
rate. A low heart rate alarm alerts you when the patient begins
pacing. Proper detection and classification of the paced rhythm can
then be determined.
•
5-14
Pacemaker pulses may not be detected when the output of a
defibrillator or telemetry unit is plugged into a bedside monitor. This
may result in the arrhythmia algorithm's failure to detect pacemaker
non-capture or asystole.
ST/AR Arrhythmia Monitoring
Paced Patients
•
When an external pacemaker is being used on a patient, arrhythmia
monitoring is severely compromised due to the high energy level in
the pacer pulse. This may result in the arrhythmia algorithm’s failure
to detect pacemaker noncapture or asystole.
•
Pacemakers can be susceptible to radio frequency (RF) interference
which may temporarily impair their performance.
The output power of telemetry transmitters and other sources of
radio frequency energy, when used in the proximity of a pacemaker,
may be sufficient to interfere with the pacemaker's performance. Due
to the shielding effects of the body, internal pacemakers are
somewhat less vulnerable than external pacemakers. However,
caution should be exercised when monitoring any paced patient.
Consult the pacemaker manufacturer for information on the RF
susceptibility of their products and the use of their products with the
telemetry transmitters.
In order to minimize the possibility of interference, position
electrodes, electrode wires, and transmitter as far away from the
pacemaker as possible.
ST/AR Arrhythmia Monitoring
5-15
1 Introduction
Instruments such as defibrillators or telemetry units produce a
filtered ECG signal. When this signal is used as an input to the
bedside monitor, it is filtered again. If this twice-filtered signal is
passed to the arrhythmia algorithm, it may cause the algorithm to fail
to detect pace pulses thus compromising paced patient monitoring
performance.
Paced Patients
Repolarization
Tails
Some unipolar pacemakers display pace pulses with repolarization tails. These
tails may be counted as QRSs in the event of cardiac arrest or other arrhythmias.
If you note a visible repolarization tail, choose a lead that decreases the size of
the repolarization tail.
AVOID PACE PULSE REPOLARIZATION TAILS (NOTE WIDTH)
5-16
ST/AR Arrhythmia Monitoring
Learning
Overview
The arrhythmia system’s goal is to learn the patient’s normal complexes so it
can differentiate abnormal beats. This “learning” process uses the 15 first valid
beats (for example, free from noise) encountered during the learning phase.
While the system is learning the complex, the delayed arrhythmia wave displays
the beat label “L”. Also, the rhythm status message “LEARNING ECG”
displays. Then the system determines the dominant rhythm. During this time the
beats are labeled “N”, and the rhythm status message changes to “LEARNING
RHYTHM”.
Learning
A learning phase involves the system learning the patient’s dominant complexes.
During a learning phase:
•
•
•
•
Single Lead
Analysis
If single lead analysis is selected, the arrhythmia system begins a learning
whenever:
•
•
•
•
Multilead
Analysis
Alarm timeout periods are cleared.
Stored arrhythmia templates are cleared.
Asystole, Vfib, and HR alarms (when there are enough beats to compute
the HR) are active.
All other alarms are not active.
ECG monitoring is initiated.
The Relearn key is activated. See page 5-7.
The ECG Lead or Lead Label is changed manually, or when Fallback
occurs (see page 5-19).
A Leads Off INOP condition (that has been active for >60 seconds) ends.
If multilead analysis is selected, the arrhythmia system begins a learning on both
leads whenever:
•
•
•
ECG monitoring is initiated.
The Relearn key is activated. See page 5-7.
There has been a Leads Off INOP condition (that has been active for >60
seconds) for both leads, and the condition ends in either lead.
ST/AR Arrhythmia Monitoring
5-17
1 Introduction
Learning
Learning
Multilead
Analysis With
Changes in
One Lead
Since the arrhythmia system uses more than one lead for analysis, if there is a
change in one lead, the system does a relearn only on the affected lead. This
happens whenever:
•
•
An ECG lead or label is changed.
A Leads Off INOP condition (that has been active for >60 seconds) ends.
Note—During this learning phase the system will continue monitoring using the
operative lead. Therefore, the delayed arrhythmia wave is not labeled “L” and
there is no “LEARNING ECG’ rhythm status message. In addition:
•
•
•
EASI ECG
Monitoring
Warning
Alarm timeout periods are maintained.
Stored arrhythmia templates are maintained for the operative lead.
All alarms turned on are active.
Whenever there is an INOP condition, the arrhythmia algorithm performs a
Relearn, using the available lead.
Since Relearn happens automatically, if learning takes place during
ventricular rhythm, the ectopics may be incorrectly learned as the normal
QRS complex. This may result in missed detection of subsequent events of
V-Tach and V-Fib. For this reason, you should:
1. Respond to the INOP message (for example, re-connect the
electrode(s).
2. Ensure that the arrhythmia algorithm is labeling beats correctly.
5-18
ST/AR Arrhythmia Monitoring
Monitoring During Leads Off
Fallback
Multilead
Analysis
Singlelead
Analysis
EASI ECG
Monitoring
If there is a Leads Off INOP in the primary lead for >10 seconds, the active
secondary lead becomes the primary lead. This is known as lead fallback. In lead
fallback, the arrhythmia system switches the leads on the display. When the
Leads Off condition is corrected, the leads are switched back.
For single lead analysis, if there are two leads available, the other lead is made
the primary lead (until the Leads Off condition is corrected).
If one of the derived EASI leads has an INOP condition (for example, LEADS
OFF), a flat line is displayed. After ten seconds, the directly acquired EASI AI,
AS, or ES lead (depending on which is available) is displayed with the label
“ECG” and is analyzed by the arrhythmia system.
Note—If there is artifact in the ECG waves or a CANNOT ANALYZE ECG
INOP condition, you can use the three EASI leads to troubleshoot.
1. Click 12-Lead ECG on the Patient Window, then on 3 EASI Leads.
2. The three directly acquired EASI leads will be displayed so that you can
determine which electrodes are causing the problem and need to be
replaced.
Extended
Monitoring
(Telemetry)
For telemetry-monitored patients, when both the primary and secondary leads
have a Leads Off condition, if another lead is available it becomes the primary
lead and the system does a relearn. This is called extended monitoring.
Extended monitoring applies if:
•
Telemetry is configured for extended monitoring ON.
•
The lead set provides more than two leads.
– 5-wire lead set if using the Philips transmitter.
– 4-wire lead set, if using the M1400A/B transmitter.
ST/AR Arrhythmia Monitoring
5-19
1 Introduction
Monitoring During Leads Off
Status Messages
Status Messages
The Information Center displays two types of status messages in the Patient
Window:
•
•
Rhythm Messages -- to indicate the patient’s rhythm.
Ectopic Status Messages -- to indicate the presence of ectopic beats (if
present).
The Information Center updates these status messages every second.
Note—If you have basic arrhythmia capability configured, you will get only
messages for the basic alarms (see “Levels of Arrhythmia Analysis” on page
5-3).
Rhythm
Status
Messages
5-20
Message
Description
ASYSTOLE
No QRS detected for x seconds. Choices of > 2.5 to 4
seconds
Note—M3/M4 - No QRS detected for 4 consecutive
seconds
VENT FIB/TACH
A fibrillatory wave (sinusoidal wave between 2-10 Hz)
for 4 consecutive seconds
V-TACH
A dominant rhythm of adjacent Vs and a HR > the VTach Heart Rate Limit
SUST V-TACH
Ventricular Tachycardia rhythm for more than 15
seconds
VENT RHYTHM
A dominant rhythm of adjacent PVCs and a HR less
than or equal to the V-Tach Heart Rate Limit
VENT BIGEMINY
A dominant rhythm of N, V, N, V
(N=supraventricular beat, V=ventricular beat)
ST/AR Arrhythmia Monitoring
Status Messages
Description
VENT
TRIGEMINY
A dominant rhythm of N, N, V, N, N, V
(N=supraventricular beat, V=ventricular beat)
PACED RHYTHM
A dominant rhythm of paced beats
IRREGULAR HR
Consistently irregular rhythm
SINUS BRADY*
SINUS RHYTHM*
SINUS TACHY*
A dominant rhythm of SV (supraventricular) beats
preceded by P-waves
SV BRADY*
SV RHYTHM*
SV TACHY*
A dominant rhythm of SV (supraventricular) beats not
preceded by P-waves
UNKNOWN
RHYTHM
Rhythm cannot be determined
LEARNING ECG
Algorithm is learning the ECG beat morphology
LEARNING
RHYTHM
Algorithm is learning the rhythm of the classified beats
1 Introduction
Message
* The Sinus and SV rhythm messages are updated based on the current heart
rate, taking into account the patient category, adult, pediatric, or neonatal. In
order to make a transition from one rhythm status to another (for example,
from Sinus Rhythm to Sinus Brady) the HR must be in the new range for 5
beats.
The table below indicates the ranges for Sinus and SV rhythms.
Rhythm
Adult Range
Ped Range
Neo Range
Brady
15 to 60
15 to 80
15 to 90
Normal
60 to 100
80 to 160
90 to 180
Tachy
> 100
> 160
> 180
ST/AR Arrhythmia Monitoring
5-21
Status Messages
Ectopic
Status
Messages
Message
(numeric definition is in
brackets)
Explanation
(No message displayed)
No ectopic activity detected within the last
minute
RUN PVCs [longest run in
last minute]
More than 2 consecutive PVCs within the last
minute
PAIR PVCs [number of pairs
in last minute]
Pair PVCs within the last minute
PAUSE
No QRS detected for x seconds. Choices of
>1.5 to 2.5 seconds.
Note—M3/M4- No beat detected for 1.75 x
average R-R interval for HR <120, or no beat
for 1 second with HR >120 (non-paced
patient only)
PACER NOT CAPT [number
of pacer not captured episodes
in last minute]
Pause with pace pulse (paced patient only)
within the last minute
PACER NOT PACE [number
of pauses with no pacer in last
minute]
Pause without pace pulse (paced patient only)
within the last minute
MISSED BEAT [number of
pauses in last minute]
No beat detected for 1.75 x average R-R
interval for HR <120, or no beat for 1 second
with HR >120 (non-paced patient only)
Note—M3/M4-this alarm is not available
R-ON-T PVCs
R-ON-T detected within the last minute
MULTIFORM PVCs [number Multiform PVCs detected within the last
of PVCs in last minute]
minute
5-22
ST/AR Arrhythmia Monitoring
Status Messages
Explanation
FREQUENT SVPBs [number
of SVPBs in last minute]
SVPB count within last minute is greater than
5
SVPBs [number of SVPBs in
last minute]
1-5 SVPBs in the last minute with a sinus
rhythm and no Vs
SV BEATS [number of SVs
in last minute]
SV (supraventricular) count within last
minute (if 0 this message is blank) and
rhythm status is PACED
PACED BEATS [number of
paced beats in last minute]
Paced beat count within last minute (if 0 this
message is blank) and rhythm status is not
PACED
ST/AR Arrhythmia Monitoring
5-23
1 Introduction
Message
(numeric definition is in
brackets)
False Alarms
False Alarms
If you are getting false alarms perform the following steps:
Step
1
Action
On the Patient Window click the Arrhythmia Analysis button. The
Information Center displays up to two delayed Arrhythmia waves,
with beat annotations.
Note—You can view all the leads that can be obtained from the
patient’s ECG by clicking the Multilead ECG or 12-Lead ECG
button. See “Ensuring Accurate Arrhythmia Monitoring” on page 56 for more information.
2
5-24
Check the delayed arrhythmia wave and beat labels to ensure that
the algorithm is labeling the beats correctly. For patients with
pacemakers, make sure the system is not counting pacer spikes as
QRS complexes -- the beat label should not be above the pacer
spike, detecting the pacer spike as a QRS.
ST/AR Arrhythmia Monitoring
False Alarms
Step
1 Introduction
3
Action
If you don't agree with how beats are labeled click the Relearn
button to cause the system to relearn the patient’s ECG. See
“Learning” on page 5-17 for additional information on learning.
Warning
If you initiate learning during ventricular rhythm the ectopics
may be incorrectly learned as the normal QRS complex. This
may result in missed detection of subsequent events of V-Tach
and V-Fib.
4
If you still don’t agree with how the system is labeling beats, change
the ECG lead(s) to get better waves for arrhythmia analysis.
5
If it is difficult to provide more than one optimized ECG lead,
consider changing to singlelead arrhythmia analysis. In singlelead
analysis, the system uses only the primary lead. If you change to
singlelead analysis, make sure that this optimized lead occupies the
first ECG channel when you have more than 1 ECG lead displayed.
6
For telemetry and bedsides other than the M3 or IntelliVue Patient
Monitor, if changing the lead does not provide accurate analysis of
the beats the minimum threshold for single QRS detection can be
adjusted manually by:
1. Selecting Manual in the QRS Detection box in the bottom of
the window.
2. If using Multilead Analysis, choosing whether to display the
primary or secondary lead from the Lead drop-down list.
3. Using the up and down arrows to move the horizontal cursor
bars to the desired detection threshold.
4. Clicking the Update button to activate the measurement.
ST/AR Arrhythmia Monitoring
5-25
False Alarms
5-26
ST/AR Arrhythmia Monitoring
Introduction
6
Patient Data Review
This chapter describes the Information Center’s patient data review windows. It
includes the following sections:
•
•
•
•
•
•
•
•
•
•
•
The Information Center Review Windows. . . . . . . . . . . . . . . . . . . . . . 6-2
Alarm Review . . . . . . . . . . . . . . . . . . . . . . . . . . . . . . . . . . . . . . . . . . . . 6-9
Trend Review . . . . . . . . . . . . . . . . . . . . . . . . . . . . . . . . . . . . . . . . . . . 6-19
Event Review . . . . . . . . . . . . . . . . . . . . . . . . . . . . . . . . . . . . . . . . . . . 6-24
Wave Review . . . . . . . . . . . . . . . . . . . . . . . . . . . . . . . . . . . . . . . . . . . 6-31
ST Review. . . . . . . . . . . . . . . . . . . . . . . . . . . . . . . . . . . . . . . . . . . . . . 6-38
12-Lead Review . . . . . . . . . . . . . . . . . . . . . . . . . . . . . . . . . . . . . . . . . 6-42
Export Data to Holter System. . . . . . . . . . . . . . . . . . . . . . . . . . . . . . . 6-48
Changing the Waves that are Stored. . . . . . . . . . . . . . . . . . . . . . . . . . 6-50
Scheduled Reports . . . . . . . . . . . . . . . . . . . . . . . . . . . . . . . . . . . . . . . 6-52
Information Center Web Access. . . . . . . . . . . . . . . . . . . . . . . . . . . . . 6-62
6 Patient Data Review
Patient Data Review
6-1
The Information Center Review Windows
The Information Center Review Windows
Overview
Patient data storage begins when the patient is connected to a bedside monitor or
telemetry transmitter. The Information Center provides review windows that
allow you to display a patient’s physiological parameters and alarm events that
have been collected from a bedside monitor or telemetry transmitter and stored
over time in the database.
The review windows display the data in a variety of formats so that clinicians
can use it to evaluate the patient’s status and make rapid diagnosis/prognosis,
medication adjustments, and discharge/transfer decisions.
Note—If you have dual displays, the full screen is used when a data review
application is open.
The Information Center review windows are accessible via the Trends or Alarm
Review control buttons as well as the All Controls Window. They are:
6-2
Window
Description
Alarm Review
Displays the alarm events that have
been automatically stored as well as
strips that have been manually saved.
See “Alarm Review” on page 6-9.
Wave Review
Displays stored waves. Wave Review
allows you to examine the data for a
significant episode in detail. See
“Wave Review” on page 6-31.
Trend Review
Displays the parameter data in
graphical format. Trend Review
allows you to view data over time.
See “Trend Review” on page 6-19.
Patient Data Review
The Information Center Review Windows
Window
Description
Event Review
Displays the frequency and duration
of events that have been configured
for your unit. Event Review allows
you to view events over time. You can
navigate between significant episodes.
See “Event Review” on page 6-24.
ST Review
Displays the patient’s ECG beats and
ST segment values. ST Review allows
you to examine the data for a
significant episode in detail. See “ST
Review” on page 6-38.
12-Lead Review
Displays a 10-second retrospective
review of the 12 EASI derived ECG
waves for EASI enabled bedside
monitors and telemetry or the results
of 12 Lead Captures performed at an
IntelliVue Patient Monitor. See “12Lead Review” on page 6-42.
Stored Wave
Allows you to change the waves
stored for a patient. See “Changing
the Waves that are Stored” on page 650.
Patient Data Review
6-3
The Information Center Review Windows
Review
Window
Features
The Information Center review windows provide the following.
Feature
Description
Reporting
You can print a report from the review window
by clicking the Print button on the top of the
window.
Easy Navigation Between
Windows
The related application buttons on the bottom of
the review windows enable easy navigation
between review windows.
Note—If you enter a review window directly
from the Patient Window, the current time frame
and current values are displayed. If you enter a
review window from a related review window,
the cursor time position for that patient is the
same as it was on the previous review window.
Time Focus
The review windows allow you to display data
for a specific period of time. For Alarm Review
you can change the time focus by placing your
cursor over the time duration displayed at the
bottom right of the screen and selecting from the
pop-up list. Use this feature to display data over
a longer period of time (with less detail) or a
shorter period of time (with more detail).
Note—A '?' mark will display on the timeline in
any of the review windows whenever the time
on the central or SDN bedside monitor is
changed, for example, with daylight savings
time. This a normal event. A question mark will
also display when the central clock and the SDN
bedside monitor clock sync or re-sync. Clocks
tend to drift, when this happens the clock adjusts
the time forward or backward by 1 minute. The
expected frequency of the time clock
synchronization is about 1 per 48 hours.
6-4
Patient Data Review
The Information Center Review Windows
Feature
Description
Cursor/Page Arrows
You can also change the time focus in review
windows by “paging” backward and forward.
The double arrows page back/forward by a
larger amount than the single arrow. For
example, if 8 hours of data are shown on the
screen, the double arrows move back/forward by
8-hour increments, while the single arrows move
back/forward by smaller increments.
Data Updating
Review windows update the data when you
navigate forward in time or leave the window
and come back to it.
Patient Data Review
6-5
The Information Center Review Windows
Using Strips
in Review
Windows
Strip windows in the review applications (except for Trend Review, ST Review
and 12-Lead Review) enable the clinician to view details. Strips display about
10 seconds of data. Event Review displays a strip permanently, while the other
review applications enable you to produce one or more strips that overlay a part
of the window.
When you display a strip, all other buttons in the window remain active. The
table below describes how to use the strip windows to display details.
6-6
If you want to...
Do this...
Move back/forward in time
Use the single arrows to move the time
back/forward by approximately one
second. Use the double arrows to move
back/forward by a “page”.
Change the wave size (scale)
Put the cursor over the cal bar and use the
arrows to choose the size you want.
Save the strip in Alarm Review
(not applicable for Alarm
Review)
Click the Save button. A box will appear
that allows you to enter a comment. This
comment will then be visible when the
strip is displayed in Alarm Review. If the
strip is included in an alarm report, the
comment will be printed in the report.
Patient Data Review
The Information Center Review Windows
If you want to...
Do this...
Use the electronic caliper in
strips to measure intervals, such
as R-to-R
To Make a Measurement
1. Click on the strip once to fix the first
point of the caliper to the strip.
2. Drag the cursor and release to fix the
second point and display the
measurement.
To Adjust Measurements
Horizontally:
• Place the cursor on the right or left
vertical line. A right/left arrow
appears. Click on this arrow and drag
the line to the desired position.
Vertically (for example, to move the
measurement away from the waveform):
• Place the cursor between the vertical
lines. Click above or below the
measurement.
The measurement is removed when
another action is taken in the strip
window. Therefore, to print the strip with
the measurement, first make the
measurement, then print the strip.
Print a 30 second strip report of a
single strip (from Alarm Review,
Wave Review, or Event Review)
Click the Print button to the right of the
strip.
Patient Data Review
6-7
The Information Center Review Windows
If you want to...
Do this...
Make a recording of the strip
If a 4-channel recorder is available on
your system, indicate whether to send the
recording to the 2 Channel or 4 Channel
recorder by clicking on the appropriate
radio button then click on Record. You
will get a recording with 30 seconds of
stored waveform.
Note—If a 4-channel recorder is not
available on your system the 2-channel
and 4-channel radio buttons do not display
in this window.
Clear the strip from the screen
(not applicable for Event
Review)
6-8
Patient Data Review
Click the Close button.
Alarm Review
Alarm Review
Overview
The Alarm Review Window allows you to view stored alarms and saved strips.
The records are divided as follows:
•
•
50 records -- 40 stored alarms and 10 saved strips.
150 records -- 120 stored alarms and 30 saved strips.
Stored Alarms
Stored alarms are configured alarms that are automatically added to alarm
history when the alarm is generated. Each stored alarm has:
•
•
•
•
The date and time of the alarm.
The alarm text.
Vital signs associated with the alarm strip.
A 30-second compressed wave, with 10 seconds pre-event, and 20
seconds post-event.
When the number of stored alarms reaches maximum capacity, the oldest alarm
strip (#40 or #120) is automatically discarded and the new alarm is saved as #1.
Note—If an alarm has occurred and the monitoring device was turned off prior
to the storage of the alarm, the data for that alarm cannot be retrieved.
Saved Strips
Saved strips are waves that you manually save from the Wave Review, Event
Review Window, or from the patient sector. You can view saved strips in a
separate group (USER SAVED STRIPS). The most recent strip is displayed
first. Each saved strip has:
•
•
The time and date.
A 30-second compressed wave. Strips saved from Wave Review or Event
Review have 15 seconds before/after the center of the strip as it was in the
review window. Strips saved from the patient sector have 10 seconds
before the save action was taken and 20 seconds after.
When the number of saved strips reaches maximum capacity, the oldest saved
strip (#10 or #30) is automatically discarded and the new strip is saved.
Patient Data Review
6-9
Alarm Review
Managing Alarms/Strips
You can manage alarms/strips by:
•
•
Using Alarm
Review
6-10
Deleting alarms/strips manually. See page 6-13.
Inhibiting the automatic storage of individual alarms on a per patient basis
via the Record/Store Window. This feature is configurable. See
“Recording/Storing Alarms” on page 4-36.
The table below describes how to use the Alarm Review Window.
If you want to...
Do this...
Select the alarm(s) or saved
strip(s) for viewing
Select a specific type or all alarms or saved
strips for viewing by selecting a group at the top
right of the window.
Change the timeline
duration
Click the down arrow next to the Time
Duration box at the bottom right of the window
and select a time from the drop-down list that
displays. Choices are 12 hours, 24 hours, 48
hours or All Available.
View the alarm(s) in a
tabular display.
Click in the Tabular Display checkbox. A
check mark in the box causes a single alarm strip
to display along with a list of alarms on the
bottom of the window. You can select another
alarm strip to display by selecting the alarm
from the alarm list on the bottom of the window,
by clicking the Next or Previous buttons.
Display an alarm that
occurred at a specific time
Click on the time line or use the arrow buttons.
The double arrows go back/forward by a page (5
or 10 alarms). The single arrows go back/
forward by one alarm.
Patient Data Review
Alarm Review
If you want to...
Do this...
View uncompressed waves
for an alarm or saved strip
Click on the the alarm then click on the Strip
Window button. The strip displays, with up to 4
waves for viewing and printing in an
uncompressed format for the alarm. Use the
arrow keys to scroll backward and forward.
In half-screen windows, you can display one
strip. In full-screen windows you can display
two strips.
Re-label the alarm
1. From the alarm strip, place your cursor on
the alarm type at the top of the screen. A
popup list is displayed.
2. Choose an alarm type by clicking on a type
in the list. For example, you may want to
relabel an alarm from IRREGULAR HR to
ATRIAL FIB. (The current label is the last
label in the list.)
When you re-label an alarm the alarm is marked
with “Re-labeled to [new label]” for
identification. Re-labeling an alarm has no effect
on future alarm calls. The alarm label is just
changed on the strip and in Alarm Review.
Make a recording of the
alarm
If a 4-channel recorder is available on your
system, indicate whether to send the recording to
the 2 Channel or 4 Channel recorder by clicking
on the appropriate radio button then click on
Record. You will get a recording with 30
seconds of stored waveform.
Note—If a 4-channel recorder is not available on
your system the 2-channel and 4-channel radio
buttons do not display in this window.
Patient Data Review
6-11
Alarm Review
If you want to...
Do this...
Send a page to a clinicianworn receiver
If paging is available on your system, click the
Page button to send a page to the clinician
assigned to this patient. The waveforms and
parameters currently displayed in the Alarm
Review window are sent to the clinician’s
receiver. Six seconds of waveforms are
provided; 4 seconds preceding the alarm and 2
seconds after. See Chapter 8, “Alarm Paging”
for additional information on paging.
Note—When a page is sent the alarm time
displayed on the receiver is the time the page
was sent not the time the alarm occurred.
6-12
Patient Data Review
Alarm Review
If you want to...
Do this...
Delete alarms
You can delete an alarm from within the Alarm
Review Window, from within an alarm strip or
from the tabular display.
Alarm Review Window
To delete alarms from Alarm Review:
1. Mark the alarm(s) for deletion by clicking
on the alarm then clicking the Delete
Alarm button. When you click the Delete
Alarm button a wastebasket icon appears on
the right side of the alarm.
Note—You can cancel the deletion of an
alarm by clicking on the Delete Alarm
button again.
2. Delete the alarms (no undoing), by clicking
the Delete Alarms button.
Alarm Strip
To delete alarms from the Alarm Strip click the
Delete button on a strip then click the Close
button. The strip and alarm will be deleted. (You
cannot undo the delete in this case.)
Tabular Display
To delete alarms from a tabular display:
1. Mark the alarm(s) for deletion by right
mouse clicking on the alarm in the alarm list
then selecting Delete from the pop-up list
that displays. When you select Delete the
word “Delete” displays on the right side of
the alarm.
Note—You can cancel the deletion of an
alarm by right mouse clicking on the alarm
and selecting Delete again.
2. Delete the alarms (no undoing) by clicking
the Delete Alarms button.
Patient Data Review
6-13
Alarm Review
If you want to...
Do this...
Print a report
You can print a report from within the Alarm
Review Window, from a strip or from within a
tabular display.
Alarm Review Window
To print from the Alarm Review Window:
1. Select the alarm(s) clicking on the alarm
then clicking on the Print button. When
you click this button a printer icon appears
on the right side of the alarm.
Note—You can select a maximum of 12
alarms to be printed at one time. To print
more than 12 alarms, select the first 12
and print; then select the next 12 and print.
2. Click Print at the top right of the window.
You get a report of the selected alarms, with
primary and secondary 25 mm/s waves. There
are four alarms per page; each shows
approximately the first 10 seconds of the 30second strip (8 seconds pre-event, and 2 seconds
post-event).
Alarm Strip
To print a report of the displayed alarm strip,
click on the Print button to the right of the strip.
You will get a report of the strip just as it
appears on the screen, for example, with the size
you chose and with caliper measurements if you
used them.
6-14
Patient Data Review
Alarm Review
If you want to...
Do this...
Tabular Display
To print a report from a tabular display:
1. Right mouse click on the alarm in the alarm
list then select Print from the pop-up list.
The word Print displays to the right of the
alarm marking the alarm for inclusion in the
report.
2. Select any additional alarms by repeating
Step 1.
3. Print a report of the selected alarms by
clicking the Print button on the top of the
window.
The report will contain up to four strips per
page, with the oldest strip first. Each strip will
have up to four waves.
Use the electronic caliper
To Make Multiple Measurements and
Save as Comment on Alarm Strip
You can make multiple measurements and save
them as a comment on the strip.
1. Click on the checkbox to the left of the ECaliper field. Caliper Measurements is
selected when a checkmark displays.
2. Make the first measurement (see “Using
Strips in Review Windows” on page 6-6 for
instructions).
3. Assign a label to the measurement by
clicking on a measurement in the Caliper
Measurements listbox. Choices are: PR,
QRS, QT, RR and QTC.
4. The measurement displays in the Comment
field for this strip.
5. Continue until all desired measurements are
made.
Note—The QTC measurement is automatically
calculated from the QT and RR intervals.
Patient Data Review
6-15
Alarm Review
6-16
If you want to...
Do this...
Change the wave size
Click on the cal bar and select the size of the
wave you want.
Change the wave speed
From the alarm strip, change the speed to 6.25
mm/s, 12.5 mm/s, 25 mm/s, or 50 mm/s by
clicking on the speed from the Speed drop-down
list on the bottom of the window. When you
select a different speed the window re-displays
with the selected speed.
Add comments
From the alarm strip, enter text in the
Comment field on the upper left side of the
window then click the Close button. The
comments you enter are tied to the strip and will
appear on the strip in Alarm Review and in the
Alarm Reports.
Patient Data Review
Alarm Review
The following alarm types are available from the pop-up list:
SINUS RHYTHM
SINUS BRADY
SINUS TACHY
SINUS PAUSE/ARREST
ABBERENT PAC
ATRIAL TACHY
ATRIAL FLUTTER
ATRIAL FIB
WIDE QRS SVT
Fast Alarm
Review
SV TACHY
JUNCTIONAL RHYTHM
1º AV BLOCK
2º AV BLOCK TYPE I
2º AV BLOCK TYPE II
3º AV BLOCK
BUNDLE BRANCH BLOCK
LBBB
RBBB
IDIOVENTRICULAR
(AVR)ACCEL IDIOVENT
V-TACH
V-FIB
ATRIAL PACED
AV PACED
VENT PACED
PAC
ABERRANT SVT
Fast Alarm Review enables the clinician to quickly silence and view the alarm
wave and take immediate action on the alarm. This capability is configurable for
all red and yellow alarms, all red alarms only, or is disabled (default).
If enabled, clicking on the Silence/Review button for an active alarm silences
the alarm and opens a Patient Window with the strip for that alarm. (Clicking
anywhere in the sector, except on a button, silences the alarm without displaying
the strip.)
Note—If there is an application window open for any patient, when the Silence/
Review button is clicked, the Fast Alarm Review strip overlays it.
The alarm strip contains 15 seconds of unannotated waves that proceeded the
alarm. About 10 seconds are displayed on the screen; arrows enable viewing of
the other 5 seconds. The strip can have up to four waves (the first four waves
that are available in the Patient Window).
When Fast Alarm Review is open, the following buttons are available:
Button
Action
Close1
Dismisses Fast Alarm Review and shows the window that
was originally open, or if none open, shows the Main
Screen.
Patient Data Review
6-17
Alarm Review
Button
Action
Delete
Deletes the alarm (it will not be stored) and closes the
window.
Record
Produces a 15-second recording of the alarm.
Print
Prints the Fast Alarm Review screen.
Page
If paging is available on your system, sends a page to the
clinician assigned to this patient. The waveforms and
parameters currently displayed in the Fast Alarm Review
window are sent to the clinician’s receiver. Six seconds of
waveforms are provided; the 4 seconds preceding the
alarm and 2 seconds after. See Chapter 8, “Alarm Paging”
for additional information on paging.
Note—When a page is sent the alarm time displayed on the
receiver is the time the page was sent not the time the
alarm occurred.
Patient
Window1
Removes Fast Alarm Review and displays the Patient
Window for that patient. (This changes the focus from the
previously displayed bed.)
Main
Screen1
Closes all open windows and returns to the Main Screen.
Note—All navigation controls in applications are set to
defaults.
1When
the button is clicked, if the alarm was set up to be stored in Alarm
Review, it will be stored.
As in the Wave Review and Event Review, when the strip is displayed, you can
make a single caliper measurement and display different waves. If you then print
the alarm strip, the printout will contain the waves and measurements that are on
the screen.
Note—Recording from Fast Alarm Review is independent of the recording
settings in the Record/Store application. For example, you can inhibit the
recording of a type of alarm in the Record/Store application, and then record the
alarm on an individual basis from Fast Alarm Review. Storage of alarms is
controlled by the Record/Store application — alarms cannot be stored from Fast
Alarm Review.
6-18
Patient Data Review
Trend Review
Trend Review
Overview
The Trend Review window allows you to see a patient's averaged physiological
parameters collected over time from a bedside monitor or telemetry transmitter
in either graphic or tabular format. Trend data is available for up to the last 24
hours (48 hours if option purchased). All parameters that are stored can also be
trended.
Note—The only arrhythmia trends available for M3 monitors are HR and PVC
rate.
Note—The Information Center uses only centigrade as the unit measure for
temperature. For IntelliVue Patient Monitors if your bedside is set up to use
fahrenheit as the unit measure the Information Center Trend Review window
will display the fahrenheit numeric but label it as centigrade. Bedsides
connected to the Information Center should always set temperature
configuration to centigrade. Refer to your bedside documentation for
information on configuring temperature.
Trend
Review with
Graphic
Display
The Trend Review window with graphic display organizes the trends into trend
groups that allow quick access to ‘typical’ trends. Each group can contain up to
five trend graphs. Each trend graph can have up to two parameters. One trend
has the left axis, and the other has the right axis. The data (parameter name, unit,
trend plot, scales and values) for each parameter is in a separate color.
In half-screen operation, you can display up to two trend graphs in a group at
one time. You can cycle through the other graphs. In full-screen operation, all
five trend graphs are presented at one time.
Patient Data Review
6-19
Trend Review
There are several different trend presentations, depending on the characteristics
of the parameter. Different types of trends can be mixed in a trend graph. The
table below describes how the Information Center displays different parameters.
Parameter
Display
Continuous
The central displays single-value continuously
monitored parameters, such as heart rate with a
single line plot and triple-value periodic
parameters, such as invasive blood pressure with
three lines of the same color.
Aperiodic
The presentation of aperiodic, non-continuous,
parameters depends on the number of values to
be shown. Aperiodic parameters are presented as
discrete graphic data points with an ‘X’
indicator. Triple-value aperiodic parameters (for
example, NBP) appear as an ‘X’ at the mean
value with arrow indicators at the systolic and
diastolic values. Aperiodic parameters are not
averaged and are always displayed as exact
values. If more than one aperiodic value falls
into the same column, the latest value is shown.
Counts (for example, PVC Count, Normal Beat
Count, etcetera.) and % arrhythmia
measurements (% Bigeminy, % Paced, etcetera)
are displayed in bar chart form/histogram.
Rates (Paced Rate, S-S Rate, V-V Rate, etcetera)
are displayed in graphic form as two trend lines.
6-20
Multiple
Multiple parameters, such as ST, are presented
as separate curves, each in a different color. The
same colors are used to display the parameter
names and corresponding values.
Histograms
Discrete events, such as PVC count, are
presented as histograms.
Patient Data Review
Trend Review
The table below describes how to use the Trend Review with graphic display.
If you want to...
Do this...
Change the trend group
displayed in the Trend
Review window
With a check in the Trend Groups checkbox,
select a group from the Trend Group dropdown list. The trend graphs are grouped into sets
of up to five each. Each trend graph can have up
to two parameters.
Select a different trend
graph parameter to display
With a check in the Trend Groups checkbox,
select the parameter from the Parameter dropdown list. The parameters that are available
depend upon the selected trend group.
Remove the current graph
trend and replace
parameters you select
Uncheck the Trend Groups checkbox then
select the parameters from the parameter dropdown list.
See parameter values for a
point in a trend for
example, where the trend
line shows a change in the
patient's status
Move the Navigator cursor bar by using the
arrows or clicking on the trend graph.
Change the trend scale
Click on the axis then select a different scale
from the pop-up list that displays. Selecting
Optimum ensures that to all parameter data
within the current duration is visible.
Change the time period for
a trend
Select the number of hours from the Time dropdown list. Choices are 1, 4, 8,12, and 24 hours.
Print a report
Click the Print button on the top right of the
window.
Patient Data Review
6-21
Trend Review
Trend
Review with
Tabular
Display
The Trend Review window with Tabular Display displays parameter data in
rows and columns suitable for charting purposes. You select tabular display by
clicking in the Tabular Display checkbox. A checkmark in the checkbox
removes the bottom trend graph and displays a table on the bottom of the Trend
Review window. The table includes:
•
•
•
•
Up to 140 rows of averaged data points for the specified parameters.
Up to 17 columns of time indicators spaced per the selected time
resolution.
Parameter label for each displayed parameter is always in black.
A highlighted column corresponding to the nearest minute for the current
time focus. In addition a shaded gray rectangle appears in the trend graph
area corresponding to the number of minutes of tabular data being
displayed and the duration of the timeline.
Note—For most parameters the value displayed in the tabular trend is the
median of the valid parameter one-minute average values for the given interval.
For triple-valued pressure parameters, the median of the mean is used to
determine which parameter to display for all three values. For ST parameters,
the value displayed is the value corresponding to the maximum absolute value
over the interval. For P, S, and V rates, the minimum and maximum within the
interval is displayed.
The table below describes how to use the Trend Review with tabular display
6-22
If you want to...
Do this...
Expand the number of rows
displayed in the table
Click the up arrow to the left of the table. When
you click the up arrow the graphic display on the
top of the window is removed and the number of
tabular rows displayed increases.
Move the tabular display
backward or forward in
time
Use the horizontal scroll bar on the bottom or
use the right and left arrow buttons.
Change the time period
Select a time interval from the Timeline
Duration drop-down lists to the right of the
table.
Patient Data Review
Trend Review
If you want to...
Do this...
Change the time resolution
for the tabular trends
Select a different number of minutes from the
Time Resolution drop-down list. The number
of minutes available depend on the hour selected
in the Timeline Duration.
Add a parameter to the
tabular table
Select a parameter from the Parameter list to
the right of the table.
Patient Data Review
6-23
Event Review
Event Review
Overview
The Event Review Window provides an overview of the frequency and duration
of specific events (for example, V-Tach), along with a strip showing the waves
for the event. The strip area is at the top of the window; the event occurrence
area, with up to five event bars is at the bottom.
Up to ten event groups can be configured in Unit Settings for a Information
Center. All groups are available for selection. Event Review groups the events
into sets of up to five events. Events include:
•
•
Alarms generated from the central or bedside.
Arrhythmia events for example, R-on-T.
Note—The events that are available are dependent on your monitoring device.
Cursor/Event
Information
6-24
The Event Review Window provides the following information whenever the
event cursor matches the onset of an event:
•
The time and date corresponding to the position of the event cursor.
•
The name of the event, the duration of the event (if applicable) and the
actual value and name of the parameter (if applicable) that violated the
event limit.
•
The event count to the right of each event bar reads “X/Y”, where (X) is
the number of events at and to the left of the event cursor and (Y) is the
total number of such events on the screen. For example, 3/5 tells you that
there are a total of 5 events in that row, and 3 of the events occurred
before or at the time of the cursor bar.
Patient Data Review
Event Review
Event Bars
The Event Review Window provides event bars to show the duration from the
detection of the event to when the event was acknowledged (silenced).
Event bars are color coded to represent the severity of the event. The color of the
event indicates the severity.
Color
Severity
Red
*** Life threatening alarms.
Yellow
** Limit violation alarms.
Cyan
All INOP conditions and non-alarming events
including arrhythmia events.
Blue
User saved strips.
Note—Gray stripes indicate that the analysis of a specific event was not reliable
for a certain period of time (for example, if the signal was not available or of
insufficient quality).
Patient Data Review
6-25
Event Review
Using Event
Review
The table below describes how to use the Event Review Window.
If you want to...
Do this...
Select specific events
When you enter the Event Review Window from
Main Screen, the event cursor is positioned at
the time of the most recently collected data. To
select specific events:
• Click the left and right cursor arrows. Each
time you click the cursor arrow, the cursor
jumps to the onset of the next (or previous)
event.
• Click on the event navigator to displays a
strip corresponding to the event at that time.
• Toggle specific event types on and off by
clicking on the event label to the left of the
event bar. When event label is off (greyedout) the event navigator left and right cursor
arrows ignore all of these types of events
Note—The displayed strip corresponds to the
location of the event cursor. The strip
automatically updates when you move the event
cursor. You can also scroll the strip (and the
event cursor moves correspondingly).
6-26
Save a strip and add a
comment
You can save a strip in Alarm Review by
clicking on Save. A box will appear that allows
you to enter a comment. This comment is
associated with the time shown on the strip, and
does not display when you scroll the strip
window. However, the comment is visible from
the Alarm Review Window.
Change the strip wave size
Click on the cal bar and select the size of the
wave you want.
Patient Data Review
Event Review
If you want to...
Do this...
Change the strip wave
speed
Change the speed to 6.25 mm/s, 12.5 mm/s, 25
mm/s, or 50 mm/s by clicking on the speed from
the Speed drop-down list on the bottom of the
strip window. When you select a different speed
the window re-displays with the selected speed.
Change the event timeline
duration
Select the number of hours from the Time dropdown list. Choices are 1, 4, 8,12, and 24.
Make a recording of the
strip
If a 4-channel recorder is available on your
system, indicate whether to send the recording to
the 2 Channel or 4 Channel recorder by clicking
on the appropriate radio button then click on
Record. You will get a recording with 30
seconds of stored waveform.
Note—If a 4-channel recorder is not available on
your system the 2-channel and 4-channel radio
buttons do not display in this window.
Use the electronic caliper
1. With the strip displayed, click on the
checkbox to the left of the E-Caliper field.
Caliper Measurements is selected when a
checkmark displays.
2. Make the first measurement (see “Using
Strips in Review Windows” on page 6-6 for
instructions).
3. Assign a label to the measurement by
clicking on a measurement in the Caliper
Measurements listbox. Choices are: PR,
QRS, QT, RR and QTC.
4. The measurement displays in the Comment
field for this strip.
5. Continue until all desired measurements are
made.
Note—The QTC measurement is automatically
calculated from the QT and RR intervals.
Patient Data Review
6-27
Event Review
Reports
From Event Review, you can print four types of reports:
•
30 second strip report -- you can print a report of a single strip by clicking
the Print button to the right of the strip.
Event Review Window report -- you can print a report of the Event
Review window by clicking the Print button on the top right of the
window. The Information Center prints a report of the waves you are
viewing along with the event bars on the bottom. The Event Review
Window uses this format for both half screen and full screen operation.
Strip Report -- you can create a report based on selected strips. See “Strip
Reports” below.
Event Summary Report-- you can print a report based on selected events.
See “Event Summary Report” below.
•
•
•
Strip Reports
To print a Strip Report, perform the following steps:
Step
6-28
Action
1
Display the first strip.
2
Click in the Strip Report checkbox.
3
In the small window that displays, enter a comment or select a preset comment.
4
Click Save User Strip if you want to save this strip in Alarm
Review.
Note—Selecting the strips for this report does not save the strips.
5
Click OK -- the Report List will be displayed.
6
Click on the next wave area of interest then click Add.
7
Repeat Steps 3 through 5 for each wave area of interest.
Patient Data Review
Event Review
Step
8
9
Action
You can make changes to any strip (for example, add a caliper
measurement) by clicking on the strip in the Report List. Make the
changes, and then click Add.
To print the report, click Print.
Note—If you want to remove a strip before printing the report,
highlight that strip, then click Remove.
The report will contain all of the selected strips sorted by time. The strips will
also appear on the report just as they did on the screen (with caliper
measurements, at the same speed, with the same waves, etc.). Once you print the
report, the list is cleared.
Event
Summary
Report
For dual-display systems, to print a Event Summary Report, perform the
following steps:
Step
Action
1
Click the Summary Report button.
2
Select the events to be included in the report by clicking on the
event in the event bar then clicking the Add button. Repeat for each
event to be included in the report. A table with the selected events
displays on the bottom of the window. You can remove a previously
selected event from the event table by clicking on the event in the
table then clicking the Remove button.
Note—Clicking on an event in the event table displays the event in a
strip window. Clicking in an area on the event bar that has no events
then clicking the Add button causes a strip window to display for
the selected time. The event is added to the Summary Report table
as a blue event and labeled as “User Defined Event”
3
Click Print. You will get a report of all of the selected events.
Patient Data Review
6-29
Event Review
The Event Summary Report contains:
•
•
•
•
•
6-30
Patient Data Review
A graphic trend of HR for the most recent 24 hours.
A graphic trend of PVC for the most recent 24 hours.
A tabular trend for HR (max, median, min) for the most recent 24 hours.
A tabular trend of event counts for each of the event group entries for the
displayed event group for the most recent 24 hours.
An event strip containing the event specification and duration for each
entry in the Summary Report.
Wave Review
Wave Review
Overview
The Wave Review Window allows you to view up to four continuous waves that
have been stored for a patient. Wave Review Window includes:
•
•
•
•
•
•
A lead label for each displayed wave.
Navigator selections for Event, Trend or Timeline.
A red rectangle in the wave area indicating the corresponding wave strip
selection.
A square-wave pattern for any wave that is invalid or not accessible for
the given time period (see “No Data/Invalid Data” on page 6-32)
A label change indicator if the stored wave changed for the specified time
period.
A scale change indicator if the wave changed scaled during the specified
time period.
Note—The Stored Wave Window, accessible from the All Controls Window
allows you to select the waves for storage for a patient.
Navigation
Choices
The Wave Review Window contains two components: the actual full disclosure
waves in the top part and navigation in the bottom part.
You can use the navigation area to select a focus for the waves. The choices are:
•
Trends
Use the Trend navigator to display a single trend graph and scan the trend
for significant changes. The choices available to you in the Trend
Navigator depend on whether or not you have Trend Groups selected in
the Trend Review window (see “Trend Review” on page 6-19). With
Trend Groups selected in Trend Review window you can select the trend
group you would like to see. With Trend Groups not selected in the Trend
Review window, you can select parameters to trend by selecting from the
Parameter drop-down lists. Use the top Parameter drop-down list to
change the left parameter. Use the bottom Parameter drop-down list to
change the right parameter. Moving the cursor by clicking in the trend
area displays the waves for that time period.
Patient Data Review
6-31
Wave Review
•
Events
Use the Events navigator to look at waves for events of interest. The
Event navigator has bars for each event code. The event bars have
different colors depending on level of severity:
– Red = life-threatening alarms
– Yellow = limit violation alarms
– Cyan = all INOP conditions and non-alarming events including
arrhythmia events
Moving the cursor by clicking in the event area displays the waves for that
event. To change the Event Group, select a different group from the
Event Group drop-down list.
•
No Data/
Invalid Data
Timeline
You can use the Timeline at the bottom of the window to navigate. The
timeline indicates the time and date (indicated on the first time stamp or
when the day boundary is crossed). The timeline has 3-6 ticks depending
on the current time period selected. A shaded area with a vertical bar with
arrows in the timeline corresponds to the currently displayed waves. This
shaded area depends on the number of minutes of wave being displayed
and the duration of the timeline.
If the data is unavailable (for example monitoring is suspended) or invalid (for
example, an INOP condition), a black or green square wave is displayed.
If you get a strip and there is no valid data available, the message “No Data
From Bed” is displayed in the strip. (This may result from turning off the
monitoring device or placing it in standby.)
End of available/valid data
Valid data available
6-32
Patient Data Review
Wave Review
However, if there is any valid data available in the previous/next minute, a
square wave is displayed in the strip. Scroll back/forward to get to the wave
data.
II
V
Valid data available
Using Wave
Review
The table below describes how to use the Wave Review Window.
If you want to...
Do this...
View waves for an event
To see waves for an event of interest (for
example, an episode of VTACH), move the
Navigator cursor bar by using the arrows or
clicking on the event line.
To view all waves or waves in combination with
trends place the cursor over Navigator and click
on your choice.
Display/hide waves for
selected wave label
Click the respective wave label on the right of
the window.
Change the displayed
waves size
Click the Up and down arrows to the right of the
waves. When you click the Up and Down arrows
the Information Center redraws all the displayed
waves, changing the wave size up or down.
View the waves greater/less Change the amount of detail shown by clicking
detail
on the Wave Duration field on the top right of
the window and selecting the number of minutes
from the drop-down list. The larger the number
of minutes the less detail shown. Choices are 1
minute, 6 minutes, 12 minutes, 30 minutes and
60 minutes.
Patient Data Review
6-33
Wave Review
If you want to...
Do this...
Change the timeline
duration
Select the number of hours from the Time dropdown list on the bottom left of the window.
Choices are 1, 4, 8,12, and 24.
Get a strip to view waves in
greater detail
Move the cursor to the part of the wave you
want and click. A strip window displays.
In half screen operation most of the wave
window will be replaced by the strip window.
Full screen operation: the strip window will
cover part of the waves. The strip can have up to
four waves.
Make a recording of the
wave strip
If a 4-channel recorder is available on your
system, indicate whether to send the recording to
the 2 Channel or 4 Channel recorder by clicking
on the appropriate radio button then click on
Record. You will get a recording with 30
seconds of stored waveform.
Note—If a 4-channel recorder is not available on
your system the 2-channel and 4-channel radio
buttons do not display in this window.
6-34
Save a strip and add a
comment
You can save a strip from Wave Review by
clicking on Save. A box will appear that allows
you to enter a comment. This comment is
associated with the time shown on the strip, and
does not display when you scroll the strip
window. However, the comment is visible from
the Alarm Review Window if you display that
strip.
Change the strip wave size
Click on the cal bar and select the size of the
wave you want.
Patient Data Review
Wave Review
If you want to...
Do this...
Change the strip wave
speed
Change the speed of the strip wave to 6.25 mm/
s, 12.5 mm/s, 25 mm/s, or 50 mm/s by clicking
on the speed from the Speed drop-down list on
the bottom of the strip window. When you select
a different speed the window re-displays with
the selected speed.
Use the electronic caliper
1. With the strip displayed, click on the
checkbox to the left of the E-Caliper field.
Caliper Measurements is selected when a
checkmark displays.
2. Make the first measurement (see “Using
Strips in Review Windows” on page 6-6 for
instructions).
3. Assign a label to the measurement by
clicking on a measurement in the Caliper
Measurements listbox. Choices are: PR,
QRS, QT, RR and QTC.
4. The measurement displays in the Comment
field for this strip.
5. Continue until all desired measurements are
made.
Note—The QTC measurement is automatically
calculated from the QT and RR intervals.
Patient Data Review
6-35
Wave Review
Reports
From Wave Review, you can print four types of reports:
•
30 second strip report -- you can print a report of a single strip by clicking
the Print button to the right of the strip.
Wave Review Window report -- you can print a report of the Wave
Review window by clicking the Print button on the top right of the
window.
Strip Report -- you can create a report based on selected strips (for
example, when doing a Swan insertion).
Duration Report -- you can print a report or make a recording of waves for
a specific length of time. See “Duration Report” below.
•
•
•
Strip Reports
To print a Strip Report of multiple strips, perform the following steps:
Step
Action
1
Display the first strip.
2
Click in the Strip Report checkbox.
3
In the small window that displays, enter a comment or select a preset comment.
4
Click Save User Strip if you want to save this strip in Alarm
Review.
Note—Selecting the strips for this report does not save the strips.
5
Click OK -- the Report List will be displayed.
6
Click on the next wave area of interest then click Add.
7
Repeat Steps 3 through 5 for each wave area of interest.
8
You can make changes to any strip (for example, add a caliper
measurement) by clicking on the strip in the Report List. Make the
changes, and then click Add.
9
To print the report, click Print.
Note—If you want to remove a strip before printing the report,
highlight that strip, then click Remove.
6-36
Patient Data Review
Wave Review
The report will contain all of the selected strips sorted by time. The strips will
also appear on the report just as they did on the screen (with caliper
measurements, at the same speed, with the same waves, etc.). Once you print the
report, the list is cleared.
Duration
Reports
To print or record a Duration Report, perform the following steps:
Step
Action
1
Specify where you want the report to begin by right clicking on the
area of the wave then selecting Start from the pop-up menu that
displays (a marker will display on the wave indicating the desired
Start time).
2
Specify where you want the report to end by right mouse clicking on
that area of the wave then selecting Stop from the pop-up menu
that displays (a marker will display on the wave indicating the
desired stop time).
3
For recordings, if a 4 channel recorder is available on your system,
indicate whether to print the recording on the 2 Channel or 4
Channel recorder by right mouse clicking on the wave then
selecting the appropriate recorder from the pop-up list that displays.
4
To print a recording of the specified wave duration, right mouse
click in the wave then select Record from the pop-up list.
5
To print a report of the specified wave duration, right mouse click in
the wave then select Print from the pop-up list.
Patient Data Review
6-37
ST Review
ST Review
Overview
The ST Review displays up to 12 ST “snippets” (a sample of the patient's ECG
beats for a given time) and ST elevation/depression values, in combination with
trends or events. ST Review allows you to examine the data for a significant
episode in detail. You can view individual ST snippets, compare snippets against
each other or against a selected baseline.
The ST values are displayed and trended at the Information Center.
For bedside monitored patients adjust measurement points and alarm limits at
the bedside. Bedside monitored patients need to turn ST on to make data
available in the ST Review window (see “Enabling ST Review for Bedside
Monitors” on page 7-5).
For telemetry monitored patients adjust measurement points and alarm limits on
the Information Center.
The bottom portion of the window provides navigation based on Trends or
Events for all monitoring devices.
Note—ST is not measured or trended when there is a LEADS OFF INOP.
Navigation
Choices
You can use the navigation area on the bottom part of the ST Review Window to
select a focus for the ECG waves. For all navigators, a solid color line is shown
for each ST cursor and the baseline ST measurement (if set). Red is used for the
baseline; green for ST Cursor 1; gold for ST Cursor 2; cyan for ST Cursor 3;
purple for ST Cursor 4 (ST Cursor 3 and 4 available in dual-display systems
only).
The choices are:
•
6-38
Patient Data Review
Trends
Use the Trend navigator to display a single trend graph and scan the trend
for significant changes. The choices available to you in the Trend
Navigator depend on whether or not you have Trend Groups selected in
the Trend Review window (see “Trend Review” on page 6-19). With
Trend Groups selected in Trend Review window you can select the trend
group you would like to see. With Trend Groups not selected in the Trend
Review window, you can select parameters to trend by selecting from the
ST Review
Parameter drop-down lists. Use the top Parameter drop-down list to
change the left parameter. Use the bottom Parameter drop-down list to
change the right parameter. Moving the cursor by clicking in the trend
area displays the waves for that time period.
•
Events
Use the Event navigator to display the events and look at ECG waves for
events of interest. The event bars have different colors depending on level
of severity:
– Red = life-threatening alarms
– Yellow = limit violation alarms
– Cyan = all INOP conditions and non-alarming events including
arrhythmia events
To see data for an event of interest (for example, an episode of V-TACH),
move the cursor in the event area. You can change the time focus by using
the arrow buttons. To view a different Event Group, with Event selected
as the navigator, select the event from the Event Group drop-down list.
•
Timeline
The timeline navigator at the bottom of the display indicates the time and
date. You can click on the timeline to see waves for a different period of
time or change the time focus by using the arrow buttons. The timeline as
3-6 ticks depending on the time duration. You can change the time
duration by selecting a different time from the Time drop-down list on the
bottom of the window.
•
ST Topology
Use ST Topology navigator to view a color depiction of ST changes over
time. When you select ST Topology a color bar displays on the bottom of
the window showing changes in ST values. A progression of ST
depression or elevation across multiple leads across time is indicated by a
band of color that shifts from one lead to another. The top color (red)
corresponds to any ST value that is equal to or greater than the maximum
positive ST value. The bottom color (blue) corresponds to any ST value
that is less than or equal to the maximum negative ST value. Any values
in between are shading slightly red for positive values and slightly blue
for negative values. An ST value near 0.0 mm is mapped to a black color.
If an ST lead is not available at a specific time, it displays in the color bar
as white.
Patient Data Review
6-39
ST Review
You can adjust the maximum ST values by using the up and down arrows
next to the color bar. When you change the ST maximum by using the up
and down arrows the colors re-display with the new setting.
All measured ST leads are displayed over time from top to bottom. Right
mouse click on the strip to see the ST leads measured at that point in time
as well as the exact lead the cursor is currently positioned on. The lead
order is always chest leads (V6 to V1 or V,MCL) followed by limb leads
(III, aVF, II, aVR, I, aVL).
Using the
ST Cursor
Buttons
You can move one ST Cursor at a time by clicking in the ST Cursor radio
button. When you select a time on the navigator or use the arrow buttons, it is
this single ST cursor that is moved. Each time an ST cursor is moved, the
corresponding ST snippets for that time are displayed in the ST Review window.
You can display the ST snippets and their values by clicking the ST Cursor
button. Multiple ST snippets/values may be highlighted at the same time. When
multiple ST values are shown, they are always displayed top-down: ST1, ST2,
ST3, ST4, ST-baseline. When exactly two values are shown, a difference
between the values is displayed.
Using ST
Review
The table below describes how to use the ST Review Window.
If you want to...
Set a new baseline for
reference
6-40
Do this...
1. Use the Navigators to find the time you
want to use as a baseline.
2. Review the ECG snippets.
3. Click on Set Baseline.
Display the baseline value
in the Navigator
Click the Show Baseline button.
Superimpose the current
measurement points (ISO
and ST) on to the ST
segment
Click in the Measurement checkbox.
Patient Data Review
ST Review
If you want to...
Do this...
Move one ST Cursor at a
time
Click on the ST Cursor radio button. When
you select a time on the navigator or use the
arrow keys, it is this single ST cursor that is
moved. Each time an ST cursor is moved, the
corresponding ST snippets for that time display
in the ST Review window.
Display the ST snippets
and their values
Click the ST Cursor button. Multiple ST
snippets/values may be highlighted at the same
time. When multiple ST values are shown, they
are always displayed top-down: ST1, ST2, ST3,
ST4, ST-baseline.
When exactly two values are shown, a difference
between the values is displayed.
For systems with Dual displays 4 cursor buttons
are available.
Print a report
Click the Print button generates a printout with
the contents of the screen.
Change the size of ST wave Click on the calibration bar then select the wave
size from the pop-up list that displays.
Change the speed of the ST
wave
See a moving indicator of
ST changes over time
(dual-display systems only)
Select a speed (25. 0 or 50.0 mm/s) from the
Speed drop-down list on the right side of the
window The window re-displays with the
selected speed.
1. Using the Timeline, Trend, or ST Topology
as the Navigator, select at least two ST
cursors to display.
2. Click on the Animate radio button.
3. Click and hold the right or left single arrow
button. The ST Review window
superimposes ECG snippets moving in time
backward or forward respectively.
Patient Data Review
6-41
12-Lead Review
12-Lead Review
Overview
Depending on your system, you can use the 12-Lead Review Window to view
10-second retrospective review of the 12 EASI derived ECG waves for EASI
enabled bedside monitors and telemetry or to see the results of 12 Lead Captures
performed at a wired IntelliVue Patient Monitor.
Note—EASI derived 12-lead ECG’s and their measurements are approximations
to conventional 12-lead ECG’s and should not be used for diagnostic
interpretations.
12-Lead
Review with
12 Lead
Captures
When the data is captured using a standard 10-wire lead set 10 seconds of the
wave data along with the ECG analysis interpretation statements and
measurements can be reviewed in the 12-Lead Review. See the Philips
Interpretive Cardiograph Physician’s Guide (M1700-92908) for a complete list
of the interpretation statements.
When the data is captured using EASI leads 10 seconds of the wave data and
interval measurements may be reviewed in the 12-Lead Review. Interpretation
statements are not available when the capture is performed using EASI lead
placement.
Using this
Window
6-42
The table below describes how to use the captured 12-Lead Review Window.
If you want to...
Do this...
Select a particular capture
for display
On the bottom of the 12-Lead Review window
click on the tabs labeled with dates and time to
display a capture for a particular time.
Switch to a continuous
view
If EASI wave storage is available on this system,
navigate to a continuous view by unchecking the
Captured 12 Leads checkbox.
Hide the statements
If interpretation statements are available, hide
the statements by unchecking the Statements
checkbox.
Patient Data Review
12-Lead Review
If you want to...
Do this...
Export the data to a
networked machine or to
the Information Center
floppy drive
For systems with the 12 Lead Export feature
available, click the Export button. The 12-Lead
Review Export window displays. See “12-Lead
Export Window” on page 6-46 for information
on using the export feature.
Delete the currently viewed
12 Lead capture
Click the Delete button.
Change the wave layout
Click on the wave layout on the top right side of
the window then select wave layout (3x4, 6x2,
or 12x1) from the list that displays. In 3x4 layout
an additional rhythm lead displays.
Change the rhythm lead
Click on the the rhythm lead label (for 3x4 only)
on the bottom left of the window then select a
lead from the list that displays (I, II, III aVR,
aVL, aVF, V1, V2, V3, V4, V5, V6).
Change the wave size
Click the cal bar and select the size of the wave
you want.
Change the wave speed
Clicking on the speed on the bottom right of the
window and select the speed from the list that
displays (25 mm/s or 50 mm/s). When you select
a different speed the window re-displays with
the selected speed.
Print a report
Click the Print button. The 3x4 or a 6x2 format
prints in landscape layout and the 12x1 format
prints in portrait layout. The information
contained in the 12-Lead Window prints along
with the following additional information:
• Size: mm/mV
• Speed: mm/s
• Patient’s name and medical record number
• Bandwidth
Patient Data Review
6-43
12-Lead Review
EASI
Derived 12Lead
Review
Navigation
Choices
The 12-Lead Review window provides 10 second retrospective review of the 12
EASI derived ECG waves. You can navigate within the window by using the
arrow buttons to the right of the window or by using the Navigator on the lower
portion of the window. You can page forward or backward by either 1-second
intervals or by 10-seconds intervals.
The EASI derived 12 Lead Review allows you to view waves using the
following navigation choices:
•
Trends
Use the Trend navigator to display a single trend graph and scan the trend
for significant changes. The choices available to you in the Trend
Navigator depend on whether or not you have Trend Groups selected in
the Trend Review window (see “Trend Review” on page 6-19). With
Trend Groups selected in Trend Review window you can select the trend
group you would like to see. With Trend Groups not selected in the Trend
Review window, you can select parameters to trend by selecting from the
Parameter drop-down lists. Use the top Parameter drop-down list to
change the left parameter. Use the bottom Parameter drop-down list to
change the right parameter. Moving the cursor by clicking in the trend
area displays the waves for that time period.
•
Events
You can display the Events and look at waves for events of interest. The
Event navigator has bars for each event code. The event bars have
different colors depending on level of severity:
– Red = life-threatening alarms
– Yellow = limit violation alarms
– Cyan = all INOP conditions and non-alarming events including
arrhythmia events
To see data for an event of interest, move the Navigator cursor bar by
using the arrow buttons or clicking on the event line. Moving the cursor
by clicking in the event area displays the waves for that event. To change
the Event Group, select a different group from the Event Group dropdown list.
Note—For IntelliVue Patient Monitors, non-arrhythmia yellow alarms
appear in All Alarms and in Yellow Alarms but not in Bed Alarms.
6-44
Patient Data Review
12-Lead Review
•
Using This
Window
Timeline
You can click on the timeline to see waves for a different period of time.
The timeline indicates the time and date. The timeline has 3-6 ticks
depending on the current time period selected.
The table below describes how to use the EASI derived 12-Lead Review
Window.
If you want to...
Do this...
Navigate to a 12-lead
captures view
For systems with 12-lead captures available,
navigate to a captured view by clicking in the
Captured 12 Leads checkbox.
Export the 12 lead data to a
networked machine or to
the Information Center
floppy drive
For systems with the 12 Lead Export feature
available, click the Export button. The 12-Lead
Review Export window displays. See “12-Lead
Export Window” on page 6-46 for information
on using the export feature.
Change the wave layout
Click on the wave layout on the top right side of
the window the select wave layout (3x4, 6x2, or
12x1) from the list that displays. In 3x4 layout
an additional rhythm lead displays.
Change the rhythm lead
Click on the the rhythm lead label (for 3x4 only)
on the bottom left of the window then select a
lead from the list that displays (I, II, III aVR,
aVL, aVF, V1, V2, V3, V4, V5, V6).
Change the wave size
Click the cal bar and select the size of the wave
you want.
Patient Data Review
6-45
12-Lead Review
12-Lead
Export
Window
If you want to...
Do this...
Change the wave speed
Change the speed to 25 mm/s, or 50 mm/s by
clicking on the speed on the bottom right of the
window and selecting the speed from the list that
displays. When you select a different speed the
window re-displays with the selected speed.
Print a report
Click the Print button. The information
contained in the 12-Lead Window prints along
with the following additional information:
• Size: mm/mV
• Speed: mm/s
• Patient’s name and medical record number
• EASI bandwidth
Use 12 Lead Export window to export the 12 lead data to a networked machine
or to the Information Center floppy drive.
Note—The data that is accepted at the time of export is determined by the
receiving system.
After clicking the Export button in the 12 Lead Review window, perform the
following steps to export the data:
Step
6-46
Action
1
Type a 1- to 32-character name of the person initiating the export in
the Operator field.
2
Type a 1- to 32-character physician's name in the Physician field.
3
Select a maximum of 4 medications by clicking in the checkbox
next to the Medication name.
4
Select a maximum of 4 diagnostic items by clicking in the checkbox
next to the Diagnosis name.
5
Select as destination to which to export the data by selecting the
location from the Destination drop-down list.
Patient Data Review
12-Lead Review
Step
Action
6
Verify that you have correct patient selected and demographic
information is correct then click the Send button to initiate the
export.
Note—Timestamps between the Information Center and the
receiving device may not match due to differences in timestamp
location for the receiving device.
7
You can check the status of the export in the Transfer Status
window by clicking the Transfer Status button from the All
Controls window.
The following additional data is exported to the Destination location:
•
Demographic data including patient name, medical record number, date of
birth, gender, height, and weight
Important: For patients where 12 leads are captured and exported, the
patient should be admitted with name, medical record number, gender,
and date of birth.
•
Acquisition type (whether monitoring conventional 12 lead or EASI 12
lead) label.
•
Hospital name.
Patient Data Review
6-47
Export Data to Holter System
Export Data to Holter System
Overview
For Information Centers connected to the M3154 Database Server the
Information Center provides the ability to export ECG waveform data from the
Information Center to an Zymed Holter for Windows™ - Model 2010 with
version 2.0 software or higher. This allows a clinician to order holter analysis on
ECG data acquired by the Information Center thereby eliminating the need to
have the patient monitored separately by patient-worn holter monitor prior to the
analysis.
The patient must be admitted before you can export their data to the holter
system. You can only initiate one data export at a time. If you initiate a data
export while one is in progress the Information Center presents you with a
dialog box where you can choose to terminate the export in progress or allow the
export in progress to continue.
You can send up to 48 hours of stored data. The time it takes to export the data
to the holter system can vary and could take several minutes depending upon the
amount of data that was requested.
Note—If your patient will be changing between standard and EASI lead
placement you should perform an export of data before changing the type of
monitoring.
Task
Summary
To export a patient’s ECG data to a holter system for analysis perform the
following steps:
Step
6-48
Action
1
Click the All Controls button from the task bar on the bottom of the
window. The All Controls window displays
2
Under Configuration and Support click the Holter Export button.
The Holter Export window displays.
3
Select the patient for which you are exporting data by selecting the
name from the drop-down list on the top left of the Holter Export
window.
Patient Data Review
Export Data to Holter System
Step
Action
4
If you would like to have a physician’s name appear on the holter
report, type a 1- to 19-character physician’s name in the Physician
field.
5
If you would like to have an explanation for requesting this export
appear on the holter report, type a 1- to 23-character explanation in
the Test Reason field.
6
Specify the amount of data you want to send to the holter system for
analysis. The choices that are available for selection depend upon the
total amount of ECG data currently stored for this patient.
7
Click the Export button to send the data to the holter system. If an
export of data is already in progress a dialog box displays.
If you want to
Then
Cancel the export in
progress
1.Click the Stop Export button. The
export in progress stops and you return
to the Holter Export window.
Note—If you are not sure who initiated
the export do not click the Stop Export
button unless you are certain the data
does not need to be sent.
2. Click the Export button. The export
you initiated continues.
Continue the export
already in progress
1.Click the OK button. The export in
progress continues and you return to
the Patient Window.
2. Try the export again later by repeating
Steps 1 through 8.
Patient Data Review
6-49
Changing the Waves that are Stored
Step
8
Action
You can check the status of the transfer in the Transfer Status
window by clicking the Transfer Status button in the All Controls
window.
Changing the Waves that are Stored
Overview
You can select the waves that are stored for a patient in the data review
applications.
You can select the waves for Wave Review, and you can select the waves for
alarms automatically stored in Alarm Review as well as waves for user-saved
strips. Waves are changed in the Stored Waves Window.
Task
Summary
Change the stored waves by performing the following steps:
Step
1
6-50
Patient Data Review
Action
On the Patient Window for the appropriate sector, click on the All
Controls button, then on Stored Waves.
Changing the Waves that are Stored
Step
2
Action
There are two tabs:
Click Continuous Waves to select the waves stored in full
disclosure (Wave Review) and for strips saved to Alarm Review
from Wave Review and Event Review.
Click Alarm Waves to select the waves saved in Alarm Review as
well as strips saved by the action of the patient sector button (if
configured).
Note—If Primary or Secondary is a wave in one of the other
selections, that wave is only stored once.
3
Select each wave by clicking on the parameter in the list.
Note—Clicking the Unit Settings button changes the settings to the
unit defaults. Clicking the Restore Settings button reverts to the
settings that were in place before any changes were made.
Note—This application affects the stored waves. To change the waves that are
displayed from the IntelliVue Patient Monitor, CMS or V24 and V26 bedside
monitor, you must change the system waves. The waves that are displayed from
M3 monitors are fixed.
Patient Data Review
6-51
Scheduled Reports
Scheduled Reports
Overview
The Scheduled Reports windows allow you to schedule and print patient reports
on demand or on a regularly scheduled basis. The patient must be admitted
before any reports can be scheduled and initiated. Access the Scheduled Reports
windows by clicking Scheduled Reports on the All Controls window.
From the Scheduled Reports window you can set up and print the following
reports for a patient by selecting the appropriate tab on the top of the window:
•
•
•
•
•
•
All Reports
All Reports (see page 6-52)
Trend Report (see page 6-54)
Alarm Report (see page 6-56)
Event Report (see page 6-57)
Wave Report (see page 6-58)
Summary Report (see page 6-60)
Use this window to generate one or more reports to be printed on a scheduled
basis for the currently selected patient.
Note—To see the current settings for a particular report click on the appropriate
report tab on the top of the window. You can then customize the settings and
print the report from the window that displays.
6-52
Patient Data Review
Scheduled Reports
Perform the following steps to schedule reports for the current patient:
Step
Action
1
Select the reports to print for this patient by clicking in the checkbox
next to the report name. A checkmark in the checkbox selects the
report for printing.
2
Indicate the time for which you want reports to start by specifying
the time in the Start Time field. Specify the hour by clicking on the
hour in the Start Time then clicking on the up and down arrows
until the desired time displays. Specify the minutes by clicking on
the minutes in the Start Time then using the up and down arrows
until the desired minutes display. Minutes are specified in 15 minute
increments.
Note—You can also specify start time by clicking on the hour or
minutes then typing the time using the keyboard.
3
Indicate how often you want the reports to occur by selecting a time
from the Frequency drop-down box.
4
If you would like to print the selected reports now click Print
Report Now button.
Click the Unit Settings button to cancel any changes made in this
window and return the scheduled reports settings back to unit
defaults.
Patient Data Review
6-53
Scheduled Reports
Trend
Report
Use the Trend Report window to set up and print a Trend Report for the current
patient. The amount of data that the Trend Report will contain depends on the
time frequency specified in the All Reports window. For example, if the time
frequency is 8 hours the report will only show data for the previous 8 hours.
Perform the following steps to set up and print a Trend Report for this patient:
Step
6-54
Action
1
Specify the maximum number of pages this report should contain by
selecting the number of pages from the Maximum Pages dropdown list. Select Unlimited if you want to print all possible trend
data regardless of length. When you specify a specific number of
pages the report will stop when that number of pages is reached
regardless of whether there is more data or not.
2
Select the trend group for this report from the Trend Group dropdown list.
Patient Data Review
Scheduled Reports
Step
Action
3
Specify whether you want the report to print in tabular or graphical
format by clicking on the appropriate Report Type radio button.
Click Tabular if you want to print the trend data in rows and
columns suitable for charting purposes. The tabular Trend Report
contains:
• Time labeled columns
• Parameter label for each row
• Parameter average value for each trend corresponding to time
column (aperiodic values show as the latest value for that
column)
• Date and time of time cursor at top of display
• Highlighted row indicating time cursor.
Click Graphic Trend if you want to print the report with the 5
graphic trends from the Trend Group. The graphic Trend Report
contains:
• Parameter label(s) for each trend line
• Parameter value(s) for each trend corresponding to current time
cursor position
• Date and time of time cursor at top of display
• Vertical line time cursor indicator
• Parameter scale indicators (same as scale on display at time of
print request)
• Time line
4
For tabular reports specify the trend interval by selecting the time
from the Trend Interval drop-down list.
5
If you would like to print the Trend Report now click Print Report
Now button. You can click the Unit Settings button to cancel any
changes made for this patient and return the Trend Report settings
back to unit defaults.
Patient Data Review
6-55
Scheduled Reports
Alarm
Report
Use the Alarm Report window to set up and print a Alarm Report for the current
patient. The amount of data that the Alarm Report will contain depends on the
time frequency specified in the All Reports window. For example, if the time
frequency is 8 hours the report will only show data for the previous 8 hours.
Perform the following steps to set up and print a Alarm Report for this patient:
Step
6-56
Action
1
Specify the maximum number of pages this report should contain by
selecting the number of pages from the Maximum Pages dropdown list. Select Unlimited if you want to print all possible alarm
data regardless of length. When you specify a specific number of
pages the report will stop when that number of pages is reached
regardless of whether there is more data or not.
2
Select the alarm group for this report from the Alarm Group dropdown list.
3
Specify whether you want an alarm report or strip report by clicking
on the appropriate Report Type radio button.
4
If you would like to print the Alarm Report now click Print Report
Now button. You can click the Unit Settings button to cancel any
changes made for this patient and return the Alarm Report settings
back to unit defaults.
Patient Data Review
Scheduled Reports
Event
Report
Use the Event Report window to set up and print a Event Summary Report for
the current patient. The Event Summary Report contains:
•
A graphic trend of HR for the most recent 24 hours.
•
A graphic trend of PVC for the most recent 24 hours.
•
A tabular trend for HR (max, median, min) for the most recent 24 hours.
•
A tabular trend of event counts for each of the event group entries for the
displayed event group for the most recent 24 hours.
•
For the selected event group, the most recent strips of of each event type.
Perform the following steps to set up and print a Event Report for this patient:
Step
Action
1
Specify the maximum number of pages this report should contain by
selecting the number of pages from the Maximum Pages dropdown list. Select Unlimited if you want to print all possible event
data. When you specify a specific number of pages the report will
stop when that number of pages is reached regardless of whether
there is more data or not.
2
Select the event group for this report from the Event Group dropdown list. The report will print all events configured for this event
group.
3
If you would like to print the Event Report now click Print Report
Now button. You can click the Unit Settings button to cancel any
changes made for this patient and return the Event Report settings
back to the unit defaults.
Patient Data Review
6-57
Scheduled Reports
Wave
Report
Use the Wave Report window to set up and print a Wave Report for the current
patient.
Perform the following steps to set up and print a Wave Report for this patient:
Step
Action
1
Specify the maximum number of pages this report should contain by
selecting the number of pages from the Maximum Pages dropdown list. Select Unlimited if you want to print all possible wave
data regardless of length. When you specify a specific number of
pages the report will stop when that number of pages is reached
regardless of whether there is more data or not.
2
Specify whether you want a wave report, a strip report or a 12 lead
report by clicking on the appropriate Report Type radio button.
Wave Report prints a compressed full disclosure wave report. The
waves that the report will contain depend on the waves selected in
the Wave Report Settings field and whether waves have been
stored for the given time interval.
Strip Report prints a periodic sample of the full disclosure waves
for this patient. The waves that appear depend on what was stored
for the specified time interval. The time between each strip on the
report is determined by the time specified in the Strip Interval
field. Each strip is approximately 6 seconds.
Twelve Lead prints a report of the EASI wave data stored for this
patient. This report is a single page report containing a single 12lead derivation of the EASI waves for this patient at time of the
report.
6-58
3
If you selected Wave Report in Step 2, specify the waves (1 to 4) to
be included in the report by clicking in the appropriate checkbox(s)
in the Wave Report Settings field. The waves available here
correspond to the waves selected in the Stored Waves window.
4
If you selected Wave Report in Step 2 indicate the number of
minutes of waves to compress per page by selecting the minutes
from the Minutes per Page drop-down list.
Patient Data Review
Scheduled Reports
Step
Action
5
If you selected Strip Report in Step 2 indicate what the time interval
between strips should be by selecting a time from the Strip
Interval drop-down list.
6
If you would like to print the Wave Report now click Print Report
Now button. You can click the Unit Settings button to cancel any
changes made for this patient and return the Wave Report settings
back to unit defaults.
Patient Data Review
6-59
Scheduled Reports
Summary/
Unit Report
Use the Summary Report window to set up and print either an individual patient
report or a unit report for all patients currently admitted and assigned to this
Information Center.
Perform the following steps to set up and print a Summary Report:
Step
1
6-60
Patient Data Review
Action
Specify whether to print a Patient Report or a Unit Report by
clicking on the appropriate radio button in the Report Type field.
A Patient Report prints a report for the current patient and contains:
• Patient name and ID
• Bed label
• Care group status
• Height, weight, sex, age, patient type and paced setting
• Screen notes
• Current vital signs (latest 1 minute average value), rhythm
status and ectopic status
• Active alarms and INOP text
• Any deviations of this patient’s current settings as compared to
the unit settings
• A 6 second 25 mm/sec sample strip of the first two stored
waveforms for this patient at time of report.
Unit Report prints a multi-page report for all patients currently
admitted and assigned to this Information Center. For each patient
the report contains:
• Patient name and ID
• Bed label
• Care group status
• Height, weight, sex, age, patient type and paced setting
• Screen notes
• Current vital signs (latest 1 minute average value), rhythm
status and ectopic status
• Active alarms and INOP text
• Any deviations of this patient’s current settings as compared to
the unit settings
• A 6 second 25 mm/sec sample strip of the first two stored
waveforms for this patient at time of report.
Scheduled Reports
Step
2
Action
If you are printing a unit report specify whether to print the report in
Compact format or One Page Per Patient format by clicking on
the appropriate radio button in the Unit Report Settings field.
In Compact format, the report does not include the wave sample and
all patient information is packed into the fewest number of pages. In
One Page Per Patient format the wave sample is included and each
patient report appears on a single page.
3
If you would like to print the Summary Report now click Print
Report Now button. You can click the Unit Settings button to
cancel any changes made for this patient and return the Summary
Report settings back to the unit defaults.
Patient Data Review
6-61
Information Center Web Access
Information Center Web Access
Overview
The Information Center Web access option provides ‘patient window-like’ web
viewing of near-realtime waves, parameters and alarms without controls for
patients across care units using standard PC browsers. It provides the current
alarm and INOP states for the patient, but does not provide an alert notification
function. It also allows for web viewing of all Information Center Review
Windows of all retrospective data for patients across care units that are on
separate database servers. The hospital’s LAN infrastructure or intranet serves as
the connection between the Database Server and the remote workstation. You
can view data formatted for Web access, using one of the following supported
browsers:
•
•
Microsoft Internet Explorer, version 4.0, Service Pack 1, or higher.
Netscape Navigator (revision 4.7 or higher).
For information on setting up the system, please see the Information Center
Service Manual.
Note—The Information Center Web can only be used when the M3154 Database
Server is operable and the Information Center Web functionality is enabled.
Warning
Web Access should not be used for primary monitoring. Near real-time
information is delayed slightly from the primary monitoring data. The
delay is generally minimal. Always refer to your primary monitoring source
(bedside monitor or Information Center) for current real-time data.
6-62
Patient Data Review
Information Center Web Access
Intended
Use
The Information Center Web application is intended for read-only viewing of
patient’s physiologic data, at remote locations via the hospital’s HIS LAN web
access (hospital intra/internet). Including review of existing Alarm, Event,
Wave, Trend, and ST segment (adults) to gain information for treatment, to
monitor adequacy of treatment, or to exclude causes of symptoms. The
Information Center Web is a retrospective application that provides access to
near real-time physiologic data or alarms, and is not intended to support realtime event annunciation or triage of real-time clinical situations. All access to
data is read-only.
The clinical use of the information provided by the Information Center Web is to
supplement information gathered through other means.
Note—You must use the 25 mm/s annotation (0.2s), rather than a ruler, on an
image on the Information Center Web screen or in printed reports from the
Information Center Web to make accurate measurements on waveforms.
Accessing
the
Information
Center Web
The method of accessing the Information Center Web depends on how your
system is set up. Once the connection to the Database Server is made, the
Information Center Web log-on screen is displayed. The functionality of
Information Center Web applications is comparable to the Multilead ECG/12Lead ECG, Alarm Review, Event Review, Trend Review, Wave Review, ST
Review, 12-Lead Review and Captured 12-Lead Review applications on the
Information Center.
Access the Information Center Web by performing the following steps:
Step
Action
1
Log on to your account, and access the Information Center Web
Logon screen, using the URL supplied by your system
administrator.
2
On the log-on screen:
In the User Name field, enter your first and last name.
In the Password field, enter the password supplied by your system
administrator.
Patient Data Review
6-63
Information Center Web Access
Step
3
Action
The Patient List is displayed, containing all beds in the clinical units
for which you have access and are being actively monitored by an
Information Center. If the patient has been admitted to the central,
the name and Medical Record Number are displayed along with the
bed label.
Click on the patient or bed you want.
Before you view retrospective data, verify that the patient name
displayed is the one you chose.
6-64
4
Before you view retrospective data, verify that the patient name
displayed is the one you chose. The bed label and patient name/
Medical Record Number (if available) is displayed at the top the
window (and is displayed at the top of all other application
windows).
5
Select the application from the list at the left.
Navigation buttons appear on each application to enable you to view
the desired data. The applications are equivalent to the Data Review
applications at the central, with the same specifications, such as
maximum number of alarms available, number of hours of
waveform data, etc.
See the pages that follow for instructions on individual applications.
6
To select a different patient, click on Patient List to get the list of
all beds on the Database Server or on the Unit to get a list of beds in
a specific unit.
7
To end the session, click on Logout, at the left.
Patient Data Review
Information Center Web Access
Notes on Use
•
•
•
•
•
Multilead
ECG
Controls at the top of the review windows allow you to view data in
various ways. After changing a setting, you must click the Update button
to have it take effect.
Settings selected in one application persist for other applications. That is,
if you select a time focus in Trend Review, when you go to ST Review,
the data will have the same time focus. The setting remains until you
change it or select another patient.
If more waves or parameters than can be displayed on one page exist the
More Data button displays on the right side of the window. Click the
button to see the next page of waves or parameters.
To print all of the content in a report, in the File menu, go to Page Setup,
and change both the Left and Right margins to 0.2”, and select
“Landscape” when printing.
The browser controls, such as Back, Refresh, Save, Print, and Stop
operate as they normally do with other web applications.
Note—To refresh the application window, right-click in the window, and
click Refresh on the popup menu.
This screen displays a snapshot view of all available ECG leads, based on the
monitoring device. To retrieve the latest data, click the Update button.
If the patient is monitored by EASI ECG, the 12 derived leads will be shown.
Note—This may take a few seconds while the data is collected.
You can change the format, if desired, by clicking either International or
Cabrera.
Alarm
Review
The default is ALL ALARMS. You can click on the alarm filter to select the
specific group of alarms to view, for example, RED ALARMS.
•
•
•
The alarms will appear in chronological order in a tabular list with the
number and count for that alarm type, date/time of the alarm and alarm
text.
Click on the date/time of each alarm to view the alarm strip; use the arrow
keys to view the entire strip.
Click Previous Alarm or Next Alarm to move back and forth sequentially
within the list of alarms or use the tabular list.
Patient Data Review
6-65
Information Center Web Access
Trend
Review
Click on the trend group label to access the available trends for the group, then
on the trend you want. Click on an individual parameter to display the trend for
that parameter
•
•
Displaying
Data in Tabular
Format
You can display the trend information for continuous measurements in a tabular
format by selecting All Parameters, at the bottom of the Trend Review screen.
•
•
•
•
•
Event
Review
The data for the most recent hour is displayed when you enter the screen.
To select data for a different one-hour period, click on the appropriate
button at the top of the screen.
The data samples are displayed at a one-minute resolution.
Note—The cell will be blank if during the one-hour period, there is no
data available (for example, if the parameter was turned off).
To display a trend plot for a parameter at a specific time, click on the
parameter name in the leftmost column. This brings up Trend Review
with the trend plot for that parameter and time.
Tabular review time duration can be changed by clicking one of the time
buttons at the top of the display (there are always 24 buttons – one for
each hour)
The Event Review screen displays the pre-configured event groups.
•
•
6-66
Click on the Duration control to bring up a list of time spans (All
available, 24, 12, 8, 4, or 1 hour). “All Available” shows a trend covering
all data stored in the database for the selected parameter(s).
Click on a trend to change the time focus (indicated by the vertical
cursor).
Patient Data Review
To get greater detail for an event, click on (or near) the event marker
itself. (To make selection of the event easier by zooming in to a shorter
time period, change to a shorter duration.)
You will get the Start Time, End Time, and text of the event, as well as a
scrollable waveform strip at the selected time. You can then select a
different time by clicking on the timeline.
Information Center Web Access
Wave
Review
The Wave Review screen displays a 30-minute compressed waveform; each
segment has 2 minutes of data.
•
•
ST Review
The ST Review screen displays a trend plot and all available ECG wave
segments. The number of leads displayed depends on the monitoring device.
•
•
•
•
•
12-Lead
Review
To see the segment in detail, click on it. You will get a strip with up to
four waves at 25 mm/s with beat labels and parameters.
To select a different time, click on the timeline.
When this application is accessed, the trends displayed are the ones
selected in Trend Review. If no trend has been selected, the default plot is
Heart Rate. The time focus and plot duration were the ones selected in
another Information Center Web application. If none have been set, the
defaults are the current time and “All Available”.
To change the time focus, click anywhere on the trend plot. The ECG
waves will reflect the new time.
To change the trends, click on Left Parameter or Right Parameter, and
select from the list.
To set a baseline for a reference ST, click on Set Baseline. Then, to
observe ST changes between the baseline and another point in time, select
another time focus. The baseline waves will be superimposed over the
waves for the new time focus, and the ST values will show the values for
the baseline, the new time focus, and the delta value.
You can change the format, if desired, by clicking either International or
Cabrera.
The 12-Lead Review screen displays a retrospective review of the 12 EASI
derived ECG waves for EASI enabled bedside monitors and telemetry when you
click the 12-Lead Review button on the left side of the window or the results
of 12 Lead Captures performed at an IntelliVue Patient Monitor when you click
the Captured 12-Lead button on the left side of the window.
•
Controls for layout, wave speed, wave size (x1/2, x1, x2) and
International/Cabrera are on the top of the window.
Patient Data Review
6-67
Information Center Web Access
6-68
Patient Data Review
This chapter describes the use of ST Review for bedsides at the Information
Center. For ST monitored bedside patients refer to your bedside user
documentation for information on ST monitoring. For ST monitored telemetry
patients refer to your telemetry user’s manual. This chapter includes the
following sections:
•
•
•
•
Overview . . . . . . . . . . . . . . . . . . . . . . . . . . . . . . . . . . . . . . . . . . . . . . . . 7-2
Enabling ST Review for Bedside Monitors . . . . . . . . . . . . . . . . . . . . . 7-5
CANNOT ANALYZE ST INOP . . . . . . . . . . . . . . . . . . . . . . . . . . . . . 7-7
ST Data Summary . . . . . . . . . . . . . . . . . . . . . . . . . . . . . . . . . . . . . . . . . 7-8
ST for Bedside Monitors
7-1
Introduction
7
ST for Bedside Monitors
Overview
Overview
The Information Center allows you to review the ST waves and ST trends in the
ST Review window for ST monitored bedside patients.
The ST/AR ST algorithm is only available for adult monitored patients who are
using ST monitoring at their bedside or are monitored in the diagnostic
bandwidth at the bedside monitor. With EASI monitoring, ST analysis is
performed on up to 12 leads and an additional value of ST index is calculated
and displayed. Assessment of EASI-derived 12-lead ST measurements is
recommended for adult patient that meet the following parameters:
•
•
•
•
Ages: 33 to 82 years
Heights: 147 to 185 cm (58 to 73 in)
Weights: 53 to 118 kg (117 to 261 lbs)
Height to Weight Ratios: 1.41 to 2.99 cm/kg (0.25 to 0.54 in/lb)
All ST analysis and ST alarms for bedside monitors will be performed by the
bedside monitor. Refer to you the documentation that comes with your bedside
monitor for information on setting up ST monitoring at the bedside. ST analysis
at the Information Center has no impact on the analysis performed at the
bedside. In addition, when using EASI monitoring at the bedside you can
additionally get 12 lead ST and ST Index using the Information Center ST/AR
ST algorithm. This information is for ST review and does not generate alarms.
7-2
ST for Bedside Monitors
Overview
The
Measurement
The ST measurement for each beat complex is the vertical difference between
two measurement points. The isoelectric point provides the baseline for the
measurement and the ST point provides the other measurement point. It is
positioned with reference to the J-point. A positive value indicates ST segment
elevation; a negative value indicates depression.
R-WAVE PEAK
AT 0 MSEC
J POINT
T
P
DIFFERENCE =
ST VALUE
Q
S
ST
ISO ELECTRIC
POINT
MEASUREMENT
DEFAULT =
POINT
-80 MSEC
DEFAULT =
J+60 MSEC
ST for Bedside Monitors
7-3
Overview
Information
Center’s ST/
AR ST
Algorithm
The Information Center ST/AR ST algorithm analyzes ECG signals to classify
the heart beats. Only beats classified as normal or Supraventricular (atrially
paced) are used to calculate ST elevations and depressions.
Displayed
ST Data
ST data displayed in the Patient Sector and Patient Window is based on ST
measurements acquired by the bedside monitor. For bedside generated data you
can view ST data in ST Review, Trend Review, and Event Review windows.
For Information Center generated data you can view ST data in ST Review and
Trend Review.
EASI ST
Analysis
The Information Center generated ST values presented in the patient sector and
Patient Window for EASI derived leads is “STindx”. STindx is a summation of
three ST segment measurements, using the leads that can indicate ST segment
changes in the different locations of the heart:
1
2
3
4
5
EASI
7-4
The ST/AR ST algorithm processing includes special ST filtering, beat selection
and statistical analysis, calculation of ST segment elevations and depressions,
and lead reconstruction and wave generation.
•
•
•
anterior lead V2
lateral lead V5
inferior lead aVF
ST for Bedside Monitors
Enabling ST Review for Bedside Monitors
Enabling ST Review for Bedside Monitors
Overview
The ST Setup Window allows you to turn ST Monitoring on to make data
available in the ST Review window. The ST Review window displays ECG
beats and ST segment values for patients monitored by bedsides. The ST
Review window is for review purposes only. You would turn ST on if you are
doing ST analysis at the bedside monitor.
When ST analysis is off at the bedside you can only turn ST on at the
Information Center if you are using a diagnostic bandwidth setting for ECG
monitoring. However, you will not have ST analysis or ST alarms unless ST
monitoring is also on at the bedside monitor. You should adjust ST
measurement points and ST alarms at the bedside. Refer to your bedside
documentation for instructions.
Adjusting
Measurement
Points
To more closely reflect how you have adjusted measurements points at the
bedside monitor, the ST Setup Window allows you to turn on ST and to adjust
the ST measurement points. This adjustment only effects the Information
Center ST analysis it has no impact on ST analysis performed at the bedside
monitor.
There are three measurement cursors:
•
The ISO measurement cursor positions the isoelectric point in relation
to the R-wave peak.
•
The J-point cursor positions the J-point in relation to the R-wave peak.
The purpose of the J-point is to correctly position the ST measurement
point.
•
The ST measurement cursor positions the ST point a fixed distance from
the J point.
ST for Bedside Monitors
7-5
Enabling ST Review for Bedside Monitors
To enable and use ST Review for bedsides perform the following steps:
Step
Action
1
Turn ST monitoring on at the bedside and adjust the ST
measurement points for monitoring and alarming. Refer to your
bedside documentation for instructions.
2
Turn ST monitoring on at the Information Center by performing the
following:
a. From the All Controls window click on the ST Setup button.
b. From the ST Setup window click the ST On button to turn ST
monitoring on at the Information Center.
3
If you need to adjust the ISO (isoelectric) point, position the bar in
the middle of the flattest part of the baseline (between the P and Q
waves or in front of the P wave) and use the arrow keys to make the
adjustment.
R
T
P
ISO
POINT
4
Q
S
Adjust the J point, if necessary, by positioning the bar at the end of
the QRS complex and the beginning of the ST segment.
R
T
P
Q
7-6
ST for Bedside Monitors
S
J POINT
CANNOT ANALYZE ST INOP
Step
5
Action
Adjust the ST point, if necessary, by using the J point as an
“anchor” and using either J + 60 or J + 80 so that the bar is at the
midpoint of the ST segment.
R
T
P
Q
6
S
ST POINT
Access the ST Review window by clicking the ST Review button
on the All Controls window. The ST Review window displays. The
top portion of the window contains the Information Centergenerated ST snippets. The bottom portion of the window contains
the bedside-generated trended ST parameter measurements along
with the STindx value for EASI users.
See “ST Review” on page 6-38 for information on using the ST
Review window and establishing a ST reference beat (baseline).
CANNOT ANALYZE ST INOP
The ST alarms are not generated by the Information Center they are generated
by the bedside monitor. The Information Center could generate the INOP
“CANNOT ANALYZE ST”. The INOP is generated when ST is turned on at the
Information Center but not at the bedside and the ECG filter is not set to
Diagnostic at the bedside. The calculation of STindx does not occur and the
INOP CANNOT ANALYZE ST displays at both the Information Center and the
bedside. Refer to your bedside user manual for information on bedside generated
ST alarms.
ST for Bedside Monitors
7-7
ST Data Summary
ST Data Summary
The table below details where ST related data is available when ST is turned on
at the Information Center and on at the bedside.
7-8
Data
At Information
Center
At Bedside
ST measurement
adjustment
Adjusts Information
Center ST
measurement only.
Adjusts bedside ST
measurement only.
ST Alarm limit
adjustment
N/A
Yes
ST Alarms
ST Alarms and INOPs
are generated by the
bedside are displayed
at the Information
Center.
ST Alarms and INOPs
are generated and
displayed at the bedside.
ST Parameters from
Information Center
In ST Review only.
N/A
ST Parameters from
bedside
Yes
Yes
STindx
Yes (EASI only)
N/A
ST Snippet Review
Reviews Information
Center generated ST
snippets only.
Reviews bedside
generated ST snippets
only.
ST parameters in Trend
Review
Information Center
displays both bedside
ST parameters and
Information Center
generated STindx.
Bedside shows only
bedside generated
parameters.
ST for Bedside Monitors
This chapter describes the using the integrated Data Critical Statview™ paging
system with the Information Center. It includes the following sections:
•
•
•
•
•
•
•
•
Introduction. . . . . . . . . . . . . . . . . . . . . . . . . . . . . . . . . . . . . . . . . . . . . . 8-2
Setting Up Caregivers and Receivers . . . . . . . . . . . . . . . . . . . . . . . . . . 8-3
Removing Receivers . . . . . . . . . . . . . . . . . . . . . . . . . . . . . . . . . . . . . . . 8-5
Changing a Caregiver/Receiver Assignment . . . . . . . . . . . . . . . . . . . . 8-6
Assigning Patients to Caregivers . . . . . . . . . . . . . . . . . . . . . . . . . . . . . 8-7
Automatic Alarm Paging . . . . . . . . . . . . . . . . . . . . . . . . . . . . . . . . . . . 8-9
Manual Paging . . . . . . . . . . . . . . . . . . . . . . . . . . . . . . . . . . . . . . . . . . 8-11
Sending Text Messages . . . . . . . . . . . . . . . . . . . . . . . . . . . . . . . . . . . 8-12
Alarm Paging
8-1
Introduction
8
Alarm Paging
Introduction
Introduction
The integrated Data Critical Statview™ paging system is available (in limited
geographies) for Information Centers connected to the M3154 Database Server.
The paging system provides the clinician with secondary notification of patient
alarms and wave snippets on a small paging device (receiver). Specifically, it
provides automatic alarm and manual paging on any admitted patient to a
clinician-worn receiver.
Warning
The paging system is a secondary alarm notification system. It is not for
primary notification of alarms, physiological, or demographic data.
Clinicians using the paging system must remain within monitoring distance
of the primary alarm notification device. The primary alarm notification
device is the bedside monitor if there is one. If there is no bedside monitor
the primary alarm notification device is the Information Center.
At the Information Center you can:
•
•
•
•
Assign caregivers (clinicians) to receivers and patients to caregivers.
Specify which alarms will generate an automatic page.
Send a text only message to the clinician-worn receiver.
Manually send a page to a clinician-worn receiver from Fast Alarm
Review, Alarm Review, and the Patient Window.
The paging system acquires patient alarm data from the bedside or the telemetry
monitoring system and relays it to the receiver. From the receiver the clinician
can scroll through patient information such as name, bed number, alarm
condition, heart rate, and primary ECG wave form.
Depending on how your system is set up, if the alarm has not been silenced at
the Information Center after a pre-configured period of time (5-120 seconds) the
paging system sends out another page. This page includes all of the information
from the initial page, with an added indication on the receiver that it is a
reminder page and not a new alarm (see the StatView Receiver User’s Guide for
information on using the StatView receiver). By default the system sends this
reminder page only once, but it can be configured to re-send the page every 'n'
seconds until the alarm is silenced.
8-2
Alarm Paging
Setting Up Caregivers and Receivers
Setting Up Caregivers and Receivers
Overview
Typically, the first step in the setting up the paging system is assigning
caregivers (clinicians) to receivers. This is done at installation but on occasion
you may need to set up additional caregivers to receivers, for example, if you
needed to add a new receiver.
Task
Summary
To assign caregivers to receivers perform the following steps:
Step
Action
1
On the All Controls Window click on the Paging Controls
button. The Caregiver Administration window displays.
2
Click on Caregiver Setup (Add/remove). The Caregiver Setup
window displays.
3
Click on Add Caregiver. The Add Caregiver window displays.
4
Enter the caregiver’s name in the Name field. Be sure the name you
specify in this field is unique.
Note—If a receiver is not assigned to a specific caregiver, then by
default that receiver will receive all alarm notifications.
5
Enter the 7-digit serial number for this clinician’s receiver in the
Receiver Number field.
Note—You can find the serial number on the label on the back of
the receiver.
8 Alarm
Paging
8 Alarm
Paging
Alarm Paging
8-3
Setting Up Caregivers and Receivers
Step
6
Action
The Information Center’s unit name displays in the Unit field. This
is a required field. If this clinician’s receiver will be assigned to a
different unit, specify that unit in the Unit field. You can specify up
to a 6-character unit name. Be sure the name you specify in this
field exactly matches the unit name and is no longer than 6
characters for the new Information Center.
Note—If the unit name is changed, the clinician’s receiver will only
be displayed at the Information Center for the unit you specify here.
7
Click on the Add button to assign the receiver to the caregiver
entered in Step 5.
Note—You can cancel changes you make by clicking the Reset
button before you hit the Add button.
8-4
Alarm Paging
8
Assign additional caregivers to the receivers, if desired, by repeating
Steps 5 through 7.
9
When you are done making caregiver/receiver assignments you can
return to the All Controls window by clicking the All Controls
button on the bottom of the screen.
Removing Receivers
Removing Receivers
Overview
You can remove a receiver from the system, for example for receivers that are
being repaired.
Task
Summary
To remove a receiver perform the following steps:
Step
Action
1
On the All Controls window click on the Paging Controls button.
The Caregiver Administration window displays.
2
Click Caregiver Setup (Add/Remove).
3
Click the Remove button for the receiver you wish to delete. The
Paging system removes the receiver number and caregiver name you
selected from the list.
4
Remove additional receivers, if desired, by repeating Step 3.
5
When you are done removing receivers from the list return to the
All Controls window by clicking the All Controls button on the
bottom of the screen.
8 Alarm
Paging
8 Alarm
Paging
Alarm Paging
8-5
Changing a Caregiver/Receiver Assignment
Changing a Caregiver/Receiver Assignment
Overview
You can change the caregiver currently assigned to a receiver, for example
during shift changes.
Task
Summary
To change the caregiver currently assigned to a receiver perform the following
steps:
Step
8-6
Alarm Paging
Action
1
On the All Controls window click on the Paging Controls button.
The Caregiver Administration window displays with a list of
caregiver/receiver assignments.
2
Click on Change Name for the receiver for which you wish to
assign a different caregiver.
3
Enter the caregiver’s name in the New Name field.
4
Click the Change button. The Paging system assigns the name
specified in Step 3 to this receiver.
5
Click Back to Caregiver Administration to return to the
Caregiver Administration window.
6
Change additional caregiver/receiver assignments, if desired, by
repeating Steps 3 through 5.
7
When you are done changing caregiver/receiver assignments you
can return to the All Controls window by clicking the All Controls
button on the bottom of the screen.
Assigning Patients to Caregivers
Assigning Patients to Caregivers
Overview
You can assign admitted patients to a caregiver(s) receiver from the Admit
window when admitting a patient or when updating patient information or from
the All Controls window by selecting Paging Controls.
Note—If an admitted patient has no assigned caregivers, ALL of the caregivers
currently setup will receive alarms for that patient.
Warning
Should you lose connection to the Database Server the paging system will
not be available. When the connection is restored all patient assignment to
caregiver/receivers will have been lost. You will need to re-assign all
patients to caregivers/receivers. All caregiver/receiver assignments,
however, remain intact in the event of loss of power.
When connection to the Database Server is lost the messages “operating on
local DB” and “paging is not available” display on top of the screen. See “If
Connection to the M3154/M3169 Database Server is Lost” on page 10-23
for additional information.
Task
Summary
From the Admit Window
To assign a patient to a caregiver when admitting a patient or when updating
patient information in the Admit window, perform the following steps:
Step
Action
From the Admit window, admit the patient on the Information
Center by entering the patient information then clicking the Admit
button.
2
From the Admit window click the Assign Pager button from the
task bar on the bottom of the screen.
3
Click Add an Assignment. The Paging system displays a list of
current caregiver/receiver assignments for this unit.
Alarm Paging
8 Alarm
Paging
8 Alarm
Paging
1
8-7
Assigning Patients to Caregivers
Step
Action
4
Click the Assign button for the caregiver/receiver you wish to
assign to this patient. The Paging system assigns the caregiver you
selected to this patient.
5
Assign additional caregivers to this patient, if desired, by repeating
Step 3.
Note—The transmitter requires up to 3 seconds to send the alarm
event information to each caregiver. In other words, when multiple
caregivers are assigned to a particular patient there will be a lag time
between when the first caregiver receives the page and when the last
caregiver receives the same page.
6
When you are done assigning caregivers, return to the All Controls
window by clicking the All Controls button on the bottom of the
screen.
From the All Controls Window
To assign a patient to a caregiver from the All Controls window perform the
following steps:
Step
8-8
Alarm Paging
Action
1
From the All Controls window click the Paging Controls button.
The Caregiver Administration window displays with a list of current
caregiver/receiver assignments.
2
Click Patient Assignment for the caregiver/receiver you wish to
assign to this patient.
3
Select the patient’s name from the list on the right side of the screen.
You can select more than one patient to assign to this caregiver by
holding down the Ctrl key and selecting more than one name from
the list.
Automatic Alarm Paging
Step
Action
4
Click the Assign button. The Paging system assigns the patient(s)
selected in Step 3 to this caregiver.
5
When you are done assigning caregivers to patients return to the All
Controls window by clicking the All Controls button on the
bottom of the screen.
Automatic Alarm Paging
Overview
If paging is available on your system, a third column will appear in the Record/
Store Alarms window where you can specify which alarms will generate an
automatic page for a patient.
Task
Summary
To specify which alarms will generate automatic pages perform the following
steps:
Step
Action
1
On the Patient Window click on the All Controls button.
2
On the All Controls Window click on the Record/Store/Page
button under Alarm Management and Setup. The Record/Store/Page
window displays.
8 Alarm
Paging
8 Alarm
Paging
Alarm Paging
8-9
Automatic Alarm Paging
Step
3
Action
Under the Page column specify which alarms will generate an
automatic alarm for this patient by clicking on the appropriate check
box to the left of the alarm. A check mark in the box selects the
alarm for automatic paging. No check mark in the Page box for an
alarm does not turn off the alarm it only prevents the automatic page
for an alarm from being sent to the receiver.
Note—You can return to the default settings for the unit by clicking
the Unit Settings button.
4
INOPs
8-10
Alarm Paging
When you are done specifying alarms click the All Controls button
to return to the All Controls window.
The INOPs that automatically generate a page to the receiver for a patient
depend on how your system was set up. They can be configured by your Philips
service representative or bio-medical engineer.
Manual Paging
Manual Paging
You can initiate a manual page from the Information Center by clicking on the
Page button from Fast Alarm Review, Alarm Review, or the Patient Window.
When you click on the Page button from any of the above applications a page is
sent to the caregiver (clinician) assigned to this patient.
Note—When a manual page is sent to the receiver the alarm time displayed on
the receiver is the time the manual page is initiated not the time the alarm
occurred.
When you initiate a
page from
the following data is sent
Patient Window
The last 6 seconds of the first waveform and
associated parameters currently displayed in the
Patient Window.
Note—Manual pages initiated from the Patient
Window within 1 minute of the previous
manual page for the same bed are not sent to the
pager.
The waveforms and parameters currently
displayed in the Fast Alarm Review window.
Six seconds of waveforms are provided; the 4
seconds preceding the alarm and 2 seconds
after.
Alarm Review
The waveforms and parameters currently
displayed in the Alarm Review window. Six
seconds of waveforms are provided; 4 seconds
preceding the alarm and 2 seconds after.
Alarm Paging
8-11
8 Alarm
Paging
8 Alarm
Paging
Fast Alarm Review
Sending Text Messages
Sending Text Messages
Overview
The integrated Data Critical Statview™ paging system allows you to send text
messages to the clinician worn receiver. This feature is useful for notifying staff
members of meetings or for relaying other textual information.
Task
Summary
To send a text message to a receiver perform the following steps:
Step
8-12
Alarm Paging
Action
1
From the All Controls window click the Paging Controls button.
The Caregiver Administration window displays.
2
Click Send Page for the receiver to which you wish to send a
message. The Send a Page window displays.
3
Click inside the text box and type a message of up to 150 characters.
Do not use the { or | characters.
4
When you are done typing your message click the Send button to
send the message to the receiver. The Send a Page Results window
displays indicating that the message was sent.
5
Send additional text messages to receivers, if desired, by clicking on
Caregivers on the top of the window then repeating Steps 2
through 4.
6
When you are done sending text messages click the All Control
button on the bottom of the screen to return to the All Controls
window.
Introduction
9
Information Center Configuration
This chapter provides the configuration items for which you can change factory
set defaults to accommodate the needs of your unit. It contains the following
sections:
Information Center Unit Settings Menus . . . . . . . . . . . . . . . . . . . . . . . 9-2
Arrhythmia Alarms Unit Settings . . . . . . . . . . . . . . . . . . . . . . . . . . . . . 9-6
Record/Store/Page Alarms Unit Settings . . . . . . . . . . . . . . . . . . . . . . 9-10
ST Unit Settings (telemetry) . . . . . . . . . . . . . . . . . . . . . . . . . . . . . . . . 9-13
Trend Groups Unit Settings . . . . . . . . . . . . . . . . . . . . . . . . . . . . . . . . 9-15
Event Groups Unit Settings . . . . . . . . . . . . . . . . . . . . . . . . . . . . . . . . 9-22
Stored Waves Unit Settings . . . . . . . . . . . . . . . . . . . . . . . . . . . . . . . . 9-27
Scheduled Reports Unit Settings . . . . . . . . . . . . . . . . . . . . . . . . . . . . 9-29
Recording Unit Settings . . . . . . . . . . . . . . . . . . . . . . . . . . . . . . . . . . . 9-39
Volume Control Unit Settings . . . . . . . . . . . . . . . . . . . . . . . . . . . . . . 9-40
Telemetry Frequency Unit Settings . . . . . . . . . . . . . . . . . . . . . . . . . . 9-41
Information Center Configuration
9-1
7 Configuration
•
•
•
•
•
•
•
•
•
•
•
Information Center Unit Settings Menus
Information Center Unit Settings Menus
Overview
9-2
The Information Center comes with factory set defaults that govern how your
system operates. You do not need to spend a lot of time setting up the system
because this has been configured for you. The Information Center does,
however, provide unit settings menus that contain configuration items for which
you can change the factory set defaults to accommodate the needs of your unit.
The Information Center provides the following unit settings menus:
Menu
Use to...
Arrhythmia Alarms Unit Settings
Change the arrhythmia alarm default
settings (limits and on/off status). See
“Arrhythmia Alarms Unit Settings” on
page 9-6 for a list of available
configuration choices.
Record/Store Alarms Unit
Settings
Change the default settings for recording
or storing alarms. See “Record/Store/Page
Alarms Unit Settings” on page 9-10 for a
list of available configuration choices.
ST Unit Settings
Change the ST measurement point defaults
and set all leads on or off. Change the ST
alarm limit default settings and set all
alarms on or off. See “ST Unit Settings
(telemetry)” on page 9-13 for a list of
available configuration choices.
Trend Groups Unit Settings
Change the trend groups configured for an
Information Center. You can configure up
to ten trend groups per Information Center.
Each group can contain up to ten
parameters, presented two at a time, in
trend charts. See “Trend Groups Unit
Settings” on page 9-15 for a list of
available configuration choices.
Information Center Configuration
Information Center Unit Settings Menus
Menu
Use to...
Event Groups Unit Settings
Change the event groups configured for an
Information Center. You can configure up
to ten event groups for an Information
Center. See “Event Groups Unit Settings”
on page 9-22 for a list of available
configuration choices.
Stored Waves Unit Settings
Change the default settings for the wave(s)
that are stored in Wave Review and Alarm
Review. See “Stored Waves Unit Settings”
on page 9-27 for a list of available
configuration choices.
Scheduled Reports
Change the default settings for scheduling
unit reports. See “Scheduled Reports Unit
Settings” on page 9-29.
Recording Unit Settings
Change the number of seconds pre and
post context for alarm and delayed
recordings as well as recording speed
(M3150). Change the recordings
destination (M3150, M3151).
Volume Control Unit Settings
Change the default level of the alarm
sound. See “Volume Control Unit
Settings” on page 9-40 for configuration
choices.
Telem Freq Unit Settings
Review the current RF Frequency settings
and tune in new transmitters. See
“Telemetry Frequency Unit Settings” on
page 9-41.
Information Center Configuration
9-3
Information Center Unit Settings Menus
Accessing
the Unit
Settings
Menus
9-4
You can access any of the Information Center unit settings menus by performing
the following steps:
Step
Action
1
On the Patient Window click on the All Controls button.
2
On the All Controls Window click on the Unit Settings button
under Configuration and Support.
3
On the Unit Settings box click on the button associated with the
group for which you want to change settings. For example, clicking
on the Arrhyth Alarms button accesses the unit settings menu and
settings for arrhythmia alarms or clicking on the Trends Groups
button displays the unit settings menu and settings for Trend
Groups.
4
Enter a password in the Password field.
5
Click on the OK button. The Information Center displays the unit
settings menu associated with the button you selected in Step 3.
Information Center Configuration
Information Center Unit Settings Menus
Using the
Unit
Settings
Menus
The Information Center unit settings menus provide the following options to
assist you in using the menus:
Option
Description
Store Settings
Click on this button to save any changes you
make to configuration settings.
Factory Defaults
Click on this button to display factory set
defaults.
Unit Settings
Click on this button to display the current
settings for an Information Center.
New Group
This option is available for the Trend Groups
and Event Groups Unit Settings menus. Use this
option to add a new group. You can configure up
to ten trend or event groups for an Information
Center. If the maximum of ten has been reached
you need to delete a group before adding a new
one.
Delete Group
This option is available for the Trend Groups
and Event Groups Unit Settings menus. Use this
option to delete a group for an Information
Center.
When you make changes to the unit settings for Arrhythmia Alarms, ST Alarms,
ST Setup, or Stored Waves the changes do not take effect on currently
monitored patients but will take effect once the patient is discharged. All other
changes take effect immediately.
Printing the
Unit
Settings
If the Print button is enabled on the Unit Settings windows, you can print a
report of the settings for that window (if a printer is available).
Information Center Configuration
9-5
Arrhythmia Alarms Unit Settings
Arrhythmia Alarms Unit Settings
Alarms Page 1
Item
Default
Choices
HR High Limit
Adult: 120 b/min
Pediatric: 160 b/min
Neonatal: 200 b/min
20 to 300 b/min
HR Low Limit
Adult: 50 b/min
Pediatric: 75 b/min
Neonatal: 100 b/min
15 to 295 b/min
Smart HR Limits at
Patient Connection
Off
On or Off
User Choice
Note—this item automatically assigns HR Smart Limits (see page 4-33)
Inside the Unit Settings
High Smart Limit is HR
+20 b/min
0 to +50 b/min
-20 b/min
0 to -50 b/min
0 b/min
0 to +50 b/min
Low Smart Limit is HR
0 b/min
0 to -50 b/min
Timeout Period, first
level
3 min
0, 1, 2, 3, 4, 5
min
Note—See page 4-33.
Low Smart Limit is HR
Note—See page 4-33.
Outside the Unit Settings
High Smart Limit is HR
Note—See page 4-33.
9-6
Information Center Configuration
Arrhythmia Alarms Unit Settings
Item
Default
Choices
User Choice
Timeout Period, second
level
10 min
0, 1, 2, 3, 4, 5,
10, 15 min
Analysis Mode
Multi-lead
Multiple Lead
Single lead
Arrhythmia Off
Asystole >=
Adult/Pedi: 4 sec
Neonate: 3 Sec
2.5 - 4 sec in 0.5
sec. intervals
V-Tach HR
Adult: 100 b/min
Pediatric: 120 b/min
Neonatal: 150 b/min
20 to 300 b/min
V-Tach >=
5 PVCs
3 to 99 PVCs
Extreme Tachy
Difference
20 b/min
0 to 50 b/min
Extreme Tachy Max
Adult: 200 b/min
Pediatric: 220 b/min
Neonatal: 240 b/min
150 to 300 b/min
Extreme Brady
Difference
20 b/min
0 to 50 b/min
Extreme Brady Min
Adult: 40 b/min
Pediatric: 40 b/min
Neonatal: 50 b/min
15 to 100 b/min
Alarm Reminder - Red
On
On or Off
Alarm Reminder Yellow
On
On or Off
INOP Reminder
On
On or Off
Information Center Configuration
9-7
Arrhythmia Alarms Unit Settings
Alarms Page 2
Note—If you have a basic arrhythmia capability configured, only the settings for
the basic yellow alarms are applicable (see “Levels of Arrhythmia Analysis” on
page 5-3).
Item
Default
Choices
Non-Sustain VT
On
On or Off
Vent Rhythm
On
>14 PVCs
On or Off
2 to 99 PVC
Run PVCs
On
On or Off
Pair PVCs
On
On or Off
R-On-T PVC
On
On or Off
Vent Bigeminy
On
On or Off
Vent Trigeminy
On
On or Off
PVC Rate
On
On or Off
Adult: >10 PVCs/min
Pediatric: >5 PVCs/min
Neonatal: >5 PVCs/min
1 to 99 PVCs/min
Multiform PVC
On
On or Off
Pacer Not Capture
On
On or Off
Pacer Not Pace
On
On or Off
Pause >
On
Adult/Pedi: 2.0 sec
Neonate: 1.5 sec
On or Off
1.5 - 2.5 in 0.25
sec. intervals
Missed Beat
On
On or Off
9-8
Information Center Configuration
User Choice
Arrhythmia Alarms Unit Settings
Item
Default
Choices
User Choice
SVT
On
On or Off
Adult: > 180 b/min
Pediatric: > 200 b/min
Neonatal: > 210 b/min
20 to 300 b/min
SVT Run >
On
5 SVs
On or Off
3 to 99 SVs
Irregular HR
On
On or Off
Some ECG Alrms
Off INOP
On
On or Off
Information Center Configuration
9-9
Record/Store/Page Alarms Unit Settings
Record/Store/Page Alarms Unit Settings
Note—If paging is available on your system, a third column displays in the
Record/Store Unit Settings window where you can specify the alarms which will
generate an automatic page for a patient. If paging is not available on your
system the Page column does not display in this window.
Red Alarms
Item
Default
Choices
User Choice
Asystole
Store: On
Record: On
Page: On
Record: On or Off
Page: On or Off
Record:
Page:
V-fib/tach
Store: On
Record: On
Page: On
Record: On or Off
Page: On or Off
Record:
Page:
V-tach
Store: On
Record: On
Page: On
Record: On or Off
Page: On or Off
Record:
Page:
Extreme Tachy
Store: On
Record: On
Page: On
Record: On or Off
Page: On or Off
Record:
Page:
Extreme Brady
Store: On
Record: On
Page: On
Record: On or Off
Page: On or Off
Record:
Page:
All Red Non-Arrh.
Store: On
Record: On
Page: On
Record: On or Off
(If Off, no recordings
are generated,
regardless of the
bedside setting. If On,
only the alarms set to be
recorded by the bedside
will generate
recordings.)
Page: On or Off
Record:
Page:
9-10
Information Center Configuration
Record/Store/Page Alarms Unit Settings
Yellow Alarms
If you have basic arrhythmia capability configured, the settings for the basic
yellow alarms are applicable (refer to “Levels of Arrhythmia Analysis” on page
5-3).
Item
Default
Choices
User Choice
HR
Store: On
Record: On
Page: On
Store: On or Off
Record: On or Off
Page: On or Off
Store:
Record:
Page:
Non-Sustain VT
Store: On
Record: On
Page: On
Store: On or Off
Record: On or Off
Page: On or Off
Store:
Record:
Page:
Vent Rhythm
Store: On
Record: On
Page: On
Store: On or Off
Record: On or Off
Page: On or Off
Store:
Record:
Page:
Run PVCs
Store: On
Record: On
Page: On
Store: On or Off
Record: On or Off
Page: On or Off
Store:
Record:
Page:
Pair PVCs
Store: On
Record: On
Page: On
Store: On or Off
Record: On or Off
Page: On or Off
Store:
Record:
Page:
R-On-T PVC
Store: On
Record: On
Page: On
Store: On or Off
Record: On or Off
Page: On or Off
Store:
Record:
Page:
Vent Bigeminy
Store: On
Record: On
Page: On
Store: On or Off
Record: On or Off
Page: On or Off
Store:
Record:
Page:
Vent Trigeminy
Store: On
Record: On
Page: On
Store: On or Off
Record: On or Off
Page: On or Off
Store:
Record:
Page:
Information Center Configuration
9-11
Record/Store/Page Alarms Unit Settings
Item
Default
Choices
User Choice
All Yellow Non-Arrh.
Note—If Record is Off,
no recordings are
generated, regardless
of the bedside/
telemetry setting. If
On, only the alarms set
to be recorded by the
bedside/telemetry will
generate recordings
Store: On
Record: On
Page: On
Store: On or Off
Record: On or Off
Page: On or Off
Store:
Record:
Page:
PVC Rate
Store: On
Record: On
Page: On
Store: On or Off
Record: On or Off
Page: On or Off
Store:
Record:
Page:
Multiform PVC
Store: On
Record: On
Page: On
Store: On or Off
Record: On or Off
Page: On or Off
Store:
Record:
Page:
Pacer Not Capture
Store: On
Record: On
Page: On
Store: On or Off
Record: On or Off
Page: On or Off
Store:
Record:
Page:
Pacer Not Pace
Store: On
Record: On
Page: On
Store: On or Off
Record: On or Off
Page: On or Off
Store:
Record:
Page:
Missed Beat
Store: On
Record: On
Page: On
Store: On or Off
Record: On or Off
Page: On or Off
Store:
Record:
Page:
Pause
Store: On
Record: On
Page: On
Store: On or Off
Record: On or Off
Page: On or Off
Store:
Record:
Page:
SVT
Store: On
Record: On
Page: On
Store: On or Off
Record: On or Off
Page: On or Off
Store:
Record:
Page:
9-12
Information Center Configuration
ST Unit Settings (telemetry)
Item
Default
Choices
User Choice
Irregular HR
Store: On
Record: On
Page: On
Store: On or Off
Record: On or Off
Page: On or Off
Store:
Record:
Page:
All ST Alarms
Store: On
Record: On
Page: On
Store: On or Off
Record: On or Off
Page: On or Off
Store:
Record:
Page:
ST Unit Settings (telemetry)
Item
Default
Choices
User Choice
Alarms/Leads/Parameters
ST Alarms On
On
On or Off
ST On
Off
On or Off
Smart Limits at
Patient Connection
Off
On or Off
ST Point -Selection
J + 60
J + 60, J + 80
ST Default Alarm Limit Settings
Singlelead High
2.0 mm
-19.8 to 20.0 mm
Singlelead Low
-2.0 mm
-20.0 to 19.8 mm
Multilead High
1.0 mm
-19.8 to 20.0 mm
Multilead Low
-1.0 mm
-20.0 to 19.8 mm
Information Center Configuration
9-13
ST Unit Settings (telemetry)
Item
Default
Choices
ST Smart Alarm Limit Settings
Inside the Unit Settings
Singlelead High
ST
+1.0 mm
0.0 to +4.0
Singlelead Low
ST
-1.0 mm
0.0 to -4.0
Multilead High
ST
+1.0 mm
0.0 to+ 4.0
Multilead Low
ST
-1.0 mm
0.0 to -4.0
Outside the Unit Settings
Singlelead High
ST +
0.0 mm
0.0 to + 4.0
Singlelead Low
ST
0.0 mm
0.0 to -4.0
Multilead High
ST +
0.0 mm
0.0 to + 4.0
Multilead Low
ST
0.0 mm
0.0 to -4.0
9-14
Information Center Configuration
User Choice
Trend Groups Unit Settings
Trend Groups Unit Settings
The list on the next pages contains the parameter choices for trend group
configuration. This list is followed by a table that provides the factory set
defaults. See Appendix A, “Trend Definitions” for definitions of the Trend
Parameters.
None
HR
PULSE
RESP
%SpO21
%SpO21
%SpO2, %SpO22
ABP
ABP SYS
ABP DIAS
ABP MEAN
PAP
PAP SYS
PAP DIAS
PAP MEAN
PAWP
CO
CCO
CVP
NBP
NBP SYS
NBP DIAS
NBP MEAN
P1
P1 SYS
P1DIAS
P1 MEAN
P2
P2 SYS
P2 DIAS
P2 MEAN
P3
P3 SYS
P3 DIAS
P3 MEAN
P4
P4 SYS
P4 DIAS
P4 MEAN
ART
ART SYS
ART DIAS
ART MEAN
Ao
Ao SYS
Ao DIAS
Ao MEAN
ICP
CPP
LAP
RAP
IUP
UAP
UAP SYS
UAP DIAS
UAP MEAN
UVP
ST-I
ST-II
ST-III
ST-aVL
ST-aVF
ST-aVR
ST-V1
ST-V2
ST-V3
ST-V4
ST-V5
ST-V6
ST-V
STindx3
ST-MCL
ST: I, II, III, aVR, aVL, aVF
ST: I, II, III
ST: II, aVF, V
ST: I, aVL, V
ST: V, MCL
ST: aVR, aVL, aVF
ST: V1, V2, V33
ST: II, III, aVF
ST: V4, V5, V63
ST: aVL, I, aVR
ST: II, aVF, III
ST: V1, V2, V3, V, MCL3
PVC COUNT
SVPB COUNTSV COUNT
PAUSE COUNT
PACED BEAT COUNT
PVC PAIR COUNT
PVC RUN COUNT
PACED RUN COUNT
SVPB RUN COUNT
PACER NOT CAPTURE COUNT
PACER NOT PACE COUNT
R-ON-T COUNT
MAX PVC RUN
% BIGEMINY
% TRIGEMINY
% PACED
% ATRIAL PACED
% VENT PACED
% AV PACED
% IRREGULAR HR
% POOR SIGNAL
Information Center Configuration
9-15
Trend Groups Unit Settings
NN SD4
PVC RATE
pNN505
V-V RATE MIN
V-V RATE MAX
PACED RATE MIN
PACED RATE MAX
S-S RATE MIN
S-S RATE MAX
ATRIAL PACED BEAT
COUNT
VENT PACED BEAT COUNT
AV PACED BEAT COUNT
NORMAL BEAT COUNT
ALL BEAT COUNT
V? RUN COUNT
MULTIFORM COUNT
V-V RATE
PACED RATE
S-S-RATE
Tblood
T1
T2
T1-T2
Tskin
Tcore
Trect
Tesoph
Tnaso
Tven
Tart
SaO2
SvO2
AWRR
PIP
TV
EtCO2
IMCO2
tcpCO2
FIO2
tcpO2
AWP
AWF
AUX
BIS
1
The first setting can be either continuous SpO2 monitoring (bedside monitors
or telemetry) or intermittent SpO2 monitoring (telemetry only). The second
setting is for telemetry only.
2
The left parameter is continuous SpO2 monitoring (bedside monitors or
telemetry), and the right parameter is intermittent SpO2 monitoring (telemetry
only).
3
Available only with EASI ECG capability.
4
Standard Deviation of NN RR intervals where RR intervals are less
than 4 seconds.
5A
measure of Heart Rate Variability (HRV); Percent of NNN beat sequences
with changes of R_R intervals greater than 50 msec.
9-16
Information Center Configuration
Trend Groups Unit Settings
.
The following trends are available for patients monitored by M3 bedside monitors:
HR
PULSE
RESP
%SpO2
ABP
ABP SYS
ABP DIAS
ABP MEAN
PAP
PAP SYS
PAP DIAS
PAP MEAN
PAWP
CVP
NBP
NBP SYS
NBP DIAS
NBP MEAN
P1
P1 SYS
P1DIAS
P1 MEAN
P2 (M4 only)
P2 SYS (M4 only)
P2 DIAS (M4 only)
P2 MEAN (M4 only)
ART
ART SYS
ART DIAS
ART MEAN
Ao
Ao SYS
Ao DIAS
Ao MEAN
ICP
CPP (M4 only)
LAP
RAP
IUP
UAP
UAP SYS
UAP DIAS
UAP MEAN
UVP
ST-I
ST-II
ST-III
ST-aVL
ST-aVF
ST-aVR
ST-V
ST-MCL
ST: I, II, III, aVR, aVL, aVF
ST: I, II, III
ST: II, aVF, V
ST: I, aVL, V
ST: V, MCL
ST: aVR, aVL, aVF
ST: II, III, aVF
ST: aVL, I, aVR
ST: II, aVF, III
Information Center Configuration
9-17
Trend Groups Unit Settings
Item
Default
VITAL SIGNS
Left Parameter
HR
%SPO2, %SPO2
ABP
PAP
T1
Right Parameter
NBP
RESP
None
CVP
Tblood
ARRHYTHMIA
Left Parameter
HR
PVC COUNT
PVC RUN COUNT
IRREGULAR HR
% PACED
Right Parameter
% POOR SIGNAL
None
None
None
None
9-18
Information Center Configuration
User Choice
Trend Groups Unit Settings
Item
Default
ST CHANGES
Left Parameter
STindx
ST: II,aVF,III
ST: V1,V2,V3,V,MCL
ST: V4,V5,V6
ST: aVL,I,aVR
Right Parameter
HR
None
None
None
None
PACED
Left Parameter
HR
% PACED
% VENT PACED
% ATRIAL PACED
% AV PACED
User Choice
Right Parameter
None
None
None
None
None
Information Center Configuration
9-19
Trend Groups Unit Settings
Item
Default
RESPIRATORY
Left Parameter
HR
%SpO2
EtCO2
RESP
TV
Right Parameter
None
None
None
AWRR
FIO2
HEMO
Left Parameter
HR
ABP
PAP
CO
CVP
Right Parameter
None
NBP
PAWP
SVO2
LAP
9-20
Information Center Configuration
User Choice
Trend Groups Unit Settings
Item
Default
RR IRREGULARITY
Left Parameter
HR
pNN50
NN SD
% IRREGULAR HR
% POOR SIGNAL
User Choice
Right Parameter
None
None
None
None
None
Information Center Configuration
9-21
Event Groups Unit Settings
Event Groups Unit Settings
The following is a list of parameter choices for event group configuration. The
table on page 9-22 provides a list of factory set defaults.
Note—Slow is defined as <60 b/min, Fast is >120 b/min, Run is > 2 beats,
Long>8.0 seconds.
Defined Events
None
SOME ECG ALRMS OFF
ALARMS OFF1
PAIR V EVENT
RUN V EVENT
FAST RUN V EVENT
LONG RUN V EVENT
PAIR V? EVENT
RUN V? EVENT
FAST RUN V? EVENT
LONG RUN V? EVENT
RUN P EVENT
FAST RUN P EVENT
FAST LONG RUN P EVENT
SLOW RUN P EVENT
SLOW LONG RUN P EVENT
RUN SVPB EVENT
FAST RUN SVPB EVENT
MISSED BEAT EVENT
PACER NOT CAPTURE EVENT
PACER NOT PACED EVENT
R-ON-T PVC EVENT
MULTIFORM PVC EVENT
VENT RHYTHM EVENT
PAIR SVPB EVENT
USER SAVED STRIPS
VENT BIGEMINY EVENT
VENT TRIGEMINY EVENT
ASYSTOLE EVENT
VFIB/TACH EVENT
PATIENT BUTTON
PAUSE
Only the first two events can be viewed for patients monitored by M3 bedside monitors.
1
ARRHYTHMIA OFF, ALL ARRH ALRMS OFF, and ALARMS SUSPENDED trigger the
ALARMS OFF event.
9-22
Information Center Configuration
Event Groups Unit Settings
Alarm Defined Events
YLW ALARMS
ALL ALARMS
ARRHY ALARMS
RED ARRHY ALARMS
YLW ARRHY ALARMS
BED ALARMS
RED BED ALARMS
YLW BED ALARMS
ST ALARMS (Tel)
***ASYSTOLE
***VFIB/VTACH
***V-TACH
***EXTREME BRADY
***EXTREME TACHY
**NON SUSTAIN VT
**VENT RHYTHM
**PAIR PVCs
**R-ON-T PVC
**MULTIFORM PVCs
**PACER NOT CAPT
**PACER NOT PACE
**MISSED BEAT
**SVT
**HR HIGH
**HR LOW
**RESP LOW
**RESP HIGH
**ST I HIGH
**ST I LOW
**ST II HIGH
**ST II LOW
**ST III HIGH
**ST III LOW
**ST aVF HIGH
**ST aVF LOW
**ST aVL HIGH
**ST aVL LOW
**ST aVR HIGH
**ST aVR LOW
**CCO HIGH
**ST V HIGH
**ST V LOW
**ST MCL HIGH
**ST MCL LOW
**PULSE HIGH
**PULSE LOW
**P1 HIGH
**P1 LOW
**PAP WEDGE
**P2 HIGH
**P2 LOW
**P3 HIGH
**P3 LOW
**P4 HIGH
**P4 LOW
**ABP HIGH
**ABP LOW
**CVP HIGH
**CVP LOW
**LAP HIGH
**LAP LOW
**PAP HIGH
**PAP LOW
**ICP HIGH
**ICP LOW
**IUP HIGH
**IUP LOW
**NBP HIGH
**NBP LOW
**ART HIGH
**ART LOW
**RAP HIGH
**RAP LOW
**Ao HIGH
**Ao LOW
***APNEA
**CPP LOW
**AWRR HIGH
**AWRR LOW
**CCO LOW
**EtCO2 LOW
**EtCO2 HIGH
**tcpCO2 LOW
**tcpCO2 HIGH
**tcpO2 LOW
**tcpO2 HIGH
**FIO2 LOW
**FIO2 HIGH
**PLETH LOW
**PLETH HIGH
**CPP HIGH
**BLOODT HIGH
**BLOODT LOW
***VENTILATOR
DISCONNECT
***VENTILATOR FAILURE
**HEATING PWR
***P1 DISCONNECT
***P2 DISCONNECT
***P3 DISCONNECT
***P4 DISCONNECT
***ABP DISCONNECT
***CVP DISCONNECT
***LAP DISCONNECT
***PAP DISCONNECT
***ICP DISCONNECT
***IUP DISCONNECT
***NBP DISCONNECT
***ART DISCONNECT
**T1 HIGH
**T1 LOW
**T2 HIGH
**T2 LOW
**IMCO2 HIGH
***RAP DISCONNECT
***Ao DISCONNECT
**VUELINK/OTHER ALARM
**RUN PVCs
**PAUSE
Information Center Configuration
9-23
Event Groups Unit Settings
**SPO2 LOW
**SPO2 HIGH
**SVO2 LOW
**SVO2 HIGH
**VENT BIGEMINY
**VENT TRIGEMINY
**PVC RATE
**IRREGULAR HR
**UVP HIGH
**UVP LOW
1Only
**UAP HIGH
**UAP LOW
***UVP DISCONNECT
***UAP DISCONNECT
**Trect HIGH
**Trect LOW
**Tcore HIGH
**Tcore LOW
**Tskin HIGH
**Tskin LOW
**Tesoph HIGH
**Tesoph LOW
**Tnaso HIGH
**Tnaso LOW
**Tart HIGH
**Tart LOW
**Tven HIGH
**Tven LOW
**MULTI-ST1
**BIS HIGH
**BIS LOW
available with telemetry EASI ECG.
The following alarm events are NOT available for patients monitored by M3 bedside monitors:
***all invasive pressure DISCONNECT except P1, P2, ABP, ART, and Ao
**P3 and **P4
**HEATING PWR
**IUP and **CPP
**T2
**PAP WEDGE
**VUELINK/OTHER ALARM
**BLOODT
**SVO2
***VENTILATOR DISCONNECT **MULTI ST
***VENTILATOR FAILURE
**EtCO2
**tcpCO2 and **tcpCO2
**FIO2
**PLETH
**IMCO2
**BIS
**PAUSE
***P2 DISCONNECT and **PAP WEDGE are available for patients on M4 monitors.
9-24
Information Center Configuration
Event Groups Unit Settings
Item
Default
LIFE
THREATENING
***ASYSTOLE
***V-FIB/TACH
***EXTREME TACHY
***EXTREME BRADY
***V-TACH
User Choice
DYSRHYTHMIAS FAST RUN V EVENT
FAST RUN SVPB EVENT
**PVC RATE
MISSED BEAT EVENT
VENT RHYTHM EVENT
VENTRICULAR
ALARMS
***V-TACH
**NON SUSTAIN VT
**RUN PVCs
**PAIR PVCs
**R-ON-T PVC
DISCHARGE
**HR HIGH
**HR LOW
**SpO2 LOW
**NBP LOW
**PVC RATE
PACER
INSERTION
**HR LOW
**NBP LOW
**MISSED BEAT
**PVC RATE
**IRREGULAR HR
Information Center Configuration
9-25
Event Groups Unit Settings
Item
Default
PACED
**HR HIGH
**HR LOW
**MISSED BEAT
**PACER NOT PACE
**PACER NOT CAPT
ALL ALARMS
RED ARRHY ALARMS
YLW ARRHY ALARMS
BED ALARMS
ALARMS OFF
NONE
9-26
Information Center Configuration
User Choice
Stored Waves Unit Settings
Stored Waves Unit Settings
The following is a list of parameter choices for Wave Review/saved strips, and
the stored waves for alarms. The table below provides a list of set defaults.
None
PRIMARY WAVE*
SECONDARY
WAVE*
ECG1
ECG2
ECG3*
RESP
P4
ABP
CVP
LAP
PAP
ICP
ART
PLETH
CO2
AWP
AWF
P1
P2
P3
RAP
Ao
UAP
UVP
*Tracks
the primary and secondary waves selected at the bedside or, for
telemetry, on the Patient Window.
**ECG3 is valid for M3 and M4 monitors only.
Note—The following waves from VueLink modules are not stored: IMCO2,
FIO2, etN2O, inN2O, etAGT, inAGT, O2, AGENT
Continuous Waves page
The waves selected will be the default waves saved in full disclosure (Wave
Review) and in strips saved to Alarm Review from Wave Review, Event
Review.
Item
Default
User Choice
Wave Selection 1
PRIMARY WAVE
Wave Selection 2
SECONDARY WAVE
Wave Selection 3
ECG2
Wave Selection 4
RESP
Note—If PRIMARY or SECONDARY is a wave in one of the other selections,
that wave is only stored once.
Information Center Configuration
9-27
Stored Waves Unit Settings
Alarm Waves page
The waves selected will be the default waves for alarms stored in Alarm Review
and the action of the patient sector button (if configured).
Item
Default
Wave Selection 1
PRIMARY WAVE
Wave Selection 2
SECONDARY WAVE
Wave Selection 3
ECG2
Wave Selection 4
RESP
User Choice
Note—If Primary or Secondary is a wave in one of the other selections, that
wave is only stored once.
9-28
Information Center Configuration
Scheduled Reports Unit Settings
Scheduled Reports Unit Settings
Overview
The Scheduled Report Unit Settings menus allow you to set up and scheduled
reports that will print on a regular basis for all admitted patients in the unit.
From the Scheduled Reports Unit Settings window you can change the settings
for the following reports by clicking on the appropriate tab on the top of the
window:
•
•
•
•
•
•
All Reports
Trend Report
Alarm Report
Event Report
Wave Report
Summary Report
Note—You can print reports for specific patients on demand or set up the reports
to print on a regularly scheduled basis for a particular patient by selecting
Scheduled Reports from the All Controls window. Patients must be admitted
before you can setup and schedule the reports. See Chapter 6, Patient Data
Review, in your Information Center Instructions for Use for information for
setting up and printing reports for a specific patient.
Printing
Behaviors
Reports are printed according to the time specified in the All Reports Unit
Settings Window (see “All Reports” on page 9-31). However, the following
general printing behaviors apply:
•
If there are a large number of reports to be printed at the same time, some
reports may be printed a few minutes ‘late’.
•
If the printer is not available at the scheduled time (for example if there
are other print jobs in the queue or there is a printer problem, etcetera.)
then the Information Center will periodically re-try to print the reports. If
the ‘next’ scheduled time arrives and the first scheduled report still has not
been successfully printed, then the first report is deleted and and the next
report is printed.
•
When the time is set back to accommodate daylight savings time, the
subsequent scheduled report will contain an extra hour to cover the time
period. When time is set forward, the same period of time may be covered
Information Center Configuration
9-29
Scheduled Reports Unit Settings
in two reports (for example, a one hour scheduled report would print twice
with the same data once labeled as 1:00 am and again labeled as 2:00 am).
•
9-30
Scheduled reports will start on the nearest time interval that occurs after a
report scheduled for printing. For example, if at 2:15 pm, scheduled
reports are configured to start at 8:00 am with a frequency of once every 4
hours, then a scheduled reports will start being produced at 4:00 pm the
same day.
Information Center Configuration
Scheduled Reports Unit Settings
All Reports
Use the All Reports Unit Settings window to specify one or more reports to be
printed on a regularly scheduled basis for the all the admitted patients in this
unit. All reports for one patient are printed sequentially followed by the next
patient.
Reports are sorted by bed label.
Step
Action
1
Select the reports by clicking in the checkbox next to the report
name. A checkmark in the checkbox selects the report for printing.
2
Indicate the time for which you want reports to start by specifying
the time in the Start Time field. Specify the hour by clicking on the
hour in the Start Time then clicking on the up and down arrows
until the desired time displays. Specify the minutes by clicking on
the minutes in the Start Time then using the up and down arrows
until the desired minutes display. Minutes are specified in 15 minute
increments. Reports will be printed per the time you specify in the
Start Time field. However, if there are a large number of reports to
be printed at the same time, some reports may be printed a few
minutes ‘late’.
Note—You can also specify start time by clicking on the hour or
minutes then typing the time using the keyboard.
Information Center Configuration
9-31
Scheduled Reports Unit Settings
Step
9-32
Action
3
Indicate how often you want the reports to occur by selecting a time
from the Frequency drop-down box. Choice are:
• Every Hour
• Every 2 Hours
• Every 6 Hours
• Every 8 Hours (default)
• Every 12 Hours
• Every 24 Hours
Note—The amount of data that the reports will contain depends on
the time Frequency you specify here. For example, if the time
frequency is 8 hours the reports you select in Step 1will only show
data for the previous 8 hours.
4
Click the Store Settings button to store any changes made in this
window and set the unit defaults.
Information Center Configuration
Scheduled Reports Unit Settings
Trend
Report Unit
Settings
The amount of data that the Trend Report will contain depends on the time
Frequency specified in the All Reports Unit Settings window. For example, if
the time frequency is 8 hours the report will only show data for the previous 8
hours.
Perform the following steps to set up the Trend Reports unit setting:
Step
Action
1
Specify the maximum number of pages this report should contain by
selecting the number of pages from the Maximum Pages (default
is 5) drop-down list. When you specify a specific number of pages
the report will stop when that number of pages is reached regardless
of whether there is more data or not.
2
Select the trend group for this report from the Trend Group
(default is VITAL SIGNS) drop-down list.
Information Center Configuration
9-33
Scheduled Reports Unit Settings
Step
3
Action
Specify whether you want the report to print in tabular (default) or
graphical format by clicking on the appropriate Report Type radio
button.
Click Tabular if you want to print the trend data in rows and
columns suitable for charting purposes. The tabular Trend Report
contains:
• Time labeled columns
• Parameter label for each row
• Parameter average value for each trend corresponding to time
column (aperiodic values show as the latest value for that
column)
• Date and time of time cursor at top of display
• Highlighted row indicating time cursor.
Click Graphic Trend if you want to print the report with the 5
graphic trends from the Trend Group. The graphic Trend Report
contains:
• Parameter label(s) for each trend line
• Parameter value(s) for each trend corresponding to current time
cursor position
• Date and time of time cursor at top of display
• Vertical line time cursor indicator
• Parameter scale indicators (same as scale on display at time of
print request)
• Time line
9-34
4
For tabular reports specify the trend interval by selecting the time
from the Trend Interval (default is 60 Minutes) drop-down list.
5
Click the Store Settings button to store any changes made in this
window and set the unit defaults.
6
If you would like to print the unit Trend Reports now click Print
Report Now button.
Information Center Configuration
Scheduled Reports Unit Settings
Alarm
Report Unit
Settings
The amount of data that the Alarm Report will contain depends on the time
frequency specified in the All Reports Unit Settings window. For example, if the
time frequency is 8 hours the report will only show data for the previous 8
hours.
Perform the following steps to set the Alarm Reports unit settings:
Step
Action
1
Specify the maximum number of pages this report should contain by
selecting the number of pages from the Maximum Pages dropdown list (default is 5). When you specify a specific number of
pages the report will stop when that number of pages is reached
regardless of whether there is more data or not.
2
Select the alarm group for this report from the Alarm Group dropdown list (default is ALL ALARMS).
3
Specify whether you want an alarm report or strip report (default) by
clicking on the appropriate Report Type radio button.
4
Click the Store Settings button to store any changes made in this
window and set the unit defaults.
5
If you would like to print the unit Alarm Reports now click Print
Report Now button.
Information Center Configuration
9-35
Scheduled Reports Unit Settings
Event
Report Unit
Settings
The Event Summary Report contains:
•
A graphic trend of HR for the most recent 24 hours.
•
A graphic trend of PVC for the most recent 24 hours.
•
A tabular trend for HR (max, median, min) for the most recent 24 hours.
•
A tabular trend of event counts for each of the event group entries for the
displayed event group for the most recent 24 hours.
•
An event strip containing the event specification and duration for each
entry in the Summary Report.
Perform the following steps set the Event Summary Reports unit settings:
Step
9-36
Action
1
Specify the maximum number of pages this report should contain by
selecting the number of pages from the Maximum Pages (default
is 5) drop-down list. When you specify a specific number of pages
the report will stop when that number of pages is reached regardless
of whether there is more data or not.
2
Select the event group for this report from the Event Group dropdown list (default is LIFE THREATENING). The report will print
all events configured for the event group you specify.
3
Click the Store Settings button to store any changes made in this
window and set the unit defaults.
4
If you would like to print the unit Event Reports now click Print
Report Now button.
Information Center Configuration
Scheduled Reports Unit Settings
Wave
Report Unit
Settings
Perform the following steps to set up the Wave Report unit settings:
Step
Action
1
Specify the maximum number of pages this report should contain by
selecting the number of pages from the Maximum Pages (default
is 5) drop-down list. When you specify a specific number of pages
the report will stop when that number of pages is reached regardless
of whether there is more data or not.
2
Specify whether you want a wave report, a strip report (default) or a
12 lead report by clicking on the appropriate Report Type radio
button.
Wave Report prints a compressed full disclosure wave report. The
waves that the report will contain depend on the waves selected in
the Wave Report Settings field and whether waves have been
stored for the given time interval.
Strip Report prints a periodic sample of the full disclosure waves
for this patient. The waves that appear depend on what was stored
for the specified time interval. The time between each strip on the
report is determined by the time specified in the Strip Interval
field. Each strip is approximately 6 seconds.
Twelve Lead prints a report of the EASI wave data stored for this
patient. This report is a single page report containing a single 12lead derivation of the EASI waves for this patient at time of the
report.
3
If you selected Wave Report in Step 2, specify the waves (1 to 4) to
be included in the report by clicking in the appropriate checkbox(s)
in the Wave Report Settings field. The waves available here
correspond to the waves selected in the Stored Waves window.
4
If you selected Wave Report in Step 2, indicate the number of
minutes of waves to compress per page by selecting the minutes
from the Minutes per Page drop-down list.
Information Center Configuration
9-37
Scheduled Reports Unit Settings
Step
Summary
Report Unit
Settings
Action
5
If you selected Strip Report in Step 2, indicate what the time interval
between strips should be by selecting a time from the Strip
Interval drop-down list.
6
Click the Store Settings button to store any changes made in this
window and set the unit defaults.
7
If you would like to print the Wave Report now click Print Report
Now button.
Use the Summary Report window to set up and print either an individual patient
reports or a unit report for all patients currently admitted and assigned to this
Information Center.
Perform the following steps to set up Summary Report unit settings:
Step
Action
1
Specify whether the summary reports will be Patient Reports or a
Unit Reports (default) by clicking on the appropriate radio button in
the Report Type field.
2
For Unit Reports specify whether to print the report in Compact
format or One Page Per Patient format by clicking on the
appropriate radio button in the Unit Report Settings field.
In Compact format, the report does not include the wave sample and
all patient information is packed into the fewest number of pages. In
One Page Per Patient format the wave sample is included and each
patient report appears on a single page.
9-38
3
Click the Store Settings button to store any changes made in this
window and set the unit defaults.
4
If you would like to print the Summary Report now click Print
Report Now button.
Information Center Configuration
Recording Unit Settings
Recording Unit Settings
Item
Default
Choices
User Choices
4-Channel Recorder
Recorder Speed
25mm/s
12.5, 25, 50 mm/s
Send Recordings to
Device
name that is
configured
in Set
Recording
Destination
Device names for
all centrals on the
IntelliVue Clinical
Network configured
with recorders
Note—Allows you to send all recordings to a central different from the recorder specified at
installation.
2-Channel Recorder
# Pre-Event, seconds
(delayed and alarm recordings)
10
4 to 20
Note—Refers to the number of seconds of stored waves before the alarm was detected/delayed
recording requested.
# Post-Event, seconds
(delayed and alarm recordings)
2
2 to 20
Note—Refers to the number of seconds of waves after the alarm was detected/delayed recording
requested.
Recorder Speed
25mm/s
6.25, 25, 50 mm/s
Information Center Configuration
9-39
Volume Control Unit Settings
Send Recordings to
Device
name that is
configured
in Set
Recording
Destination
Device names for
all centrals on the
IntelliVue Clinical
Network configured
with recorders
Note—Allows you to send all recordings to a central different from the recorder specified at
installation.
Volume Control Unit Settings
Item
Default
Choices
Current Volume
6
1 to 10, with 10 being the
loudest.
User Choices
Note—Use this field to adjust the alarm tone volume.
Test Volume While Setting
On
On or Off
Unit Settings
Default: 6
Minimum: 1
1 to 10, with 10 being the
loudest.
Not applicable -- is used
in this window only, and
does not affect the
Volume Control
Window.
Note—The Minimum volume is the quietest that a user can adjust the volume in the Volume Control
Window.
Important—Be sure the minimum setting is still audible in your care unit -- in some environments, a
setting of 1 is barely audible.
9-40
Information Center Configuration
Telemetry Frequency Unit Settings
Telemetry Frequency Unit Settings
Introduction
Use the Telemetry Frequency Window to initiate learning when you replace or
purchase a new transmitter or to turn on/off Radio Frequency INOP messages.
The sections below describe each of these functions.
Learning a
New
Transmitter
Code
The telemetry transmitter was designed with an internal identification code so
only a specific receiver can acquire its signal. This prevents another patient’s
ECG from being picked up by the wrong receiver.
If you replace or purchase a new transmitter, you must initiate learning of the
correct transmitter code.
Perform the following steps to initiate learning:
Step
1
Action
Access the Telemetry Frequency Window by clicking on the Telem
Freq button on the Unit Settings Window.
2
Enter a password in the Password field.
3
Click on the telemetry transmitter from the displayed list.
4
Click on the Learn Xmit Code button.
5
Press the patient button on the transmitter within 10 seconds. If you
do not press the patient button within 10 seconds repeat the
procedure.
Note—This feature is not for routine monitoring and you should only use it
under the direction of service personnel.
Information Center Configuration
9-41
Telemetry Frequency Unit Settings
Radio
Frequency
(RF) Trouble
Shooting
The Telemetry Frequency Window provides an option (RF INOP) that can assist
in troubleshooting performance associated with the RF link from the transmitter
to the receiver. When the RF INOP option is on, the Information Center collects
certain data and displays it on the Main Screen as a soft inop (text but no sound).
This provides service personnel with information on the quality of the channel.
The message format is:
##HHH/LLL(SSS)NNN
Enabling the
RF INOP
9-42
Where
Indicates
##
This is an RF measurement
HHH
RSSI+ value
LLL
RSSI- value
SSS
signal noise
NNN
noise value, or blank if no period of noise exists
You enable this option by ensuring that there is a check in the RF INOP
checkbox on the Telemetry Frequency Window for the transmitter in question.
When enabled the RF INOP is of lowest priority and is overwritten by any other
active system INOP or alarm. During normal clinical use, the RF INOP should
be turned off.
Information Center Configuration
This chapter provides information on Information Center safety and
specifications. It includes the following sections:
•
•
•
•
•
•
•
•
•
•
•
•
•
•
Regulatory and Safety Specifications . . . . . . . . . . . . . . . . . . . . . . . . . 10-2
Information Center Software Specifications. . . . . . . . . . . . . . . . . . . . 10-4
M3150 Information Center . . . . . . . . . . . . . . . . . . . . . . . . . . . . . . . . . 10-5
M3151 Information Center Client . . . . . . . . . . . . . . . . . . . . . . . . . . . 10-6
M3154 Database Server . . . . . . . . . . . . . . . . . . . . . . . . . . . . . . . . . . . 10-7
Release E Hardware Performance Requirements . . . . . . . . . . . . . . . . 10-9
ECG Performance Disclosure/Specifications . . . . . . . . . . . . . . . . . . 10-14
Specifications for the Philips 2-Channel Recorder. . . . . . . . . . . . . . 10-17
Specifications for the M3160A 4-Channel Recorder . . . . . . . . . . . . 10-18
Installation Information . . . . . . . . . . . . . . . . . . . . . . . . . . . . . . . . . . 10-19
Explanation of Symbols . . . . . . . . . . . . . . . . . . . . . . . . . . . . . . . . . . 10-20
During Power Transitions/Loss . . . . . . . . . . . . . . . . . . . . . . . . . . . . 10-22
If Connection to the M3154/M3169 Database Server is Lost . . . . . 10-23
Maintenance . . . . . . . . . . . . . . . . . . . . . . . . . . . . . . . . . . . . . . . . . . . 10-25
Information Center Safety and Specifications
10-1
Introduction
10
Information Center
Safety and Specifications
Regulatory and Safety Specifications
Regulatory and Safety Specifications
Declaration
0123
The M3290A Information Center Software Release E complies with the
requirements of the Council Directive 93/42/EEC of 14 June 1993
concerning medical devices and carries CE-marking accordingly.
The Information Center Software complies with the applicable portion of
ANSI/AAMI EC-13.
The NT Workstation and UPS comply with IEC 60950, CISPR 22 Level A,
and CISPR 24. They carry CE-marking to the European Low Voltage
Directive (73/23/EEC) and EMC Directive (89/336/EEC). They are not
suitable for installation in the Patient Care Vicinity (Patient Environment).
Note—The display is not provided as part of the Information Center.
Displays are ordered separately.
For specifications on the Philips Recorder, see “Specifications for the Philips
2-Channel Recorder” on page 10-17 “Specifications for the M3160A 4Channel Recorder” on page 10-18.
Authorized EU
Representative
10-2
Philips Medizinsysteme Deutschland GmbH
Hewlett-Packard-Strasse 2
D 71034, Boeblingen
Germany
Information Center Safety and Specifications
Avoiding EMI
Avoiding EMI
If electromagnetic interference (EMI) should be encountered, there are a number
of things that can be done to mitigate the situation.
•
Eliminate the source. Possible sources of EMI can be turned off or moved
away to reduce their strength.
•
Attenuate the coupling. If the coupling path is through the patient leads,
the interference may be reduced by moving and/or rearranging the leads.
If the coupling is through the power cord, plugging the M3150/M3151/
M3154/M3169 into a different circuit may help.
•
Add external attenuators. If EMI becomes an unusually difficult problem,
external devices such as an isolation transformer or a transient suppressor
may be of help. A Philips Medical Systems Customer Engineer can assist
in determining the need for external devices.
Information Center Safety and Specifications
10-3
Information Center Software Specifications
Information Center Software Specifications
Display
•
•
•
•
•
•
Up to 16 patient sectors, with up to 24 waveforms per screen single or
dual displays. Up to 32 waves can be displayed on dual displays with
two main screens.
Sweep speed is 25 mm/s and 12.5 mm/s depending on configuration.
Display formats are:
4 patients — 4 x 1, 2 x 2
6 patients — 6 x 1, 3 x 2
8 patients — 8 x 1, 4 x 2 (when all sectors are on one display)
12 patients
– 6 x 2 when all sectors are on one display
– 3 x 2 x 2 when sectors are on two displays
16 patients
– 8 x 2 when all sectors are on one display
– 4 x 2 x 2 when sectors are on two displays
Waveforms are 3.3 seconds in length in a dual-column format and 7.0
seconds in length in a single-column format (at 25 mm/s speed -- waves
at 12.5 mm/s are twice as long).
Number of waves in Patient Window: up to 4 (single display); up to 11
(dual display).
Number of parameters in Patient Window: up to 12
Note—Philips Medical Systems (or its designees) will not install or support
displays not supplied by Philips Medical Systems with Information Center
purchases and cannot guarantee their compliance with ANSI/AAMI EC-13
(ECG Aspect Ratio or 25mm/s specifications), or the EMC Directive.
10-4
Information Center Safety and Specifications
M3150 Information Center
M3150 Information Center
Features
The M3150 Information Center provides real-time waveform monitoring and
alarms at a central location for up to 16 patients. The standard M3150
Information Center includes the following features:
•
•
•
•
•
•
•
•
•
•
•
•
•
Options
NT Workstation, keyboard, and mouse.
Philips 2-channel Recorder.
UPS.
Displays up to 16 patients.
Up to 24 waves on a single main screen (up to 32 waves on dual display
with two main screens).
Configurable resting display.
Audio alarm annunciation.
ST/AR enhanced multi-lead ST segment and arrhythmia analysis.
If not connected to M3154 Database Server: stores 50 30-second alarm/
strip records, up to 4 waves per record; if connected to M3154 Database
Server: database stores 150 alarm/strip records, up to 4 waves per record.
If not connected to M3154 Database Server: 1 hour of wave review
storage, up to 4 waves per patient; if connected to M3154 Database
Server: database stores 24 hours of data.
24 hour trends, events, and ST review.
24 hour EASI 12-lead full disclosure
Philips Monitoring Network (SDN) connectivity and Philips IntelliVue
Clinical Network connectivity.
Options for the M3150 Information Center include:
•
•
•
•
•
•
Second display capability for full screen Patient Window and application
window, or 2 main screens.
If not connected to M3154 Database Server: storage for 150 thirty-second
alarm and saved strip records, up to 4 waves per record (50 is standard).
If not connected to M3154 Database Server: 24-hour wave review and
event review storage, up to 4 waves per patient (1 hour is standard).
48-hour wave review and event review, trend review and ST review
storage, up to 4 waves per patient.
48 hour EASI Full Disclosure
Export Data to Holter System
Information Center Safety and Specifications
10-5
M3151 Information Center Client
•
•
•
•
•
•
12-Lead Analysis/Export
Remote slave display(s).
Several display sizes are available.
Up to three strip chart recorders.
Trackball.
Laser printer printed reports.
Important—If the remote slave display is a different size from the main display,
the slave display will not meet the 25 mm/s sweep speed specification. See the
Philips Information Center Service Manual.
M3151 Information Center Client
Features
The Information Center Client provides real-time waveform monitoring at a
hallway location for up to 16 patients being monitored by a primary Information
Center on the IntelliVue Clinical Network system. The standard M3151
Information Center Client includes the following features:
•
•
•
•
•
•
•
•
•
•
Options
Options for the M3151 Information Center Client include:
•
10-6
NT Workstation, keyboard, and mouse.
Philips 2-channel Recorder.
UPS.
Displays up to 16 patients who are monitored by an Information Center on
the IntelliVue Clinical Network.
Up to 24 waves on a single main screen (up to 32 waves on dual display
with two main screens).
Configurable resting display.
Alarm silencing (if Full Control access).
Accesses real-time waveforms and parameters; accesses data stored by the
Database Server.
Configurable Full Control, Read-Only, or No access to patient data
controls.
IntelliVue Clinical Network connectivity.
Second display capability for full screen Patient Window and application
window, or 2 main screens.
Information Center Safety and Specifications
M3154 Database Server
•
•
•
•
Several display sizes are available.
Trackball.
Laser printer printed reports.
Up to three strip chart 2-channel recorders.
Important—If the remote slave display is a different size from the main display,
the slave display will not meet the 25 mm/s sweep speed specification. See the
Philips IntelliVue Information Center Service Manual for more information.
M3154 Database Server
Features
The M3154 Database Server provides database storage for the IntelliVue
Clinical Network. Patient monitoring data from all Information Centers on the
IntelliVue Clinical Network are received and stored by the Server. Any
Information Center and Client on the IntelliVue Clinical Network can access
stored data for any patient for review (unless configured for no access). The
M3154 Database Server includes the following features:
•
•
•
•
•
•
•
•
•
•
•
Server with CD-ROM and diskdrive, external modem, keyboard, and
mouse.
Windows NT server operating system software.
Philips application software.
UPS.
Up to 8 Information Centers and up to 8 Information Center Clients per
IntelliVue Clinical Network.
Up to 8 LaserJet printers per IntelliVue Clinical Network.
Up to 96 patients per IntelliVue Clinical Network.
32 transfer patients per IntelliVue Clinical Network.
Stores up to 24 hours of monitoring data for each patient, with 4 waves
per record, accessible at connected centrals in Wave Review, Trend
Review, Event Review, and ST Review.
150 30-second alarm records and saved strips, accessible at connected
centrals in Alarm Review.
Patient data is stored on the Database Server until patient discharge. Data
may be transferred from unit to unit within one Database Server or data
may be transferred across Database Servers in a Large Network Database
Server System.
Information Center Safety and Specifications
10-7
M3169 Small Database Server
Options
Options for the M3154 Database Server include:
•
•
•
•
•
Patient Data Transfer/Web access via the hospital’s internet/intranet.
48-hours of data storage (24 hours is standard).
Export Data to Holter System
Integrated Data Critical Statview™ paging system (available in limited
geographies)
Multiple switch configurations
M3169 Small Database Server
Features
The M3169 Small Database Server provides database storage for the IntelliVue
Clinical Network. Patient monitoring data from all Information Centers on the
IntelliVue Clinical Network are received and stored by the Server. Any
Information Center and Client on the IntelliVue Clinical Network can access
stored data for any patient for review (unless configured for no access). The
M3169 Database Server includes the following features:
•
•
•
•
•
•
•
•
•
Options
Options for the M3169 Database Server include:
•
•
•
10-8
Server with CD-ROM and diskdrive, keyboard, and mouse.
Windows NT 4.0 workstation.
Philips application software.
UPS.
Up to 3 Information Centers and up to 3 Information Center Clients per
IntelliVue Clinical Network.
Up to 4 LaserJet printers per IntelliVue Clinical Network.
Up to 48 patients per IntelliVue Clinical Network.
Stores up to 48 hours of monitoring data for each patient, with 4 waves
per record, accessible at connected centrals in Wave Review, Trend
Review, Event Review, and ST Review.
150 30-second alarm records and saved strips, accessible at connected
centrals in Alarm Review.
48-hours of data storage (24 hours is standard).
12-Lead Analysis/Export
Multiple switch configurations
Information Center Safety and Specifications
Release E Hardware Performance Requirements
Release E Hardware Performance Requirements
The Information Center software is designed to operate on qualified hardware
components that are standard computer products. These include equipment from
both Philips Medical Systems and equipment purchased by suppliers other than
Philips Medical Systems.
The tables below list components that comprise an Information Center along
with features and requirements for proper operation of the Information Center
software. These requirements are not exhaustive and are primarily intended to
indicate the types of features that are required for successful Information Center
software performance.
Note—Components provided by Philips Medical Systems with Information
Center purchases have been extensively tested and validated for system
performance. Software (e.g., BIOS, drivers, NT service packs) not supplied by
Philips Medical Systems as part an Information Center system are not approved
or supported by Philips Medical Systems for use with the Information Center
and IntelliVue Clinical Network/Database Server systems.
System Component
Archetypical Performance Requirements
System
Meet IEC 60950 regulatory requirements for ITE equipment
CE-marking to the Low Voltage Directive (LVD) and EMC
Directive
Information Center Safety and Specifications
10-9
Release E Hardware Performance Requirements
System Component
Archetypical Performance Requirements
NT Workstation
Compatible with IBM (86) type PC
Qualified with MicroSoft Windows NTTM 4.0
400+ MHz Pentium II
384 MB RAM
15 GB hard disk drive
4x CD ROM drive operational vertically and horizontally
Video adapter for 1280x1024, 256 color video @ 60 Hz noninterlaced refresh rate
Configurable up to 2 simultaneous display outputs
802.3 network controller with 10Base-T with RJ45 connector
16 bit. wav file compatible audio with power of at least 1.0 watts
RMS, 4 ohms
External audio output (external controls not permitting 0 audio
volume)
1 PCI expansion slot available for SDN Interface Card
1 Parallel printer interface
2 Serial interfaces
3.5” floppy disk drive
Requires less than 150W and 200VA as configured
10-10
Information Center Safety and Specifications
Release E Hardware Performance Requirements
System Component
Archetypical Performance Requirements
NT Server (M3154)
HP NetServer LC2000 or equivalent
Qualified with MicroSoft Windows NTTM Server 4.0
400+ MHz Pentium II
384 MB of ECC (error correcting) RAM
10+ GB RAID-5 disk drive(s) (depends on configuration)
4x CD ROM drive
Video adapter for 1280x1024, 256 color video @ 60 Hz noninterlaced refresh rate
802.3 network controller with 10Base-T with RJ45 connector
1 Parallel printer interface
2 Serial interfaces
3.5” floppy disk drive
Information Center Safety and Specifications
10-11
Release E Hardware Performance Requirements
System Component
Archetypical Performance Requirements
NT Server (M3169)
Compatible with IBM (86) type PC
Qualified with MicroSoft Windows NTTM Workstation 4.0
1.0+ GHz Pentium II single processor
384 MB of ECC (error correcting) RAM
40 GB disk drive
4x CD ROM drive
Video adapter for 1280x1024, 256 color video @ 60 Hz noninterlaced refresh rate
802.3 network controller with 10Base-T with RJ45 connector
1 Parallel printer interface
2 Serial interfaces
3.5” floppy disk drive
Keyboard
PS/2 Qwerty keyboard
Mouse
PS/2 2 button mouse
Trackball
PS/2 2 button trackball
WinNT compatible
Keyboard/Mouse Switch
10-12
PS/2 compatible
Information Center Safety and Specifications
Release E Hardware Performance Requirements
System Component
Archetypical Performance Requirements
Small CRT Color Video Display
Medium CRT Color Video Display
Large Color Flat-panel Display
Large CRT Color Video Display
1280x1024 60Hz non-interlaced capability
Less than 15% total linearity error
Viewable width of 1280 dots:
• Medium Display: 308 mm
• Large Display:
381 mm
Red, Green, & Blue Video Inputs: -0.7 V p-p
Vertical & Horizontal Multi-Sync Inputs: 5 V TTL
Video-Cable Connector: HD 15 Male
Video Splitter
300 MHz bandwidth (1280x1024, 60 Hz video)
Speaker
Unpowered stand alone speaker
Shielded for use with video display monitors
6m cable compatible with PU audio output
Printer (HP LaserJet 2200 printer
recommended)
8 pages per minute
Parallel/IntelliVue Clinical Network interface
250 sheet paper capability
External Modem
Compatible with WinNT 4.0 RAS service
ISA or PCI computer bus interface
57600 baud capability
Uninterruptible Power Supply
Compatible with Workstation/Server Processing Unit
Minimum capacity of 600VA, 250W / 1000VA, 670W
Holdup time of 5 minutes for 50% load
Able to report low battery condition and receive shutdown
command from computer’s serial port
Information Center Safety and Specifications
10-13
ECG Performance Disclosure/Specifications
ECG Performance Disclosure/Specifications
Characteristic
Heart Rate Averaging Method
Performance Disclosure/Specification (in
italics)
Two different methods are used:
a. Normally, heart rate is computed by averaging the
12 most recent RR intervals.
b. If each of 3 consecutive RR intervals are greater
than 1200 milliseconds (i.e. rate less than 50 b/min)
for adult and pediatric patients and greater than 750
milliseconds (i.e., rate less than 80 b/min for
neonatal patients, then the 4 most recent RR
intervals are averaged to compute the HR.
Heart Rate Meter Accuracy and Response
to Irregular Rhythm
Provides correct heart rates (80, 60, 120, 90 b/min)
using test waveforms as indicated in ANSI/AAMI
EC13
Sec. 3. 1. 2. 1 (5).
Response Time of Heart Rate Meter to
Change in Heart Rate
For a rate increase, the average time to reach the
specified heart rate using test waveforms as indicated
in ANSI/AAMI EC13 Sec. 3. 1. 2. 1 (6) is 8.6 seconds.
For a rate drop, the average time is 8.2 seconds.
Time to Alarm for Tachycardia
The ranges of time to alarm using test waveforms as
indicated in ANSI/AAMI EC13 Sec. 3. 1. 2. 1 (7) are
6.4 to 9.3 seconds.
Pacemaker Pulse Rejection Capability
Rejects pace pulses using test waveforms as indicated
in ANSI/AAMI EC13 Sec. 3. 1. 4 (with amplitude
from +/- 2 to +/- 700 mV, width from 0.1 to 2.0 ms).
10-14
Information Center Safety and Specifications
ECG Performance Disclosure/Specifications
Characteristic
Range and Accuracy of Heart Rate Meter
Performance Disclosure/Specification (in
italics)
Meets the ANSI/AAMI EC13 Section 3.2.7
recommended minimum range and accuracy.
Heart rate range is 15 - 300 b/min with accuracy of ±
1% of the range for Adult and Pediatric patients. Heart
rate range for Neonates is 15 - 350 with accuracy of ±
1% of the range. (Note: for rates equal to or less than
15, the displayed heart rate is 0).
Alarm Limit Range
Meets the ANSI/AAMI EC13 Section 3.2.8.1 standard.
Lower alarm limit is 15 -295. Upper alarm limit is 20 300.
Resolution of Alarm Limit Settings
Meets the ANSI/AAMI EC13 Section 3.2.8.2 standard.
The resolution is ± 5 b/min.
Alarm Limit Accuracy
Meets the ANSI/AAMI EC13 Section 3.2.8.3 standard.
Error less than ± 10% or ± 5b/min
Time to Alarm for Cardiac Standstill
Meets the ANSI/AAMI EC13 Section 3.2.8.4 standard:
maximum alarm time <10 seconds, using the test
waveforms as indicated.
Time to Alarm for Low Heart Rate
Meets the ANSI/AAMI EC13 Section 3.2.8.5 standard:
maximum alarm time <10 seconds, using the test
waveforms as indicated.
Time to Alarm for High Heart Rate
Meets the ANSI/AAMI EC13 Section 3.2.8.6 standard:
maximum alarm time <10 seconds, using the test
waveforms as indicated.
Alarm Silencing
The time required for reactivation of a latched,
silenced alarm is 3 minutes
ECG Waveform Display Time Base
Accuracy
0.8%. Meets the ANSI/AAMI EC13 Section 3.2.9.6
standard: maximum error = +/-10%.
Channel Width
40 mm. Meets the ANSI/AAMI EC13 Section 3.2.9.7(a)
standard: minimum = 30mm.
Information Center Safety and Specifications
10-15
ECG Performance Disclosure/Specifications
Characteristic
Performance Disclosure/Specification (in
italics)
Trace Width
0.3 mm. Meets the ANSI/AAMI EC13 Section
3.2.9.7(b) standard: maximum = 1.0mm.
Aspect Ratio
0.4s/mV. Meets the ANSI/AAMI EC13 Section
3.2.9.7(f) standard: 0.4s/mV.
Input Signal Reproduction Accuracy:
Overall Error
-2.9%. Meets the ANSI/AAMI EC13 Section 3.2.9.8(a)
standard: maximum = +/- 20%.
Frequency Response: Sinusoidal
0.67 to 40 Hz (3 db down). Meets the ANSI/AAMI
EC13 Section 3.2.9.8(b) standard: 0.67 to 40 Hz
(3 db down).
Frequency Response: Triangular
0 to 25% reduction. Meets the ANSI/AAMI EC13
Section 3.2.9.8(b) standard: 0 to 25% reduction.
Impulse Response:
(for waves marked with ST bandwidth)
Displacement = 0.08 mV, slope = 0.11 mV/s. Meets
the ANSI/AAMI EC13 Section 3.2.9.8(c) standard:
displacement maximum = 0.1 mV; slope
maximum = 0.30 mV/s.
Pacemaker Pulse Display Capability
Minimum = 0.2 mV RTI. Meets the ANSI/AAMI EC13
Section 3.2.9. 12 standard: minimum = 0.2 mV RTI.
10-16
Information Center Safety and Specifications
Specifications for the Philips 2-Channel Recorder
Specifications for the Philips 2-Channel Recorder
Declaration
The M1276A option 201 Philips 2-Channel Recorder complies with the
requirements of the Council Directive 93/42/EEC of 14 June 1993 concerning
medical devices. The Philips 2-Channel Recorder complies with IEC 60950,
CISPR 22 Level A, and CISPR 24.
This device is not suitable for installation in the Patient Care Vicinity
(Patient Environment).
Temperature Range
Operating: 5 to 40oC (41 to 104oF).
Storage: -10 to 70oC (-40 to 158oF).
Humidity Range (non-condensing)
15% to 80% RH at 40oC (104oF).
AC Input Power Source Requirements
The 2-Channel Recorder can be operated from an AC source of 100 to
240V AC +/- 10%, 50 to 60 Hz.
Maximum power consumption is 30W.
Information Center Safety and Specifications
10-17
Specifications for the M3160A 4-Channel Recorder
Specifications for the M3160A 4-Channel Recorder
This device is not suitable for installation in the Patient Care Vicinity (Patient
Environment).
Temperature Range
Operating: 5 to 40oC (59 to 86oF).
Humidity Range (non-condensing)
20% to 80% RH at 30oC (86oF).
AC Input Power Source Requirements
The Philips 4-Channel Recorder can be operated from an AC source of
100 to 240V AC +/- 10%, 50 to 60 Hz.
Maximum power consumption is 70W.
10-18
Information Center Safety and Specifications
Installation Information
Installation Information
Warning
Installation and setup must be performed by an Philips Medical Systems
service representative or designee.
Environment
Follow the instructions below to ensure a completely safe electrical
installation. The environment where the Information Center will be used
should be reasonably free from vibration, dust, corrosive or explosive gases,
extremes of temperature, humidity, and so on. For a cabinet mounted
installation, allow sufficient room at the front for operation and sufficient
room at the rear for servicing with the cabinet access door open.
The Information Center operates within specifications at ambient temperatures
between 15ºC and 30ºC. Allow at least 2 inches (5 cm) clearance around the
instrument for proper air circulation.
Caution
The Information Center is not suitable for installation in the Patient Care
Vicinity (Patient Environment).
Archetypical
Input Power
Source
Requirements
M3150, M3151
200 watts
Grounding
Information
Center and
Recorder
To protect hospital personnel, the cabinets of the Information Center and the
Philips Recorder must be grounded. Accordingly, the hardware is equipped
with detachable 3-wire cables which ground the instrument to the power line
ground (protective earth) when plugged into appropriate 3-wire receptacles. If
an adequate number of 3-wire receptacles are not available, consult the
hospital electrician.
Information Center Safety and Specifications
10-19
Explanation of Symbols
Warning
Do not use a 3-wire to 2-wire adapter with this instrument.
Do not use a power strip.
Condensation
Make sure that during operation, the instrument is free of condensation.
Condensation can form when equipment is moved from one building to
another, thus being exposed to moisture and differences in temperature.
Explanation of Symbols
The symbols used on the Information Center and the Philips Recorder are
explained below.
Symbol
Description
Attention, consult accompanying documents.
This icon displays next to the bed label in the
Patient Sector to indicate that the patient is
telemetry monitored. If the transmitter is
“docked” at TeleMon, the icon has a box around
it.
This icon displays next to the bed label in the
Patient Sector to indicate that the M3 or
IntelliVue Patient Monitor is connected to a
wireless IntelliVue Clinical Network.
This symbol displays next to a numeric in both
the Main Screen and Patient Window to indicate
that alarms are off for that parameter. If alarms
are suspended, this symbol displays next to all
numerics.
10-20
Information Center Safety and Specifications
Explanation of Symbols
Description
Symbol
This icon displays in the Patient Sector to
indicate that a conflict exists between patient
information at the Information Center and the
bedside monitor. Go to the Admit Window for
this patient and resolve the conflict.
This symbol identifies the date of manufacture.
The manufacturing batch code.
LOT
xxxxxx
Fragile, handle with care
Keep dry
Consult instructions for use
Catalog number
Serial number
Information Center Safety and Specifications
10-21
During Power Transitions/Loss
During Power Transitions/Loss
During hospital generator power transitions, an uninterruptible power supply
(UPS) allows the system to continue to process and collect data. However, the
display becomes blank until the transition to generator power is complete and
line power is available for the display.
If power is not restored within 90 seconds, the system begins to shut down.
After 120 seconds, the PC shuts down, and the UPS beeps every five seconds
until power is restored.
Important—If power is restored between 90 and 120 seconds, you get the
message “It is now safe to turn off your computer”, click on Restart to reboot the
system. When this message is displayed, you must click on Restart.
If power is restored after 120 seconds, the computer is automatically restarted.
If the central is connected to the telemetry mainframe (and the mainframe is not
connected to a UPS), following a power cycle, arrhythmia alarms are
automatically ON. Therefore, any arrhythmia alarms (including HR) that had
been turned off are turned back on when the mainframe is powered up.
10-22
Information Center Safety and Specifications
If Connection to the M3154/M3169 Database Server is Lost
If Connection to the M3154/M3169 Database Server is Lost
Local
Database
Mode
The M3154/M3169 Database Server provides database storage for Information
Centers (M3150, M3151) connected to the IntelliVue Clinical Network. Server
failure rarely occurs. However, in the event that access to the Database Server is
lost, the following steps will take place automatically:
1. All M3150 Information Centers and M3151 Information Center Clients on
the network will temporarily stop monitoring.
2. A warning message “operating on local DB” displays at the top of the
screen notifying the user that the connection to the DB (Database) Server
has been lost, and service should be notified.
3. The centrals will automatically be reconfigured to be in a “Local
Database” mode.
4. Monitoring in this mode will be restored within 5 minutes of the loss of
the Database Server.
In Local Database mode, data cannot be retrieved or stored on the Database
Server, but data will be stored on the local central database. When in Local
Database mode the Information Center will operate on its last known unit
settings not the last known setting for a patient.
When in Local Database mode, the following applications will not be available:
•
•
•
•
•
•
Review data for overview beds.
Discharge with save to the transfer list (the user can save to the Transfer
List locally, but this data will not be available once the server is reconnected).
Storage to the Database Server of alarms, waves, events, trends, ST
snippets.
Event Review, Wave Review, ST Alarms, ST Setup, Unit Settings (except
for Telemetry Frequency).
Managing Patients functions (admit/discharge/sector setup) across
centrals. Permanent changes to equipment (any assign or change
equipment actions) performed while the Database Server is unavailable
will be lost when access is restored. Changes to Care Groups (setup,
assignment) performed while the Database Server is unavailable will be
lost when access is restored.
Synchronization of time.
Information Center Safety and Specifications
10-23
If Connection to the M3154/M3169 Database Server is Lost
•
•
•
Adding/changing device configuration.
Paging.
Export Data to Holter System
When the server becomes available again, the following will happen:
1. On all centrals, in the system message area, the following message will be
displayed: “To Restore Normal Operation - Press ‘Restart Network’ in
Patient Window”.
2. Click Restart Network on the Patient Window.
3. Once the Restart Network button is clicked, a box will appear with
directions for restarting the network. Since restarting the network will stop
all central monitoring for 3 to 5 minutes, the restart can be planned for the
optimal time.
4. Any applications that were changed while the server was unavailable will
revert to their previous settings. This means that any admit, discharge, or
transfer setting changes or equipment changes made while in Local
Database mode will not be available when the database server is restored.
5. When connection to the IntelliVue Clinical Network is restored, M3151
Information Center Clients reboot automatically.
Important—When the network is reconnected:
•
•
•
•
•
All Patient Census information will be restored from the Database Server.
This means that any admit, discharge, or transfer setting changes or
equipment changes made while in Local Database mode will not be
available when the database server is restored.
When connection to the Database Server is restored verify that all patient
equipment, admit, discharge or transfer setting changes and alarm settings
are accurate.
For paging, the patient assignment to a caregiver/receiver is lost and will
need to be re-entered. However, all caregiver receivers will receive alarm
pages based upon the unit settings until patient assignments are made.
Trend and alarm data stored while on the local database will be lost.
All patient settings will be restored from the Database Server.
When connection to the Database Server is restored verify that all patient
equipment, admit, discharge or transfer setting changes and alarm settings
are accurate.
Please see the Service Manual for more details.
10-24
Information Center Safety and Specifications
Maintenance
Remote
Diagnostics
The message “Remote diagnostics in progress - see User’s Guide” will be
displayed when your system is being accessed remotely. This may cause some
delay in the system response for applications utilizing the IntelliVue Clinical
Network.
Maintenance
Before commencing monitoring on a patient:
•
•
•
Check for any mechanical damage.
Check all the external leads, input data connections and accessories.
Check all the functions of the instrument which will be needed to monitor
the patient, and ensure that the instrument is in good working order.
Do not use the Information Center for any monitoring procedure on a patient if
you identify features which demonstrate impaired functioning of the instrument.
Contact the hospital biomedical engineer, or the Philips Medical Systems service
engineer.
We recommend that full performance checks be done by qualified service
personnel after every repair or upgrade. See your Information Center Service
Manual for additional information.
All checks which require the instrument to be opened must be made by qualified
service personnel. Safety and maintenance checks can also be made by Philips
Medical Systems personnel. Your local Philips Medical Systems office will be
glad to give you information about service contracts.
Warning
Failure on the part of the responsible individual hospital or institution
employing the use of this equipment to implement a satisfactory
maintenance schedule may cause undue equipment failure and possible
health hazards.
Note—At this time, Philips Medical Systems will make available on request, and
in English only, component part lists, descriptions, calibration instructions or
other information which will assist the user's appropriate qualified technical
Information Center Safety and Specifications
10-25
Maintenance
personnel to repair those parts of the equipment which are classified by Philips
Medical Systems to be repairable.
10-26
Information Center Safety and Specifications
This appendix provides definitions of the trend parameters.
Trend Graphs
Definition
Type
HR
Average Heart Rate over one minute.
Line
Pulse
Average Pulse Rate over one minute.
Line
RESP
Average Respiration Rate (RR) over one minute.
Line
%SpO2
Average %SpO2 (oxygen saturation from pulse
oximetry) over one minute. The first setting can be
either continuous SpO2 (bedside or telemetry) or
intermittant telemetry SpO2.
Line
%SpO2
Average %SpO2 over one minute. The second
parameter is for telemetry SpO2 only
Line
%SpO2, %SpO2
Average %SpO2 over 1 minute. The left parameter is
continuous (bedside or telemetry), and the right
parameter is intermittant telemetry SpO2
Line
%SpO2_2
Average %SpO2 2 (oxygen saturation from pulse
oximetry) over one minute.
Line
%SpO2L
Average left-sided %SpO2 (oxygen saturation from
pulse oximetry) over one minute.
Line
%SpO2R
Average right-sided %SpO2 (oxygen saturation from
pulse oximetry) over one minute.
Line
ABP
Average value for Arterial Blood Pressure systolic,
diastolic and mean pressures over one minute. Graph
will contain 3 graphic trend lines.
Line
Trend Definitions
A-1
Introduction
A
Trend Definitions
Trend Graphs
Definition
Type
ABP SYS
Average value for Arterial Blood Pressure systolic
pressure over one minute.
Line
ABP DIAS
Average value for Arterial Blood Pressure diastolic
pressure over one minute.
Line
ABP MEAN
Average value for Arterial Blood Pressure mean
pressure over one minute.
Line
PAP
Average value for pulmonary artery pressure
systolic, diastolic and mean pressures over one
minute. Graph will contain 3 graphic trend lines.
Line
PAP SYS
Average value for pulmonary artery pressure systolic
pressure over one minute.
Line
PAP DIAS
Average value for pulmonary artery pressure
diastolic pressure over one minute.
Line
PAP MEAN
Average value for pulmonary artery pressure mean
pressure over one minute.
Line
PAWP
Aperiodic Value for pulmonary artery wedge
pressure placed on graph at time of measurement
Plot pts
CO
Aperiodic Value for cardiac output placed on graph
at time of measurement
Plot pts
CCO
Average value for continuous cardiac output
averaged over one minute.
Line
CVP
Average value for central venous pressure mean
pressure over one minute.
Line
NBP
Aperiodic value for non-invasive blood pressure
systolic, diastolic and mean pressures over one
minute. Graph will contain 3 values for each entry.
Plot pts
A-2
Trend Definitions
Trend Graphs
Definition
Type
NBP SYS
Aperiodic value for non-invasive blood pressure
systolic pressure at time of
measurement.
Line
NBP DIAS
Aperiodic value for diastolic pressure at time of
measurement.
Line
NBP MEAN
Aperiodic value for mean pressure at time of
measurement.
Plot pts
P1
Average value for pressure 1 systolic, diastolic and
mean pressures over one minute. Graph will contain
3 graphic trend lines.
Line
P 1 SYS
Average value for pressure 1systolic pressure over
one minute.
Line
P 1 DIAS
Average value for pressure 1diastolic pressure over
one minute.
Line
P 1 MEAN
Average value for pressure 1 mean pressure over one
minute.
Line
P2
Average value for pressure 2 systolic, diastolic and
mean pressures over one minute. Graph will contain
3 graphic trend lines.
Line
P 2 SYS
Average value for pressure 2systolic pressure over
one minute.
Line
P 2 DIAS
Average value for pressure 2 diastolic pressure over
one minute.
Line
P2 MEAN
Average value for pressure 2 mean pressure over one
minute.
Line
P3
Average value for pressure 3 systolic, diastolic and
mean pressures over one minute. Graph will contain
3 graphic trend lines.
Line
Trend Definitions
A-3
Trend Graphs
Definition
Type
P 3 SYS
Average value for pressure 3 systolic pressure over
one minute.
Line
P 3 DIAS
Average value for pressure 3 diastolic pressure over
one minute.
Line
P 3 MEAN
Average value for pressure 3 mean pressure over one
minute.
Line
P4
Average value for pressure 4 systolic, diastolic and
mean pressures over one minute. Graph will contain
3 graphic trend lines.
Line
P 4 SYS
Average value for pressure 4 systolic pressure over
one minute.
Line
P 4 DIAS
Average value for pressure 4 diastolic pressure over
one minute.
Line
P 4 MEAN
Average value for pressure 4 mean pressure over one
minute.
Line
ART
Average value for arterial pressure systolic, diastolic
and mean pressures over one minute. Graph will
contain 3 graphic trend lines.
Line
ART SYS
Average value for arterial pressure systolic pressure
over one minute.
Line
ART DIAS
Average value for arterial pressure diastolic pressure
over one minute.
Line
ART MEAN
Average value for arterial pressure mean pressure
over one minute.
Line
Ao
Average value for aortic systolic, diastolic and mean
pressures over one minute. Graph will contain 3
graphic trend lines.
Line
A-4
Trend Definitions
Trend Graphs
Definition
Type
Ao SYS
Average value for aortic systolic pressure over one
minute.
Line
Ao DIAS
Average value for aortic pressure diastolic pressure
over one minute.
Line
Ao MEAN
Average value for aortic mean pressure over one
minute.
Line
ICP
Average value for intracranial pressure mean
pressure over one minute.
Line
CPP
Average value for cerebral perfusion pressure over
one minute.
Line
LAP
Average value for left atrial pressure mean pressure
over one minute.
Line
RAP
Average value for right atrial mean pressure over one
minute.
Line
IUP
Average value for inter-uterine pressure mean
pressure over one minute.
Line
UAP
Average value for umbilical artery pressure systolic,
diastolic and mean pressures over one minute. Graph
will contain 3 graphic trend lines.
Line
UAP SYS
Average value for umbilical pressure systolic
pressure over one minute.
Line
UAP DIAS
Average value for umbilical pressure diastolic
pressure over one minute.
Line
UAP MEAN
Average value for umbilical pressure mean pressure
over one minute.
Line
UVP
Average value for umbilical venous pressure mean
pressure over one minute.
Line
Trend Definitions
A-5
Trend Graphs
Definition
Type
ST-I
Average of four - 15 second ST segment values.
Line
ST-II
Average of four - 15 second ST segment values.
Line
ST-III
Average of four - 15 second ST segmentvalues.
Line
ST-aVL
Average of four - 15 second ST segment values.
Line
ST-aVF
Average of four - 15 second ST segment values.
Line
ST-aVR
Average of four - 15 second ST segment values.
Line
ST-V1
Average of four - 15 second ST segment values.
(Only available with EASI ECG
capability)
Line
ST-V2
Average of four - 15 second ST segment
values.(Only available with EASI ECG capability)
Line
ST-V3
Average of four - 15 second ST segment values.
(Only available with EASI ECG capability)
Line
ST-V4
Average of four - 15 second ST segment values.
(Only available with EASI ECG capability)
Line
ST-V5
Average of four - 15 second ST segment values.
(Only available with EASI ECG capability)
Line
ST-V6
Average of four - 15 second ST segment values.
(Only available with EASI ECG capability)
Line
ST-V
Average of four - 15 second ST segment values.
Line
ST-indx
Average of four - 15 second ST segment values.
(Only available with EASI ECG capability). STindex is the sum of the absolute value of ST-II, STV2 and ST-V5.
Line
ST-MCL
Average of four - 15 second ST segment values.
Line
A-6
Trend Definitions
Trend Graphs
Definition
Type
ST-I, II, III, aVR, aVL, aVF
Average of four - 15 second ST segment values.
Produces 6 line graphs.
Line
ST-I, II, III
Average of four - 15 second ST segment values.
Produces 3 line graphs.
Line
ST-II, aVF, V
Average of four - 15 second ST segment values.
Produces 3 line graphs.
Line
ST-I, aVL, V
Average of four - 15 second ST segment values.
Produces 3 line graphs.
Line
ST-V, MCL
Average of four - 15 second ST segment values.
Produces 2 line graphs.
Line
ST-aVR, aVL, aVF
Average of four - 15 second ST segment values.
Produces 3 line graphs.
Line
ST-V1, V2, V3
Average of four - 15 second ST segment values.
Produces 3 line graphs. (Only available with EASI
ECG capability)
Line
ST-II, III, aVF
Average of four - 15 second ST segment values.
Produces 3 line graphs.
Line
ST-V4, V5, V6
Average of four - 15 second ST segment values.
Produces 3 line graphs. (Only available with EASI
ECG capability)
Line
ST-aVL, I, aVR
Average of four - 15 second ST segment values.
Produces 3 line graphs.
Line
ST-II, aVF, III
Average of four - 15 second ST segment values.
Produces 3 line graphs.
Line
ST-V1, V2, V3, V, MCL
Average of four - 15 second ST segment values.
Produces 3 line graphs. (Only available with EASI
ECG capability).
Line
Trend Definitions
A-7
Trend Graphs
Definition
Type
PVC Count
Total number of beats labeled “V” in one minute.
Bar
SV Count
Total number of beats labelled “S” and “N” in one
minute.
Bar
SVPB Count
Total number of beats labelled “S” in one minute.
Bar
Pause Count
Total number of asystole, pause, missed beat events
in one minute.
Bar
Paced Beat Count
Total number of “P” beat labels (paced beats) in one
minute.
Bar
PVC Pair Count
Total number of ventricular pairs (2 V’s in a row) in
one minute.
Bar
PVC Run Count
Total number of PVC runs (3 or more V’s in row) in
one minute.
Bar
Paced Run Count
Total number of Paced runs (3 or more “P” in a row
= run) in one minute
Bar
SVPB Run Count
Total number of SVPB runs (3 or more “S” in a row
= run) in one minute
Bar
Pacer Not Capture Count
Total number of Pacer Not Capture (No QRS for 1.75
x the average R-R interval with Pace Pulse (paced patient
only) in one minute.
Bar
Pacer Not Pace Count
Total number of Pacer Not Pace (No QRS and No Pace
Pulse for 1.75 x the average R-R interval (paced patient
only) in one minute.
Bar
R on T Count
Total number of R on Ts (For HR <100, a PVC with R-
Bar
R interval <1/3 the average interval followed by a
compensatory pause of 1.25 x average R-R interval or 2
such Vs without a compensatory pause occurring within 5
min. of each other. (When HR >100, 1/3 R-R interval is
too short for detection.) in one minute.
A-8
Trend Definitions
Trend Graphs
Definition
Type
Max PVC Run
The longest PVC run (largest number of V’s in a
run) in the last minute.
Bar
% Bigeminy
% of Ventricular Bigeminy Rhythm (N, V, N, V, N
beat labels) in one minute
Bar
%Trigeminy
% of Ventricular Trigeminy Rhythm (N, N, V, N, N,
V,N beat labels) in one minute.
Bar
% Paced
% of Paced Beats (“P” beats) in one minute.
Bar
% Atrial Paced
% of Paced Beats (“P” beats) with a Pace Pulse >
150 msec before the QRS in one minute.
Bar
% Vent Paced
% of Paced Beats (“P” beats) with a Pace Pulse <
150 msec before the QRS in one minute.
Bar
% AV Paced
% of Paced Beats (“P” beats) with 2 pace pulses (one
> 150 msec and one < 150 msec) before the QRS in
one minute.
Bar
% Irregular HR
% of R-R intervals which vary from the previous RR interval by more than 12.5% in one minute.
Bar
% Poor Signal
% Poor Signal identified in one minute.
Bar
NNSD
Standard Deviation of NN R-R intervals where R-R
intervals are less than 4 seconds averaged in one
minute
Bar
PVC Rate
Average of the PVC count in one minute.
Line
pNN50
% of NNN beat sequences with changes of adjacent
R-R intervals greater than 50msec in one minute. A
measure of heart rate variabilty (HRV).
Bar
V-V Rate Min
Minimum heart rate of runs of beats labeled “V” in
one minute
Line
Trend Definitions
A-9
Trend Graphs
Definition
Type
V-V Rate Max
Maximum heart rate of runs of beats labeled “V” in
one minute
Line
Paced Rate Min
Minimum heart rate of runs of beats labeled “P” in
one minute
Line
Paced Rate Max
Maximum rate of runs of beats labeled “P” in one
minute
Line
S-S Rate Min
Minimum heart rate of runs of beats labeled “S” in
one minute
Line
S-S Rate Max
Maximum heart rate of runs of beats labeled “S” in
one minute
Line
Atrial Paced Beat Count
Total number of “P” beats with detected pace pulse >
150 msec before QRS in one minute.
Bar
Ventricular Paced Beat
Count
Total number of beats labeled “P” with detected pace
pulse < 150 msec before QRS in one minute.
Bar
A-V Paced Beat Count
Total number of beats labeled “P” with a detected
pace pulse < 150 msec before QRS and a detected
pace pulse > 150 msec before QRS in one minute.
Bar
Normal Beat Count
Total number of beats labeled “N” in one minute
Bar
Ventricular Beat Count
Total number of beats labeled “V” in one minute
Bar
SVPB Beat Count
Total number of beats labeled “S” in one minute
Bar
All Beat Count
Total number of beats in one minute
Bar
V? Run Count
Total number of runs (> or =3 beats with labels “V”
or “?”) in one minute.
Bar
Multiform Count
Total number of multiform “V” in one minute.
Bar
A-10
Trend Definitions
Trend Graphs
Definition
Type
V-V Rate
Two trend lines which include V-V Rate Min and VV Rate Max.
Line
Paced Rate
Two trend lines which include Paced Rate Min and
Paced Rate Max.
Line
S- S Rate
Two trend lines which include S-S Rate Min and S-S
Rate Max.
Line
Tblood
Average blood temperature value (from cardiac
output module) over one minute.
Line
T1
Average temperature 1 value over one minute.
Line
T2
Average temperature 2 value over one minute.
Line
T1-T2
Average temperature difference value over one
minute (applies to all temp source combinations from
IntelliVue Patient Monitor)
Line
Tskin
Average skin temperature value over one minute.
Line
Tcore
Average core temperature value over one minute.
Line
Trect
Average rectal temperature value over one minute.
Line
Tesoph
Average esophageal temperature value over one
minute.
Line
Tnaso
Average nasal temperature value over one minute.
Line
Tven
Average venous temperature value over one minute.
Line
Tart
Average arterial temperature value over one minute.
Line
SaO2
Average or aperiodic value of oxygen saturation
value over one minute
Line
SvO2
Average venous oxygen saturation over one minute.
Line
Trend Definitions
A-11
Trend Graphs
Definition
Type
AWRR
Average airway respiration rate over one minute.
Line
PIP
Average peak inspiratory pressure value over one
minute.
Line
TV
Average tidal volume value over one minute.
Line
EtCO2
Average end-tidal carbon dioxide value over one
minute.
Line
IMCO2
Average inspired minimum carbon dioxide value
over one minute.
Line
tcpCO2
Average transcutaneous carbon dioxide value over
one minute.
Line
FIO2
Average fraction of inspired oxygen value over one
minute.
Line
tcpO2
Average transcuntaneous oxygen value over one
minute.
Line
AWP
Average airway pressure value over one minute.
Line
AWF
Average airway flow value over one minute
Line
AUX
Average value from auxiliary Vuelink module over
one minute.
Line
BIS
Average Bispectral Index value over one minute.
Line
A-12
Trend Definitions
Defined
Events
Defined events are arrhythmia events and other defined events such as alarms
off or patient button. Arrhythmia events use the ST/AR arrhythmia analysis beat
labelling, rate calculation and some settings. Arrhythmia events do not require
the arrhythmia alarm to be active.
“N” = Normal beat
“V” = Ventricular beat
“P” = Paced beat
“S” = Supraventricular premature beat
“?” = Insufficient information to classify beat
The duration of the defined event bars is dependent on the length of the event. If
the event is active for 5 minutes event duration is 5 minutes. For example an
event such as Pair V Event is a short event - two Vs are detected and the event is
complete. An event such as Ventricular Bigeminy the bar extends until the event
is over, therefore showing you the duration of the ventricular bigeminy.
Events
Definition
Some ECG Alarms off
One or more ** level Arrhythmia alarms have
been manually turned off.
Alarms off
NO ARRHYTHMIA, ALL ARRH ALRMS
OFF, and ALARMS SUSPENDED trigger the
ALARMS OFF event.
Arrhythmia Event
Any of the following arrhythmia events:
Pair V Event
Two beats labelled as “V”
Event Definitions
B-1
Introduction
B
Event Definitions
B-2
Events
Definition
Run V Event
Two or more beats
Fast Run V Event
Two or more beats labelled as “V” with a V rate
of >120b/min
Long Run V Event
Two or more beats labelled as “V” which lasts >
8 seconds
Pair V? Event
Two beats labelled as “V” and “?”
Run V? Event
Two or more beats labelled as “Vs” and “?” with
a V rate of 60-120b/min
Fast Run V? Event
Two or more beats labelled as “Vs” and “?”with
a V rate of >120b/min
Run P Event
Two or more beats labelled as “P” with a P rate
of 60-120b/min
Fast Run P Event
Two or more beats labelled as “P” with a P rate
of >120b/min
Fast Long Run P
Two or more beats labelled as “P” with a P rate
of > 120b/min which lasts > 8 seconds
Slow Run P Event
Two or more beats labelled as “P” with a P rate
of <60 b/min
Pair SVPB Event
Two beats labelled as “S”
Run SVPB Event
Two or more beats labelled as “S”
Fast Run SVPB Event
Two or more beats labelled as “S” with S rate
>120 b/min
Missed Beat Event
No beat detected for 1.75 x average R-R interval
for HR <120, or no beat for 1 second with HR
>120 (non-paced patient only)
Event Definitions
Events
Definition
Pause
No QRS detected for x seconds. Choices of >1.5
to 2.5 seconds.
Pacer Not Capture Event
No QRS for 1.75 x the average R-R interval with
Pace Pulse (paced patient only)
Pacer Not Paced Event
No QRS and Pace Pulse for 1.75 x the average
R-R interval (paced patient only)
R-on-T PVC Event
R-ON-T detected.
Multiform PVC Event
Multiform PVCs detected
Ventricular Rhythm Event A dominant rhythm of adjacent Vs > vent
rhythm limit and ventricular HR < V-Tach HR
limit
Ventricular Bigeminy
A dominant rhythm of N, V, N, V
(N=supraventricular beat, V=ventricular beat)
Ventricular Trigeminy
A dominant rhythm of N, N, V, N, N, V
(N=supraventricular beat, V=ventricular beat)
Asystole Event
No QRS detected for x seconds. Choices of >
2.5 to 4 seconds
Vfib/Vtach Event
A fibrillatory wave (sinusoidal wave between 210 Hz) for 4 consecutive seconds
Patient Button
If the patient activates the patient button on the
telemetry transmitter and the button is active.
Event Definitions
B-3
Alarm
Defined
Events
Alarm defined events include arrhythmia alarms as well as other measurement
alarms. Alarm defined events are defined by the alarm settings for arrhythmia
and other measurements.
The duration of the alarm event bars is dependent on the length of episode and
the user’s response to the alarm. In other words the length of the event bar
reflects the length the alarm message was displayed. If the event is short in
duration, the alarm message will be displayed until the user responds (latched
alarms) or until the event is over (non-latched alarms). If the episode is long in
duration the message continues until the event is over and the event bar is
longer, even if the user responds.
For example, a short run of VTACH, user responds in 3 minutes.
User Silenced Alarm
Event Episode Start
Event Episode Over
1
Minutes
1
B-4
Event Definitions
3
3
3.5
Events
Definition
YLW Alarms
All yellow alarms - both arrhythmia, ST and
bedside generated alarms
All Alarms
All alarms - Red and Yellow arrhythmia, ST and
bedside generated alarms
Arrhythmia Alarms
All alarms - Red and Yellow arrhythmia
RED ARRHY ALARMS
Red arrhythmia alarms
YLW ARRHY ALARMS
Yellow arrhythmia alarms
BED ALARMS
Any Red or Yellow bedside generated alarm
RED BED ALARMS
Any Red bedside generated alarm
Events
Definition
YLW BED ALARMS
Any Yellow bedside generated alarm
ST Alarms (Tel)
Yellow ST Alarms for Telemetry
***ASYSTOLE
No QRS detected for x seconds. Choices of >
2.5 to 4 seconds
***VIFIB/VTACH
Fibrillatory wave (sinusoidal wave between 210 Hz) for 4 consecutive seconds
***VTACH
Consecutive PVCs >= V-Tach Run limit and
HR > V-Tach HR limit
***EXTREME BRADY
Heart Rate less than the Extreme Brady limit.
This is set as difference from the HR Low limit.
***EXTREME TACHY
Heart Rate greater than the Extreme Tachy limit
This is set as difference from the HR High limit.
**NON SUSTAIN VTACH
A run of Vs having HR > V-Tach HR limit, but
lasting for less than the V-Tach Run limit
**VENT RHYTHM
A dominant rhythm of adjacent Vs > vent
rhythm limit and ventricular HR < V-Tach HR
limit
**RUN OF PVCs
Run of PVCs greater than 2
**PAIR PVCs
Two consecutive PVCs between non-PVCs
**R-ON-T PVC
For HR <100, a PVC with R-R interval <1/3 the
average interval followed by a compensatory
pause of 1.25 x average R-R interval or 2 such
Vs without a compensatory pause occurring
within 5 min. of each other. (When HR >100, 1/
3 R-R interval is too short for detection.)
**VENT BIGEMINY
A dominant rhythm of N, V, N, V, N
(N=supraventricular beat, V=ventricular beat)
Event Definitions
B-5
B-6
Event Definitions
Events
Definition
**VENT TRIGEMINY
A dominant rhythm of N, N, V, N, N, V, N, N
(N=supraventricular beat, V=ventricular beat)
**PVC RATE
PVCs within one minute exceeded the PVCs /
min limit
**MULTIFORM PVCs
The occurrence of two differently shaped Vs,
each occurring at least twice within the last 300
beats as well as each occurring at least once
within the last 60 beats
**PACE NOT CAPT
No QRS for 1.75 x the average R-R interval
with Pace Pulse (paced patient only)
**PACE NOT PACE
No QRS and Pace Pulse for 1.75 x the average
R-R interval (paced patient only)
**MISSED BEAT
No beat detected for 1.75 x average R-R interval
for HR <120, or no beat for 1 second with HR
>120 (non-paced patient only)
**PAUSE
No QRS detected for x seconds. Choices of >1.5
to 2.5 seconds.
Note: M3/M4- No beat detected for 1.75 x
average R-R interval for HR <120, or no beat
for 1 second with HR >120 (non-paced patient
only)
**SVT
Run of SVPBs >= SVT Run limit and
SVT Heart Rate > SVT HR limit
**IRREGULAR HR
Consistently irregular rhythm (irregular R-R
intervals)
**HR HIGH
Heart Rate greater than the upper HR limit
**HR LOW
Heart Rate lower than the lower HR limit
**RESP HIGH
Respiration Rate greater than the upper RR limit
Events
Definition
**RESP LOW
Respiration Rate lower than the lower RR limit
***Apnea
Respiration has stopped for longer than
the set apnea time.
**SPO2 HIGH
**SPO2 LOW
SpO2 greater than the upper SpO2 limit
SpO2 lower than the lower SpO2 limit
**SVO2 HIGH
**SVO2 LOW
SvO2 greater than the upper SvO2 limit
SvO2 lower than the lower SvO2 limit
**ST I HIGH
**ST I LOW
**ST II HIGH
**ST II LOW
**ST III HIGH
**ST III LOW
**ST aVF HIGH
**ST aVF LOW
**ST aVL HIGH
**ST aVL LOW
**ST aVR HIGH
**ST aVR LOW
**ST V HIGH
**ST V LOW
**ST V1 HIGH
**ST V1 LOW
**ST V2 HIGH
**ST V2 LOW
**ST V3 HIGH
**ST V3 LOW
**ST V4 HIGH
**ST V4 LOW
**ST V5 HIGH
**ST V5 LOW
**ST V6 HIGH
**ST V6 LOW
**ST MCL HIGH
**ST MCL LOW
ST greater than the upper ST limit
ST lower than the lower ST limit
Event Definitions
B-7
B-8
Event Definitions
Events
Definition
**PULSE HIGH
**PULSE LOW
Pulse greater than the upper Pulse limit
Pulse lower than the lower Pulse limit
**NBP HIGH
**NBP LOW
NBP greater than the upper NBP limit
NBP lower than the lower NBP limit
**CPP HIGH
**CPP LOW
CPP greater than the upper CPP limit
CPP lower than the lower CPP limit
**AWRR HIGH
**AWRR LOW
awRR greater than the upper awRR limit
awRR lower than the lower awRR limit
**EtCO2 HIGH
**EtCO2 LOW
EtCO2 greater than the upper EtCO2 limit
EtCO2 lower than the lower EtCO2 limit
**FiO2 HIGH
**FiO2 LOW
FiO2 greater than the upper FiO2 limit
FiO2 lower than the lower FiO2 limit
**IMCO2 HIGH
imCO2 greater than the upper imCO2 limit
**tcpO2 HIGH
**tcpO2 LOW
tcO2 greater than the upper tcO2 limit
tcO2 lower than the lower tcO2 limit
**tcpCO2 HIGH
**tcpCO2 LOW
tcCO2 greater than the upper tcO2 limit
tcCO2 lower than the lower tcO2 limit
**<Temp Label>HIGH
**<Temp Label>LOW
<Temp Label> greater than the upper <Temp
Label> limit
<Temp Label> lower than the lower <Temp
Label> limit
**<PRESS LABEL> HIGH
**<PRESS LABEL>LOW
<Press Label> greater than the upper <Press
Label> limit
<Press Label> lower than the lower <Press
Label> limit
Events
Definition
***P1 DISCONNECT
***P2 DISCONNECT
***P3 DISCONNECT
***P4 DISCONNECT
***ABP DISCONNECT
***PAP DISCONNECT
***IUP DISCONNECT
***ARTDISCONNECT
***UAP DISCONNECT
The pressure is non-pulsatile and the mean
pressure is continuously less than 10mmHg
(1.3kPa). This alarm occurs
only with arterial pressures (P, ABP, ART, AO,
UAP, PAP).numeric flashes, red alarm lamp,
alarm tone.
***VENTILATOR
DISCONNECT
Ventilator Disconnected from patient.
(availability depends on Vuelink Device))
**CCO HIGH
**CCO LOW
CCO greater than the upper CCO limit
CCO lower than the lower CCO limit
**BIS HIGH
**BIS LOW
BIS greater than the upper BIS limit
BIS lower than the lower BIS limit
**VUELINK OTHER
ALARM
Type of alarm depends on Vuelink Device.
Event Definitions
B-9
B-10
Event Definitions
This appendix provides a list of the 7-character encoded ST/AR configuration
parameters that display as part of the alarm information on alarm strip
recordings. This information can assist user in identifying problems in the
operation of STAR arrhythmia analysis as well assist in interpreting the results
obtained by the algorithm.
These items are coded into a 7 character string, as follows:
Character
Identifies
First
ST/AR’s revision.
Second
Patient category, pacing mode and analysis level.
Third and Fourth
• Classification mode (single or multi-lead)
• Detection mode (auto or manual)
• User specified lead label (manual detection mode only)
• User specified minimum threshold (150-350uV)
(manual detection mode only)
• Algorithm minimum detection threshold (150-350uV)
(manual detection mode only)
Fifth
Number of active classification and detection channels
EASI mode/EASI coefficient set
Sixth
ECG hardware source and lead set in use (3-wire, EASI,
etc.)
Seventh
Source of Asystole, Pause, Missed Beat, PNP or PNC alarm
(detection or beat interval)
ST/AR Configuration Reporting
C-1
Introduction
C
ST/AR Configuration
Reporting
First
Character
Codes
The first character identifies the ST/AR revision.
STAR revision
First Character
Release E
Second
Character
Codes
4
The second character identifies the patient category, pacing mode and analysis
level.
Patient Type
Paced Mode
Arrhythmia
Level
Second
Character
Neo
True
Cardiotach
0
Basic
1
Enhanced
2
Cardiotach
3
Basic
4
Enhanced
5
Cardiotach
6
Basic
7
Enhanced
8
Cardiotach
9
Basic
B
Enhanced
C
False
Ped
True
False
C-2
ST/AR Configuration Reporting
Patient Type
Paced Mode
Arrhythmia
Level
Second
Character
Adult
True
Cardiotach
D
Basic
F
Enhanced
G
Cardiotach
H
Basic
J
Enhanced
K
False
ST/AR Configuration Reporting
C-3
Third and
Fourth
Character
Codes
The third and fourth character identifies the:
•
•
•
•
•
Note
Classification mode (single or multi-lead)
Detection mode (auto or manual)
User specified lead label (manual detection mode only)
User specified minimum threshold (150-350uV) (manual detection mode
only)
Algorithm minimum detection threshold (150-350uV) (manual detection
mode only
Use the Multi/Manual/Lead I entries as a guideline in determining the
appropriate expanded values for each Lead listed in the table below.
Classification
Mode
Detection
Mode
User
Specified
Detection
Lead
User
Specified
Detection
Threshold
Algorithm
Minimum
Detection
Threshold
Third And
Fourth
Character
Multi
Auto
N/A
N/A
150
00
C-4
ST/AR Configuration Reporting
Classification
Mode
Detection
Mode
User
Specified
Detection
Lead
User
Specified
Detection
Threshold
Algorithm
Minimum
Detection
Threshold
Third And
Fourth
Character
Manual
Lead I
150
150
10
350
11a
200
12
350
13b
250
14
350
15c
300
16
350
17d
350
18
350
19e
200
250
300
350
Lead II
150 - 350
150 - 350
20 - 29
Lead III
150 - 350
150 - 350
30 - 39
Lead AVR
150 - 350
150 - 350
40 - 49
Lead AVL
150 - 350
150 - 350
50 - 59
Lead AVF
150 - 350
150 - 350
60 - 69
Lead V1
150 - 350
150 - 350
70 - 79
Lead V2
150 - 350
150 - 350
80 - 89
Lead V3
150 - 350
150 - 350
90 - 99
LV4
150 - 350
150 - 350
B0 - B9
ST/AR Configuration Reporting
C-5
Classification
Mode
Single
C-6
User
Specified
Detection
Lead
User
Specified
Detection
Threshold
Algorithm
Minimum
Detection
Threshold
Third And
Fourth
Character
Lead V5
150 - 350
150 - 350
C0 - C9
Lead V6
150 - 350
150 - 350
D0 - D9
Lead V
150 - 350
150 - 350
F0 - F9
Lead MCL1
150 - 350
150 - 350
G0 - G9
Lead MCL2
150 - 350
150 - 350
H0 - H9
Lead MCL3
150 - 350
150 - 350
J0 - J9
Lead MCL4
150 - 350
150 - 350
K0 - K9
Lead MCL5
150 - 350
150 - 350
L0 - L9
Lead MCL6
150 - 350
150 - 350
M0 - M9
Lead MCL
150 - 350
150 - 350
N0 - N9
Auto
N/A
N/A
150
01
Manual
Lead I
150 - 350
150 - 350
P0 - P9
Lead II
150 - 350
150 - 350
R0 - R9
Lead III
150 - 350
150 - 350
S0 - S9
Lead AVR
150 - 350
150 - 350
T0 - T9
Lead AVL
150 - 350
150 - 350
V0 - V9
Lead AVF
150 - 350
150 - 350
W0 - W9
Lead V1
150 - 350
150 - 350
X0 - X9
Lead V2
150 - 350
150 - 350
Y0 - Y9
Detection
Mode
ST/AR Configuration Reporting
Classification
Mode
Detection
Mode
User
Specified
Detection
Lead
User
Specified
Detection
Threshold
Algorithm
Minimum
Detection
Threshold
Third And
Fourth
Character
Lead V3
150 - 350
150 - 350
Z0 - Z9
Lead V4
150 - 350
150 - 350
b0 - b9
Lead V5
150 - 350
150 - 350
c0 - c9
Lead V6
150 - 350
150 - 350
d0 - d9
Lead V
150 - 350
150 - 350
f0 - f9
Lead MCL1
150 - 350
150 - 350
g0 - g9
Lead MCL2
150 - 350
150 - 350
h0 - h9
Lead MCL3
150 - 350
150 - 350
j0 - j9
Lead MCL4
150 - 350
150 - 350
k0 - k9
Lead MCL5
150 - 350
150 - 350
m0 - m9
Lead MCL6
150 - 350
150 - 350
n0 - n9
Lead MCL
150 - 350
150 - 350
p0 - p9
a. User specified lead is not active
b. User specified lead is not active
c. User specified lead is not active
d. User specified lead is not active
e. User specified lead is not active
Fifth
Character
Codes
The fifth character identifies the number of active classification and detection
channels and EASI mode/EASI coefficient set.
ST/AR Configuration Reporting
C-7
EASI Mode
Standard (nonEASI) electrode
placement
Active
Classification
Channels
Active
Detection
Channels
Fifth Character
0
0
0
1
1
2
2
0
3
1
4
2
5
0
6
1
7
2
8
0
9
1
B
2
C
0
D
1
F
2
G
0
H
1
J
2
K
1
2
EASI placement
for Conventional
12-Lead
derivation
0
1
2
C-8
ST/AR Configuration Reporting
Sixth
Character
Codes
The sixth character identifies the ECG hardware source and lead set in use (3wire, EASI, etc.).
ECG HW Source
Lead Set
Sixth Character
unknown
unknown
0 or z
3w
1
4w
2
5w
3
10w
4
unknown
5
3w
6
4w
7
5w
8
10w
5
unknown
9
3w
B
4w
9
5w
C
10w
9
M1401 Telemetry
ECG A module
ST/AR Configuration Reporting
C-9
ECG HW Source
Lead Set
Sixth Character
ECG/resp A module
unknown
D
3w
F
4w
D
5w
G
10w
D
unknown
H
3w
J
4w
H
5w
K
10w
H
unknown
L
3w
M
4w
L
5w
N
10w
L
unknown
P
3w
R
4w
P
5w
S
10w
P
ECG B module
ECG/resp B module
M3000A Measurement
Server
C-10
ST/AR Configuration Reporting
ECG HW Source
Lead Set
Sixth Character
M2600 Telemetry
unknown
T
3w
V
4w
P
5w
W
10w
P
unknown
b
3w
c
4w
b
5w
d
10w
f
M3001A Measurement
Server
ST/AR Configuration Reporting
C-11
Seventh
Character
Code
C-12
The seventh character identifies the Source of Asystole, Pause, Missed Beat,
PNP or PNC alarm (detection or beat interval).
Event Source
Seventh Character
N/A
0
look_ahead
1
look_back
2
look ahead beat rejection
3
ST/AR Configuration Reporting
Please call your local Philips Medical Systems sales office listed in your
telephone directory or an Philips Medical Systems regional office listed below
for the location of your nearest sales office.
CORPORATE HEADQUARTERS:
Philips Medical Systems
Netherlands B.V.
Postbus 10.000
5680 DA Best
Netherlands
UNITED STATES:
Philips Medical Systems
3000 Minuteman Road
Andover, MA 01810
(800) 934-7372
CANADA:
Philips Medical Systems Canada
281 Hillmount Road
Markham, ON
L6C 2S3
(800) 291-6743
EUROPE, MIDDLE EAST AND AFRICA:
Philips Medizinsysteme Böblingen GmbH
Cardiac and Monitoring Systems
Hewlett-Packard Str. 2
71034 Böblingen
Germany
Fax: (+49) 7031 463 1552
Sales and Support Offices
D-1
Introduction
D
Sales and Support Offices
LATIN AMERICA HEADQUARTERS:
Philips Medical Systems
1550 Sawgrass Corporate Parkway #300
Sunrise, FL 33323
Telephone: 954-835 2600
Fax: 954-835-2626
ASIA PACIFIC HEADQUARTERS:
Philips Medical Systems
30/F Hopewell Centre
17 Kennedy Road
Wanchai
Hong Kong
Tel: (852) 2821 5888
Fax: (852) 2527 6727
D-2
Sales and Support Offices
Index
Numerics
12 Lead Review Window
using with 12 lead captures, 6-42
using with EASI derived 12 lead, 6-45
12-Lead ECG button, 1-21
12-Lead Review Window
from Information Center Web, 6-67
overview, 6-42
12-leads
report, 1-26
viewing, 1-26
A
access
none, 1-30
read only, 1-29
read-write, 1-29
read-write, multiple viewers, 1-30
types of, 1-29
adjusting
Patient Window parameters, 1-20
admitting
how to, 2-4
overview, 2-3
paced patients, 2-6, 4-17
alarm paging
assigning caregiver from admit window, 8-7
assigning patients, 8-7
automatic, 8-9
caregivers, 8-3
changing a caregiver, 8-6
INOPs, 8-10
manual, 8-11
overview, 8-2
receivers, 8-3
remove receiver, 8-5
sending text messages, 8-12
sent data, 8-11
alarm recordings
priority, 3-13
turning off, 4-36
unit settings, 9-10
Alarm Review Window
deleting, 6-13
from Information Center Web, 6-65
overview, 6-9
printing from, 6-14
selecting waves stored in, 6-50
using, 6-10
viewing saved strips, 6-10
alarm strips
calipers, 6-15
comments on, 6-16
printing, 6-14
re-labeling, 6-11
alarms
adjusting volume, 4-35
adjustments, 4-16
arrhythmia messages, 4-8
chaining, 4-24
deleting, 6-13
detection, 4-2
effects of adjustments on, 4-22
false arrhythmia, 5-24
fast alarm review, 4-31
indicators, 4-3
inhibiting sound at bedside, 4-19
levels and priorities, 4-4
making adjustments to, 4-13
multiple, 4-24
nurse call, 4-5
paging, 8-12
printing, 6-14
priorities, 4-25
recording/storing, 4-36
re-labeling, 6-11
reminders, 4-30
setting Smart Limits, 4-20
Index-1
silencing, 4-28
sounds, 4-6
storage of arrhythmia, 4-36
stored, 6-9
suspending/unsuspending, 4-32
timeout periods, 4-23
turning off storage, 4-36
turning off/on, 4-16
viewing, 6-10
with M3 monitors, 4-2
arrhythmia alarms
basic, 5-3
false, 5-24
M3150, 5-4
making adjustments to, 4-16
messages, 4-8
storage of, 4-37
turning off, 4-19
unit settings, 9-6
with M3 monitors, 4-2
yellow timeout periods, 4-23
Arrhythmia Alarms Window
field descriptions, 4-16
making alarm adjustments, 4-16
arrhythmia analysis
beat classification, 1-21, 5-7
changing, 4-17
description, 5-5
ensuring accurate, 5-6
example of good ECG for, 5-11
Multilead, 4-17
no arrhythmia, 4-18, 4-21
no arrhythmia/ST, 4-18, 4-21
Singlelead, 4-17
viewing leads for, 5-10
Arrhythmia Analysis button, 1-21
arrhythmia INOP messages
responding to, 4-11
assigning a bed to a care group, 2-15
assigning patients
alarm paging, 8-7
all controls window, 8-8
Index-2
automatic alarm paging, 8-9
B
beds
assigning overview, 2-32
changing equipment for, 2-29
monitored by another central, 1-29
bedside
alarm sound, 4-19
making alarm adjustments, 4-13
wireless IntelliVue Clinical Network, 1-32
bedside, standby, 1-25
buttons
in Fast Alarm Review, 6-17
in patient sector, 1-16
C
calipers, 6-7
Cannot Analyze ECG (sound), 4-20
care group
assigning a bed, 2-15
setting up with M3 and IntelliVue Patient
Monitors, 2-13
care groups, 2-12
M3 and IntelliVue Patient Monitor
bedsides, 2-12
setting up, 2-12
viewing, 2-16
caregivers
assigning patients, 8-7
changing for alarm paging, 8-6
set up for alarm paging, 8-3
CareNet
consulting beds, 1-30
description, 1-2
guidelines for consulting beds, 1-31
chaining, 4-24
chains, 4-26, 4-27
comments
adding to saved strips, 6-6
configuration
arrhythmia alarms, 9-6
event groups, 9-22
Information Center, 9-2
record/store alarms, 9-10
recorder, 9-39
ST alarms, 9-13
stored waves, 9-27
trend groups, 9-15
using unit setting menus, 9-5
volume control, 9-40
conflict resolution, 2-9
conflicts
bedsides, 2-10
M3 or IntelliVue Patient Monitor bedsides, 29
connection to database lost, 10-23
consulting beds
functions available from, 1-30
guidelines for, 1-31
on CareNet, 1-30
continuous recording, 1-20
D
Data Critical Statview
paging, 8-2
database
local, 10-23
lost connection, 10-23
database server, 1-5
connection lost, 10-23
database server, capabilities, 1-5
defaults
See unit settings, 9-4
delayed recordings, 3-5
extending at M3 monitor, 3-7
for IntelliVue Patient Monitors, 3-5
for M3 monitors, 3-5
making continuous, 3-7
making delayed for all beds, 3-7
priority, 3-13
record all, 3-7
deleting
alarms, 6-13
discharged patients
re-admitting, 2-5, 2-8, 2-25
discharging
for transport, 2-21
how to, 2-19
M3 and IntelliVue Patient Monitors, 2-18
without losing patient data, 2-20
discharging for transport, 2-18
display
specifications, 10-4
display screens, 1-14
dual, 1-18
Main Screen, 1-14
message areas, 1-15
patient sectors, 1-15
single, 1-18
two main, 1-19
dual display, 1-18
E
EASI
12-lead review, 6-42
ST, 7-2
ECG
performance specifications, 10-14
ECG waves
examples of good, 5-11
learning, 5-17
optimizing for arrhythmia analysis, 1-21, 5-6
ectopic status messages, 5-22
EMI
avoiding, 10-3
event groups, 6-24
unit settings, 9-22
Event Review Window
cursor/event information, 6-24
event bars, 6-25
from Information Center Web, 6-66
overview, 6-24
printing from, 6-28
Index-3
using, 6-26
events
associating text with, 6-26
selecting specific, 6-26
viewing waves for, 6-33
export data
Holter system, 6-48
IntelliVue Clinical Network
description, 1-5
viewing patients over, 1-28
interference, 1-33
L
Fast Alarm Review, 4-31, 6-17
buttons, 6-17
features, 1-10, 1-11
fixed and flexible monitoring, 2-26
labels
arrhythmia beat, 1-21, 5-7
learning, 5-17
loading
paper, 3-17
local database mode, 10-23
operating in, 10-23
G
M
grounding
Information Center, 10-19
M3
system messages, 1-33
M31260A
specifications, 10-18
M3150
features, 10-5
options, 10-5
power requirements, 10-19
M3151A
features, 10-6
options, 10-6
M3154A
features, 10-7, 10-8
options, 10-8
Main Screen, 1-14
maintenance, 10-25
manual alarm paging, 8-11
messages
arrhythmia alarm, 4-8
arrhythmia INOP, 4-11
ectopic status, 5-22
M3 system, 1-33
recorder at M3 monitor, 3-13, 3-15
recording status, 3-14
rhythm status, 5-20
F
H
heart rate
setting alarm limits, 4-20
Holter system
export data to, 6-48
I
icons
Patient Window, 1-20
Information Center, 10-19
applications, 2-2
configuration, 9-2
maintenance
Information Center, 10-25
models, 1-2
specifications, 10-1
Information Center Web
using, 6-62
INOP alarms
reminders, 4-30
INOP messages
arrhythmia, 4-11
Index-4
monitoring
fixed, 2-26
flexible, 2-26
monitoring devices, 1-11
functionality, 1-12
More Waves button, 1-21
multilead analysis
changes in one lead, 5-18
fallback, 5-19
learning, 5-17
Multilead ECG
button, 1-21
from Information Center Web, 6-65
N
navigation
within Wave Review, 6-31
NBP Alarms button, 1-21
no access to data, 1-30
no arrhythmia, 4-18, 4-21
O
on-line help
using, 1-35
operating on local DB, 10-23
other centrals
viewing patients on, 1-28, 1-30
other units
viewing patients in, 1-28
overview beds, 1-29, 2-26
access controls, 1-29
assigning, 2-32
on the IntelliVue Clinical Network, 1-28
viewing, 1-29
P
paced patients
admitting, 2-6, 4-17
re-admitting, 2-25
repolarization tails, 5-16
setting status, 5-14
warnings for, 5-14
with M3 monitors, 2-6
paging
alarm. See alarm paging, 8-12
patient
discharging, 2-18
patient data
saving upon discharge, 2-20
patient list
use of, 1-28
patient sector
buttons, 1-16
Record and Save button, 1-16
Record button, 1-16
Save button, 1-16
save strips from, 3-8
patient sectors, 1-15
Patient Window, 1-16, 1-18
12-Lead ECG button, 1-21
Arrhythmia Analysis button, 1-21
icons, 1-20
making parameter adjustments to, 1-20
More Waves button, 1-21
Multilead ECG button, 1-21
NBP Alarms button, 1-21
point of care equipment
functionality, 1-12
power loss, 10-22
telemetry mainframe, 10-22
power requirements, 10-19
printers, 3-24
printing
30 second strip report, 6-7
from Alarm Review, 6-14
from Event Review, 6-28
from Trend Review, 6-21
from Wave Review, 6-36
reports, 3-24
strips, 6-14
Index-5
Q
Quick Guide
using, 1-35
R
radio frequency
troubleshooting, 9-42
re-admitting
discharged patients, 2-5
paced patients, 2-25
read-only access, 1-29
read-write access, 1-29
multiple viewers, 1-30
real-time recordings, 3-9
priority, 3-13
record all, 3-7
Record and Save button, 1-16
Record button, 1-16
recorder
4-channel
connections, 3-23
controls, 3-12
indicators, 3-12
loading paper, 3-20
unloading paper, 3-20
controls, 3-11, 3-12
loading paper, 3-17
messages at the M3 Monitor, 3-13, 3-15
removing paper, 3-19
supplies, 3-23
unit settings, 9-39
recording
continuous, 1-20
recordings, 1-11
alarm unit settings, 9-10
alarms, 3-8, 4-36
arrhythmia alarms, 3-4
extending delayed at M3 monitor, 3-7
generated from M3 or IntelliVue Patient
Monitors, 3-4
making delayed, 3-5
making real-time, 3-9
Index-6
status messages, 3-14
stopping, 3-7
turning on/off, 4-36
types, 3-3
waves recorded, 3-4
red alarms
adjustments, 4-20
reminders, 4-30
re-labeling
alarms, 6-11
reminders, 4-30
remote diagnostics, 10-25
remote viewing
no access to data, 1-30
read-only access, 1-29
read-write access, 1-29
repolarization tails, 5-16
reports, 1-11
12-lead, 1-26
from Event Review, 6-28
from Wave Review, 6-36
printing, 3-24
printing full page strip, 6-7
scheduled, 6-52
unit settings, 9-5
review windows
accessing, 6-2
alarm, 6-9
features, 6-4
navigating between, 6-4
overview, 6-2
time line, 6-4
updating, 6-5
using strips in, 6-6
RF INOPs, 9-42
rhythm status messages, 5-20
S
Save button, 1-16
saved strips
from patient sector, 3-8
viewing, 6-10
saving
patient data upon discharge, 2-20
Scheduled Reports, 6-52
sector
change equipment assigned to, 2-29
Sector Setup Window
assigning beds, 2-28
silencing
alarms, 4-28
procedure, 4-31
single lead analysis
fallback, 5-19
learning, 5-17
Smart Limits, 4-33
examples, 4-34
sound
inhibiting at bedside, 4-19
specifications
display, 10-4
ECG performance, 10-14
Information Center, 10-1
ST
adjusting measurement points, 7-5
algorithm, 7-4
measurement, 7-3
turning on/off monitoring, 7-5
viewing data, 7-3
ST alarms, 7-7
unit settings, 9-13
ST review, 7-1
enabling for bedsides, 7-5
ST Review Window
from Information Center Web, 6-67
using, 6-40
ST segment monitoring, 7-2
standby, 1-24
automatic resume monitoring, 1-24
use with bedside monitors, 1-24
use with telemetry, 1-24
status messages, 5-20
ectopic, 5-22
recording, 3-14
rhythm, 5-20
stored alarms
viewing, 6-9
stored recordings
priority, 3-13
stored waves
changing, 6-50
unit settings, 9-27
Stored Waves Window, 6-50
storing
alarm unit settings, 9-10
alarms, 4-36
turning off/on, 4-36
strips
calipers on, 6-15
comments on, 6-16
deleting, 6-13
printing, 6-14
printing full-page report, 6-7
saving, 6-6
using, 6-6
supplies
recorder, 3-23
suspending
alarms, 4-32
symbols
explanation of, 10-20
T
Telemetry Frequency Window, 9-41
RF INOP, 9-42
telemetry, standby, 1-24
time line
using the, 6-4
timeout periods, 4-23
clearing, 4-24
transferring patients, 2-23
transmitter
learning new code, 9-41
replacing, 9-41
transferring patients, 2-23
transport
discharging for, 2-18, 2-21
Index-7
trend groups
unit settings, 9-15
Trend Review Window
from Information Center Web, 6-66
printing from, 6-21
U
unit settings
alarm record/store, 9-10
arrhythmia alarms, 9-6
event groups, 9-22
menus, 9-5
recorder, 9-39
reports, 9-5
ST alarms, 9-13
stored waves, 9-27
trend groups, 9-15
volume control, 9-40
unsuspending
alarms, 4-32
updating
review windows, 6-5
V
view beds
access controls, 1-29
viewing
other bed, 2-32
patients on other centrals, 1-30
viewing care groups, 2-16
volume
adjusting alarm tone, 4-35
unit settings, 9-40
W
Wave Review Window
from Information Center Web, 6-67
navigation, 6-31
overview, 6-31
printing from, 6-36
selecting wave for, 6-50
Index-8
using, 6-33
waves
ECG examples, 5-11
storing for a patient, 6-31
viewing continuous, 6-31
viewing with an event, 6-33
web access
to Patient Data, 6-62
wireless IntelliVue Clinical Network
data loss, 1-32
interference, 1-32
low signal strength, 1-32
optimizing performance, 1-32
system messages, 1-33
excessive wireless data loss, 1-33
excessive wireless interference, 1-33
Y
yellow alarms
adjustments, 4-20
reminders, 4-30
turning off/on, 4-16
yellow arrhythmia alarms
timeout periods, 4-23