1
SECTION 3 — OPERATING INSTRUCTIONS
3-1 Bargraph Description
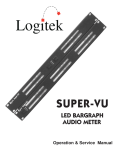
The Ultra-VU display contains two multi-LED bargraph displays mounted one above the other. The top
bar shows either left channel (L) or image/phase(φ)
information. The bottom bar shows either right channel (R) or mono sum (S) information. The bars are
marked at the left end to indicate their function. The
tricolor LEDs can be green, red or orange depending
on their function and cover the range from -70 dBFS
to 0 dBFS.
The top LED of each bar is larger and red only. It is
used as a clipping indicator and can be set to illuminate on any clipped signal or only after four consecutive clipped samples.
lectable amount of time. If the holding period expires
before the PPM dot equals or exceeds the peak hold
dot, then the peak hold dot will turn off. It will turn on
again when the PPM dot reaches a peak and starts
falling again.
Two holding modes are available. Release (Rel)
mode holds the peak reading for either 2 or 5 seconds
depending on the position of the rear panel program
switches. Maximum (Max) mode holds the highest
peak reading until it is manually reset by turning the
peak hold off and then on again.
Peak hold can be cycled through Off, Rel and Max
modes by repeatedly pressing the HOLD button at
the lower right corner of the meter front panel.
The zero reference point of the meter is indicated
by a dim orange marker in the bargraph. The reference mark can be varied between -10 and -20 dBFS
via switches on the back panel. An optional peak
marker can be set from +8 to +18 dB above the zero
reference and is used as a reference indicator for the
PPM display.
3-5 LOUD — Loudness Filter
3-2 VU Display
The loudness filter is calibrated for a listening level
of 58 dB SPL. The filter will be less accurate for listening levels above and below this point.
VU is indicated by a solid green bar. VU represents
the perceived loudness of the input signal. The motion of the bars conforms to the industry standard 300
mSec per 20 dB rise and fall times. Note that the
speed of the bar will appear faster near the top of the
meter display because each segment there represents fewer dBs than at the bottom of the meter. The
VU display can be turned off by pressing the MODE
button at the bottom left corner of the front panel repeatedly until the VU bars disappear.
The VU display can be compensated to match the
frequency response of the human ear by enabling the
loudness filter. This will cause the VU bars to more
closely represent the actual loudness perceived by
the listener and allow better level matching between
different kinds of program material.
To activate the filter, press the MODE button in the
lower left corner of the meter front panel until the
“Loud” indicator is lit.
Users of the digital input meters should note that
filtering is a function of sample rate. The meter has a
separate filter for each of the five sample rates listed
on the front panel. If a non listed sample rate is used
the loudness filter will be deactivated.
3-3 PPM Display
Peak program meter (PPM) information is shown
by a single red segment. PPM represents the highest
point of the input signal. The display has a zero rise
time and an industry standard 2.8 Sec per 24 dB fall
time. The dot will appear to fall faster near the top of
the meter range because each segment there represents fewer dBs than at the bottom of the meter. The
PPM display is always active unless it is turned off by
the programming switches on the back panel.
The VU and PPM displays are calibrated so that
they will read the same when connected to sine wave
signals. The red PPM dot will be on top of the highest
green segment of the VU bar resulting in a bright orange dot. For dynamic signals the difference between the top of the VU bar the PPM dot is
approximately the crest factor.
3-4 Peak Hold Display
The peak hold display is a single red segment that
maintains the highest PPM reading for a user se-
Page 7
3-6 I-S — Image/Sum Display
The image and sum displays are activated by
pressing the MODE button in the lower left corner of
the meter front panel until the “φ” indicator if lit.
In this mode, the lower bargraph displays the
mono sum of the left and right input channels. The
display operates identically to the left and right bargraphs except that the loudness filter is not available.
The upper bargraph shows the stereo image and
relative phase information. Three orange markers
are located at 90 degrees left, 0 degrees center and
90 degrees right. The scale covers 180 degrees
which is the largest relative phase difference two signal can have.
The red dot indicates the current location of the left
channel in the stereo sound field and the green dot indicates the current location of the right channel in the
stereo sound field. The overall width and location of
the stereo image is shown by a second pair of red and
** Ultra-VU Operation & Service Manual **