1
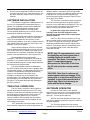
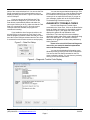
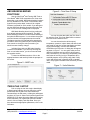
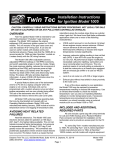
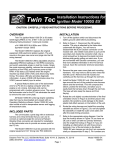
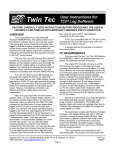
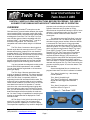
Twin Tec
User Instructions for
Twin Scan 3 ABS
CAUTION: CAREFULLY READ INSTRUCTIONS BEFORE PROCEEDING. THE USER IS
ASSUMED TO BE FAMILIAR WITH MICROSOFT WINDOWS AND PC OPERATION.
OVERVIEW
New Harley-Davidson® motorcycles use the
CAN data bus for communications between the engine
control module (ECM), instrument module (IM), body
control module (BCM), anti-skid braking system (ABS),
and diagnostic scan tools. The Twin Scan 3 is a low
cost CAN bus scan tool that is compatible with 2011
and later Softail® , 2012 and later Dyna® , and 2014
and later touring models. The Twin Scan II is
compatible with earlier models using the J1850 data
bus.
The Twin Scan 3 connects to the six terminal
Deutsch style data link connector on the H-D® wiring
harness and requires a laptop PC for user interface
and data display. H-D® deleted the continuous battery
power wire on the data link connector for 2014 touring
models. An adapter harness is required for 2014
touring models (supplied with new kits). The adapter
harness connects to the data link connector and the
adjacent eight terminal accessory power connector.
You can read and clear diagnostic trouble codes
from the ECM, BCM, speedometer, tach, and ABS.
You can view real time engine data on an instrument
panel type display.
The Twin Scan 3 features stand-alone data
logging (no laptop PC attached). This feature provides
diagnostic capabilities not found in any other available
tools. The Twin Scan 3 is especially useful for
diagnosing hard to find intermittent trouble codes. The
motorcycle can be operated while the unit is installed.
Under normal conditions (no trouble code), the unit will
store data for the last hour of operation. If a trouble
code is set, the unit automatically stops logging data
30 minutes after the code is set. Even days or weeks
later, you can download the data. You can examine in
detail what happened before and after the code was
set. You have a range of capabilities for analyzing and
printing out logged data that is displayed in a chart
recorder format.
purposes, such as looking at coil and injector drive
signals to determine why a cylinder isn’t firing.
Waveforms can be printed and saved to a file for future
reference. In scopemeter mode, the Twin Scan 3 can
be used on earlier models and other makes of
motorcycles.
The analog inputs on the Twin Scan 3 can also
be connected to a Twin Tec WEGO IIID dual channel
wide-band oxygen sensor interface. When the WEGO
is connected, the Twin Scan 3 will log engine data
along with the actual air/fuel ratio (AFR) for both front
and rear cylinders. The Twin Scan 3 is an ideal tuning
aid for use with the new Screamin Eagle® Pro Super
Tuner (SEST), Dynojet® Power Commander®, and
Daytona Twin Tec Twin Tuner series. The software
analyzes logged data and displays AFR and the
required volumetric efficiency (VE) correction (in
percent) with the same RPM rows and throttle position
sensor (TPS) or manifold pressure (MAP) columns
used in the SEST or Power Commander® tables. When
used with the Daytona Twin Tec Twin Tuner series, the
program can directly export VE correction data to Twin
Tuner data files.
Several sample data files are included in the
program folder when Twin Scan 3 software is installed:
Twin_Scan3_Sample1.log – data showing
normal operation
Twin_Scan3_Sample2.log &
Twin_Scan3_Sample3.log - data showing
air/fuel ratio data logged from attached
WEGO
Twin_Scan3_Sample.wfm – scopemeter
waveform shown in Figure 15
Figure 1 – Twin Scan 3 ABS
All Twin Scan 3 units include two analog inputs
with 0-20V or ±200V range. The unit features two
channel scopemeter capability for waveform display.
The scopemeter capability is very useful for diagnostic
Daytona Twin Tec LLC, 933 Beville Road, Suite 101-H, S. Daytona, FL 32119
(386) 304-0700 www.daytona-twintec.com
Page 1
Twin Scan 3 ABS
10/2013
PC REQUIREMENTS
The Twin Scan 3 connects to your PC by means
of a USB interface. A USB cable is supplied with the
unit. The PC must have a free USB port. If you have an
older PC without USB capability, you cannot use the
Twin Scan 3. We recommend a laptop PC with
Pentium processor and super VGA display (SVGA with
1024 x 768 pixel resolution) running Windows
XP/Vista/7/8. Data chart display is graphics intensive
and a high speed Pentium processor is recommended.
Processors slower than 300 MHz will exhibit sluggish
program loading and response. The PC must have a
CDROM drive for program loading.
Twin Scan software includes print commands to
print downloaded data. The program has been tested
with Hewlett-Packard laser and inkjet printers and
Epson inkjet printers. We recommend using a color
inkjet printer.
CAUTION: Real time display and data
logging direct to program data buffer
may fail with a time out error if the PC
has other programs running or is also
used to control a dyno system.
Windows was never intended for multitasking real time control systems. We
recommend using a separate PC with
the Twin Scan 3.
USB INSTALLATION
The Twin Scan 3 USB interface is based on the
FTDI FT232R chip and drivers that allow the unit to
emulate a standard Windows RS-232 COM port.
Updated Windows drivers, installation instructions and
troubleshooting tips are available on the FTDI website
at www.ftdichip.com. Additional information and
troubleshooting tips can be found on the PC Link Tech
FAQ on our website at www.daytona-twintec.com.
with the UAC, please refer to the Vista UAC Tech Note
on our website's PC Link Tech FAQ for details.
1. Make sure your Twin Scan 3 is not connected to
your PC.
2. Insert the Twin Tec CDROM. When the Twin Tec
autorun menu appears, click on Software. Scroll
down and click on the USB Driver link. When the
File Download dialog box appears, click on "Run
this program from its current location." Ignore any
security warnings and click on Yes to continue.
3. After installation of the driver is complete, connect
the Twin Scan 3 to the PC with the supplied USB
cable. The Windows Found New Hardware Wizard
will appear and complete installation of the USB
drivers.
COM Port Configuration
After completing the installation steps outlined
above, you must configure the new COM port using
Device Manager.
1. Windows XP: click Start, Settings, Control Panel,
System, Hardware, and then Device Manager.
Windows Vista: click Start, Control Panel, System
and Maintenance, and then Device Manager.
Windows 7/8: Click Start, Control Panel, System
and Security, and then Device Manager. For more
information, visit www.pcsupport.about.com.
2. Scroll down to Ports (COM and LPT). The new
Twin Scan 3 will appear as a USB Serial Port.
Click on this new port. Click on the Port Settings
tab.
3. Click on Advanced. In most cases the wizard will
have installed your new Twin Scan 3 as COM4 or
COM5. For optimum performance, you should
change the BM Options Latency Timer to 2 msec
as shown in Figure 2.
Figure 2 – COM Port Configuration
A new USB driver that simplifies the installation
process is available. This installs as an executable file,
similar to other Windows programs. The Windows
Found New Hardware Wizard will then detect the USB
device when it is first connected and automatically
install the correct driver without the user having to
browse out to the CDROM.
Before proceeding with installation, shutdown
any other applications that may be running. For
Windows Vista, you must disable the User Account
Control (UAC) during installation. If you are not familiar
Daytona Twin Tec LLC, 933 Beville Road, Suite 101-H, S. Daytona, FL 32119
(386) 304-0700 www.daytona-twintec.com
Page 2
Twin Scan 3 ABS
10/2013
4. Once you have configured a COM port number for
your new Twin Scan 3 unit, make sure that you use
this same COM port selection in the Twin Scan 3
software.
adapter harness is required for 2014 touring models
(supplied with new kits). The adapter harness connects
to the data link connector and the adjacent eight
terminal accessory power connector. Refer to Figure
16 on page 19 for details.
SOFTWARE INSTALLATION
The Twin Scan 3 is powered either through the
data link connector (whenever the ignition switch is
turned on) or the USB cable to the laptop PC. The unit
does not require a connection to the motorcycle in
order to communicate with the laptop PC.
The software is supplied on CDROM media or in
the form of a compressed file downloaded from our
website. The installation process uses InstallShield.
This industry standard installer is based the new
Microsoft Windows Installer service that greatly
reduces potential problems such as version conflicts
and allows for application self-repair.
Before proceeding with installation, shutdown any
other applications that may be running. For Windows
Vista, you must disable the User Account Control
(UAC) during installation. If you are not familiar with the
UAC, please refer to the Vista UAC Tech Note on our
website's Tech FAQ for details.
Use the Windows Explorer or the Run command
from the Windows Start Menu to launch setup.exe in the
Twin_Scan3 folder on the CDROM or the setup.exe file
downloaded from our website. InstallShield will install the
software in an appropriate folder under Program Files.
Once InstallShield has completed the
installation, Twin Scan 3 will appear on the Windows
Start Menu. You can then launch it just as you would
any other Windows program. Several sample data files
are included in the program folder.
Twin Scan software requires the Monospace
821 BT fixed pitch printer font in order to properly align
columns when printing. The Monospace 821 BT font is
included in the distribution media and automatically
copied to your Windows Fonts folder during
installation. A backup copy is also placed in the
program folder. If you accidentally delete this font, use
the Install New Font command from the Fonts folder
File menu. The filename associated with Monospace
821 BT is monos.ttf.
TWIN SCAN 3 OPERATION
The Twin Scan 3 connects to the six terminal
Deutsch style data link connector on the H-D® wiring
harness. In most cases, the data link connector is near
the ECM (engine control module). Refer to the H-D®
Electrical Diagnostic Manual for your model for
connector location. Some models may have similar
appearing connectors that could be mistaken for the
correct data link connector.
H-D® deleted the continuous battery power wire
on the data link connector for 2014 touring models. An
In general the engine does not have to be
running to read and clear diagnostic codes,
however the ignition switch and run/stop switch
must be turned on.
If the Twin Scan 3 is left connected, it will log
data to internal memory whenever the ignition switch is
on, even if the engine is not running. This allows
diagnosing conditions that cause the engine to stall.
However, if the ignition switch is inadvertently left on
for an extended period of time, older data will be
overwritten and lost.
NOTE: Any PC communications, such
as displaying real time engine data or
reading diagnostic trouble codes,
cause the Twin Scan 3 to stop logging
data. To restart data logging,
disconnect the Twin Scan 3 unit from
the PC and cycle the run/stop switch
off/on.
CAUTION: Twin Scan 3 units are not
sealed against moisture damage. If the
motorcycle is to be driven with the unit
installed, it should be protected with a
plastic bag. There is no warranty on
units with moisture damage.
SOFTWARE OPERATION
Connect the Twin Scan 3 to the data link
connector on the motorcycle. Use the supplied USB
cable to connect the unit to a free USB port on your
laptop PC. Turn the ignition switch on.
After the Twin Scan program is launched, the
main screen appears as shown in Figure 4 but without
any data displayed.
The Twin Scan program has auto-connect
capability and a COM port scan function to aid in initial
Daytona Twin Tec LLC, 933 Beville Road, Suite 101-H, S. Daytona, FL 32119
(386) 304-0700 www.daytona-twintec.com
Page 3
Twin Scan 3 ABS
10/2013
setup of the communications link. You can use the Port
Setup command from the Communications menu to
display the dialog box shown in Figure 3 and select the
correct COM port.
If you are not sure what COM port the Twin
Scan 3 has been assigned to, you can click on the
Scan button to automatically detect and select the
correct port. Before you do so, make sure that the Twin
Scan 3 is connected to your PC. Once the correct
COM port has been selected, the program will
remember this setting.
If you enable the Auto Connect check box, the
program will try to connect to the Twin Scan 3 every
time the program is started. Please note that you must
have the correct COM port selected and the Twin Scan
3 connected in order for auto-connect to work properly.
Figure 3 – Data Port Setup
You can test communications between the Twin
Scan 3 and the laptop PC by using the Read Firmware
ID command on the Help menu (a connection to the
motorcycle is not required for this test). If you get an
error message, please refer to the Communications
Troubleshooting Flowchart on page 17.
DIAGNOSTIC TROUBLE CODES
Use the View Diagnostic Trouble Codes
command on the View menu. Click on the Read Codes
button to display information for all available modules.
As shown in Figure 4, the upper half of the screen
displays the system ID and calibration code
information. The lower half of the screen displays
diagnostic trouble codes. Each code is displayed along
with a brief description. The software includes a
database of all diagnostic trouble codes published by
Harley-Davidson®.
Please refer to the H-D® Electrical Diagnostic
manual for your model for detailed explanations
and troubleshooting flowcharts.
You can print the displayed information to any
Windows printer by clicking on the Print Codes button.
You can use the Print Setup command on the File
menu to select the printer. You can clear any codes by
clicking on the Clear Codes button.
Figure 4 – Diagnostic Trouble Code Display
Daytona Twin Tec LLC, 933 Beville Road, Suite 101-H, S. Daytona, FL 32119
(386) 304-0700 www.daytona-twintec.com
Page 4
Twin Scan 3 ABS
10/2013
ABS BRAKE BLEEDING
FUNCTIONS
Figure 6 – Twin Scan 3 Setup
Use the View Dyna® and Touring ABS Tools or
View Softail® ABS Tools command on the View menu
depending on the model. ABS brake bleeding functions
are only available on Twin Scan 3 units with the ABS
legend on the product label. Version 6.04 or higher
firmware is required for 2014 models. If you attempt to
use the ABS brake bleeding functions with older Twin
Scan 3 units, an error message will be displayed.
ABS brake bleeding should only be performed
by a trained and experienced mechanic. The ABS
brake bleeding procedure includes manual bleeding of
the hydraulic brake system. You must have the proper
tools and access to an appropriate service manual.
The battery must be fully charged before starting the
procedure. Since the ignition key and run/stop switch
must remain on during the entire procedure, you
should connect a battery charger.
Individual front and rear ABS brake bleeding
functions are available. If you are only servicing the
front or rear brake section, you do not need to bleed
the opposite section.
To bleed an ABS brake section, click on the
appropriate button and carefully follow the prompts on
the screen.
Figure 5 – ABS Tools
You can clear the data within the Twin Scan 3
by using the Clear Twin Scan Data Buffer command
from the Communications menu.
You can also select the vehicle speed,
temperature, pressure, injector data, and air/fuel ratio
units used for real time engine data display and data
logging chart display. Use the Units Selection
command on the Edit menu. A dialog box will appear
as shown in Figure 7. You can select miles per hour
(MPH) or kilometers per hour (KPH) vehicle speed
units, Fahrenheit (F) or Celsius (C) temperature units,
and inches of mercury (In-Hg) or kilopascals (kPa)
manifold pressure units, injector pulse width or duty
cycle, and air/fuel ratio in gasoline AFR or Lambda
units. The program remembers the selections you have
made.
Figure 7 – Units Selection
TWIN SCAN 3 SETUP
Prior to using the real time engine data display
or data logging features, you must set up the correct
parameters. Use the Edit Twin Scan Parameters
command from the Edit menu. A dialog box will appear
as shown in Figure 6. Select Fuel Injection System with
WEGO IIID if you have this option attached for logging
air/fuel ratio data. For models with electronic throttle
control, click on Display Twist Grip Data. Once you
have selected the appropriate parameters, click on the
OK button.
Daytona Twin Tec LLC, 933 Beville Road, Suite 101-H, S. Daytona, FL 32119
(386) 304-0700 www.daytona-twintec.com
Page 5
Twin Scan 3 ABS
10/2013
REAL TIME ENGINE DATA DISPLAY
You can display real time engine data by using
the View Real Time Data command on the View menu.
Real time engine data is displayed on an instrument
panel type layout with round tach and speedometer
gauges and bar graph type gauges for most other
parameters. Barometric pressure, idle RPM and
system status are displayed in additional boxes. If the
engine is not running, most values will appear as zero.
FRONT INT, REAR INT –AFR error integrator
(75-125%). Values under 100% indicate the
system is correcting for a rich condition by
removing fuel. Values over 100% indicate the
system is correcting for a lean condition by
adding fuel.
FRONT INJ PW, REAR INJ PW – injector pulse
width in milliseconds or percent duty cycle
Displayed parameters include:
FRONT ADV, REAR ADV – ignition advance in
degrees BTDC
RPM – engine crankshaft RPM (numeric value
displayed beneath gauge)
FRONT KNOCK, REAR KNOCK – knock retard
value in degrees
VSS – vehicle speed (numeric value displayed
beneath gauge)
BARO – barometric pressure in In-Hg or
kilopascals (29.92 In-Hg or 101.3 kPa
corresponds to sea level atmospheric pressure)
TPS – throttle position (0 to 100%)
TGS – twist grip sensor (0 to 100%) for models
with electronic throttle control only when the
Display Twist Grip Data check box is selected as
explained in the section on Twin Scan 3 setup
MAP – manifold pressure in In-Hg or kilopascals
(29.92 In-Hg or 101.3 kPa corresponds to sea
level atmospheric pressure)
ET – engine cylinder head temperature
IAT – intake air temperature
BAT – battery voltage
IAC – idle air control stepper motor position
(higher number means more idle air)
FRONT AFR, REAR AFR –The yellow pointer
on the left side is the air/fuel ratio command
(from the AFR table programmed in the ECM).
The white pointer on the right side is the actual
air/fuel ratio measured by the original equipment
EGO sensors or the WEGO. For EGO sensors,
the AFR range is limited to about 14.5-15.0. For
the WEGO, AFR values will remain near 10 until
the sensors have warmed up.
IDLE RPM – this is the target value the system
is attempting to maintain
Additional status data is displayed in a box at
the upper right of the screen. This data includes:
IGNITION SWITCH – red if switch is off, green if
switch is on
ENGINE RUN – red if engine off/stalled, green if
engine is running
DTC SET – red if a diagnostic trouble code is
set, otherwise green
You can log data directly to the laptop PC while
real time engine data display is active by clicking on
the Start Data Logging button. Data is logged to a
buffer memory that can store 7200 data points at 10
samples/second. You can start and stop data logging
as desired. The last 7200 data points will remain in the
program data buffer in the laptop PC. Please note that
data logging to the buffer within the Twin Scan 3 is
disabled during real time display.
Daytona Twin Tec LLC, 933 Beville Road, Suite 101-H, S. Daytona, FL 32119
(386) 304-0700 www.daytona-twintec.com
Page 6
Twin Scan 3 ABS
10/2013
Figure 8 – Real Time Engine Data Display
BUFFER MEMORIES AND
DOWNLOADING DATA
There are two separate buffer memories: the
scan tool data buffer (within the Twin Scan 3) and the
program data buffer (in the laptop PC).
When the Twin Scan 3 is operated in standalone mode without a laptop PC attached, data is
logged to its internal memory. This scan tool data
buffer contains the last 7200 data points at 10
samples/second. You can download this data into the
laptop PC using the Download Data from Scan Tool
command on the Communications menu. You can
clear the data within the Twin Scan 3 by using the
Clear Twin Scan Data Buffer command from the
Communications menu.
The Twin Scan program running on the laptop
PC also has a buffer memory. The program data buffer
can obtain data from one of three sources:
1. Data can be logged directly to the program data
buffer in the laptop PC during display of real time
engine data. A count down timer appears at the
top of the program title bar showing how much time
remains before memory over write during real time
data logging. Please note that data logging to
the buffer within the Twin Scan 3 is disabled
during real time display.
2. Data can be downloaded from the Twin Scan 3. In
this case, the data is transferred from the scan tool
data buffer to the program data buffer. Note: Any
PC communications, such as displaying real
time engine data or reading diagnostic trouble
codes, cause the Twin Scan 3 to stop logging
data. To restart data logging, disconnect the
Twin Scan 3 unit from the PC and cycle the
ignition switch off/on.
3. You can also open a previously saved file using
the Open File command on the File menu. Data in
the file is loaded into the program data buffer.
Any existing data in the program data buffer is
automatically cleared when you download data or open
a file. You can also manually clear the program data
buffer by using the Clear Program Data Buffer
command from the Edit Menu.
Daytona Twin Tec LLC, 933 Beville Road, Suite 101-H, S. Daytona, FL 32119
(386) 304-0700 www.daytona-twintec.com
Page 7
Twin Scan 3 ABS
10/2013
When you use the Download Data command on
the Communications menu, the menu shown in Figure
9 appears. You can select the length of the data set
that will be downloaded.
Regardless of the original source, the contents
of the program data buffer can be saved to a file using
the Save File command from the File menu. You can
attach a comment or view an existing comment using
the Edit Comment command from the Edit menu. You
can save the data by using the Save File command
from the File menu after closing the chart display (data
is not lost by closing the chart display). You can display
a previously saved data file by first using the Open File
command on the File menu and then using the View
Chart command on the View menu.
Note that Twin Scan 3 data files use a .log
extension. You should create a separate folder to store
these files.
Figure 9 – Download Options Dialog Box
DATA LOGGING CHART DISPLAY
You can display the contents of the program
data buffer on a chart recorder type screen by using
the View Chart (Logged Data) command on the View
menu. The last data logged will appear at the right
end of the chart. You can save the data by using the
Save File command from the File menu after closing
the chart display (data is not lost by closing the chart
display). You can display a previously saved data file
by first using the Open File command on the File menu
and then using the View Chart command on the View
menu.
Data parameters are the same as those listed
on page 6 for real time data display. The only
difference is that some abbreviations are spelled out.
An additional box at the lower right side of the screen
shows the actual data logging interval in seconds.
You can use the Maximum RPM command from
the Edit menu to change the maximum RPM value
displayed on the chart.
You have a range of capabilities for analyzing
the data displayed in the chart recorder format.
You can select two parameters for display.
Trace 1 is displayed in red with its Y axis legends on
the left side of the chart. Trace 2 is displayed in green
with its Y axis legends on the right side of the chart.
The X axis is always elapsed time. You can zoom in,
zoom out, or zoom all (displays entire data file). At the
maximum zoom in level, approximately 100 data
samples will be displayed on the chart. You can use
the scroll bar to move the chart display window in
terms of elapsed time. If you hold the left mouse button
down within the chart area, a cursor line appears. The
exact values of the parameters displayed on trace 1
and trace 2 and the elapsed time appear in windows
above the chart. When you zoom in or zoom out, the
displayed data will always be centered about the
cursor line. This allows you to quickly select and
closely examine an area of interest. If you want to
analyze the elapsed time between two events (for
example the time required to accelerate from 0 to 60
MPH), you can move the cursor to the first event and
then click on the Reset Time Display button. You can
print the displayed chart to any Windows printer by
clicking on the Print button (a color inkjet printer is
recommended for best results).
Daytona Twin Tec LLC, 933 Beville Road, Suite 101-H, S. Daytona, FL 32119
(386) 304-0700 www.daytona-twintec.com
Page 8
Twin Scan 3 ABS
10/2013
Figure 10 – Data Logging Chart Display
AFR TABLE DISPLAY
AFR (air/fuel ratio) table display is only
applicable to Twin Scan 3 units when operated with an
attached WEGO. In this mode of operation, the Twin
Scan 3 is used as a data acquisition system to log AFR
data measured by the WEGO. Mating Packard
Weather Pack connectors are provided on the Twin
Scan 3 for the 0-5 volt analog output of the WEGO IIID
(white for front cylinder and blue for rear cylinder).
Refer to the WEGO instructions for installation and
operation details. Make sure that the switches on the
Twin Scan 3 are set to the 0-20V and WEGO position
when using connecting the WEGO IIID unit.
The system does not require that both front and
rear AFR data channels are always utilized. If you are
using a sniffer on a 2-into-1 exhaust, you can connect
a single WEGO sensor and associate it with either
cylinder. The data for the opposite cylinder will show
zero values.
AFR data that has been logged can be analyzed
and displayed by using the View AFR Table command
on the View menu. After the AFR Table screen
appears, you can select the table format by using the
Table Format command on the Edit menu. Select the
table format that matches the Screamin Eagle® Pro
Super Tuner (SEST), Dynojet® Power Commander®
(PC), or Daytona Twin Tec Twin Tuner system you are
using. Note that Version 3.0 uses a clearer naming
convention, i.e. 13 x 19 means 13 TPS columns and
19 RPM rows.Click on OK and then click on Refresh
Table (back in the AFR Table screen) when you have
selected the appropriate table format.
The screen snapshot in Figure 12 shows AFR
data display in SEST Twin Cam 13 x 20 format. AFR
data is displayed with the same RPM rows and throttle
position sensor (TPS) columns used by the SEST.
Daytona Twin Tec LLC, 933 Beville Road, Suite 101-H, S. Daytona, FL 32119
(386) 304-0700 www.daytona-twintec.com
Page 9
Twin Scan 3 ABS
10/2013
Figure 11 – AFR Table Format
Under Table Data, you can select front or rear
AFR. Under Table Parameters, you can select:
AFR Data Display – air/fuel ratio sensor data
(as shown above). Any cells that differ at least 0.5 AFR
from the target AFR value are shaded blue for rich or
red for lean.
AFR Command Display – air/fuel ratio
command (useful for determining what values the ECM
attempting to maintain).
VE Percent Correction Display – required
volumetric efficiency correction in percent, based on
the target AFR value (AFR command or manually
entered target value). Any cells that differ at least 0.5
AFR from the target AFR value are shaded blue for
rich or red for lean.
Use AFR Command as Target – recommended
choice as this will give the most accurate results. If not
selected, you can manually enter a target AFR value.
Figure 12 – AFR Display
Daytona Twin Tec LLC, 933 Beville Road, Suite 101-H, S. Daytona, FL 32119
(386) 304-0700 www.daytona-twintec.com
Page 10
Twin Scan 3 ABS
10/2013
Target AFR –manual target AFR value used to
determine required percent VE correction. You might
use a manual target AFR of 13.2 if you are using the
tuning approach outlined in the earlier SEST manual
where all SEST AFR table cells are set to 13.2 during
tuning.
can also left click on the upper left legend cell to select
the entire table and then right click to bring up the copy
menu. For more details on using Excel, including
sample spreadsheets, please visit the Twin Scan 3 Tec
FAQ on our website at http://www.daytonatwintec.com.
Minimum Samples Per Cell – default value is
5. Setting a higher value results in more accurate table
values, but may result in fewer total cells with enough
samples to appear in the table.
Alternately, you can manually enter the required
corrections in the SEST software by referring to the
printed VE percent correction table and marking off
cells as you edit them.
Filter Unstable Data – when this option is
selected, a data sample is only included if the
preceding sample was also in the same cell. This
option reduces errors during transients, but may
prevent any data from being included during rapid
acceleration.
You are adding the calculated VE correction
values from the Twin Scan 3 to the SEST VE table.
Select 1% increment/decrement to allow one click per
percent. Mark off each cell on the printout after you
correct it. Corrected cells will also appear shaded in
the SEST program.
After you select a different table format or
change the table data or table parameters, you must
click on the Refresh Table button to display the revised
table.
SEST Tuning Steps
The screen snapshot in Figure 13 shows VE
percent correction display in SEST Twin Cam 13 x 20
format. You can click on the Print button to print out the
table.
You can analyze data from multiple files that you
previously saved. If you want to add more data
(perhaps logged under conditions that will yield
coverage of additional cells), use the Open Additional
File command from the File menu. The data will be
analyzed and incorporated into the table. You can
open an unlimited number of additional files. However,
you cannot refresh the table format or parameters once
you open an additional file. These selections will
become grayed out. Also, you cannot save or view the
original data once you open an additional file. Make
sure you save any downloaded data before opening an
additional file.
To start a new analysis, you must exit from AFR
Table Display and then use the Open File (or
Download) command from the main menu.
SCREAMIN EAGLE® PRO SUPER TUNER
(SEST) TUNING RECOMMENDATIONS
You can use two approaches to make the
required corrections in the SEST program. If you have
Microsoft Office with Excel, you can directly copy and
paste data from the Twin Scan 3 software to an Excel
spreadsheet and then copy and paste from the Excel
spreadsheet into the SEST program. In the Twin Scan
3 software, you can select a range of cells with the
mouse and right click to bring up a copy menu. You
1. Temporarily install the WEGO sensors on the front
and rear exhaust pipes.
2. We do not recommended that you use the
cumbersome tuning approach outlined in the SEST
manual where all SEST AFR table cells are set to
13.2 during tuning. This is not necessary as the
Twin Scan logs the AFR command at any given
point in time and uses it as the target value to
calculate the required VE correction. Leave the
SEST AFR table set to the values you actually
want the engine to run when you are done tuning.
3. Use the Twin Scan 3 system to log, download, and
save several sets of data under varying conditions.
Use a medium data logging interval (2
samples/sec) for runs at steady speeds and a short
interval (5 or 10 samples/sec) for runs with rapid
acceleration and transients.
4. Data in decel areas (low 0-2% TPS above idle
RPM) should be regarded with caution as exhaust
reversion effects may cause errors. Unless you are
experiencing a significant problem during decel, we
suggest that you ignore these cells.
5. Analyze the data, print out the VE percent
correction tables, enter the required corrections in
the SEST program, save your edited data to a file,
and program the ECM.
6. Repeat steps 3-5 until no shaded cells (excessively
rich or lean) appear in the VE percent correction
table. Don’t worry about cells with a few percent
error. If no shaded cells appear, everything is
within ±0.5 AFR. This is about the expected
accuracy of the original equipment speed-density
ECM.
Daytona Twin Tec LLC, 933 Beville Road, Suite 101-H, S. Daytona, FL 32119
(386) 304-0700 www.daytona-twintec.com
Page 11
Twin Scan 3 ABS
10/2013
Figure 13 – VE Percent Correction Display
POWER COMMANDER® TUNING
RECOMMENDATIONS
You can use two approaches to make the
required corrections in the Power Commander® (PC)
program. If you have Microsoft Office with Excel, you
can directly copy and paste data from the Twin Scan 3
software to an Excel spreadsheet and then copy and
paste from the Excel spreadsheet into the PC program.
In the Twin Scan 3 software, you can select a range of
cells with the mouse and right click to bring up a copy
menu. You can also left click on the upper left legend
cell to select the entire table and then right click to
bring up the copy menu. For more details on using
Excel, including sample spreadsheets, please visit the
Twin Scan 3 Tec FAQ on our website at www.daytonatwintec.com.
Alternately, you can manually enter the required
corrections in the PC software by applying the printed
VE percent corrections calculated by the Twin Scan 3
to the PC fuel table. You are adding the calculated VE
correction values from the Twin Scan 3 to the PC fuel
table. You can mark off cells as you edit them.
Power Commander® Tuning Steps
1. Temporarily install the WEGO sensors on the front
and rear exhaust pipes.
2. Start with an available Power Commander® (PC)
map that most closely matches your application.
Most PC maps will have a single fuel table. Tuning
individual cylinders with the PC is difficult. The
ECM ends the injection after bottom dead center
on the intake stroke at about the same time that
the intake valve closes. The PC adds fuel by
extending the injection duration. If you try to add a
significant amount of fuel with the PC, the fuel may
wind up going to the opposite cylinder. As long as
you are adding the same amount of fuel to both
Daytona Twin Tec LLC, 933 Beville Road, Suite 101-H, S. Daytona, FL 32119
(386) 304-0700 www.daytona-twintec.com
Page 12
Twin Scan 3 ABS
10/2013
cylinders, the fuel robbing effects cancel out. We
suggest that you use a single fuel table and
analyze your data for the worst case correction
required for either cylinder.
http://www.daytona-twintec.com/tech_tuner.html.
Use the PC Link Tuner software to upload this map
to the Twin Tuner. Exit from the PC Link Tuner
software.
3. Use the Twin Scan 3 system to log, download, and
save several sets of data under varying conditions.
Use a medium data logging interval (2
samples/second) for runs at steady speeds and a
short interval (5 or 10 samples/second) for runs
with rapid acceleration and transients.
3. Use the Twin Scan 3 system to log, download, and
save several sets of data under varying conditions.
Use a medium data logging interval (2
samples/second) for runs at steady speeds and a
short interval (5 or 10 samples/second) for runs
with rapid acceleration and transients.
4. Data in decel areas (low 0-2% TPS above idle
RPM) should be regarded with caution as exhaust
reversion effects may cause errors. Unless you are
experiencing a significant problem during decel, we
suggest that you ignore these cells.
4. Analyze the front cylinder data and print out the VE
percent correction table for reference. Then use
the Export to Twin Tuner command on the File
menu to automatically apply the corrections to your
Twin Tuner setup file.
5. Analyze the data, print out the VE percent
correction tables, enter the required corrections in
the PC map, save your edited map to a file, and
send the map to the PC.
5. Analyze the rear cylinder data and print out the VE
percent correction table for reference. Then use
the Export to Twin Tuner command on the File
menu to automatically apply the corrections to your
Twin Tuner setup file.
6. Repeat steps 3-5 until no shaded cells (excessively
rich or lean) appear in the VE percent correction
table. Don’t worry about cells with a few percent
error or minor imbalance between cylinders.
TWIN TUNER TUNING
RECOMMENDATIONS
When using a Twin Tuner, you will apply the VE
percent corrections calculated by the Twin Scan 3 to
the Twin Tuner front and rear cylinder fuel trim tables.
You are adding the calculated VE correction values
from the Twin Scan 3 to the Twin Tuner fuel trim
tables. When used with the Daytona Twin Tec Twin
Tuner series, the program can directly export VE
correction data to Twin Tuner setup files. No manual
editing is required. Figure 14 shows a typical Twin
Tuner fuel trim table.
Twin Tuner Tuning Steps
1. Temporarily install the WEGO sensors on the front
and rear exhaust pipes.
6. Use the PC Link Tuner software to open the
modified Twin Tuner setup file and compare the
printouts made in steps 4 and 5 with the front and
rear cylinder fuel trim tables to verify that the
values are reasonable. Remember that all VE
percent correction values are added to the fuel trim
tables, i.e. if a fuel trim cell was +10% before
exporting data and the VE correction was +5%, the
cell should now be +15%. Note that rounding of
numbers may cause the final values to vary ±1%.
7. Data in decel areas (low 0-2.5% TPS above idle
RPM) should be regarded with caution as exhaust
reversion effects may cause errors. Unless you are
experiencing a significant problem during decel, we
suggest that you always leave these cells at zero
percent correction.
8. Repeat steps 3-6 until no shaded cells (excessively
rich or lean) appear in the VE percent correction
table. Don’t worry about cells with a few percent
error or minor imbalance between cylinders.
2. Start with an available Twin Tuner setup map (file)
that most closely matches your application. Setup
files for typical applications are available for
download from the Twin Tuner Tech FAQ at
Daytona Twin Tec LLC, 933 Beville Road, Suite 101-H, S. Daytona, FL 32119
(386) 304-0700 www.daytona-twintec.com
Page 13
Twin Scan 3 ABS
10/2013
Figure 14 – Twin Tuner Fuel Trim Table
ORIGINAL EQUIPMENT OXYGEN
SENSORS
All new motorcycles are equipped with dual
narrow-band oxygen sensors and an ECM that
supports closed loop AFR control based on feedback
from the sensors. After the engine has warmed up, the
ECM attempts to maintain the AFR at 14.6 during idle
and part throttle cruise (typically at or below 40% TPS).
Near wide-open throttle, the ECM is programmed for
reasonable target AFR values of 12.5-12.8. Since this
is beyond the range of the narrow-band oxygen
sensors, operation near wide open throttle is open loop
without any corrections based on feedback from the
sensors. Several factors must be considered when
tuning engines equipped with closed loop control:
1. Unless you disable the oxygen sensors or use a
tool such as the SEST to remap the AFR table in
the ECM, you cannot change the 14.6 AFR value
at idle and part throttle. Closed loop AFR control in
the ECM will counteract any attempt to change the
14.6 AFR value in the idle and part throttle range if
you increase fuel in this range with add-on
controllers such as the Power Commander® or
Twin Tuner.
2. Make sure that all engine components are
designed to operate properly at idle and part
throttle cruise with this relatively lean 14.6 AFR.
Some aftermarket camshafts, heads, or head
modifications may result in excessive lean surge or
stalling at idle.
3. If installation of an aftermarket exhaust is planned,
it must have provision for the oxygen sensors.
Reversion effects in open exhausts will cause
problems with the oxygen sensors giving a false
lean indication at idle and part throttle. If you can
insert a broomstick through the mufflers, you have
the equivalent of open drag pipes and the exhaust
may not work properly with a closed loop system.
The tuning strategy depends on the type of
system used:
SEST and Other Systems that Remap the
ECM
1. The first step is to edit the AFR table. The values
at wide open throttle are reasonable for most
applications and should not be changed. However,
you must decide whether or not to retain closed
loop control throughout the idle and part throttle
range. Closed loop operation is enabled in any cell
Daytona Twin Tec LLC, 933 Beville Road, Suite 101-H, S. Daytona, FL 32119
(386) 304-0700 www.daytona-twintec.com
Page 14
Twin Scan 3 ABS
10/2013
with the value 14.6. Refer to the SEST
documentation for details.
2. You can use the Twin Scan 3 with optional WEGO
system to automatically calculate required fuel
corrections throughout the entire engine operating
range from idle to wide open throttle. Temporarily
installing the WEGO sensors in place of the
original equipment narrow-band oxygen sensors
(disconnect sensors) will cause the ECM to remain
in open loop without any fuel corrections that
would affect the tuning process. After tuning is
completed, reinstall the original equipment sensors
and clear any trouble codes.
Power Commander®, Twin Tuner, and
Other Add-On Controllers
1. As stated above, unless you disable the oxygen
sensors by installing oxygen sensor eliminators,
you cannot change the 14.6 AFR value at idle and
part throttle. Closed loop AFR control in the ECM
will counteract any attempt to change the 14.6 AFR
value in the idle and part throttle range if you
increase fuel in this range with the add-on
controller.
2. You can use the Twin Scan 3 with optional WEGO
system to automatically calculate required fuel
corrections throughout the entire engine operating
range from idle to wide open throttle. Temporarily
installing the WEGO sensors in place of the
original equipment narrow-band oxygen sensors
(disconnect sensors) will cause the ECM to remain
in open loop without any fuel corrections that
would affect the tuning process. After tuning is
completed, reinstall the original equipment sensors
and clear any trouble codes.
SCOPEMETER FEATURE
The Twin Scan 3 includes a scopemeter feature
that allows display of two signal waveforms and is very
useful for diagnostic purposes. The optional probe kit
P/N TSCAN3-PROBE-KIT includes two insulation
piercing probes and extension wires with mating
Weather-Pack connectors that plug into the white
(channel 1) and blue (channel 2) analog inputs on the
Twin Scan 3. Insulation piercing probes allow easy
connection to any point on the motorcycle wire
harness. The scopemeter feature is independent of the
scan tool capability and can be used on any vehicle.
The kit includes a power adapter for use on earlier
H-D® motorcycles with four terminal diagnostic
connector. An additional power cord with alligator clips
is provided for general purpose use with any +12 volt
power source. Refer to the Twin Scan 3 probe kit
instructions for details.
Two switches on the side of the Twin Scan 3
allow selection of the voltage range for the channel 1
and channel 2 analog inputs. The low range is 0-20V
and is suitable for most signals except crankshaft
position sensor, coil drive, and injector drive signals
that require the high ±200V range.
To use the scopemeter feature, connect the
probes to the desired signals, make the appropriate
range switch selections, make sure the Twin Scan 3
has power, and click on View Scopemeter Data on the
View menu. The scopemeter display will appear similar
to Figure 15 that shows crankshaft position sensor and
coil drive waveforms.
Much of the display functionality is similar to the
data logging chart display except that you are looking
at signal waveforms in real time. You can select:
Channel 1 and Channel 2 – voltage range
selections will appear based on the low/high range
switch setting. Use the lowest voltage range for the
best display resolution. If data appears off the display,
use a higher range selection.
Time Base – use the time base setting that
gives the best display. Values are in milliseconds
(msec) per division. The horizontal axis has ten
divisions shown by tick marks.
Trigger Select/Edge – you can select which
channel and signal edge (rising or falling) the unit will
trigger on. The trigger point is at 20% of the horizontal
time scale (2 divisions or tick marks from the left side).
In Figure 15, the unit is triggering on the rising edge of
the coil drive waveform on channel 1 at 10 msec. The
unit automatically selects an optimum trigger threshold
based on the minimum and maximum signal values.
Run/Stop/Single – you can select the
operating mode. In run mode, the unit continually
captures new signal data. The Stop button freezes the
last data captured. Each time you click the Single
button, one signal waveform is captured.
The remaining functions operate the same as in
the data logging chart display. You can zoom in or out,
move the cursor to measure signal levels, print the
signal waveforms, and save or open waveform files
from the File menu. Waveform files use a .wfm
extension. You should create a separate folder to store
these files. For additional information and resources
including reference waveforms for common ECM
signals and diagnostic tips, please visit the Twin Scan
3 Tec FAQ on our website at www.daytonatwintec.com.
Daytona Twin Tec LLC, 933 Beville Road, Suite 101-H, S. Daytona, FL 32119
(386) 304-0700 www.daytona-twintec.com
Page 15
Twin Scan 3 ABS
10/2013
Figure 15 – Scopemeter Display
Daytona Twin Tec LLC, 933 Beville Road, Suite 101-H, S. Daytona, FL 32119
(386) 304-0700 www.daytona-twintec.com
Page 16
Twin Scan 3 ABS
10/2013
IMPORTING DATA INTO EXCEL
Data files saved from the Twin Scan program
are in comma delimited ASCII format. You can easily
import a data file into other programs such as Microsoft
Excel for further analysis. You can also view data files
with a text editor such as Windows WordPad. To
import a data file into Excel:
COMMUNICATIONS
TROUBLESHOOTING FLOWCHART
Follow the communications troubleshooting flowchart
shown below. Experience has shown that most
communication problems are motorcycle electrical
system faults, user error, or PC compatibility issues.
1. Start Excel. In the File Open dialog box, select
Files of type: All Files (*.*). Then browse for the
data file.
2. The Text Import Wizard appears. For step 1, select
delimited file type. For step 2, select comma
delimiter. For step 3, select general column data
format. Then click on Finish.
3. You can then format the data and save the
spreadsheet as an Excel file.
STARTING
POINT
IS COM TIMEOUT OR ECM NOT FOUND
ERROR MESSAGE DISPLAYED WHEN
ATTEMPTING PC COMMUNICATIONS?
YES
NO
FOR MISC PROBLEMS,
CALL TECH SUPPORT.
USE DVM TO CHECK DATA LINK CONNECTOR
ON MOTORCYCLE. PIN 2 GROUNDED AND
+12V ON PINS 5-6 WITH IGNITION KEY ON?
NO
YES
REPAIR WIRE HARNESS
FAULT ON MOTORCYCLE.
USE WINDOWS DEVICE MANAGER TO
VERIFY THAT CORRECT COM PORT IS
SELECTED. IS PROBLEM FIXED?
YES
NO
DONE
TRY USING ANOTHER PC. IF THIS
DOES NOT SOLVE THE PROBLEM,
CALL TECH SUPPORT
FOR FURTHER INFORMATION.
All trademarks on this document whether
registered or not, are the property of their
respective owners. The authors of this
document are not sponsored by or
affiliated with any of the third-party
trademark or third-party registered
trademark owners, and make no
representations about them, their owners,
their products or services.
Daytona Twin Tec LLC, 933 Beville Road, Suite 101-H, S. Daytona, FL 32119
(386) 304-0700 www.daytona-twintec.com
Page 17
Twin Scan 3 ABS
10/2013
Figure 16 – Adapter Harness for 2014 Touring Models
Daytona Twin Tec LLC, 933 Beville Road, Suite 101-H, S. Daytona, FL 32119
(386) 304-0700 www.daytona-twintec.com
Page 18
Twin Scan 3 ABS
10/2013