1
HELSINKI POLYTECHNIC
Faculty of Information Technology
Software Engineering
GRADUATE STUDY
TEST AUTOMATION OF DIGITAL MAMMOGRAPHY DEVICE
Author: Kari-Matti Kangas
Supervisor: Veijo Inkiläinen
Instructor: Auvo Häkkinen
Approved: May
, 2008
Auvo Häkkinen
Senior Lecturer
PREFACE
Thanks to my supervisor Veijo Inkiläinen. Also thanks to all my colleagues for their help
with the hardware and software components, and for reviewing this graduate study.
Thanks to my instructor Auvo Häkkinen. Also thanks to Jonita Martelius for her help with
English language issues.
Thanks to my parents for their support throughout my studies. Thanks to my brother for
introducing me to the world of computers and programming. Also, thanks to my sister for
her general motivation.
Thanks to my beautiful wife for visualizing the entirety. This study would not have been
written without your endleeeeess love and support.
Helsinki April 29, 2008
Kari-Matti Kangas
ABSTRACT
Name: Kari-Matti Kangas
Title: Test Automation of Digital Mammography Device
Date: April 29, 2008
Number of pages: 37
Department: Information Technology
Study Programme: Software Engineering
Instructor: Auvo Häkkinen, Senior Lecturer
Supervisor: Veijo Inkiläinen, Engineering Manager
Testing of a complex software is time consuming. Automated tools are available
quite a lot for desktop applications, but for embedded systems a custom-made
tool is required
Building a complete test framework is a complicated task. Therefore, the test
platform was built on top of an already existing tool, CANoe. CANoe is a tool for
CAN bus analysis and node simulation. The functionality of CANoe was extended
with LabVIEW DLL. The LabVIEW software was used for simulating hardware
components of the embedded device
As a result of the study, a platform was created where tests could be automated. Of
the current test plan, 10 percent were automated and up to 60 percent could be
automated with the current functionality.
Keywords: Test automation, Embedded systems, CANoe, LabVIEW
TIIVISTELMÄ
Tekijä: Kari-Matti Kangas
Työn nimi: Test Automation of Digital Mammography Device
Päivämäärä: 29.4.2008
Sivumäärä: 37
Koulutusohjelma: Tietotekniikka
Suuntautumisvaihtoehto: Ohjelmistotekniikka
Työn valvoja: yliopettaja Auvo Häkkinen
Työn ohjaaja: Engineering Manager Veijo Inkiläinen
Monimutkaisen ohjelmiston testaus on aikaa vievää. Automatisoituja työkaluja on
saatavilla työpöytäohjelmistoille, mutta sulautetuille järjestelmille räätälöity
työkalu on tarpeen.
Kokonaisen testausympäristön rakentaminen on työläs tehtävä. Sen takia testaus
työkalu on rakennettu jo ennestään olevan työkalun, CANoen, päälle. CANoe on
CAN väylän analysointiin ja siinä olevien solmujen simulointiin tarkoitettu työkalu.
CANoen ominaisuuksia lisättiin LabVIEW DLL:llä, jota käytettiin sulautetun
järjestelmän liitännäiskomponenttien simulointiin.
Työn tuloksena syntyi testausalusta, jossa testejä voitiin automatisoida. Tämän hetkisen testaussuunnitelman testeistä 10 prosenttia automatisoitiin ja lähes 60 prosenttia voitaisiin automatisoida työkalun nykyisillä ominaisuuksilla.
Avainsanat: Testauksen automatisointi, Sulautetut järjestelmät, CANoe, LabVIEW
CONTENTS
1
INTRODUCTION
1
2
MAMMOGRAPHY DEVICE
3
3
TEST AUTOMATION
8
3.1
Benefits and Drawbacks of Test Automation . . . . . . . . . . . . . . . . .
8
3.2
Test Automation of Embedded Systems . . . . . . . . . . . . . . . . . . .
10
4
TOOLS AND TECHNOLOGIES
12
5
ANALYSIS OF TEST AUTOMATION PROTOTYPE
16
5.1
Problems with Test Automation Prototype . . . . . . . . . . . . . . . . . .
17
5.2
Conclusions . . . . . . . . . . . . . . . . . . . . . . . . . . . . . . . . . .
17
6
7
ARCHITECTURE OF NEW TEST AUTOMATION SYSTEM
18
6.1
Hardware Architecture . . . . . . . . . . . . . . . . . . . . . . . . . . . .
19
6.2
Software Architecture . . . . . . . . . . . . . . . . . . . . . . . . . . . . .
22
6.2.1
Roles of the Software Components . . . . . . . . . . . . . . . . . .
23
6.2.2
Software Layers . . . . . . . . . . . . . . . . . . . . . . . . . . .
25
RESULTS AND ANALYSIS
28
7.1
Example of Automated Test Case . . . . . . . . . . . . . . . . . . . . . . .
28
7.2
Latency of Software Components . . . . . . . . . . . . . . . . . . . . . . .
31
7.3
Simulation of the Motor . . . . . . . . . . . . . . . . . . . . . . . . . . . .
32
7.4
Improvement Opportunities . . . . . . . . . . . . . . . . . . . . . . . . . .
32
7.4.1
TestStand as Test-runner . . . . . . . . . . . . . . . . . . . . . . .
32
7.4.2
Only FPGA Hardware in the Test Bench . . . . . . . . . . . . . . .
33
7.5
8
Next Phases . . . . . . . . . . . . . . . . . . . . . . . . . . . . . . . . . .
DISCUSSION AND CONCLUSIONS
REFERENCES
34
35
36
LIST OF FIGURES
1
The gantry. . . . . . . . . . . . . . . . . . . . . . . . . . . . . . . . . . .
4
2
The gantry in operation. . . . . . . . . . . . . . . . . . . . . . . . . . . . .
5
3
CAN nodes of the device. . . . . . . . . . . . . . . . . . . . . . . . . . . .
6
4
Process of driving the motor on lift board. . . . . . . . . . . . . . . . . . .
6
5
Using CANoe to simulate parts of the system. . . . . . . . . . . . . . . . .
13
6
CAPL events. . . . . . . . . . . . . . . . . . . . . . . . . . . . . . . . . .
13
7
The old software architecture. . . . . . . . . . . . . . . . . . . . . . . . .
16
8
An example of PXI system. . . . . . . . . . . . . . . . . . . . . . . . . . .
19
9
Internal structure of a PXI system. . . . . . . . . . . . . . . . . . . . . . .
19
10
The hardware architecture of test automation system. . . . . . . . . . . . .
21
11
Software architecture of the test automation system . . . . . . . . . . . . .
22
12
Component diagram of the software. . . . . . . . . . . . . . . . . . . . . .
24
13
Software layers of the system . . . . . . . . . . . . . . . . . . . . . . . . .
26
14
Sequence diagram of the example test case. . . . . . . . . . . . . . . . . .
30
15
Software layers of the system after improvements. . . . . . . . . . . . . . .
33
TERMS
CAN
CAPL
COM
DAQ
DC
DLL
FPGA
GPIB
HDL
PCI
PWM
PXI
UPS
VI
Controller Area Network
CAN Access Programming Language
Component Object Model
Data Acquisition
Direct Current
Dynamic-Link Library
Field Programmable Gate Array
General Purpose Interface Bus
Hardware Description Language
Peripheral Component Interconnect
Pulse Width Modulation
PCI eXtensions for Instrumentation
Uninterrubtable Power Supply
Virtual Instrument
1
1
INTRODUCTION
Automated software testing is quite common these days and a lot of frameworks are available
for the developers on this area. Automated testing of an embedded system is not as common.
One reason for this is that each company has their own products with custom hardware. For
unit testing at software level, tools can be found, but for testing the whole software on an
embedded board is something that general tools can not manage. To manage this, a custommade tool is required. This study describes one such tool that is used for automated testing
of an embedded device.
This graduate study was done for GE Healthcare Finland Oy, which is part of the global
GE Healthcare that produces diagnostic imaging equipment and applications. The section is
specialized on building mammography devices. The purpose of the study was to continue the
prototype development that had been started earlier on building a test automation platform
for a digital mammography device, since it has been noticed that the time spent on testing
the device was unnecessary long and test coverage was poor.
The main purpose of the test automation tool is to use it for executing verification tests on
part of the system, leaving the test engineer free to concentrate on designing tests instead of
just executing the tests manually. Manual testing will still be used where more applicable,
for example in test cases where automation does not give enough benefits compared to the
amount of work it takes.
With an automated testing tool, the time spent for testing can be dramatically decreased from
a couple of weeks to a few hours. Test automation makes it possible to extend the tests to
cover areas that are impossible to manage manually. This would make it possible to move to
a completely different type of development process.
After the introductory chapter, the second chapter describes the Senographe DS device that
is tested. First there is a higher level description of the devices used for operating the system.
Later in the chapter more details are given on the parts of the device that are being tested.
Chapter 3 analyzes the benefits and drawbacks of test automation. This chapter also explains
briefly how test automation can change the development process. Additionally, it introduces
ways to manage automation of higher level tests of an embedded system and how it differs
from testing a PC application.
Chapter 4 gives a description of the tools and technologies that are the core components
of this study. Chapter 5 analyses the test automation prototype built earlier. This chapter
contains a brief explanation on how the system works and what the problems in this design
were. The chapter ends in a conclusion of the analysis.
2
In chapter 6, a detailed description of the current prototype is given. The hardware platform
is first described and the software that was built on top of that, later in the chapter. The roles
of different components is discussed in Chapter 6.2.1 and software layers that each give a
different level of abstraction of the underlying hardware, in Chapter 6.2.2.
Chapter 7 describes and analyses the outcome of this study. Chapter 7.1 describes an example
test case that was automated. Chapter 7.2 analyses the delay of the software components and
introduces ways for reducing the latency. Chapter 7.3 discusses the simulation of the motor
and Chapter 7.4 lists a few possibilities for improving the system. The chapter ends with a
list of task that need to be done before the system can be taken in to use, and finally, Chapter
8 contains a discussion and conclusions of the study.
3
2
MAMMOGRAPHY DEVICE
This chapter describes the mammography device that is being tested. The information in
this chapter is based on the service manual of the device and other non-public documents.
Therefore no references are marked in this chapter.
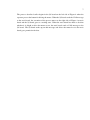
Senographe DS is a digital mammography device that is used for breast cancer screening.
The system consists of three parts, the control station, the generator and the gantry.
The control station is a computer workstation with custom-built user interface. It has a
dedicated mouse and keyboard with special keys that help operating the device. The control
station is connected to the network for reading and modifying client information. In the
screen of control station, the digital X-ray images can be viewed. The generator cabinet
contains an UPS (Uninterrubtable Power Supply) and electronics of the control station.
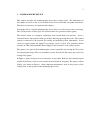
The gantry is the part of the mammography system responsible for moving the X-ray tube
and exposing the image. The test automation system described in this study only covers the
testing of the gantry.
In Figure 1, gantry and parts of its user interface are presented. Both, the arm control keypads
and the footswitches can be used to control the movements of the gantry. The gantry readout
display, also shown in Figure 1, shows important information, such as the pressure of the
compression, to the operator of the mammography device.
4
Figure 1: The gantry. Image copyright GE Healthcare.
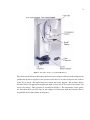
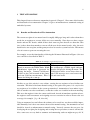
The client stands in front of the gantry and her breast is compressed between the compression
paddle and the breast support by the operator of the device, in order to improve the contrast
of the X-ray image. The digital detector is under the breast support. The operator adjusts
the tube head to an appropriate height and angle, focuses the X-ray beam to the breast and
exposes the image. This operation is described in Figure 2. The movements of the gantry
are described more precisely later in this chapter in connection with the hardware that is
responsible for the movements of the gantry.
5
Figure 2: The gantry in operation. Image copyright GE Healthcare.
The logic of the gantry is divided between one main board and additional boards. The main
board has control of everything and nothing can be done without its orders. In addition, the
main board handles communication with the control station. The additional boards are used
for driving motors and getting data from the user interface devices connected to the gantry.
The additional boards come in two types, stepper and DC (Direct Current), and are used for
driving two types of motors, stepper and DC, respectively.
Regarding this study, the stepper boards that are in an important role are compression and
bucky. The compression board is used for compressing the breast between the compression
paddle and the breast support, in order to produce a better image. The bucky board is used
for making the image better, by moving a grid back and forth on top of the digital detector.
Likewise, lift and rotation are the most important DC boards regarding this study. The lift
board is used for lifting the c-arm up and down, and the rotation board is used for rotating
the c-arm from left to right in order to produce a better view for the image.
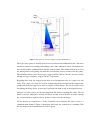
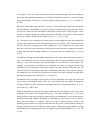
All the boards are connected to a CAN (Controller Area Network) bus that is used as a
communication channel. Figure 3 shows how the boards are connected to a common CAN
bus. In chapter 4 more information on CAN is given.
6
Figure 3: CAN nodes of the device.
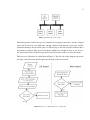
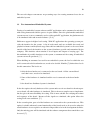
When the operator of the device presses a button, for example to move the c-arm up, a digital
pin on the lift board is set to high state causing a hardware interrupt in a processor. On this
particular interrupt, the lift board sends a CAN message to the main board to indicate that a
movement is required. The main board checks whether it is alright to move or not. If it is,
the main board sends a CAN message back to the lift board to order it to drive the motor.
This process is illustrated as a flowchart in Figure 4. The left side of the diagram represents
the logic of the lift board and the right side the logic of the main board.
Figure 4: Process of driving the motor on lift board.
7
The process described earlier begins in the lift board on the left side of Figure 4 when the
operator presses the button for driving the motor. When the lift board sends the CAN message
to the main board, the execution of the process moves to the right side of Figure 4 to main
board and the lift board goes to a waiting state. When the main board has made a decision
whether it is alright to drive the motor or not, the main board sends a CAN message to the
lift board. The lift board wakes up on this message and drives the motor in case the main
board gave permission for that.
8
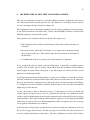
3
TEST AUTOMATION
This chapter discusses about test automation in general. Chapter 3.1 lists some of the benefits
and drawbacks of test automation. Chapter 3.2 gives an introduction to automated testing of
embedded systems.
3.1
Benefits and Drawbacks of Test Automation
The current test plan of one motor board is roughly 100 pages long and it takes about three
weeks for an engineer to execute all the test cases manually. Since there are three stepper
boards and two DC boards, which all have their own test plans that all are about the same
size, it takes about four months to execute all the tests for the motor boards. Also, the main
board has its own test plan, and the gantry needs to be tested at system level also. This means
a lot of resources spent on executing the tests.
For example, to test the functionality of driving the lift motor illustrated in Figure 4, the test
case could be as described in Table 1.
Table 1: An example of a lift board’s test case.
Action
Connect an oscilloscope to pin xx on lift
board to measure the PWM (Pulse Width
Modulation) signal that is generated for
driving the motor. Connect CANalyzer/CANoe to the CAN network of the gantry
and start CAN bus measurement. Press a
button for lifting the c-arm up.
Expected outcome
The c-arm moves up and on the screen of
the oscilloscope a PWM signal indicates
that the lift board is driving the motor. The
CANalyzer/CANoe screen shows that certain CAN messages were sent between the
lift and main board.
Needless to say, this activity is very tedious, causing the test engineer to loose his/her concentration. This kind of tiresome manual testing is also quite error-prone, it is easy for the
test engineer to let a failure in the system go unnoticed. Automation of tests makes it possible to run the tests after work hours, so that the results are viewable in the next morning.
This saves the engineer’s time for a more useful work, instead of mundane repetition of tests,
the engineer could concentrate on designing new test scenarios in order to increase the test
coverage, for example. [1, p. 46, 48 to 49]
Using an automated test tool allows the software to be tested in a way that would be impossible manually, but it does not remove the need for manual testing. An automated test tool
should be viewed as enhancement to manual testing. It merely executes the test cases, for
developing the test plan plus designing and creating the test procedure, a man is still needed.
Also, some tests are very hard to automate and automating such test might not pay off. If,
9
for example, a test case is only executed occasionally, and automating such a test would take
more time than manually running the test for the total number of times it is executed during
the product lifetime. In such case, manual testing is a better option. [1, p. 33, 47 and 51; 2,
p. 229.]
Therefore automated testing can not be viewed as a silver bullet that would solve all quality
related problems. Automating a test process that is not designed properly will only execute
the test cases faster, but does not improve the quality of the system. It will only give a false
sense of security by showing test reports that indicate that there are no defects, when actually
the defects could be found with the right test cases. [1, p. 51; 2, p. 10.]
As a downside of test automation, the time used for testing might increase when automated
testing is first introduced to the development process of a product. This reduction in efficiency is due to the learning curve of the testing tool. A test engineer needs to first learn
how to use the tool, before automated testing becomes more productive compared to manual
testing. After the initial learning, efficiency is expected to increase enormously. [1, p. 34, 49
to 51.]
In addition, verifying and maintaining automated test cases takes more effort than manual test
cases. An automated test tool can only compare the values of expected output and observed
outcome. It can not investigate the reasons behind, in case the values do not match. For
example, a test engineer executing the tests manually can correct a wrong test bench setup
immediately, but an automated tool cannot continue on such a problem. Therefore, the test
cases need to be evaluated more precisely. Additionally, when the tested software changes,
the automated test cases need to be updated and verified. This process might even take more
time than running the tests manually. [2, p. 10 and 17.]
Automated testing can support all test phases, the most important ones being regression and
stress testing. According to studies, these areas of testing are the ones where an automated
testing tool shows its most usefulness, and should therefore be implemented first. [1, p. 38,
248 to 249; 2, p. 230 to 232.]
Without automated tests that the developer could run after each change in the code, refactoring the code is hard. According to Fowler [3, p. 89 to 90] and Myers [4, p. 179 to 181]
having solid tests that are preferably automated and ran continuously, is an essential precondition for refactoring. With an automated test environment, regression tests can be executed
after each code change, for example. This way, it can be ensured that the system is still
working properly and no new bugs are introduced to the system. Often making a change in
one part generates an error in other part of the software. Refactoring and continuous testing
would allow the development process to be changed towards agile methods. [4, p. 147, 178
to 181]
10
The next sub chapter concentrates on presenting ways for creating automated tests for an
embedded system.
3.2
Test Automation of Embedded Systems
Testing of an embedded system software and PC application can be automated at unit level
with testing frameworks and the process is quite similar. Since the platform that embedded
systems run on, is not as commonly used as with regular PC application, the platform needs
to be simulated with stub or mock software. [5; 6.]
Differences appear in higher level testing. With PC applications the operating system provides the interface for the system. A lot of ready-made tools are available for record and
playback of mouse and keyboard usage. But when an embedded system is to be tested from
outside of the board, the interface to the system is hardware specific and customized by the
company. This interface often contains a lot of inputs and outputs of varying type. For
this multitude of possible interfaces to the system, a common tool for testing all embedded
systems can not be produced. [7.]
When building an automated test tool for an embedded system, the level at which the test
tool is connected to the board under test, needs to be decided. Kandler [7] defines three levels
for this connection. The levels are
1 Only the board under test is connected to the test bench. All the external hardware that it uses, needs to be simulated.
2 Some of the hardware is simulated and the rest is connected to the board under
test.
3 One board in a distributed system is simulated.
In the first option, the only hardware of the system under test in test bench is the microprocessor board, all other hardware is simulated. This is the most complex one to implement,
but also gives the most flexibility for testing. This is most suitable for verifying the actions
and responses of the board. Because all the signals are simulated, this option allows the
testing of all error conditions. [7.]
In the second option, parts of of the hardware are connected to the system under test. This
option is suitable when only some functionality of the board needs to be tested or when the
actual hardware is too expensive or otherwise impossible to be in the development facilities.
Only the missing parts will be simulated and the software components that control these can
be tested. [7.]
11
In the last option, one board in a distributed system is simulated. This option allows the rest
of the system to be tested by simulating errors on one board. [7.]
Kandler also gives two different approaches for simulating the hardware components. First
approach is full simulation, where the required signals are simulated in the test bench. This
gives the maximum flexibility for different types of testing. The second approach is routing
the actual signals coming from the hardware components through the test bench to the device
under test. This way the actual signals can be corrupted in order to generate exceptions to test
the error handling capacities of the device. This approach does not give as much flexibility,
but the benefit is that building the test bench requires a lot less resources and can thus be
taken into use much faster. Also, by corrupting the actual signals, testing can be done on a
different level. [7.]
12
4
TOOLS AND TECHNOLOGIES
This chapter describes the tools and technologies that are the key components of the test
automation system described in more details later in this study. Tools and technologies that
are in a smaller role or are not preconditions for understanding the following chapters, are
described later, as they appear in this study.
All the tools and technologies introduced in this chapter are part of both systems, the prototype described in the next chapter and the new test automation system described in Chapter
6, except for one difference. The previous prototype used COM (Component Object Model)
as a communication channel between CANoe and LabVIEW, and the new system uses a
DLL (Dynamic-Link Library) to attach LabVIEW functions to CANoe. DLL technology is
described in this chapter. Details about COM and how it was used for the communication,
can be found in the study [8] made of the previous prototype.
CAN
CAN (Controller Area Network) is a serial communication protocol, which efficiently supports distributed real-time control with a very high level of security. CAN comprises of three
layers, physical layer, transfer layer and object layer. [9, p. 4 to 6]
The physical layer is responsible of transferring the bits between different nodes in the network. The transfer layer controls the message framing, performs arbitration and manages
error checking, for example. Within the transfer layer it is decided whether the bus is free
for starting a new transmission. The object layer takes care of message filtering. [9, p. 4 to
6]
The object and transfer layers comprise all services and functions of the data link layer
defined by the ISO/OSI model. The CAN physical layer is equal to the physical layer in
ISO/OSI model. [9, p. 4]
CANoe
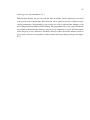
CANoe is a software that provides a comprehensive set of measurement and simulation capabilities for a CAN-based module or system developer. CANoe can interface multiple CAN
networks and provide accurate time-stamped measurements for all communication transfer.
CANoe can be used in testing of a distributed system by simulating some of the CAN nodes.
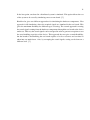
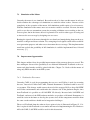
Figure 5 illustrates a test setup where CANoe is used for simulating rest of the system while
13
testing one node of CAN network. [10, p. 6 to 7]
Figure 5: Using CANoe to simulate parts of the system while one module of the network is being tested. [10,
p. 7]
In the figure, a laptop is connected to the CAN bus with a CAN card. CANoe acts as a
regular node in the bus and simulates the rest of the system when one module of the network
is under test.
CANalyzer is a similar tool to CANoe, but it can only simulate one node of the network,
while CANoe can simulate multiple nodes. CANalyzer is mostly a tool for analyzing the
CAN bus and it lacks several functionalities that CANoe has.
CAPL
CAPL (CAN Access Programming Language) is a C-based programming language used
exclusively in CANalyzer and CANoe environments. CAPL is an event-based procedural
programming language. In Figure 6 different types of CAPL events are shown. [10, p. 1, 3.]
Figure 6: CAPL events [10, p. 3].
On each of these events, a CAPL function that is implemented by the programmer, is called.
This way, CANoe can be programmed to react on certain CAN messages, on keys pressed
by the user and on other events. [10, p. 1, 3.]
14
DAQ
Data acquisition (DAQ) is measurement or generation of physical signals. Depending on
how the DAQ card can handle various types of signals, the data can be analog, digital or
timing I/O. Some DAQ cards are designed for a special use, such as high-resolution analog
signal measurement, thus containing very few or none digital and timing I/O channels. Also
so-called multifunction cards are available, which have a combination of analog, digital and
timing I/O channels. [11, p. 384 to 411.]
LabVIEW
LabVIEW is a powerful and flexible graphical programming environment. LabVIEW programs are called VIs (Virtual Instrument). LabVIEW is designed for engineers and scientist,
and VIs are often used to simulate or replace real instruments or devices. LabVIEW provides
an extensive library of VIs for helping the programming task. [11, p. 3 to 4.]
LabVIEW is a data flow programming language, meaning that the order of commands can
not be known. The commands are executed when input data arrives to them. The order of
commands can be forced, but it is often not required. Data flow makes multitasking easy
to program and is often done by LabVIEW without the programmer knowing about. For
example, two loops that do not require an input from each other, are executed in parallel.
[12, p. 7 to 8.]
DLL
DLL (Dynamic-Link Library) is a library, which is shared with all the processes that have
loaded it. Only one instance of a DLL is loaded into the memory of the operating system.
Each process that has loaded the DLL have their own private data section of the DLL, unless
specified to be sharer, but the code is shared amongst all the processes that have loaded the
DLL. This reduces the memory usage, because the code is loaded in to the memory only
once. [13.]
The functions of a DLL can be linked in to the process with two methods, load-time dynamic
linking and run-time dynamic linking. With load-time dynamic linking, the process has to
have the library header file and an import library when it is compiled. The DLL functions
can be used as local functions. The functions are loaded into the operating system memory
when the process is loaded and a link is made to those functions. The DLL functions can be
changed as long as the interfaces of the functions remain the same, i.e. the parameters and
15
return types are left unmodified. [13.]
With run-time linking, the process loads the DLL at runtime, and the library does not need
to be present at the compile time. Each function can be loaded as needed, resulting a faster
startup performance. Programming a process that uses a DLL with run-time linking is a bit
more complicated than with load-time linking. The programmer has to use a special function
for loading each function into memory. Also it is very important to release the DLL handle
before the process ends. Otherwise, the DLL will not be removed from the memory when no
process has a reference to it anymore and the memory of the operating system gets corrupted.
[13.]
16
5
ANALYSIS OF TEST AUTOMATION PROTOTYPE
The test automation system designed earlier was based on COM (Component Object Model)
communication between CANoe and LabVIEW. Components were published between the
two programs with COM. Remote components of another program could be used as if they
were local. This design is shown in Figure 7.
Figure 7: The old software architecture.
Both LabVIEW and CANoe were executed as independent processes with their own memory
space. A direct function call from one program to another was not possible. For this reason,
the linkage was built with COM. LabVIEW published a set of DAQ (Data Acquisition) related components to CANoe, and CANoe published CAN related components to LabVIEW.
The DAQ card, used by LabVIEW and CAN card, used by CANoe, were connected to the
board that was being tested. [8, p. 13 to 22.]
This prototype was executed in a normal desktop PC with PCI (Peripheral Component Interconnect) CAN and DAQ cards. The DAQ card (NI PCI 6025E) provides 32 digital I/O
ports, two analog outputs, 16 analog inputs and two counters for generating signals that were
used to simulate the real hardware of the gantry. The CAN card (CANCardXL) contains two
independent CAN ports, which can both be used for reading and sending CAN messages on
the bus. [8, p. 4 to 5; 14.]
LabVIEW produced an user interface where the user could start tests. The tests were CAPL
scripts in CANoe environment, which were activated from LabVIEW through COM. [8, p.
13 to 22.]
Chapter 5.1 characterizes the problems that this prototype had and Chapter 5.2 contains
conclusions of the analysis of this prototype.
17
5.1
Problems with Test Automation Prototype
The communication was based on CANoe environment variables, which were defined in
CANoe database and also as global variables in LabVIEW. For each environment variable, a
CAPL function was written. This function would be executed when an event occurs on the
specified variable. Because of this, the system was very hard to configure and maintain.
A problem with COM was that CANoe can not be a COM client. This means that in order
to boot the system, LabVIEW needs to be started first and a startup VI (Virtual Instrument)
needs to be executed. This VI started CANoe and then ran the CAPL code. The CAPL
script then waited for changes in the states of the CANoe environment variables and sent
or received CAN messages to and from the node, according to the variables. Instead of
using CANoe as a test runner which it is meant for, a custom-made runner VI had been
implemented. Implementing new test cases in this VI was not very straight-forward. [10, p.
151; 8, p 13 to 22, 28 to 32.]
Communication through COM also showed a varying delay of 80 to 100 milliseconds. This
varying delay made the synchronization of CAN messages and the DAQ card signals very
hard to accomplish. COM seemed to be also somewhat unstable, causing occasional software
crashes.
To simulate a motor encoder signal, for example, at least three digital pulses need to be generated. Since the PCI-6025E only has two counters, and that not being the only shortcoming
it has, it was clear that also new hardware platform was needed. [14.]
5.2
Conclusions
The facts mentioned above led to the decision that COM was rejected and a new way to
combine the use of CANoe and LabVIEW needed to be found. It was planned that the
LabVIEW code applied earlier would be re-used, or at least parts of it. But since it was done
with older DAQ drivers, which do not allow more than one thread to access the hardware
at time, thus making the code unusable. Considering that in addition the hardware was not
adequate enough, the whole project was re-designed from the scratch.
This new design is described in chapter 6. It contains the explanation of both, the new
hardware and the new software design.
18
6
ARCHITECTURE OF NEW TEST AUTOMATION SYSTEM
The new test automation system has a somewhat different software architecture and is based
on a different hardware from the previous one. The hardware is described in more detail in
the next sub chapter and the software in chapter 6.2.
The requirements for test automation platform were the same as with the previous prototype.
It was still decided that ready-made tools, CANoe and LabVIEW would be used instead of
building completely custom-made system.
Three options were considered for the test bench. The options were
1 Full simulation where all the external hardware, like motor and footswitches are
simulated.
2 In-system testing, where the board under test is connected to the gantry during
the execution of the tests. This would require the least amount of simulation of
the hardware.
3 A combination of these two where parts of the hardware is simulated.
It was required that the test bench would be independent, so that fully assembled gantries
could be used for other types of testing. On the other hand full simulation of the hardware
would require too much effort at this point, so the third option was chosen and the external
hardware is simulated gradually.
It is designed that in future all the hardware is going to be simulated, so that the test bench
will only contain the system described in this study where the board under test is connected.
For now, some hardware components are connected to the board and as mentioned in Chapter
3.1 it might not even be reasonable to simulate all the hardware, since the effort of simulation
might not pay off in the end.
At first, the testing is done as black-box testing. Certain inputs are fed to the board and
certain outputs are expected as a result. It is planned that later the test automation system
could be used for manipulating actual signals coming from the adjacent I/O devices such as
the footswitches. This requires that the actual hardware signals are routed through LabVIEW
before they are sent to the board. With manipulation of the real signals, more test coverage
can be gained with different test scenarios.
In the first phase, the prototype is planned to be used for executing the validation tests for the
DC and the stepper motor boards. For this prototype, the lift board was chosen because of
its most complicated hardware connections. After the validation tests of the lift board have
19
been automated, moving to other boards will be relatively easy. More of the future work and
ideas for improvements are presented in Chapter 7.4.
6.1
Hardware Architecture
Instead of the PCI DAQ card, the new system uses a PXI (PCI eXtensions for Instrumentation) chassis where multiple PXI modules can be connected. PXI is an open industry
standard launched in 1998. A PXI system comprises of three elements: chassis, controller
and modules. An example PXI system is illustrated in Figure 8. [15.]
Figure 8: An example of PXI system. [15].
The chassis contains a high-performance PXI backplane, which includes the PCI bus and
timing and triggering buses. With timing and triggering buses, and a common 10 MHz
system reference clock, precise synchronization of the PXI modules is possible. [15.]
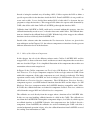
Figure 9 illustrates the internal structure of the PXI system, showing the synchronization
buses and the reference clock. [15].
Figure 9: Internal structure of a PXI system. [15].
20
The PXI chassis can be controlled from a laptop or a desktop PC, or with an embedded
controller as shown in Figure 8. An embedded controller is built from normal PC components
in to a small PXI package. It can run normal PC operating systems and other software. From
within the software on the PXI controller, the devices connected to the PXI are shown as any
other PCI device connected to a PC. So, building software on this platform does not differ
from programming in a normal operating system. [15.]
Because PXI is an open industry standard, several vendors provide PXI modules that are
compatible with each other for different uses. This modular nature of the PXI allows the
system to be used with different hardware configurations as needed. [15.]
The PXI configuration used in the test automation prototype, consists of PXIe-1062Q chassis, three DAQ modules which are PXI-7830R, PXI-6254 and PXI-6601, and Vector CANBoardXL PXI CAN card.
The PXIe-1062Q is a hybrid chassis with 8 slots for PXI and PXI Express modules. Four
of the slots are for PXI modules only, two are for PXI Express modules and two are hybrid
slots where either PXI or PXI Express modules can be used. [16, p. 1.].
PXI-6254 is a multifunction DAQ module that has 32 analog inputs, two analog outputs, 24
digital I/O channels and 8 counters. PXI-6601 is a dedicated high-speed counter module.
It contains four 32-bit counters and 32 individually configurable 32-bit digital I/O channels. The PXI-6601 module has many measurement and generation modes, such as event
counting, time measurement, frequency measurement, encoder position measurement, pulse
generation, and square-wave generation. [17; 18.]
PXI-7830R is a FPGA (Field Programmable Gate Array) DAQ module. The module has four
analog inputs and four analog outputs, and 56 digital I/O channels that can be configured as
digital input and output or as counters. [19.]
FPGA is a device that contains programmable logic components that can be programmed to
perform the function of basic logic gates, such as AND or XOR, or a combination of these.
The FPGAs are usually programmed with HDL (Hardware Description Language) and the
executable is copied to the memory of the FPGA. [20.]
The main difference between FPGA programmed DAQ modules and other DAQ modules,
beside the different programming API, is that the executable is loaded in to the memory of
the FPGA board before the module can be used. With the other DAQ modules, the operating
system uses the device drivers when an application needs to use a DAQ module.
The CAN hardware used is Vector CANBoardXL PXI. It has two independent CAN channels
for reading and sending messages on the bus. [21.]
21
The PXI system that is used for the test automation platform has a controller built inside it
with Windows XP operating system installed. It can be thought as a portable computer with
special hardware and software that is dedicated to test automation.
Devices, such as power supply, are connected to the PXI chassis through GPIB (General
Purpose Interface Bus) and can also be controlled via LabVIEW functions.
GPIB is a standard for interconnecting and controlling its line of programmable instruments.
GPIB differs from data acquisition by bringing data that has been acquired by another computer or instrument, while data acquisition involves connecting signal directly to DAQ device
in the computer. [11, p. 570.]
The GPIB is used for controlling power on and off functions of a power supply, and for
measuring and generating digital pulses with an oscilloscope. An oscilloscope is also used
via GPIB to store images of the signals for the test report.
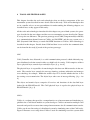
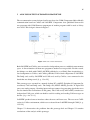
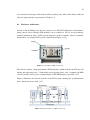
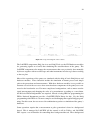
The hardware architecture of the test automation system is illustrated in Figure 10. The
figure shows the roles of different PXI modules and the purpose of GPIB and the external
devices connected to GPIB, in relation with the board that is being tested.
Figure 10: The hardware architecture of test automation system.
As the figure shows, the boards of the mammography device are tested as black-boxes independent from the rest of the system. The main board is simulated via the CAN bus and the
hardware of the device is simulated with the DAQ modules and with the adjacent instruments
controlled via GPIB. The software that uses these hardware components for the simulation,
is described in the next section.
22
6.2
Software Architecture
Quite as in the prototype implemented earlier, also in this one CANoe is used for CAN
related functionalities. All other hardware operations are carried out with LabVIEW. The
LabVIEW code is built in to a DLL that is called from CAPL scripts. All the test logic is
in the CANoe side. CANoe only uses external library calls to simulate the hardware of the
gantry and to manage other hardware operations.
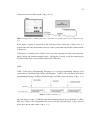
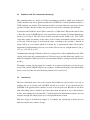
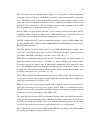
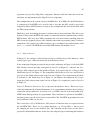
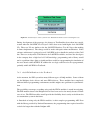
These three software units comprise the Test Automation Software that is presented in Figure
11. The software units run on Windows XP operating system in the PXI embedded controller
that was discussed in the previous subchapter.
Figure 11: Software architecture of the test automation system
The test automation system makes it possible to control the board under test from the CAPL
test scripts in CANoe via CAN messages and the user interface hardware simulated with
LabVIEW. With these tools, the board can be connected to a test bench for executing the test
cases, instead of the in-system testing done when manually executing the tests. CANoe is
the test runner and responsible for generating the test reports. CANoe is used for simulating
the main board while other boards are tested, and for testing that the CAN messages sent by
the board under test are valid.
As the Figure 11 illustrates, the DAQ and GPIB functionalities are controller via the LabVIEW DLL, and the CAN hardware can be used directly by CANoe. The test cases are
implemented as CAPL scripts in CANoe environment. Once a DLL has been loaded by
CANoe, the functions in the DLL can be used as any CAPL function. This makes the test
development in CANoe side straight-forward.
23
Instead of using the standard way of loading a DLL, CANoe requires the DLL to define a
special exports table for the functions inside the DLL. From LabVIEW it is not possible to
create such a table. It was decided that another DLL is built with C++ between the two
programs to adapt the interfaces. This wrapper DLL defines the exports table demanded by
CAPL, thus all the calls from CAPL to LabVIEW go through this interface DLL.
Callbacks from LabVIEW to CAPL could not be executed without this wrapper, since the
callback functionality needs to use C++ headers that come with CANoe. The callback functions are defined in the callback block of CAPL. With the help of the wrapper, the callback
functions can be used directly from LabVIEW code.
Details of the software units that constitute the Test Automation Software are given in the
next subchapter and in Chapter 6.2.2, the software components are introduced as they present
different abstraction levels of the hardware.
6.2.1
Roles of the Software Components
In this chapter, the role of the different software units, CANoe, LabVIEW DLL and the
wrapper DLL, is discussed in more detail, and the most central components that create these
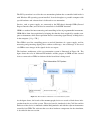
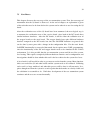
units are described. Figure 12 is a simplified illustration of the components that each the test
automation software unit comprises of.
In Figure 12 the CANoe components are Test Scripts, PXI Hardware Functions and Callback Functions. Test Scripts component comprises of the test logic written in CAPL. From
within this component, all the other components are used, directly or indirectly. The DAQ
operations carried out by LabVIEW, are used via Adapter for PXI Hardware Functions and
PXI Hardware Functions Interface components. The PXI Hardware Functions Interface
component exports a set of PXI hardware functions from the DLL and the Adapter for PXI
Hardware Functions component makes the LabVIEW functions compatible with CANoe.
In CAPL, the callback functions are defined in component Callback Functions, which are
called from the wrapper DLL in Callback Interface component.
The callbacks are used directly from the wrapper when a function call to LabVIEW fails.
In this case an error handling callback function is called in the CAPL. The callbacks are
used from the LabVIEW DLL through the component Adapter for Callbacks, which exports
an callback interface to LabVIEW. Likewise, this component uses the Callback Interface
component. From LabVIEW, the callbacks are used for informing the CAPL code that a
certain background operation is done. Also, the callback functions from LabVIEW are used
for sending error information to CAPL.
24
Figure 12: Component diagram of the software.
The LabVIEW components DAQ functions and DAQ Tasks use the PXI hardware modules
for generating signals on a board, thus simulating the actual hardware of the gantry. The
LabVIEW components also manage the measurements that were previously done manually
by the test engineer with an oscilloscope and other instruments in order to get data according
to the test plan.
Most of the operations of the gantry are simulated with the help of basic DAQ drivers and
hardware modules. These functions include the simulation of button presses and simple
pulse train generations and measurements. With these hardware modules it was possible to
automate several of the test cases when some hardware components of the gantry were connected to the board under test. For more complicated configurations, such as motor encoder
signal measurement and changing the value of a potentiometer according to a correlation,
the R-Series FPGA DAQ module was required. Instead of using HDL for programming the
FPGA, National Instruments provides a LabVIEW FPGA library for this. Yet, the DAQ
programming with FPGA is a lot more complex and challenging than regular DAQ programming. For this reason, the two are used in combination to produce a simulation of the gantry’s
hardware.
Some operations require that a measurement or pulse generation is done in a background
thread. This is managed by LabVIEW. All the control is still in CANoe, and LabVIEW
DLL exports a set of functions for controlling these background threads. These background
25
operations are part of the DAQ Tasks component. Function calls that return the results immediately, are implemented in the DAQ Functions component.
The configuration of the system is done with XML files. In an XML file, the PXI hardware
is configured for LabVIEW to be used in such a way that the DLL could be used with
completely different PXI hardware as long as the configuration file will tell the DLL what
the PXI system contains.
XML file is used for defining the gantry’s hardware that is being simulated. This file is read
by both, CANoe and LabVIEW, and it makes a connection between symbolic names and the
PXI hardware. This way, the CAPL programmer does not need to know anything about the
PXI system, the engineer only uses the symbolic names that represent the gantry’s hardware
components. For example, in CAPL to simulate a press of a button, the symbolic name could
be button1, but for LabVIEW this tells which PXI module and channel is used.
6.2.2
Software Layers
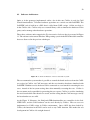
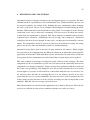
In Figure 13, the software is divided into four layers all built on top of the hardware. Each
of these layers give a different abstraction of the hardware below.
In the component diagram presented in the previous subchapter in Figure 12, the LabVIEW
DLL software unit on the right corresponds to layer L2 in Figure 13. Likewise the C++
Wrapper DLL software unit in the middle of Figure 12 is equal to the C++ Wrapper DLL
block inside layer L3 in Figure 13. The components PXI Hardware Functions and Callback
functions in the CAPL software unit on the left side of Figure 12 are equivalent to the block
Test Hardware API inside layer L3 in Figure 13. In addition, the component Test Scripts
inside the CAPL software unit on the left side of Figure 12 is roughly the same as layer L4
in Figure 13.
Layer L1, Hardware Abstraction Layer represents the hardware drivers. This layer is provided and maintained by National Instruments. It is a programming interface that is in direct
connection with the hardware. It consists of a set of DLLs that are used from within LabVIEW when DAQ operations are programmed. These functions are present in LabVIEW’s
functions palette once the drivers have been installed. The LabVIEW programmer does not
need to link these DLLs in any way.
The second layer (L2), PXI Hardware API consists of functions that are exported outside
the LabVIEW DLL. These are very simple functions, e.g. ChangeDIO(...) that are used
for changing the state of one hardware pin. The functions on this layer use the drivers
provided by National Instruments. In this layer the complex logic of simulating the hardware
26
Figure 13: Software layers of the system
of the gantry is implemented with LabVIEW. It was decided to keep this layer as simple as
possible, so that it will export only few general functions for all the operations. The simple
DAQ functions are general, but the functions that are executed in a background thread are
more complex and could not be generalized so well. This means that for operations, such
as measuring a PWM signal, unique functions were implemented. The reason for trying to
make the functions general was that all the functions in this layer need also to be exported
from the wrapper DLL to CANoe. Exporting the functions twice, increases the probability
of introducing a bug in the system.
The layer L3 is composed of two parts, the C++ Wrapper DLL and Test Hardware API. The
wrapper is simply a link between LabVIEW and CANoe and it binds together layers L2 and
L3 by exporting the LabVIEW functions of L2 to CANoe environment. The Test Hardware
API is a set of CAPL functions for abstracting the tests more from the underlying hardware.
Functions that the Test Hardware API provides are, for example, PressPedal(long PedalID)
and SetPower(double voltage).
The layer L4, Test Cases illustrates CANoe and CAPL code as the test runner. This is part
of the software where the test execution logic is implemented. This layer uses the CAPL
functions defined in the previous layer. Part of this layer are also the CANoe databases that
are used for different CAN configurations.
Each of these software layers have only knowledge of the layer directly underneath. This
way, the programmer of layers L2 and L3 does not need to know who is using the layer and
how, he/she only provides an interface to the functions for the upper layer programmer to
use. Likewise, the programmer of test logic in layer L4 does not need to know anything
about the DLLs and how certain hardware operations are carried out.
There are a few reasons why CANoe is used as the test-runner even the fact that LabVIEW
code could be used easier from other such applications. The main reasons being that the
27
device is heavily based on CAN communication, in which area CANoe is an excellent tool
for simulation and measurement of the network. Because of this, also CANoe/CANalyzer
is anyway going to be used for investigating the device in the company. CAPL is also well
known language by the developers, and easy for new developers to learn, so it is a natural
choice for test case programming language.
28
7
RESULTS AND ANALYSIS
The results of this study were encouraging and the test automation platform proved its usefulness. With the platform described in this study, approximately 10 percent of the test cases
in the test plan of the lift board were automated and with the current simulation of the hardware of the gantry, close to 60 percent of the test cases in the test plan of the lift board could
be automated. To have 60 percent of the test cases automation is only a matter of writing
these test cases with CAPL, the LabVIEW functionality that is required for this, is already
implemented.
Some of the automated test cases still require a test engineer’s presence, since the DC motor
has not yew been simulated and uncontrolled motion on the motor needs to be generated.
This only requires a minute of the engineer’s time, and the execution of the automated tests
lasts for about five minutes, instead of two full work days needed, if the tests were executed
manually. Since the order of the test cases can be chosen, the test cases that require engineer’s
presence can, for example, be executed first. This way, the engineer can leave the system
executing the tests independently.
The next subchapter gives an example of an automated test case. This example is explained
and analyzed thoroughly. Chapter 7.2 discusses the latency of the test automation software
and what can be done to reduce it. Chapter 7.3 discusses the possibilities for simulating the
motor. Chapter 7.4 lists a few potential ways to improve the prototype. Finally, the next
steps for the prototype are gone through in Chapter 7.5.
7.1
Example of Automated Test Case
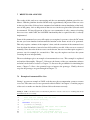
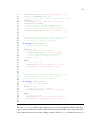
Listing 1 presents an example of CAPL code that uses the test automation system to execute
a test case. The same test case was presented earlier in Table 1 in Chapter 3.1 and the purpose
of the test is to make sure that the lift board drives the motor correctly.
Listing 1: CAPL code that uses the test automation platform to execute a test case for checking that the lift
board drives the motor correctly.
1
2
3
4
5
6
7
8
9
10
11
/*
Test case for testing that the lift
drives the motor correctly .
*/
testcase liftUpTest () {
pressButton ( cArmUp );
// Start measuring the PWM signal with LabVIEW
startPWMMeasurement ();
// Wait for the on message cArmUpPressed
// to be executed . If the message does not
// arrive within one second , the test step fails
29
12
13
14
15
16
17
18
19
20
21
22
23
24
25
26
27
28
29
30
31
32
33
34
35
36
37
38
39
40
41
42
43
44
45
46
47
48
49
50
51
52
53
54
55
56
57
58
59
60
61
62
63
TestWaitForTextEvent ("c - arm up pressed " , 1000);
result = endPWMMeasurement ();
// Fail the test step if the results are not correct
if( result == ...)
TestStepFail (" Lift PWM signal incorrect " );
releaseButton ( cArmUp );
// Wait for the on message cArmUpReleased
// to be executed . If the message does not
// arrive within one second , the test step fails
TestWaitForTextEvent ("c - arm up released " , 1000);
}
/*
Message block for simulating main board actions
on CAN message that is sent when a button
for moving the c - arm up is pressed .
*/
on message cArmUpPressed {
// Analyze the CAN message
// ...
if( msg == OK ) {
// Text event for the TestCase
TestSupplyTextEvent ("c - arm up pressed " );
// Send a CAN message to lift board that
// it is alright to drive the motor
output (...);
}
else {
// Fail test step
TestStepFail (" Lift not sending the correct
CAN message for driving motor up ." );
}
}
/*
Message block for simulating main board actions
on CAN message that is sent when a button
for moving the c - arm up is released .
*/
on message cArmUpReleased {
// Analyze the CAN message
// ...
if( msg == OK ) {
// Text event for the TestCase
TestSupplyTextEvent ("c - arm up released " );
}
else {
// Fail test step
TestStepFail (" Lift not sending the correct
CAN message for stopping the motor drive ." );
}
}
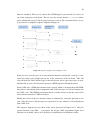
The two on message blocks in the example code are executed when the defined CAN message is detected on the bus. Both of these simulate the functionality of the main board and
give feedback to the test case that is being executed. In the testcase block, the press of a
30
button is simulated. The test case ensures that a PWM signal is present and it is correct, on
one of the connectors of the board. The test case also ensures that the on message blocks
give feedback that correct CAN messages has been received. The execution of this test case
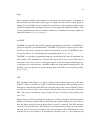
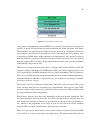
is presented as a simplified sequence diagram in Figure 14.
Figure 14: Sequence diagram of the example test case.
In this test case, first the press of an user interface button for moving the c-arm up, is simulated by setting a pin to high state on one of the connectors of the lift board. This will
cause the board to send CAN messages to the main board, and to expect messages as reply.
Additionally, it causes the lift board to generate a PWM signal for driving the motor.
From CAPL code, a PWM measurement task is started, which is an independent LabVIEW
thread that is left running in the background while CAN messages are read and analyzed in
the CAPL code. The PWM measurement thread is finally destroyed and the result of the
measurement returned to CAPL for analysis.
Finally, the release of the user interface button is simulated by setting the pin back to low
state. After this, more CAN messages are expected to be sent, which are read and analyzed
with CAPL code.
The sequence diagram does not show all the layers discussed in Chapter 6.2.2. Only the
general function changeDIO... is presented, but for the CAPL programmer higher level
functions are available, such as PressPedal(long PedalID) that was mentioned earlier.
31
7.2
Latency of Software Components
The delay of calling functions and making callbacks was measured by using the timeNow()
CAPL function. The measurement was set up in the following way: first from CAPL
timeNow() function was called and the time was printed on the CANoe write window. Right
after this, a function in the LabVIEW DLL was called via the wrapper DLL. The LabVIEW
function only used a callback function to inform CANoe that the function call was done.
When CAPL registered the callback, timeNow function was called again and the time was
again printed on the write window.
On the screen, both the times that were printed showed exactly the same time. Windows time
resolution is not very exact, but CANoe uses its own timer on the CAN card, so this gave
promising results on the delay of a function call and callbacks. [22, p. 146.]
Since the wrapper uses run-time linking when it calls the functions in the LabVIEW DLL,
the call time for each function is a bit longer than when load-time linking is used. Research
needs to be done whether it is possible to use load-time linking, since the DLLs are loading
each other in order to manage the callbacks, so using load-time linking in the wrapper might
cause problems in the build process. Other means for decreasing the function call delay is
that instead of linking the LabVIEW DLL function each time it is called, the wrapper DLL
could use some internal structure where the function pointer is stored after the first linking.
This way the function calls can be made faster, in case it is required.
In addition the callback handling limit of the software was measured. The measurement
setup for this was the following: A LabVIEW VI that counted pulses coming from a signal
generator, was created. This VI was started as a background operation from CANoe. The VI
used a callback function to inform CANoe each time it detected a rising edge on the signal.
The LabVIEW VI counted the number of rising edges it detected and CANoe counted the
number of callbacks it reacted on. These two numbers where then compared.
The results showed that in an optimal case when the processor of the test bench is not
strained, the frequency of callbacks can be 500 Hz. This means that in an optimal case,
again, the delay between callbacks must be at least 2 milliseconds. When the usage of the
processor was strained to maximum, the frequency of the callbacks can be only 20 Hz. This
means that the delay between callbacks must be at least 50 ms in order to make sure that
CANoe receives the callback.
Since the test automation system uses a normal desktop operating system, unnecessary background processes are constantly running. The efficiency of the system can be improved by
tweaking the operating system in order to make it dedicated for executing the test automation
software.
32
7.3
Simulation of the Motor
Currently the motor is not simulated. Research needs to be done on this matter in order to
decide whether the advantages of simulation are worth the effort it takes. Because of the
complexity of the operation of the motor, full simulation would require a lot of resources.
With the simulation of the motor, more test scenarios could be executed. For now, the main
goal is to use the test automation system for executing validation tests according to the current test plans, but in the future, the tool is planned to be used for other types of testing and
to increase the test coverage by designing new test cases.
Routing the signals of the motor through the test bench and manipulating them on the way,
would be a cheaper and faster solution. Yet, corrupting of real signals would still be useful for
error generation purposes and other tests to increment the test coverage. This implementation
would not exclude the possibility of full simulation, it could be implemented later, if found
necessary. [7.]
7.4
Improvement Opportunities
This chapter outlines ideas for possible improvements of the prototype that was created. The
first subchapter discussed the possibility to use National Instruments TestStand as the testrunner and what benefits would be gained with this. Chapter 7.4.2 deals with the matter of
using only FPGA modules in the PXI system.
7.4.1
TestStand as Test-runner
Currently, CAPL is used for programming the test cases and CANoe is used for executing
the tests. Instead of CANoe and CAPL, National Instrument’s TestStand could be used as
a test-runner. This change would remove the need of the wrapper DLL to adapt LabVIEW
and CANoe environments and would make the software side of the platform simpler, since
from TestStand it is possible to call LabVIEW VIs directly. Because both, LabVIEW and
TestStand, and most of the PXI hardware modules are products of National Instruments, it
would be easier in the future to develop the system, since all the components would be from
the same vendor and there should not be integration challenges.
The use of TestStand from the software layers point of view is illustrated in Figure 15. CANoe is replaced with TestStand as test runner and instead of implementing the Test Hardware
API with CAPL, LabVIEW would be used for this abstraction.
33
Figure 15: Software layers of the system in case TestStand would be used for executing the tests.
During development of the prototype, the change to TestStand has been taken into consideration when the LabVIEW VIs of layer L2 have been tested with higher level LabVIEW
VIs. These test VIs are similar to the the LabVIEW Hardware Test API layer, thus making
it almost implemented. The change could be made with quite minor modification. If this
software architecture is going to be used, LabVIEW needs to handle the analysis of the CAN
bus. There are ready-made CAN libraries for LabVIEW available, and since the developers
in the company have a high level of CAN knowledge, programming such a library would
not be a problem either. Quite a significant labor would be reprogramming the simulation of
the main board with LabVIEW. In addition the test logic would need to be reprogrammed,
probably with LabVIEW for TestStand.
7.4.2
Only FPGA Hardware in the Test Bench
At the moment, the PXI system has many different types of DAQ modules. Some of them
use the DAQmx device drivers and some FPGA drivers. These modules have completely
different kind of programming environments and this might cause problems in synchronization.
The possibility to manage everything using only the FPGA modules is worth investigating.
The PXI modules that use the DAQmx drivers have been used so far mostly because of their
ease of use. The FPGA modules would provide the flexibility that is surely needed from the
test automation system in the future.
A Drawback of using only the FPGA modules, is their complex programming API. Even
with the library provided by National Instruments, the programming time required would be
a whole lot longer than with the DAQmx API.
34
7.5
Next Phases
This chapter discusses the next steps of the test automation system. First, the next target of
automation after the lift board is discussed. At the end of chapter, an explanation is given
of the tasks that need to be done before the system can be taken in to use for testing the lift
board.
After the verification tests of the lift board have been automated, the next logical step is
to automate the verification tests of the rotation board, since both of the DC boards have
similar hardware interfaces. After the DC boards, it will be either the validation tests of
the stepper boards or the main board. The stepper boards have quite different hardware
interface compared to the DC boards, but since the LabVIEW functions are general, this
can be done by most parts with a change in the configuration files. For the main board,
LabVIEW functionality is not needed that much, but it requires more CAPL programming,
since the functionality of the DC and stepper boards needs to be simulated in the CANoe
environment. It is also possible that the test automation system could be used for systemlevel testing. This requires completely different hardware interface and a configuration, and
investigations should be done whether this tool is the best choice for the system-level tests.
A lot of work is still needed in order to get concrete results from the system. More functionalities are needed for lift and other boards and the system needs to be validated. Validating
such a tool is a huge workload, and when this process will be done is still uncertain. It requires thought on when the system is at such a point that the benefits are clearly visible and
the validation is reasonable to do. Until then, development of the test automation system
continues and the tests are executed manually.
35
8
DISCUSSION AND CONCLUSIONS
Automated testing of software can improve the development process of a product. The most
valuable benefit is repeatability of tests with minimal costs. With automation, the tests can
be executed regularly, for example daily. Running the tests continuously makes changing
the source code easier, since it can be confirmed that nothing was broken during the modifications. With automation some drawbacks are also visible. An example of such is that the
verification of test cases is more time consuming. This fact needs to be taken into consideration while test automation is designed. Still, when compared to manual testing, the time
reduction can be enormous. Additionally, the test coverage can be improved. Automated
testing does not fit to all tests, though. In some cases, executing the tests manually is a better
option. Test automation can not be viewed as panacea to all problems in testing, the testing
process needs to be done well manually, before it is worth automating.
Automated testing that is done at unit level is quite similar for all software. When a higher
level of testing is to be implemented, the differences between an embedded system and a PC
application are noticeable. With embedded systems, the interface for each device is different
and a general tool for automation can not be found, thus a custom-made tool is required.
This study continued a prototype development started earlier on in the company. The main
components of the test automation system were left intact, but the connection between the
components was changed completely. Some tests have been automated with the system and
the results were promising, even though the tool did not fully automate the test execution
and an engineer’s presence is still needed for a short while when the tests are executed. Yet,
the tool can reduce the time of executing the tests to a few minutes, instead of two days
spent when the tests are executed manually. For now, the tool is used to automate the tests
in the current test plan, but later it can be used for executing tests that are impossible to run
manually. With this, the test coverage can be increased.
More functionalities are needed from the platform for it to show its full power. The tool also
needs to be validated in order to have confidence that the test results are correct.
36
References
[1] Dustin, Elfriede - Rashka, Jeff - Paul, John, Automated Software Testing: Introduction,
Management and Performance. Addison-Wesley. 1999.
[2] Fewster, Mark - Graham, Dorothy, Software Test Automation: Effective Use of Test
Execution Tools. Addison-Wesley. 1999.
[3] Fowler, Martin, Refactoring: Imporoving the Design of Existing Code. AddisonWesley. 1999.
[4] Myers, Glenford J., The Art of Software Testing. 2nd ed. New Jersey: John Wiley &
Sons, Inc. 2004.
[5] Karlesky, Michael - Bereza, William - Williams, Greg - Fletcher, Matt, Mocking
the Embedded World: Test-Driven Development, Coninuous Integration, and Design
Patterns. Atomic Object. 2007. [PDF document] http://www.atomicobject.com/
files/ESC-413Paper_KarleskyWilliams.pdf. (Accessed July 10, 2007)
[6] Karlesky, Michael - Bereza, William - Williams, Greg - Fletcher, Matt, Evolving
into Embedded Development. Atomic Object. 2007. [PDF document] http://www.
atomicobject.com/files/evolving_into_embedded_development_paper.pdf.
(Accessed July 10, 2007)
[7] Kandler, Jim, Automated Testing of Embedded Software: Lessons Learned from a Succesful Implementation. [Microsoft Word document] http://www.stickyminds.com/
sitewide.asp?Function=edetail&ObjectType=ART&ObjectId=2049. (Accessed
April 13, 2008)
[8] Trinh, Dat Ba, Digitaalisen mammografiaröntgenlaitteen testauksen automatisointi.
Helsinki: Helsingin ammattikorkeakoulu Stadia. 2007.
[9] CAN specification, Version 2.0. Robert Bosch GmbH. 1991. [PDF document] http:
//www.semiconductors.bosch.de/pdf/can2spec.pdf. (Accessed April 2, 2008)
[10] Programming with CAPL. Vector Informatik GmbH. 2004. [PDF document]
http://www.vector-cantech.com/portal/medien/vector_cantech/faq/
ProgrammingWithCAPL.pdf. (Accessed April 2, 2008)
[11] Bishop, Robert H., Learning with LabVIEW 8. New Jersey: Pearson Prentice Hall.
2007.
[12] Bitter, Rick - Mohiuddin, Taqi - Nawrocki, Matt, LabVIEW: Advanced Programming
Techniques, CRC Press, 2000.
37
[13] What is a DLL?. Revision 5.8. Microsoft Corporation. 2007. [HTML document] http:
//support.microsoft.com/kb/815065. (Accessed April 2, 2008)
[14] NI E-Series Data Sheets. National Instruments. 2006. [PDF document] http://www.
ni.com/pdf/products/us/4daqsc202-204_ETC_212-213.pdf. (Accessed April 2,
2008)
[15] What is PXI?. National Instruments. 2008. [HTML document] http://zone.ni.com/
devzone/cda/tut/p/id/4811. (Accessed April 2, 2008)
[16] NI PXIe-1062Q Data Sheet. National Instruments. 2006. [PDF document] http://
www.ni.com/pdf/products/us/cat_pxie1062q.pdf. (Accessed April 2, 2008)
[17] NI M-Series Data Sheet. National Instruments. 2007. [PDF document] http://www.
ni.com/pdf/products/us/044063301101dlr.pdf. (Accessed April 2, 2008)
[18] 6601/6602 User Manual. National Instruments. 1999. [PDF document] http://www.
ni.com/pdf/manuals/322137b.pdf. (Accessed April 6, 2008)
[19] NI R-Series Data Sheet. National Instruments. 2005. [PDF document] http://www.
ni.com/pdf/products/us/2005-5528-301-101-D.pdf. (Accessed April 2, 2008)
[20] Field-programmable gate array. [HTML document] http://en.wikipedia.org/
wiki/Field-programmable_gate_array. (Accessed April 9, 2008)
[21] Hardware Interfaces for CAN and LIN. Vector Informatik GmbH. 2007. [PDF document] http://www.vector-worldwide.com/portal/medien/cmc/datasheets/
CAN_LIN_Interfaces_DataSheet_EN.pdf. (Accessed April 6, 2008)
[22] CAPL functions reference manual. Vector Informatik GmbH. 2004. [PDF document]
http://www.vector-cantech.com/portal/medien/vector_cantech/faq/
CAPLFunctionReferenceManual.pdf. (Accessed April 2, 2008)