1
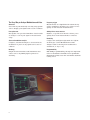
Agilent 53310A
Modulation Domain Analyzer
Dynamic Frequency and Jitter
Analysis at the Touch of a Button
The Easy Way to Analyze Modulation and Jitter
Autoscale
Saves time by automatically selecting setup parameters to display your signals at the touch of a button.
Fast update rate
Fast update rate provides immediate visual results
as changes occur in your signal or measurement
setup.
Jitter and modulation analysis
Complete, automated analysis to characterize the
modulation or jitter on any signal at the touch of
a button.
Hardcopy
Output measurement data and instrument state
can be sent to any GPIB graphics printer for
archiving.
2
Frequency trigger
Measurements are simplified with advanced triggering capabilities, allowing you to trigger on frequency or time interval measurements.
Softkey-driven menu structure
Intuitive, scope-like user interface allows you to
quickly move from measurements to answers.
Portability
Compact size and light weight make the Agilent
Technologies 53310A Modulaltion Domain
Analyzer ideal for moving from workbench to
workbench, or city to city.
Programmability
Full GPIB programmability, through the implementation of Standard Commands for Programmable
Instruments (SCPI) saves time and makes automatic
testing easier.
New Capabilities Simplify Analysis of Complex
Signals
Many of today’s measurement techniques simply
don’t provide adequate information to make
demanding design decisions. Those that do are
often cumbersome, difficult to use, or expensive.
Not so with Agilent’s 53310A Modulation Domain
Analyzer—providing a view of frequency or timeinterval measurements over time. This new way of
seeing data is intuitive, allowing you to view your
jitter or modulation directly. In much the same
way the oscilloscope provides insight into the
dynamics of changing voltage, the 53310A provides
insight into changes in frequency or time-interval
measurements.
Setting up the analyzer is easy. Autoscale provides
a one-button solution. At the press of a button
your signal is analyzed and the proper instrument
settings are selected. Unique triggering capabilities
allow you to trigger directly on your modulation or
periodic jitter.
Characterization of modulation and jitter is easier
with built-in analysis. Parameters like peak-to-peak
deviation, carrier frequency, and modulation rate
are all easily and automatically displayed. Jitter
analysis is simplified with automated analysis of
mean, standard deviation, and probability.
The Modulation Domain is the
missing piece of the puzzle.
The oscilloscope shows you
amplitude (voltage) versus time
in the Time Domain. The spectrum analyzer shows you
amplitude versus frequency in
the Frequency Domain. And
now, the Modulation Domain
analyzer shows you frequency
or time-interval measurements
versus time in the Modulation
Domain. The whole picture
helps you improve your designs
and bring them in on schedule.
The Agilent 53310A provides all this and more, at
a price you can afford.
Shorten your design cycles through improved signal
analysis
A wide range of applications benefit from
Modulation Domain analysis. New ways to view
and analyze problems lead to streamlined solutions, saving you time in characterization and
redesign.
Jitter characterization of digital communications
systems, disk and tape drives, and mechanical systems improves dramatically.
The Modulation Domain makes it simple to study
frequency drift in a range of electronic equipment,
from lasers to oscillators.
You can easily characterize the frequency-hopping
performance of an agile transmitter, or measure a
cellular phone switching from cell to cell.
Discover a new way to analyze your signals and
solve tough design challenges—a new perspective
that helps you solve elusive problems and fine-tune
your product performance. With the 53310A, you
can sharpen your competitive edge.
F
V
T
3
Understand Frequency Dynamics with Ease
Modulation Domain analysis does for frequency
what an oscilloscope does for voltage. The digitizing oscilloscope adds the time dimension to voltmeter readings, giving you a picture of the voltage
variations over time. Changes in voltage are easily
captured and analyzed. Measurements like V p-p,
overshoot, and undershoot are simplified since
voltage can be displayed as a function of time.
This same simplicity is available now for frequency
measurements. The 53310A adds the time dimension to frequency counter results. Now you can
view frequency variations directly. Traditionally difficult measurements on modulated carriers are
now simple.
In effect, the 53310A becomes a “frequency oscilloscope”—measuring carrier frequencies up to 2.5 GHz
as fast as every 1 µs. Through continuous sampling
of the carrier frequency, modulation can be recovered and carrier dynamics analyzed.
Much like an oscilloscope can trigger on a rising or
falling voltage through a specified voltage threshold, the 53310A has the unique capability to trigger
on a rising or falling frequency transition. Timing
generators or sync signals are no longer necessary
to trigger your measurement. This ability to trigger
on frequency transitions greatly simplifies the
analysis of VCOs, PLLs, and servo systems.
View frequency modulation directly
More than simply plotting individual measurement
results over time, the 53310A Modulation Domain
Analyzer makes frequency measurements continuously. Without the dead-time between measurements traditionally found in frequency counters or
time-interval analyzers, this proves to be a better
way to analyze your signals.
This measurement technique not only maintains
the relationship between measurements, it also
ensures no loss of measurement information
between samples. All of this is done with a single
capture, thus eliminating the need for cumbersome, time-consuming profiling methods common
with today’s frequency counters.
Single touch measurements
Measurements like peak-to-peak deviation, carrier
frequency, and modulation rate are made easily
with the touch of a button. Portions of the modulated carrier can be singled out quickly for detailed
analysis.
4
Frequency changes and timing are fundamental characteristics of music. Similarly, these attributes are critical
in many electronic systems and can easily be analyzed in
the Modulation Domain.
Imagine the time you can save with the 53310A by
characterizing your designs directly and easily.
Whether you are measuring a modulated signal or
agile carrier, now your design decisions can be
based on knowledge. You will no longer have to
infer performance based on indirect measurement
techniques that are commonly error prone and difficult to calibrate.
New views of frequency stability
With performance requirements increasing, better
designs must be delivered faster and at a lower
cost than ever before. As the error budgets of these
designs shrink, the need for stability increases.
Frequency vs
Time Display
The frequency modulation on this carrier is viewed and
analyzed easily in the Modulation Domain.
Whether it’s a simple design requiring a stable
microprocessor clock, or sophisticated electronics
controlling expensive equipment, quick access to
new insight is required. Aggregate measures of jitter offered by conventional test techniques are
often inadequate. They provide a convenient measure but allow little insight into the solution.
As with deliberately modulated carrier frequencies, analysis of “stability” is done easily in the
Modulation Domain. No longer limited to the magnitude of the jitter, the Agilent 53310A allows you
to analyze the instability—breaking it into its periodic and random components.
Fast Histogram
of Frequency
Fast histogramming makes statistical characterization
easy.
5
A Complete Picture of Timing Jitter on Digital
Signals
Identify sources of instability with certainty
When coupling to a power line, switching power
supply and high speed digital circuitry are common causes of instability. However, determining
the actual cause of the problem can be a tedious,
time-consuming process with traditional techniques. The 53310A makes this process simple.
With the use of powerful pushbutton analysis functions, the periodic element can be analyzed and the
source of the problem identified with certainty.
Timing and duration of the instability can be captured easily to give you valuable insight in resolving
your problem. Switching transients, and other temporary causes of instability, are identified easily
and quickly once the timing is known.
The 53310A allows you to focus the bulk of your
time on the design solution, rather than identifying
the source of the problem.
The 53310A provides you with new techniques to
enhance your understanding of:
•
•
•
•
•
•
jitter on a serial data stream
timing between optical encoder pulses
timing relationships of clock-to-data jitter
propagation delay through an electronic device
variations in pulse parameters
results of a new pulse width encoding scheme.
Easily capture and analyze serial data timing
Analysis of serial data timing is crucial for refining
designs on a variety of circuits, from the simplest
IC, to a clock recovery circuit, to complete systems.
Data storage devices such as magnetic disk drives,
tape drives, and compact disks rely on precise timing to increase capacity and reduce data error.
Electromechanical systems, used extensively from
consumer products to sophisticated robotics, require
precise timing analysis for optimizing servo designs.
Timing jitter is commonly characterized indirectly
with an oscilloscope. By looking at the “fuzz” on
the oscilloscope trace, you can make assumptions
about the jitter. All too often this is simply inadequate and a more complete view is required.
The Modulation Domain gives you a better way to
study jitter. Through insightful “vs Time” and histogram displays, the Agilent 53310A Modulation
Domain Analyzer presents a detailed picture of jitter. The jitter’s variation over time and its statistical behavior are simple to characterize. No longer
are you limited to the peak-to-peak jitter measurement made by the oscilloscope.
Random and periodic elements of jitter are available at a glance from the “vs Time” display, providing valuable information. Automated analysis functions make quantifying jitter as simple as pushing
a button. The Histogram display gives you an
unsurpassed level of confidence about the statistical behavior of jitter, allowing you to make necessary design tradeoffs.
6
The power line’s effect on this oscillator is clearly identified.
Serial data analysis is often difficult, pushing conventional measurement techniques to their limits.
Often the need to analyze thousands or millions of
pulses while maintaining precise timing is unmet.
The 53310A significantly reduces the effort required
to collect and analyze this type of data.
With the “vs Time” display, timing between thousands of pulses can be captured and displayed as
they occur in time, each measured with subnanosecond precision. Convenient markers and
automated analysis functions allow detailed timing
analysis of all or part of the captured information.
Triggering on data dropouts is simple, using the
time-interval triggering capability of the 53310A.
For large amounts of data, the 53310A’s fast histogram feature allows millions of timing measurements to be captured in seconds. The statistical
behavior of the timing is quickly and easily analyzed with the histogram display and automated
analysis functions. In the case of multiple distributions, each distribution can be isolated and analyzed using markers.
In the motion of a spinning top, small deviations are difficult to observe. The same is true when characterizing jitter in electronic systems. The Modulation Domain makes
it easy to characterize jitter and identify its source.
Fast Histogram
of Time-Interval
Statistical analysis of timing is simplified with built-in
analysis functions.
7
Simplify data-to-clock jitter analysis
Frequently the timing relationship between two
signals is key in understanding a design’s performance. In the case of semiconductors or digital modules, propagation delay or skew can be a key design
criterion.
The 53310A’s ability to characterize this jitter easily
and directly provides you with fast results and
greater understanding. Your ability to view the timing relationships of multiple signals as they change
over time gives you valuable information during
design and prototyping phases, and beyond. The
Modulation Domain reveals important information
about potential sources of jitter, such as interference
from a power supply or nearby digital circuitry.
Time-Interval
vs Time Display
The periodic and random elements of this data-to-clock
jitter provide valuable insight.
8
View pulse width modulation directly
Many of today’s encoding schemes used on tape
drives and compact disks employ pulse width modulation. Many other products, like antilock brake
systems and servo control of motors, use pulse
width modulation to maintain control. In all of
these cases, the 53310A is a valuable tool for characterizing and understanding your design.
This form of modulation creates new challenges in
measurement and characterization. Not only is it
necessary to measure the width of each pulse, but
the timing relationship between pulses is essential
for complete characterization.
With the 53310A, thousands of pulses can be captured and easily analyzed using the Time-Interval
vs Time display. Measurement markers and built-in
analysis functions simplify characterization and
analysis. Histogram displays give you further insight,
allowing you to look at the distribution of a particular pulse width.
Fast Histogram
of Pulse Width
Each distribution of the pulse width modulation data can
be individually analyzed.
Simple Solutions to Tough Modulation and
Jitter Analysis
Autoscale captures your jitter and modulation
At the touch of a button, the 53310A quickly determines threshold level and vertical and horizontal
scale factors to display your signal.
Ultra-fast update rate and intuitive user interface
simplify analysis
This powerful combination makes operation intuitive. Real-time display of measurement results,
coupled with a user interface that is easy to navigate, makes instrument setup and data analysis
simple. You will save time—allowing you to focus on
design improvements rather than lengthy characterization.
Frequency triggering eliminates complexity
The unique ability of the 53310A to trigger on a
rising or falling frequency or time interval streamlines information capture. From capturing VCO
step responses to analyzing data dropouts, Value
Triggering usually eliminates the need for external
sync signals which are often expensive to produce
or unavailable.
Millions of measurements gathered in seconds
Thorough characterization often requires large,
statistically valid samples of frequency or timeinterval measurements. Without the proper equipment, this can be a laborious, time-consuming task.
Fast Histogram allows you to capture millions of
measurements at rates up to 2.5 million per second.
Easy to maintain and repair
Simplicity is carried throughout the design of the
53310A. Periodic calibrations can be done quickly,
with no disassembly. Features like screen-saver mode
and built-in diagnostics protect your investment.
The analyzer’s high reliability ensures your measurement integrity and minimizes downtime. With
an estimated Mean Time Between Failures (MTBF)
of greater than 20,000 hours, you have a lower risk
of product failure. Powerful diagnostics and modular design minimize repair time, should it become
necessary.
Fully automated analysis is available at the touch of
a button
Both jitter and modulation are easy to quantify
and analyze with built-in analysis. Modulation rate,
carrier frequency, and peak-to-peak deviation are
easy to measure on all, or just a portion, of your
measurement data. Statistical analysis of jitter is
done with one-button functions for mean, standard
deviation, and probability.
At the touch of a button, Autoscale determines the instrument configuration to display and analyze your signal.
9
Select the Right Modulation Domain Instrument
for Your Analysis
Agilent Technologies offers a variety of Modulation
Domain products to enhance your analysis of modulation and jitter. The 53310A Modulation Domain
Analyzer and the E1725C Time Interval Analyzer
are the general purpose instruments for Modulation
Domain analysis.
Agilent 53310A
The simple, easy-to-use 53310A Modulation
Domain Analyzer provides a basic feature set,
measuring frequency and time interval. It provides
unique capabilities in triggering, real-time display
and memory depth . . . all at a low price.
Feature
Benefit
53310A
Option 031
Option 305
Frequency
Completely characterize
frequency modulation
and drift
10 Hz-200 MHz,
Channel C (Optional):
50 MHz-2.5 GHz
Channel C,
50 MHz-2.5 GHz
Same as basic unit
Time Interval
Characterize jitter and timing
with superior resolution
Up to 1 second with
200 ps rms resolution
Same as basic unit
Some calculations
required
Continuous
Sample Rate
View fast transitions in
your signal's modulation
vs Time: 1-1.25 MHz
Fast Histogram: 1.5-2.5 MHz
Sample rates up to
8 MHz with repetitive
signals
Same as basic unit
Maximum
Measurement
Memory
View modulation or jitter over
a longer time for a given
sample rate
8 k, 32 k optional
Same as basic unit
Same as basic unit
Measurement
Functions
Obtain results directly through
a variety of measurements
Frequency and Time Interval
Same as basic unit
Frequency, Frequency
Deviation, Phase
Deviation, Phase Power
Spectral Density, FFT
and Settling Time
Arming and
Gating
Capture the specific portions
of a complex input signal
Frequency and Time Interval
Trigger — Six arming
combinations
Adds an adjustable RF
envelope trigger
Same as basic unit
Display Modes
Gain a new perspective on
signal performance with
powerful displays
vs Time, Histogram, and
Fast Histogram
Same as basic unit
vs Time, Histogram,
Fast Histogram, FFT,
Phase Power Spectral
Density
10
Option 031 Means Faster Time to Market for
Your Digital RF Communications Designs
Digital RF communications is a fast growing and
changing field. Major programs are underway
worldwide to develop and implement new digital
cellular communications systems and advanced
cordless telephones. As an RF designer you need
new test and measurement equipment to meet the
challenging time-to-market requirements of your
industry.
The Agilent 53310A Modulation Domain Analyzer’s
Option 031, “Digital RF Communications Analysis/
High Resolution 2.5 GHz Input,” will allow you to
bring your designs to market faster and with more
confidence than ever before. Automatic measurements of synthesizer settling time, Frequency Shift
Keyed (FSK) center frequency, and FSK peak deviation will save you valuable development time.
Option 031’s improved frequency resolution for RF
signals means you won’t waste time with complicated external downconversion to meet your resolution requirements. The option also provides
increased sampling rate to measure fast data rate
systems such as Digital European Cordless
Telephone (DECT).
Time referenced trigger
Option 031 measurements can be referenced in
time to an external trigger. For example, you can
accurately reference your synthesizer settling time
to the step command edge.
Increased modulation bandwidth
Sample rates of up to 8 MHz can be achieved for
repetitive signals. This extends the modulation
bandwidth to approximately 2 MHz to cover fast
data rate systems such as DECT.
External LO input
An external local oscillator can be used to further
enhance measurement resolution. A rear panel
input is supplied.
RF envelope trigger
An adjustable RF envelope trigger simplifies measurement setup by automatically triggering on a
detected TDMA burst. This also makes it easy to
characterize turn-on and turn-off transients. The
detected TDMA burst trigger is provided as a rear
panel output.
53310A
DUT
Radio or Synthesizer
RF Output
Sync Trigger (optional)
Direct connection eliminates the need for cumbersome external mixers, filters,
discriminators, or detectors between your device under test and measurement
instrumentation.
11
View Complex Modulation Directly
High resolution RF measurements
Many new digital RF communication systems
employ complex modulation techniques such as
Gaussian Minimum Shift Keying (GMSK). Fast,
direct views of these narrow band modulations are
needed to improve frequency and timing characterization and shorten design cycles.
The 53310A’s Option 031 provides direct frequency
versus time views of your complex modulations.
The high resolution RF input allows you to profile
narrow band modulations directly. This eliminates
the need for external downconversion, saving you
time and effort.
Frequency vs
Time Display
The high resolution RF input directly profiles the 0.3 GMSK
modulation on a GSM carrier.
12
Direct frequency versus time eye diagrams
Frequency versus time eye diagrams provide a
quick, qualitative view of transmitter performance.
Eye diagrams allow you to view effects of bit jitter
and inter-symbol interference (ISI) directly on the
RF carrier. The frequency versus time eye diagram
can be compared to a conventional baseband eye
diagram on an oscilloscope. Comparing the RF eye
diagram and the baseband eye diagram allows you
to quickly isolate problems with the RF chain. This
direct view eliminates the need to guess at RF performance.
Frequency vs
Time Display
Frequency versus time eye diagrams make it easy to view
jitter effects on the RF carrier.
Simplify PLL/Synthesizer Characterization with
Automatic Measurements
Automatic settling time measurements
Improving synthesizer performance is a key part of
the design effort for today’s digital RF communication systems. Agilent 53310A Option 031 provides
direct, automatic settling time measurements. You
simply enter the target frequency and tolerance
band, and the analyzer automatically calculates the
settling time from its frequency versus time display.
The synthesizer step command is typically used as
a “time-zero” reference to trigger the analyzer. The
measurement is made with resolution of better than
100 Hz for carrier frequencies up to 2.5 GHz.
Frequency vs
Time Display
Settling time is displayed automatically on this direct
measurement of the synthesizer step.
Quick synthesizer pulling analysis
Another consideration for synthesizer performance
is frequency pulling due to amplitude variations.
Pulling typically occurs when a Time Division
Multiple Access (TDMA) burst is powered on. The
power ramp can cause a temporary shift in the
synthesizer’s output frequency. The 53310A makes
it easy to see pulling effects on your synthesizer.
The frequency versus time display provides a
direct view of the pulling transient. You quickly see
how far off in frequency the synthesizer is pulled
and how long it takes to relock.
Frequency vs
Time Display
Frequency pulling can occur when the amplitude is
ramped up at the beginning of the TDMA time slot.
Pulling effects can be seen easily.
13
Option 305 Offers Flexible Phase Analysis for
Faster RF Communications Time to Market
The 53310A Modulation Domain Analyzer’s Option
305 Phase Analysis Software adds the power of
phase analysis in the Modulation Domain to your
53310A. Now you can better understand your
design through direct phase analysis by measuring
phase settling time, phase noise (phase spectrum),
phase deviation, and phase trajectory. If you
already own a 53310A, purchase the software separately as the 53305A Phase Analysis Software.
The software runs on any IBM-compatible PC with
MS Windows®. Simply connect your PC to the
53310A using IEEE 488.2.
Enhance your Agilent 53310A with powerful phase analysis
software that runs on your PC.
14
With the software, you can measure and display
frequency, frequency deviation, and phase deviation. From these displays, you can analyze settling
time characteristics, view histograms and statistics, and even perform an FFT to get phase noise
and jitter spectrum.
Modulation analysis
Many new digital RF communication systems
employ complex frequency and phase modulation
techniques. The 53310A Option 305 provides direct
frequency and phase versus time views of your
complex modulation. The high resolution RF input
(Option 031) lets you directly profile both wide and
narrow band modulations up to a 500 kHz modulation rate. This eliminates the need for external
downconversion, saving you time and effort.
Gain a better understanding of your RF system performance with the phase modulation display (Pi/4 DQPSK
shown).
Phase noise
Modulation rates, spurious modulation, and total
integrated noise over the modulation bandwidth
are uncovered easily with the Phase Power Spectral
Density (phase noise) display. This display is simply
a calibrated version of the FFT of a phase deviation
display.
Related Literature
For more information, please refer to the Agilent
53310A Modulation Domain Analyzer Data Sheet
and U.S. Price List.
Uncovering spurs or measuring total integrated noise
over the modulation bandwidth is a snap with the Phase
Power Spectral Density display.
15
Agilent Technologies’ Test and Measurement
Support, Services, and Assistance
Agilent Technologies aims to maximize the value you receive,
while minimizing your risk and problems. We strive to ensure
that you get the test and measurement capabilities you paid
for and obtain the support you need. Our extensive support
resources and services can help you choose the right Agilent
products for your applications and apply them successfully.
Every instrument and system we sell has a global warranty.
Support is available for at least five years beyond the production life of the product. Two concepts underlie Agilent’s
overall support policy: “Our Promise” and “Your Advantage.”
By internet, phone, or fax, get assistance with all your
test and measurement needs.
Our Promise
“Our Promise” means your Agilent test and measurement equipment will meet its advertised performance and functionality.
When you are choosing new equipment, we will help you with
product information, including realistic performance specifications and practical recommendations from experienced test
engineers. When you use Agilent equipment, we can verify that
it works properly, help with product operation, and provide
basic measurement assistance for the use of specified capabilities, at no extra cost upon request. Many self-help tools are
available.
Europe:
(tel) (31 20) 547 2323
(fax) (31 20) 547 2390
Your Advantage
“Your Advantage” means that Agilent offers a wide range of
additional expert test and measurement services, which you
can purchase according to your unique technical and business
needs. Solve problems efficiently and gain a competitive edge
by contracting with us for calibration, extra-cost upgrades, outof-warranty repairs, and on-site education and training, as well
as design, system integration, project management, and other
professional services. Experienced Agilent engineers and technicians worldwide can help you maximize your productivity,
optimize the return on investment of your Agilent instruments
and systems, and obtain dependable measurement accuracy
for the life of those products.
Windows® and MS Windows® are U.S. registered trademarks of Microsoft Corporation.
Online Assistance
www.agilent.com/find/assist
Phone or Fax
United States:
(tel) 1 800 452 4844
Canada:
(tel) 1 877 894 4414
(fax) (905) 206 4120
Japan:
(tel) (81) 426 56 7832
(fax) (81) 426 56 7840
Latin America:
(tel) (305) 269 7500
(fax) (305) 269 7599
Australia:
(tel) 1 800 629 485
(fax) (61 3) 9272 0749
New Zealand:
(tel) 0 800 738 378
(fax) (64 4) 495 8950
Asia Pacific:
(tel) (852) 3197 7777
(fax) (852) 2506 9284
Product specifications and descriptions in this
document subject to change without notice.
Copyright © 1998, 2000 Agilent Technologies
Printed in U.S.A. 7/00
5966-4093E