1
Information and Communications Technologies in Schools Survey, 2003/04 – User Guide
These data sets were determined to have low item non-response rates for the majority of
both the critical questions (Phase 1) and the remaining questions (Phase 2).
Consequently, a weighting methodology based on key auxiliary information available on
the frame (i.e. province or territory, instructional level, size, location, funding and
language of school) was adopted to correct for total and partial non-response.
Unfortunately, some records on the frame were missing some key analytical information
needed to make this correction. For those cases, the missing data was imputed based on
information available from similar complete records. This resulted in imputing the
number of students and the instructional level for 3.1% and 0.3% of the frame’s records,
respectively.
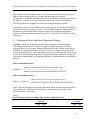
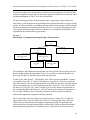
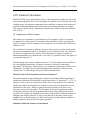
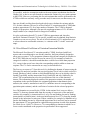
11.1 Adjustment Classes and Initial Adjustment Weights
Explanatory analysis was applied, based on logistic regression, to investigate the
relationship between the key auxiliary information available (province or territory,
instructional level, size, location, funding and language of school) on the frame and the
probability of schools responding to the survey. As a result, schools were grouped into
several adjustment classes. These adjustment classes were constructed in such a way that
it could be assumed that within the class, each unit had the same probability of response.
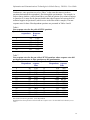
The initial weight assigned to all schools belonging to an adjustment class was defined as
follows:
Phase 1 adjustment classes:
Number of schools in that class derived from the frame
W(Phase 1) = ------------------------------------------------------------------------Number of schools in that class that responded to the survey
Phase 2 adjustment classes:
Number of schools in that class that responded to the survey
W(Phase 2) = W(Phase 1) x -----------------------------------------------------------------------------------Number of schools in that class that responded beyond critical questions
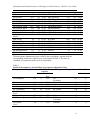
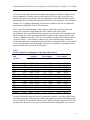
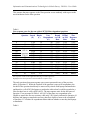
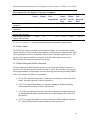
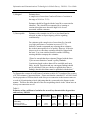
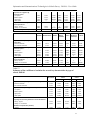
Table 3 lists the first-phase non-response adjustment groups and the corresponding total
non-response rates. The rates are calculated as a proportion of the expected counts
derived from the ICTSS frame.
Table 3
Total Non-response by First-Phase Non-response Adjustment Class
Group
Frame
Group
Frame
Total NonTotal Nonresponse
response
Count Rate
Count Rate
Newfoundland
331
133 40.2% SK Med/Lrg.
66
28 42.4%
14