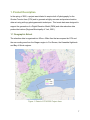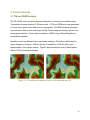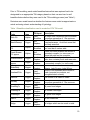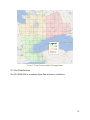
1
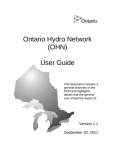
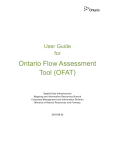
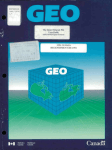
GTA DEM 2002 User Guide Spatial Data Infrastructure Mapping and Information Resources Branch Corporate Management and Information Division Ministry of Natural Resources and Forestry 2015-07-07 Disclaimer This technical documentation has been prepared by Her Majesty the Queen in right of Ontario as represented by the Ministry of Natural Resources and Forestry (the “Ministry”). No warranties or representations, express or implied, statutory or otherwise shall apply or are being made by the Ministry with respect to the documentation, its accuracy or its completeness. In no event will the Ministry be liable or responsible for any lost profits, loss of revenue or earnings, claims by third parties or for any economic, indirect, special, incidental, consequential or exemplary damage resulting from any errors, inaccuracies or omissions in this documentation; and in no event will the Ministry’s liability for any such errors, inaccuracies or omissions on any particular claim, proceeding or action, exceed the actual consideration paid by the claimant involved to the Ministry for the materials to which this instructional documentation relates. Save and except for the liability expressly provided for above, the Ministry shall have no obligation, duty or liability whatsoever in contract, tort or otherwise, including any liability or negligence. The limitations, exclusions and disclaimers expressed above shall apply irrespective of the nature of any cause of action, demand or action, including but not limited to breach of contract, negligence, strict liability, tort or any other legal theory, and shall survive any fundamental breach or breaches. Cette publication spécialisée n’est disponible qu’en anglais. Additional Information For more information about this document, please contact [email protected]. © 2015, Queen’s Printer for Ontario 2 Executive Summary Key Words DEM, Digital Elevation Model, WRIP, Water Resources Information Program, Spatial Data Infrastructure, SDI, Digital Terrain Model, Terrain, DTM, TIN, Triangulated Irregular Network. Abstract A three-dimensional raster data set which represents a continuous elevation surface. This data set encompasses the Greater Toronto Area (GTA) and surrounding area extending from the Niagara region to Port Severn, the Kawartha Highlands and the Bay of Quinte regions. 3 Table of Contents Disclaimer ....................................................................................................................... 2 Additional Information...................................................................................................... 2 Executive Summary ........................................................................................................ 3 Key Words...... .............................................................................................................. 3 Abstract...... .................................................................................................................. 3 Table of Contents ............................................................................................................ 4 List of Figures .................................................................................................................. 5 List of Acronyms .............................................................................................................. 6 1. Product Description ..................................................................................................... 7 1.1 Geographic Extent.................................................................................................. 7 1.2 Reference System .................................................................................................. 8 1.3 Resolution .............................................................................................................. 8 2. Product Details ............................................................................................................ 9 2.1 TIN and DEM Products .......................................................................................... 9 2.2 Data Delivery Format ........................................................................................... 11 2.3 Use Restrictions ................................................................................................... 12 3. References ................................................................................................................ 13 4 List of Figures Figure 1: Extent of GTA 2002 Project Area ..................................................................... 7 Figure 2: A TIN without breaklines (A) and a TIN with breaklines (B). ............................ 9 Figure 3: Three Downloadable Package Areas ............................................................. 12 5 List of Acronyms CGVD: Canadian Geodetic Vertical Datum DEM: Digital Elevation Model DTM: Digital Terrain Model GIS: Geographic Information Systems GTA: Greater Toronto Area LIO: Land Information Ontario NAD: North American Datum SDI: Spatial Data Infrastructure TIN: Triangulated Irregular Network UTM: Universal Transverse Mercator 6 1. Product Description In the spring of 2002, a project was initiated to acquire leaf-off photography for the Greater Toronto Area (GTA) and to generate a highly accurate and precise elevation data set using softcopy photogrammetric techniques. This terrain data was designed to support the generation of a Digital Elevation Model (DEM) and other elevation data product derivatives (Regional Municipality of York, 2001). 1.1 Geographic Extent The elevation data is organized into 20km x 20km tiles that encompass the GTA and the surrounding area from the Niagara region to Port Severn, the Kawartha Highlands and Bay of Quinte regions. Figure 1: Extent of GTA 2002 Project Area 7 This data is intended to be used for pre-engineering survey and design as well as the production of planimetric mapping at differing accuracies with the following specifications for each: 1:2000 Scale Mapping: Horizontal and vertical accuracy 0.5m, suitable for 1m contour generation. Final point spacing of Digital Terrain Model (DTM) is 10m. 1:4000 Scale Mapping: Horizontal and vertical accuracy 1m, suitable for 2m contour generation. Final point spacing of DTM is 20m. 1.2 Reference System Horizontal Reference System The horizontal coordinate system of the DEM is the Universal Transverse Mercator (UTM) and covers zones 17 and 18. The horizontal datum of the DEM is the North American Datum of 1983 (NAD83). The horizontal unit of measure (coordinate system axis units) for all raster grid cells in the DEM is meters (m). Vertical Reference System The vertical coordinate system of the DEM is based on the Canadian Geodetic Vertical Datum 1928 (CGVD28) of the Geodetic Survey Division, and is measured in metres above mean sea level. For more information please see the Geodetic Survey Division of Natural Resources Canada (http://webapp.geod.nrcan.gc.ca/geod/). The vertical unit of measure (coordinate system axis units) for all raster grid cells in the DEM is meters (m). One single vertical elevation value represents each raster grid cell in the DEM. 1.3 Resolution Spatial Resolution The grid spacing is based on Universal Transverse Mercator (UTM) projection with a raster cell resolution of 5 metres. Temporal Resolution Source elevation data was captured using softcopy photogrammetry in 2002. 8 2. Product Details 2.1 TIN and DEM Products The GTA 2002 vector elevation data was delivered in a format best modeled using a Triangulated Irregular Network (TIN) data model. A TIN and DEM have been generated to honour the original vector data as much as possible. The DEM has been generated from the vector data by first creating an ArcGIS Terrain using the elevation points, lines and polygons then this Terrain was converted to a DEM using a Natural Neighbours interpolation algorithm. Breaklines are a key dataset that is used when creating a TIN as they define rapid or sharp changes in elevation. Without the use of breaklines, a TIN will yield a poor representation of the terrain surface. Figure 2 demonstrates the level of detail added within a TIN by including breaklines. Figure 2: A TIN without breaklines (A) and a TIN with breaklines (B). 9 Prior to TIN modeling, each coded breakline feature that was captured had to be designated to an appropriate TIN category based on their use as a hard or soft breakline feature before they were used in the TIN modeling process (see Table 1). Decisions were made based on whether the features were coded as approximate or actual and using a basic understanding of hydrology. Table 1: Breakline classification used to create the GTA TIN model. Classification Code Feature Class Ditch C/L TIN Input Description Polyline Hard Breakline Marsh/Swamp Polygon Soft Replace Creek/Stream C/L Polyline Hard Breakline Creek/Stream C/L approx Polyline Soft Breakline River/Shoreline Polygon River/Shoreline approx Polygon WaterBody Polygon Headwall/Culv Polygon All major ditch centerlines that will ensure the proper generation of 1.0m contours. The outline of visible interpretable marshes/swamps. Avoid wet areas that are likely seasonal. The centerline of creeks and streams that are less than 4 meters wide. Where the creek/streams are difficult to accurately compile (i.e. tree cover), or where the path may be uncertain. Both sides of rivers greater than 4 meters wide, also contains ponds and reservoirs. Where the river/shoreline may be difficult to accurately compile (i.e. tree cover). All identifiable water bodies such as Lake Ontario, Lake Scugog, Lake Wilcox. Outline of all headwalls and culverts to scale (concrete box culverts, not corrugated steel culverts) Dam2Sc. Polygon AccWay Polygon RoadEdgPv Polygon RoadEdgCb Polygon RoadEdgGr Polygon RailC/L Polygon Bridge Polygon Hard Replace Soft Replace Hard Replace Hard Replace Hard Replace Hard Replace Hard Replace Hard Replace Hard Replace Hard Replace Hard Replace The outline of all Dams to Scale. All major access ways required to ensure the proper generation of 1.0m contours. All paved road edges All curbed road edges. All gravel road edges All rail centerlines All bridges which service roads or rails. 10 Classification Code Feature Class RetWall TIN Input Description Polygon Hard Replace All significant retaining walls. Breakline Polygon Soft Replace Mass Points Point Mass Points Generic breaklines for all pits/piles, top of bluff, gullies etc. to ensure the proper generation of 1.0m contours. Not Applicable Once the polygons and lines were divided into their respective layers, a single DTM point layer was generated that was comprised of soft and hard breakline layers and hard and soft polygon layers. These datasets were then used as input for the TIN creation. The final DEM product was created by converting the TIN model to a 5m raster elevation surface using a Natural Neighbours interpolation algorithm (ESRI, 2014). 2.2 Data Delivery Format The GTA DEM 2002 data is currently stored and distributed through Land Information Ontario (LIO) Metadata Tool (https://www.javacoeapp.lrc.gov.on.ca/geonetwork?uuid=6a7a7e71-f502-4336-bba2364c7eefd950). The GTA DEM 2002 can be downloaded in three packages NE, NW and SW (see Figure 3). Each package contains multiple DEM tiles in floating point file (.FLT) format. 11 Figure 3: Three Downloadable Package Areas 2.3 Use Restrictions The GTA DEM 2002 is considered Open Data and has no restrictions. 12 3. References Earth Science Research Institute (ESRI). 2014. Terrain to Raster Function for ArcGIS software (http://resources.arcgis.com/en/help/main/10.1/index.html#//009t00000206000000) Earth Science Research Institute (ESRI). 2014. Natural Neighbors Interpolation Algorithm (http://resources.arcgis.com/en/help/main/10.1/index.html#//005v00000027000000) Regional Municipality of York. 2001. Request for Proposal P-01-71: Greater Toronto and Area Digital Orthophotography and Digital Terrain Data, Finance Department, Supplies and Services Branch, 44p. 13 Version 1516.1 14