1
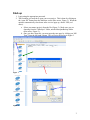
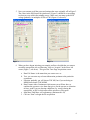
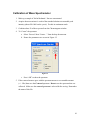
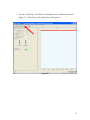
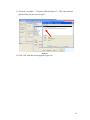
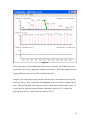
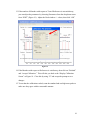
Q-TOF micro Mass Spectrometer User Guide
University of Victoria
Matthew Henderson
1
Table of Contents
Electrospray Mass Spectrometer User Guide
1
University of Victoria
1
Table of Contents
2
Start-up
3
Shut down
8
Changing Ion Modes
Calibration of Mass Spectrometer
Error! Bookmark not defined.
10
2
Start-up
1. Login using the appropriate password
2. The first thing you must do is open your own project. This is done by clicking on
the “open file” button from the Masslynx screen (blue arrow, Figure 1). When the
option to automatically close down some services pops up, choose YES (red
arrow).
a. Select your name (project) from the file (Figure 2). Make sure you are
choosing from the “Masslynx” folder, not the MasslynxBackup folder
(blue arrow, Figure 2).
b. Once you have done this, you must open the tune page by clicking on “MS
Tune” from the left hand column. This will give the screen in Figure 3.
Figure 1
Figure 2
3
3. The appropriate settings (blue arrows) and gases (black arrow) will be turned off
and the instrument should be in “Operate” mode (pink arrow). This is confirmed
with the green button in the lower right corner as well as the light on the mass
spec being “On.” The MCP voltage should have been returned to 0 by the
previous user (see “Time of Flight” tab (red arrow)).
Figure 3
4
4. Make sure that your ESI file is now open from the Tune Page. This is done by
checking that your name is in the top file name bar (red arrow, Figure 4). If your
name is NOT there, close the Tune page and reopen it from the previous
Masslynx page.
Figure 4
5
5. Now you can turn on all the gases and settings that were originally off in Figure 3.
The values in the ESI-Source tab (pink arrow, Figure 5) should be set according
to what you were told in the training course. Make sure you ramp up the MCP
voltage gradually, in multiples of 300 to 2700 (Figure 6, red arrow).
Figure 5
Figure 6
6. When you have begun injecting your sample, and have decided that you want to
record the spectra that you are observing, click on “Acquire” in the lower left
corner (Figure 7, red arrow). This gives the Tune Page Acquisition screen.
a. Data File Name: is the name that you want to save as.
b. Text: you can enter any relevant information pertinent to the particular
experiment.
c. Function: probably you will choose TOF MS, but if you are doing an
MSMS then choose TOF MSMS
d. Data Format: either Continuum which means you will later have to
combine the spectra to view them (but gives you the spectra as a function
of time, good if you are altering conditions (e.g. energy) during the
acquisition), or MCA which sums all the spectra as you acquire.
e. Start Mass/ End Mass: self explanatory (minimum m/z 50)
f. Click on “Start” to begin the file acquisition.
6
Figure 7
7. When you begin an acquisition the hand (halt) icon becomes colored in. When
you are satisfied with the file acquisition and want to stop acquiring click on it to
end the acquisition (red arrow, Figure 8). You can then view your spectrum in the
spectrum window (from Masslynx page)
Figure 8
7
Shut down
1. Before you shut everything down, make sure the instrument is clean. Rinse clean
solvent through the syringe until the spectra that appear no longer have your
sample appearing. This may take a few rinses, but DO IT! A mixture of formic
acid/water/acetonitrile is present for really greasy samples that are hard to
remove. If you use it, be sure to rinse with MeOH or ACN after.
2. When you have finished on the instrument, all settings must be reset to their
original values.
a. Under the TOF tab, the MCP voltage must be reset to 0 (Figure 9).
b. Under the ESI-Source tab (Figure 10, red arrow), the Capillary voltage
must be set to 0, and both temperatures must be set to 0 (green arrows)
c. The gases must also be shut off (Figure 10, pink arrow). You should hear
them both make a sound when you turn them off.
Figure 9
Figure 10
8
3. You must SAVE your file in the “TUNE PAGE” before leaving. If you don’t,
then the settings will not remain off, and when the next person signs on, all
settings will be ON. This is damaging to the MCP which must be ramped up
gradually, or else it will deteriorate quickly.
a. So click the “save” icon as the very last thing you do (Figure 11, red
arrow). The icon will grey out once you have saved it.
Figure 11
4. To log off, close the tune page. Then click on “Log Off” from the start menu, then
“Switch User” from the next window that pops up (Figure 13).
Turn off the monitor and sign the log book.
Figure 13
9
Calibration of Mass Spectrometer
1. Make up a sample of NaI in Methanol. Not too concentrated.
2. Acquire about one minute’s worth of the standard solution at reasonable peak
intensity (about 500-1000 on the y-axis). Do this in continuum mode.
3. Combine about 30 of these spectra from the Chromatogram window.
4. To “Center” the spectrum:
a. Select “Process” then “Center…” from the drop down menu.
b. Ensure the parameters are as seen in Figure 12.
Figure 12
c. Press “OK” to show the spectrum.
5. If the centered masses agree with the spectrum masses to a reasonable amount
(+/- .1Da) then save the Centered spectrum. Do not save the spectrum that was
collected. Make sure the centered spectrum is selected before saving. Remember
the name of this file.
10
6. Go to the “Tune Page” and Click on “Calibration” then “Calibrate Instrument”
(Figure 13). This will give the window shown in Figure 14.
Figure 13
11
7. Choose the standard that was used from the drop down menu.
Positive ion is Naics4
Negative ion is Naineg.
Figure 14
8. Click on “Calibrate” then choose “From File.” This will give the window in
Figure 15.
9. Click on the “Browse” button.
12
Figure 15
10. Select the spectrum that you just saved in step 5. Click on “History…” (Figure
16).
Figure 16
13
11. Select the “AccMass…” file that is offered (Figure 17). This is the centered
spectrum that you just saved in step 5.
Figure 17
12. Click “OK” until this screen appears (Figure 18)
14
Figure 18
The top spectrum is the uncalibrated file that you just collected. The middle spectrum is
the reference file of NaxIy aggregates with their true masses. The bottom graph shows the
average difference between two files for all picked peaks.
Compare your collected spectrum with the reference file to ensure that the correct peaks
have been picked. They would either be highlighted in red, or else have a number above
them. This peak (pointed at with the green arrow) should not be picked, and it wasn’t. It
is quite obvious from this example that the calibration is quite far off. Compare the
picked peak at 1962.05 with the reference peak at 1971.61.
15
13. If the number of Matches with respect to Tested References is not satisfactory,
you can adjust the parameters by choosing Parameters from the drop down menu
from “EDIT” (Figure 19). Adjust the Peak window +/- values, then click “OK”
Figure 19
14. If the Matches with respect to References is satisfactory, then click on “Finished”
and “Accept Calibration.” This will take you back to the “Display Calibration
Screen” as Figure 14. Close this by using “X” and accept the prompt to save
changes.
15. To test that the calibration worked, rerun the standard and test high mass peaks to
make sure they agree within a reasonable amount.
16