1
Advantech GeniDAQ
User’s Manual
Copyright Notice
This document is copyrighted, 2000, by Advantech Co., Ltd. All rights are reserved. Advantech Co.,
Ltd. reserves the right to make improvements to the products described in this manual at any time
without notice.
No part of this manual may be reproduced, copied, translated or transmitted in any form or by any means
without the prior written permission of Advantech Co., Ltd. Information provided in this manual is
intended to be accurate and reliable. However, Advantech Co., Ltd. assumes no responsibility for its use,
nor for any infringements upon the rights of third parties which may result from its use.
Acknowledgements
IBM and PC are trademarks of International Business Machines Corporation.
Intel is a trademark of Intel Corporation.
MS-DOS and Windows are trademarks of Microsoft Corporation.
ActiveX, Visual Basic, Excel, Access and Visual C++ are trademarks of Microsoft Corporation
All other product names or trademarks are the properties of their respective owners.
Advantech Customer Services
Each and every Advantech product is built to the most exacting specifications to ensure reliable performance in the harsh and demanding conditions typical of industrial environments. Whether your new
Advantech equipment is destined for the laboratory or the factory floor, you can be assured that your
product will provide the reliability and ease of operation for which the name Advantech has come to be
known.
Your satisfaction is our primary concern. Here is a guide to Advantech’s customer services. To ensure
you get the full benefit of our services, please follow the instructions below carefully.
Technical Support
We want you to get the maximum performance from your products. So if you run into technical difficulties, we are here to help. For the most frequently asked questions, you can easily find answers in your
product documentation. These answers are normally a lot more detailed than the ones we can give over
the phone.
So please consult this manual first. If you still cannot find the answer, gather all the information or
questions that apply to your problem, and with the product close at hand, call your dealer. Our dealers
are well trained and ready to give you the support you need to get the most from your Advantech
products. In fact, most problems reported are minor and are able to be easily solved over the phone.
In addition, free technical support is available from Advantech engineers every business day. We are
always ready to give advice on application requirements or specific information on the
installation and operation of any of our products.
ii
Technical Suppport Offices
USA
American Advantech Corporation
750 East Arques Avenue
Sunnyvale, CA 94086
Tel: (408)245-6678
Fax: (408)245-5678
Internet: http://www.advantech.com
Asia
Advantech Co., LTD
4th Floor, 108-3 Min-Chuan Road
Shing-Tien City, Taipei County, Taiwan ROC
Tel: (+886-2) 2218-4567
Fax: (+886-2) 2218-1989
Internet: http://www.advantech.com.tw
Europe
Advantech Germany
Karlsruherstr. 11/1
D-70771 Leinf.-Echterdingen
Germany
Tel: +49 (0) 711 797 333 60
Fax: +49 (0) 711 797 333 85
Advantech Italy
Via Don Verderio
4/B-20060 Cassina de,
Pecchi (MI), Italy
Tel: +39-2-95343054
Fax: +39-2-95343067
Mainland China
Beijing office:
No. 7, 6th Street, Shang Di Zone
Haidian District, 100085
Beijing, China
Tel: +86-10-62984345~47, 62986314~17
Fax: +86-1-62984341~42
Shanghai office:
Room #701, 7th Floor, Hua-Fu Building A
585 Long Hua W. Road
200232 Shanghai, China
Tel: +86-21-64696831, 64697910
Fax: +86-21-64696834
Limited Warranty
Advantech Corporation does not warrant that the GeniDAQ software package will function properly in
every hardware/software environment. Advantech Corporation makes no representation or warranties of
any kinds whatsoever with respect to the contents of this manual and specifically disclaims any implied
warranties or fitness for any particular purpose. Advantech Corporation shall not be held liable for errors
in this manual or for incidental or consequential damages in connection with the use of this manual or its
contents. Advantech Corporation reserves the right to revise this manual at any time without prior notice.
iii
About This Manual
Advantech GeniDAQ is a comprehensive, flexible human machine interface application environment, that supports
the functions and utilities to develop all types of automation applications in the Windows NT, Windows 98/95 and
Windows CE environment. GeniDAQ provides an icon-based, mouse driven system for designing real-time
Automation and Control Strategies, System Monitor Displays, and Dynamic Operator Displays.
Organization of this Manual
• Chapter 1, Introduction gives a general background to the GeniDAQ application builder. The system architectures is explained, and the products main features are introduced. Installation of the software is explained,
followed by a quck start to completing some of the most common tasks within GeniDAQ.
• Chapter 2, Tutorial explains how to complete the basic skills that you need to use the GeniDAQ software. In
addition, there are nine step-by-step tutorials that explain how to complete simple strategies within the GeniDAQ
application builder software.
• Chapter 3, Configuring Your System Functions With Task Designer explains the basics on how to use the
GeniDAQ Task Designer. The basic skills for designing tasks is followed by an introduction to the task blocks
that are available to you.
• Chapter 4, Configuring Your Display View With Display Designer explains how to use the GeniDAQ Display
Designer to create a user interface for your strategy. It introduces all of the display objects that are available
within the Display Designer.
• Chapter 5, Connecting Your Devices explains how to configure GeniDAQ to use your hardware. In addition to
using the Advantech DLL Drivers to enable your Advantech hardware, this chapter covers the OPC Standard
Interface, Analog Input, Analog Output, Digital Input, Digital Output, Temperature Measurement, Counter/
Frequency Measurement/Pulse Output, Hardware Alarm and RS-232 communication.
• Chapter 6, Historial Trending System explains how to use the historical trend display control to view past data. It
also covers saving data to a text file so that you can recall it later.
• Chapter 7, Monitoring Alarm and Event explains how to configure the alarm log block and use the alarm system
at runtime.
• Chapter 8, Communicating Through TCP/IP Networking explains how to use the GeniDAQ’s new support for the
TCP/IP network protocol. In addition, this chapters provides step-by-step information for setting up your
Windows 95/98/NT environment to support TCP/IP.
• Chapter 9, Runtime and Security System explains how to use the GeniDAQ runtime to run your strategies. Topics
include setting password security, how to log-in and log-off during runtime and how to work with the display
control object at runtime.
• Chapter 10, Advanced BasicScript Programming For Your Specific Needs explains how to use the BasicScript
support that is embedded within GeniDAQ. In addition to using the debugger to help you write your scripts, all
of the BasicScript commands, methods and statements are introduced.
• Chapter 11, Sharing Real Time Data with Data Center explains the concept of the data store, their data structures
and the tags available for using the Data Center. In addition, the DDE interface and OLE automation are
introduced.
• Chapter 12, Advantech GeniDAQ WinCE for HMI-64S explains how you can build a GeniDAQ application on
your 32-bit Windows machine and then copy it to Advantech’s HMI-640S Windows CE device. You can transmit
information from the HMI-640S to your host computer via TCP/IP networking.
• Appendix A, Runtime Error Code Listing
• Appendix B, Glossary
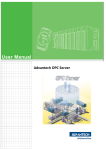
• Appendix C, ADAM OPC Server explains how to use the ADAM OPC Server which is a driver for both the OPC
Client test function and as a real working ADAM-4000, ADAM-5000/485 data acquisition and control module
OPC Server.
• Appendix D, Serial ModBUS OPC Server explains how to use the Advantech ModBus RTU OPC Server to
communicate with OPC clients and control devices.
iv
Contents
Copyright Notice ......................................................................................................... ii
Acknowledgements ..................................................................................................... ii
Advantech Customer Services ................................................................................... ii
Technical Support ....................................................................................................... ii
Limited Warranty ........................................................................................................ iii
Technical Suppport Offices ........................................................................................ iii
About This Manual ..................................................................................................... iv
Organization of this Manual ....................................................................................... iv
Chapter 1: Introduction
Overview ........................................................................................................ 1-2
Contents ................................................................................................................. 1-2
System Architecture ..................................................................................... 1-2
Module Description ................................................................................................. 1-3
What’s New in Advantech GeniDAQ 4.0 ...................................................... 1-4
Multi-threaded Engine .............................................................................................
OPC Client Support ................................................................................................
TCP/IP Networking Capability ................................................................................
Supports Different Sized HMI Models .....................................................................
New Hardware Support ..........................................................................................
Enhanced Historical Trend......................................................................................
Enhanced Virtual Tag with Multiple Data Type Support ..........................................
Enhanced Save and Restore Functions .................................................................
Security Strategy File ..............................................................................................
User Interface Enhancements ................................................................................
Porting Device Configuration to Another Machine ..................................................
Project Management ...............................................................................................
New Basic Script Commands .................................................................................
System Control Block and Event Log Display Item for Version 4.1 ........................
OPC Servers for GeniDAQ Version 4.1 ..................................................................
1-4
1-4
1-5
1-5
1-5
1-5
1-5
1-5
1-5
1-5
1-6
1-6
1-6
1-6
1-6
Installation ..................................................................................................... 1-6
System Requirements ............................................................................................ 1-6
Installing Advantech GeniDAQ ............................................................................... 1-7
Inserting the Anti-Piracy Hardware Key (Dongle) ................................................. 1-15
Dongle .................................................................................................................. 1-15
Uninstalling Advantech GeniDAQ ......................................................................... 1-16
Start Menu Shortcuts ............................................................................................ 1-17
How Does GeniDAQ Work? ........................................................................ 1-17
Project ................................................................................................................... 1-18
Strategy ................................................................................................................ 1-18
Task Designer ....................................................................................................... 1-18
v
Display Designer ................................................................................................... 1-18
Script Designer ..................................................................................................... 1-19
Multi-threaded Runtime Engine ............................................................................ 1-19
Quick Start to GeniDAQ .............................................................................. 1-19
Compatibility and Upgrade Information .................................................... 1-23
Summary ...................................................................................................... 1-23
Chapter 2: Tutorial
Overview ........................................................................................................ 2-2
Contents ......................................................................................................... 2-2
Working with GeniDAQ ................................................................................. 2-2
Before You Begin ....................................................................................................
Planning Your Strategy ...........................................................................................
Starting GeniDAQ ...................................................................................................
Using On-Line Help ................................................................................................
Building Your Strategy ............................................................................................
2-2
2-3
2-3
2-4
2-4
GeniDAQ Tutorials ........................................................................................ 2-5
Tutorial 1: One Task with Display ........................................................................... 2-5
Tutorial 2: Multiple Displays and switching ........................................................... 2-12
Tutorial 3: Execution Order Arrangement ............................................................. 2-15
Tutorial 4: Drawing tool in Display Designer ........................................................ 2-18
Tutorial 5: TAG block for integrating Task with Display ........................................ 2-22
Tutorial 6: BasicScript block ................................................................................ 2-26
Tutorial 7: BasicScript block with Virtual TAG block ............................................ 2-29
Tutorial 8: Main Script programming .................................................................... 2-33
Tutorial 9: Controlling multiple tasks .................................................................... 2-36
Summary ...................................................................................................... 2-38
Chapter 3: Configuring Your System Functions With Task Designer
Overview ........................................................................................................ 3-2
Contents ................................................................................................................. 3-2
Working with Tasks ....................................................................................... 3-2
Task Toolbox ........................................................................................................... 3-4
Creating and Configuring Tasks ............................................................................. 3-5
Working with Blocks ..................................................................................... 3-9
Connecting Blocks .................................................................................................. 3-9
Duplicating Blocks ................................................................................................ 3-10
Cutting Blocks ....................................................................................................... 3-10
Arranging Blocks’ Execution Order ........................................................................ 3-11
Arranging Blocks’ Layout ....................................................................................... 3-11
Copying DDE Link ................................................................................................. 3-11
Pasting DDE Link ................................................................................................... 3-11
Working with Calculation Blocks............................................................... 3-11
vi
Single Operator Calculation Block ......................................................................... 3-11
Average Block ....................................................................................................... 3-14
On/Off Control Block ............................................................................................. 3-15
PID Control Block ................................................................................................. 3-17
Event Counter Block ............................................................................................. 3-20
Working with File I/O Blocks ...................................................................... 3-21
Data File Blocks .................................................................................................... 3-21
Log File Blocks ..................................................................................................... 3-22
Working with DDE Blocks .......................................................................... 3-26
DDE Server Block ................................................................................................. 3-26
DDE Client Block .................................................................................................. 3-28
Working with Tag Block and Virtual Tag ................................................... 3-29
Tag Block .............................................................................................................. 3-29
Virtual Tag ............................................................................................................. 3-30
Working with Other Blocks ........................................................................ 3-33
Timer Block ...........................................................................................................
Time Stamp Block .................................................................................................
Ramp Block ..........................................................................................................
Beep Block ............................................................................................................
Sound Block ..........................................................................................................
System Control Block ...........................................................................................
3-33
3-34
3-35
3-37
3-38
3-39
Summary ...................................................................................................... 3-40
Chapter 4: Configuring Your Display View With Display Designer
Overview ........................................................................................................ 4-2
Contents ................................................................................................................. 4-2
Working with the Display Window ............................................................... 4-2
Display Toolbox ....................................................................................................... 4-4
Creating and Configuring a Display ........................................................................ 4-4
Attaching/Detaching a Background Bitmap ............................................................ 4-6
Working with Objects ................................................................................... 4-7
Populating a Display with Objects ..........................................................................
Selecting and Sizing Objects ..................................................................................
Duplicating Objects .................................................................................................
Cutting Objects .......................................................................................................
Moving Objects .......................................................................................................
Arranging Objects ...................................................................................................
4-8
4-8
4-8
4-8
4-8
4-8
Working with Display Objects .................................................................... 4-10
General Guidelines for Using Display Objects ..................................................... 4-10
Choosing Input for Display Objects ...................................................................... 4-10
Indicator Display Item ............................................................................................ 4-11
Numeric/String Display Item ................................................................................. 4-12
Conditional Text Display Item ............................................................................... 4-14
Bar Graph Display Item ........................................................................................ 4-15
vii
Analog Meter Display Object ................................................................................
Trend Graph Display Item .....................................................................................
XY Graph Display Item .........................................................................................
Conditional Bitmap Display Item ...........................................................................
Text String Display Item ........................................................................................
Group Box Display Item ........................................................................................
Event Log Display Item .........................................................................................
4-17
4-19
4-21
4-22
4-23
4-24
4-25
Working with Control Objects .................................................................... 4-26
Connecting a Control Object to a Task Block .......................................................
Connecting a Control Object to a Display Block ...................................................
Restore the Previous Stop Value ..........................................................................
Privilege Levels .....................................................................................................
Binary Button Control Display Item .......................................................................
Conditional Button Control Display Item ...............................................................
Menu Button Control Display Item ........................................................................
Numeric Control ....................................................................................................
Knob Control .........................................................................................................
Slider Control ........................................................................................................
4-26
4-27
4-27
4-27
4-27
4-29
4-31
4-32
4-34
4-36
Working with Cell Objects .......................................................................... 4-38
Grouping and Rotating Cell Objects .....................................................................
Configuring Cell Objects .......................................................................................
Rectangle Drawing Display Item ...........................................................................
Rounded Rectangle Cell .......................................................................................
Oval Cell ...............................................................................................................
Polygon Cell ..........................................................................................................
Line Cell ................................................................................................................
4-38
4-38
4-39
4-39
4-39
4-39
4-39
Summary ...................................................................................................... 4-40
Chapter 5: Connecting Your Devices
Overview ........................................................................................................ 5-2
I/O Blocks ............................................................................................................... 5-2
Contents ................................................................................................................. 5-3
Using Advantech DLL Drivers ...................................................................... 5-3
Installing and Configuring Advantech I/O Devices ................................................. 5-3
Porting Device Configuration to Another Machine .................................................. 5-5
Connecting Devices with OPC Standard Interface .................................... 5-6
Configuring OPC Communication Settings ............................................................ 5-6
Mapping OPC Items to I/O Blocks .......................................................................... 5-6
Analog Input .................................................................................................. 5-7
Block Information .................................................................................................... 5-8
Dialog Box Configuration ........................................................................................ 5-8
Through Advantech DLL Driver Interface ............................................................. 5-10
Through OPC Interface ........................................................................................ 5-10
Analog Output ............................................................................................. 5-11
viii
Block Information ................................................................................................... 5-11
Dialog Box Configuration ....................................................................................... 5-11
Digital Input ................................................................................................. 5-12
Block Information .................................................................................................. 5-12
Dialog Box Configuration ...................................................................................... 5-13
Digital Output .............................................................................................. 5-14
Block Information .................................................................................................. 5-14
Dialog Box Configuration ...................................................................................... 5-15
Temperature Measurement......................................................................... 5-16
Block Information .................................................................................................. 5-16
Dialog Box Configuration ...................................................................................... 5-17
Counter/Frequency Measurement/Pulse Output ...................................... 5-18
Block Information .................................................................................................. 5-18
Dialog Box Configuration ...................................................................................... 5-19
Block Information .................................................................................................. 5-21
Hardware Alarm ........................................................................................... 5-21
Dialog Box Configuration ...................................................................................... 5-22
RS-232 .......................................................................................................... 5-24
Block Information .................................................................................................. 5-24
Dialog Box Configuration ...................................................................................... 5-25
Performance Test ........................................................................................ 5-28
Summary ...................................................................................................... 5-29
Chapter 6: Historical Trending System
Overview ........................................................................................................ 6-2
Contents ................................................................................................................. 6-2
Creating a Historical Trend........................................................................... 6-2
Configuring a Historical Trend ..................................................................... 6-3
Field Description ..................................................................................................... 6-4
Going to a Specific Time with GoTo Button ................................................ 6-4
Searching a Specific Value with the Search Button................................... 6-5
Converting Historical Trend Data to a Text File .......................................... 6-6
Chapter 7: Monitoring Alarm and Event
Overview ........................................................................................................ 7-2
Contents ................................................................................................................. 7-2
Configuring Alarm Settings Under the Runtime Preferences ................... 7-2
Configuring the Alarm Log Block ................................................................ 7-4
Alarm System at Runtime ............................................................................. 7-5
Summary ........................................................................................................ 7-6
ix
Chapter 8: Communicating Through TCP/IP Networking
Overview ........................................................................................................ 8-2
Contents ................................................................................................................. 8-2
Network Architecture .................................................................................... 8-2
Configure IP Addresses and Node Names on Client Site .......................... 8-3
Field Description ..................................................................................................... 8-3
Field Description ..................................................................................................... 8-4
Configuring Network Input Blocks to Map Remote Tags .......................... 8-4
Block Information ....................................................................................................
Interface ..................................................................................................................
Description ..............................................................................................................
Dialog Box Configuration ........................................................................................
8-4
8-5
8-5
8-5
Enabling Event Log to Check Network Messages ..................................... 8-6
Setup TCP/IP in Windows 98/95 ................................................................... 8-7
Setup TCP/IP in Windows NT ..................................................................... 8-10
Troubleshooting .......................................................................................... 8-13
Summary ...................................................................................................... 8-13
Chapter 9: Runtime and Security System
Overview ........................................................................................................ 9-2
Contents ................................................................................................................. 9-2
Working with GeniDAQ Runtime ................................................................. 9-2
Runtime Environment ............................................................................................. 9-2
Starting Runtime ..................................................................................................... 9-3
Exiting Runtime ....................................................................................................... 9-4
Configuring Runtime Properties .................................................................. 9-4
Runtime Preference... ............................................................................................. 9-4
Configuring Password Security ................................................................... 9-7
Administration ......................................................................................................... 9-7
Change Password .................................................................................................. 9-8
Log-in and Log-off at Runtime ..................................................................... 9-9
Working With Display Control Object at Runtime .................................... 9-10
Chapter 10: Advanced BasicScript
Programmingfor Your Specific Needs
Overview ...................................................................................................... 10-2
Contents ............................................................................................................... 10-2
Script Designer Basics ............................................................................... 10-2
Toolbar .................................................................................................................. 10-2
Editing Your Script ...................................................................................... 10-3
Navigating Within a Script .................................................................................... 10-3
Inserting Text ........................................................................................................ 10-4
x
Selecting Text .......................................................................................................
Deleting Text .........................................................................................................
Cutting and Copying Text......................................................................................
Pasting Text ..........................................................................................................
Undoing Editing Operations ..................................................................................
Adding Comments to Your Script ..........................................................................
Breaking a BasicScript Statement across Multiple Lines .....................................
Checking the Syntax of a Script ...........................................................................
10-5
10-6
10-6
10-7
10-7
10-7
10-8
10-9
Running Your Scripts ................................................................................ 10-10
Debugging Your Scripts ........................................................................... 10-11
Using the BasicScript Debugger .......................................................................... 10-11
Tracing Script Execution ...................................................................................... 10-11
Setting and Removing Breakpoints .................................................................... 10-13
Setting Breakpoints............................................................................................. 10-14
Removing Breakpoints........................................................................................ 10-15
Adding a Watch Variable .................................................................................... 10-15
Types of Variables You Can Watch .................................................................... 10-16
Modifying or Deleting a Watch Variable .............................................................. 10-17
Exiting from Script Designer ............................................................................... 10-18
Programming with GeniDAQ .................................................................... 10-18
Main Script .......................................................................................................... 10-19
Pre-Task and Post-Task script ............................................................................ 10-20
BasicScript GeniDAQ Commands ........................................................... 10-21
Overview .............................................................................................................
System ................................................................................................................
BasicScript ..........................................................................................................
Scan Task ...........................................................................................................
Tag ......................................................................................................................
Display ................................................................................................................
BasicScript Block ................................................................................................
10-21
10-21
10-21
10-22
10-22
10-22
10-22
System ....................................................................................................... 10-23
SystemStop (method) .........................................................................................
SystemExit (method) ..........................................................................................
GetNodeState (method)......................................................................................
OverRunTimerSwh (method) ..............................................................................
UpdateHoldFile (method) ....................................................................................
10-23
10-23
10-24
10-24
10-25
ScanTask .................................................................................................... 10-25
ScanTask (object type) .......................................................................................
ScanTaskObject.GetStatus (method) .................................................................
ScanTaskObject.SingleScan (method) ..............................................................
ScanTaskObject.Start (method).........................................................................
ScanTaskObject.Stop (method) .........................................................................
GetScanTask (function) ......................................................................................
10-25
10-26
10-27
10-28
10-28
10-29
Tag .............................................................................................................. 10-30
Tag (object type) ................................................................................................. 10-30
xi
tagObj.Value (Property) ......................................................................................
tagObj.Array (Channel number) .........................................................................
GetTag (function) ................................................................................................
tagObj.Lock (method) .........................................................................................
tagObj.SetLockedValue (method) .......................................................................
tagObj.Unlock (method) ......................................................................................
10-31
10-31
10-32
10-32
10-33
10-34
Display ....................................................................................................... 10-35
Display (statement) ............................................................................................. 10-35
BasicScript Block ...................................................................................... 10-36
Outputf (statement) .............................................................................................
Outputi (statement) .............................................................................................
Outputl (statement) .............................................................................................
Outputs (statement) ............................................................................................
10-36
10-37
10-37
10-38
Notice ......................................................................................................... 10-39
Limitations ................................................................................................. 10-40
Summary .................................................................................................... 10-40
Chapter 11: Sharing Real Time Data with Data Center
Overview ...................................................................................................... 11-2
Contents ................................................................................................................ 11-2
Data Store .................................................................................................... 11-3
Data Structure ........................................................................................................ 11-3
Available Tags ........................................................................................................ 11-3
The Tags Created By GeniDAQ ............................................................................ 11-4
DDE Interface ............................................................................................... 11-5
OLE Automation .......................................................................................... 11-5
Three Objects for OLE Automation Interface ........................................................ 11-5
Object Description ................................................................................................. 11-6
GeniDAQ32.OleDB Object .................................................................................... 11-6
GeniDAQ32.TaskList and GeniDAQ32.TagList Object ............................. 11-7
OLE Automation Interface Example .......................................................... 11-8
Type Library Source for OLE Automation Interface ............................... 11-11
Summary .................................................................................................... 11-16
Chapter 12: Advantech GeniDAQ WinCE for HMI-640S Platform
Overview ...................................................................................................... 12-2
Contents ............................................................................................................... 12-2
Installing Advantech GeniDAQ CE on HMI-640S ...................................... 12-3
Installing Advantech GeniDAQ CE Runtime for
HMI-640S via Microsoft ActiveSync ...................................................................... 12-3
Copying GeniDAQ CE Runtime files from host PC to HMI-640S ......................... 12-4
Installing Advantech GeniDAQ CE Runtime
for HMI-640S via TCP/IP Network ....................................................................... 12-4
xii
Creating GeniDAQ CE Strategy on Host ................................................... 12-6
Downloading GeniDAQ CE Strategy Files to HMI-640S ........................... 12-7
Download strategy files from host PC to HMI-640S via Advantech GeniDAQ ..... 12-7
Download strategy files from host PC to HMI-640S via
Microsoft ActiveSync ............................................................................................ 12-7
Configuring I/O Devices on HMI-640S ....................................................... 12-8
Connecting Devices Through OPC Interface ....................................................... 12-8
Connecting Simulation I/O or Serial Port Devices ................................................ 12-8
Configuring TCP/IP Networking on HMI-640S .......................................... 12-9
Running Advantech GeniDAQ CE on HMI-640S ..................................... 12-10
Runtime Environment ......................................................................................... 12-10
Starting Runtime .................................................................................................. 12-11
Exiting Runtime .................................................................................................... 12-11
Differences between the Win32 and WinCE Versions of
Advantech GeniDAQ ................................................................................. 12-11
TASK Blocks ....................................................................................................... 12-12
DISPLAY Blocks ................................................................................................. 12-13
Summary .................................................................................................... 12-14
Appendix A: Runtime Error Code Listing
Errors and Warnings .................................................................................... A-2
“Open communication port failed on %d” ............................................................... A-2
“Transmit failed on %d” ........................................................................................... A-2
“Receive failed on %d” ............................................................................................ A-2
“Invalid data received on %d” ................................................................................. A-2
“Initialize failed on %d” ............................................................................................ A-2
“Device reset failure on %d” ................................................................................... A-3
“Analog input initialization failure on %d” ................................................................ A-3
“Analog output initialization failure on %d” ............................................................. A-3
“Digital output initialization failure on %d” ............................................................... A-3
“Digital input initialization failure on %d” ................................................................. A-3
“Temperature initialization failure on %d” ............................................................... A-3
“Analog input section failure on %d” ....................................................................... A-3
“Analog output section failure on %d” ..................................................................... A-3
“Digital output section failure on %d” ...................................................................... A-4
“Digital input section failure on %d” ........................................................................ A-4
“Temperature section failure on %d” ....................................................................... A-4
“Device not found” .................................................................................................. A-4
“No XXX function supported on %d”....................................................................... A-4
“Timer Overrun, slow down the sampling rate” ....................................................... A-4
“Not enough memory” ............................................................................................. A-4
“File not found” ........................................................................................................ A-4
“Configuration data lost” ......................................................................................... A-4
xiii
Appendix B: Glossary
Glossary ........................................................................................................ B-2
Actuator .................................................................................................................. B-2
A/D Converter ......................................................................................................... B-2
Add ......................................................................................................................... B-2
Analog ..................................................................................................................... B-2
C, Centigrade, Celsius ............................................................................................ B-2
CJC, Cold Junction Compensation ......................................................................... B-2
Comp Loop ............................................................................................................. B-3
Configure ................................................................................................................ B-3
Controller, Temperature .......................................................................................... B-3
Conversion Rate ..................................................................................................... B-3
Counts .................................................................................................................... B-3
D/A Converter ......................................................................................................... B-3
Deadband (Hysteresis) ........................................................................................... B-3
Differential Input ...................................................................................................... B-3
F (Fahrenheit) ......................................................................................................... B-4
Hold ........................................................................................................................ B-4
Hz............................................................................................................................ B-4
Impedance .............................................................................................................. B-4
I/O Device ............................................................................................................... B-4
Input Resistance ..................................................................................................... B-4
Install ...................................................................................................................... B-4
Instance .................................................................................................................. B-4
K (Kelvin) ................................................................................................................ B-5
Measuring Junction ................................................................................................. B-5
Multiplex .................................................................................................................. B-5
Overshoot ............................................................................................................... B-5
Range ..................................................................................................................... B-5
Reference Junction ................................................................................................. B-5
Remove .................................................................................................................. B-5
Resolution ............................................................................................................... B-5
Response Time ....................................................................................................... B-5
RTD......................................................................................................................... B-6
Secondary Junction ................................................................................................ B-6
Settling Time ........................................................................................................... B-6
Setup ...................................................................................................................... B-6
Signal Conditioner .................................................................................................. B-6
Single Ended Input ................................................................................................. B-6
Temperature Limit ................................................................................................... B-6
Temperature Span .................................................................................................. B-6
Temperature Stability/Instability .............................................................................. B-6
Thermocouple ......................................................................................................... B-7
Thermocouple Break Protection ............................................................................. B-7
Transducer .............................................................................................................. B-7
Wheatstone Bridge ................................................................................................. B-7
xiv
Appendix C: ADAM OPC Server
Introduction .................................................................................................. C-2
Key Features of the ADAM OPC Server ................................................................. C-2
System Configuration and Installation ....................................................... C-2
System Requirements for Windows 95/NT ............................................................ C-2
Installing the ADAM OPC Server Under Windows 98/95/NT ................................. C-3
Install ADAM OPC Server at Windows CE ............................................................. C-3
Quick Start .................................................................................................... C-4
Step 1: Add New Device ......................................................................................... C-4
Step 2: Add New Group .......................................................................................... C-5
Step 3: Add a New Tag ........................................................................................... C-5
OPC Server Configuration ........................................................................... C-7
OPC Server Tool ..................................................................................................... C-7
Features .................................................................................................................. C-7
Access Methods ..................................................................................................... C-7
Using the Tool’s Browser ............................................................................ C-8
Tool Tree Browser ................................................................................................... C-8
The Menu Bar ............................................................................................... C-9
Using the File Menu .............................................................................................. C-10
Using the Add Menu ............................................................................................. C-11
Using the Edit Menu ............................................................................................. C-12
Using the Help Menu ............................................................................................ C-13
Configuring the I/O Driver with the Tool ................................................................ C-13
Adding and Modifying Tag Groups ....................................................................... C-15
Adding and Modifying Tags .................................................................................. C-16
Configuring the I/O Driver for Windows CE .......................................................... C-18
Using OPC Client ....................................................................................... C-19
Features ................................................................................................................ C-19
Connecting the OPC Server ................................................................................. C-19
Server Status and Group Parameters ...................................................... C-20
Configuring the OPC Client .................................................................................. C-20
Accessing the OPC Server ................................................................................... C-24
Summary ..................................................................................................... C-26
xv
Appendix D: Serial ModBUS OPC Server
Introduction .................................................................................................. D-2
Key Features of the MODBUS RTU OPC Server ................................................... D-2
System Configuration and Installation ....................................................... D-2
System Requirements for Windows 95/NT ............................................................ D-2
Installing MODBUS RTU OPC Server on Windows 95/NT .................................... D-3
Registering the OPC Server ................................................................................... D-3
Install MODBUS RTU OPC Server in Windows CE ............................................... D-3
Registering the OPC Server ................................................................................... D-4
Quick Start .................................................................................................... D-4
Step 1: Add a New Device ...................................................................................... D-4
Step 2: Add New Device ......................................................................................... D-5
Step 3: Add a New Group ....................................................................................... D-6
Step 4: Add a New Tag ........................................................................................... D-6
OPC Server Configuration ........................................................................... D-7
OPC Server Tool ..................................................................................................... D-7
Access Methods ..................................................................................................... D-8
Using the Tool’s Browser ........................................................................................ D-8
The Menu Bar ............................................................................................... D-9
Using Shortcut Keys ............................................................................................... D-9
Using the File Menu ................................................................................................ D-9
Using the Add Menu ............................................................................................. D-11
Using the Edit Menu ............................................................................................. D-11
Using the Help Menu ............................................................................................ D-12
Configuring the I/O Driver with the Tool ................................................... D-13
Adding and Modifying Devices ............................................................................. D-13
Adding and Modifying Tag Groups ....................................................................... D-15
Adding and Modifying Tags .................................................................................. D-16
Configuring the I/O Driver for Window CE ............................................................ D-18
Using OPC Client ....................................................................................... D-18
Features ................................................................................................................ D-19
Connecting OPC Server ....................................................................................... D-19
Server Status and Group Parameters .................................................................. D-20
Configuring the OPC Client .................................................................................. D-20
Accessing the OPC Server ................................................................................... D-23
Summary ..................................................................................................... D-25
xvi
Figures
Figure 1-1: GeniDAQ System Architecture ............................................................................................................................. 1-3
Figure 1-2: GeniDAQ Installation Program Splash Screen .................................................................................................... 1-7
Figure 1-3: GeniDAQ Installation Welcome Screen ............................................................................................................... 1-7
Figure 1-4: GeniDAQ Installation Information Screen ............................................................................................................ 1-8
Figure 1-5: Installation Program Information Screen .............................................................................................................. 1-9
Figure 1-6: Choose Destination Location Dialog Box ........................................................................................................... 1-10
Figure 1-7: Choose to Install the Full or Compact Versions of the Program ........................................................................ 1-11
Figure 1-8: Select Program Folder Dialog Box ..................................................................................................................... 1-12
Figure 1-9: Copying Program Files to Computer .................................................................................................................. 1-12
Figure 1-10: Click Yes to Install the Program Shortcuts ....................................................................................................... 1-13
Figure 1-11: Click Yes to Install Adobe Acrobat Reader ....................................................................................................... 1-13
Figure 1-12: Click Yes to Install the DCOM98 Components ................................................................................................ 1-14
Figure 1-13: Setup Complete Dialog Box ............................................................................................................................. 1-14
Figure 1-14: Removing GeniDAQ From the Computer ........................................................................................................ 1-16
Figure 1-15: GeniDAQ Start Menu Shortcuts ....................................................................................................................... 1-17
Figure 1-16: The Add Devices Toolbar Icon ......................................................................................................................... 1-20
Figure 1-17: Device Installation Utility Main Screen ............................................................................................................. 1-20
Figure 1-18: Device Configuration Dialog Box ...................................................................................................................... 1-21
Figure 1-19: I/O Device Installation Dialog Box Showing New Device ................................................................................. 1-21
Figure 1-20: Open the Alarm.gni Strategy ............................................................................................................................ 1-22
Figure 1-21: Running Alarm.gni ............................................................................................................................................ 1-23
Figure 2-1: GeniDAQ information ............................................................................................................................................ 2-4
Figure 2-2: New strategy file ................................................................................................................................................... 2-5
Figure 2-3: Add an AI block ..................................................................................................................................................... 2-6
Figure 2-4: Configure AI block I/O device ............................................................................................................................... 2-7
Figure 2-5: Switch Task and Display ....................................................................................................................................... 2-8
Figure 2-6: Add a numerical display item ............................................................................................................................... 2-8
Figure 2-7: Configure a numeric display item ......................................................................................................................... 2-9
Figure 2-8: Connect Task and Display .................................................................................................................................... 2-9
Figure 2-9: Add a trend graph item ....................................................................................................................................... 2-10
Figure 2-10: Configure a trend graph item ............................................................................................................................ 2-10
Figure 2-11: Save a strategy file ............................................................................................................................................ 2-11
Figure 2-12: Start to run strategy file ..................................................................................................................................... 2-11
Figure 2-13: Strategy file execution results .......................................................................................................................... 2-12
Figure 2-14: Add a display window ....................................................................................................................................... 2-13
Figure 2-15: Configure display switch to DISP2 ................................................................................................................... 2-13
Figure 2-16: Configure display switch to DISP1 ................................................................................................................... 2-14
Figure 2-17: Change between screens ................................................................................................................................. 2-14
Figure 2-18: Add two AI blocks and a single operator block ................................................................................................ 2-15
Figure 2-19: Select output channel of AI block ..................................................................................................................... 2-15
Figure 2-20: Select the operand of single operator .............................................................................................................. 2-16
Figure 2-21: Wire two AI blocks to a single operand block .................................................................................................. 2-16
Figure 2-22: Wire two AI blocks to two single operands ...................................................................................................... 2-16
Figure 2-23: View the execution order .................................................................................................................................. 2-17
Figure 2-24: Arrange the execution order ............................................................................................................................. 2-17
Figure 2-25: Exchange execution order ................................................................................................................................ 2-18
Figure 2-26: Add a binary button control item ...................................................................................................................... 2-19
Figure 2-27: Add a binary button control item ...................................................................................................................... 2-20
Figure 2-28: Add two rectangle drawing items ..................................................................................................................... 2-20
Figure 2-29: Configure Drawing item .................................................................................................................................... 2-21
Figure 2-30: Make object ....................................................................................................................................................... 2-21
Figure 2-31: Run strategy file “TUTOR4.GNI” ...................................................................................................................... 2-22
Figure 2-32: Add numeric control and indicator display item ............................................................................................... 2-23
Figure 2-33: Configure indicator display and link to Task ..................................................................................................... 2-23
Figure 2-34: Add alarm block and TAG block ....................................................................................................................... 2-24
Figure 2-35: Configure alarm block ....................................................................................................................................... 2-24
Figure 2-36: Configure TAG to link with display item ............................................................................................................ 2-25
Figure 2-37: Connect TAG block to alarm block ................................................................................................................... 2-25
xvii
Figure 2-38: Run strategy file “TUTOR5.GNI” ...................................................................................................................... 2-26
Figure 2-39: Build display screen .......................................................................................................................................... 2-27
Figure 2-40: Build Task icon and wiring ................................................................................................................................ 2-27
Figure 2-41: Link TAG to numeric control item ..................................................................................................................... 2-28
Figure 2-42: Link BasicScript output to indicator display ..................................................................................................... 2-29
Figure 2-43: Add Virtual TAG ................................................................................................................................................ 2-30
Figure 2-44: Create a new Virtual TAG ................................................................................................................................. 2-30
Figure 2-45: Build Task icons ................................................................................................................................................ 2-31
Figure 2-46: Link Tag block to Virtual TAG ........................................................................................................................... 2-31
Figure 2-47: Build display screen .......................................................................................................................................... 2-32
Figure 2-48: Link BasicScript output to indicator display ..................................................................................................... 2-33
Figure 2-49: Setup Task properties ....................................................................................................................................... 2-34
Figure 2-50: Setup ScanTask properties .............................................................................................................................. 2-34
Figure 2-51: Add a main script to the strategy ...................................................................................................................... 2-35
Figure 2-52: Edit main script program .................................................................................................................................. 2-35
Figure 2-53: Create a new Task ............................................................................................................................................ 2-36
Figure 2-54: Build multiple Task icons .................................................................................................................................. 2-37
Figure 2-55: Configure trend graphs ..................................................................................................................................... 2-37
Figure 2-56: Setup TASK1 to be started immediately .......................................................................................................... 2-38
Figure 2-57: Setup TASK2 to be started after a 5 second delay .......................................................................................... 2-38
Figure 3-1: Main Parts of the Task Designer Window ............................................................................................................ 3-3
Figure 3-2: Task Designer Task Toolbox ................................................................................................................................. 3-4
Figure 3-3: Add Task/Delete Task Toolbar Icons .................................................................................................................... 3-5
Figure 3-4: Task Properties Toolbar Icon ................................................................................................................................ 3-6
Figure 3-5: ScanTask Setup Configuration Dialog Box .......................................................................................................... 3-6
Figure 3-6: OPC Server Properties Configuration Dialog Box ................................................................................................ 3-7
Figure 3-7: Advanced Option configuration Dialog Box .......................................................................................................... 3-7
Figure 3-8: Connect a block to a display item ........................................................................................................................ 3-9
Figure 3-9: Connect display control item to Task block ........................................................................................................ 3-10
Figure 3-10: Single Operator Calculation Block Information ................................................................................................. 3-11
Figure 3-11: Single Operator Calculation Block .................................................................................................................... 3-12
Figure 3-12: Single Operator Calculation Block Operators and Functions .......................................................................... 3-13
Figure 3-13: Average Block Information ............................................................................................................................... 3-14
Figure 3-14: Average Block Configuration Dialog Box ......................................................................................................... 3-15
Figure 3-15: On/Off Control Block Information ..................................................................................................................... 3-15
Figure 3-16: On/Off Control Block Configuration Dialog Box ............................................................................................... 3-16
Figure 3-17: PID Control Block Information .......................................................................................................................... 3-17
Figure 3-18: PID Control Block Configuration Dialog Box .................................................................................................... 3-18
Figure 3-19: Event Counter Block Information (4-h.vsd) ...................................................................................................... 3-20
Figure 3-20: Event Counter Block Configuration Dialog Box ................................................................................................ 3-20
Figure 3-21: Data File Block Information .............................................................................................................................. 3-21
Figure 3-22: Data File Block Configuration Dialog Box ........................................................................................................ 3-22
Figure 3-23: Log File Block Information ................................................................................................................................ 3-22
Figure 3-24: Log file Block Configuration Dialog Box ........................................................................................................... 3-23
Figure 3-25: Select data storage type ................................................................................................................................... 3-23
Figure 3-26: Select file update method ................................................................................................................................. 3-24
Figure 3-27: Select the delimiter between data .................................................................................................................... 3-24
Figure 3-28: Log file open/close methods ............................................................................................................................. 3-25
Figure 3-29: DDE Server Block Information ......................................................................................................................... 3-26
Figure 3-30: DDE server block setting .................................................................................................................................. 3-27
Figure 3-31: DDE Client Block Information ........................................................................................................................... 3-28
Figure 3-32: DDE Client block ............................................................................................................................................... 3-28
Figure 3-33: Create DDE links .............................................................................................................................................. 3-29
Figure 3-34: Tag Block Information ....................................................................................................................................... 3-29
Figure 3-35: TAG Block Configuration Dialog Box ................................................................................................................ 3-30
Figure 3-36: Virtual Tag Table ............................................................................................................................................... 3-31
Figure 3-37: Link Virtual Tag to Tag block ............................................................................................................................. 3-31
Figure 3-38: Use Virtual Tag in Display Designer ................................................................................................................. 3-32
Figure 3-39: Use Virtual Tag in BasicScript .......................................................................................................................... 3-32
Figure 3-40: Timer Block Information .................................................................................................................................... 3-33
Figure 3-41: Timer Block Configuration Dialog Box .............................................................................................................. 3-33
Figure 3-42: Time Stamp Block Information ......................................................................................................................... 3-34
Figure 3-43: Time Stamp Block Configuration Dialog Box ................................................................................................... 3-35
xviii
Figure 3-44: Time Stamp Output Format .............................................................................................................................. 3-35
Figure 3-45: Ramp Block Information ................................................................................................................................... 3-35
Figure 3-46: Ramp Block Configuration Dialog Box ............................................................................................................. 3-36
Figure 3-47: Beep Block Information .................................................................................................................................... 3-37
Figure 3-48: Beep Block Configuration Dialog Box .............................................................................................................. 3-37
Figure 3-49: Sound Block Information .................................................................................................................................. 3-38
Figure 3-50: Conditional Wavefile Block Configuration Dialog Box ...................................................................................... 3-38
Figure 3-51: System Control Block Dialog Box ..................................................................................................................... 3-39
Figure 4-1: Display Designer Screen ...................................................................................................................................... 4-3
Figure 4-2: Display Designer’s Design Toolbox ...................................................................................................................... 4-4
Figure 4-3: Adding and Deleting Displays ............................................................................................................................... 4-5
Figure 4-4: The Add Display and Delete Display Toolbar Icons ............................................................................................. 4-5
Figure 4-5: Display Properties Window ................................................................................................................................... 4-6
Figure 4-6: Display Properties Icon on the Task Designer Toolbar ........................................................................................ 4-6
Figure 4-7: Select the Bitmap to Attach .................................................................................................................................. 4-7
Figure 4-8: Attached Bitmap will Appear in Display Window ................................................................................................. 4-7
Figure 4-9: Example of Send to Back/Bring to Front .............................................................................................................. 4-9
Figure 4-10: Example of Send to Back/Bring to Front ............................................................................................................ 4-9
Figure 4-11: Connection Configuration Dialog Box ................................................................................................................ 4-11
Figure 4-12: Indicator Display Item in Workspace Window ................................................................................................... 4-11
Figure 4-13: Indicator Display Item Configuration Dialog Box .............................................................................................. 4-12
Figure 4-14: Numeric/String Display Item in Workspace Window ....................................................................................... 4-12
Figure 4-15: Numeric/String Display Item Configuration Dialog Box ................................................................................... 4-13
Figure 4-16: Conditional Text Display Item in Workspace Window ...................................................................................... 4-14
Figure 4-17: Conditional Text Display Item Configuration Dialog Box .................................................................................. 4-14
Figure 4-18: Bar Graph Display Item in Workspace Window ............................................................................................... 4-15
Figure 4-19: Bar Graph Display Item .................................................................................................................................... 4-15
Figure 4-20: Connect Bar Graph display with Task .............................................................................................................. 4-16
Figure 4-21: Analog Meter Display Object in Workspace Window ....................................................................................... 4-17
Figure 4-22: Analog Meter Display Object Configuration Dialog Box ................................................................................... 4-18
Figure 4-23: Trend Graph Display Item in Configuration Window ........................................................................................ 4-19
Figure 4-24: Trend Graph Display Item Configuration Dialog Box ....................................................................................... 4-20
Figure 4-25: XY Graph Display Item in Workspace Window ................................................................................................ 4-21
Figure 4-26: Trend Graph Display Item Configuration Dialog Box ....................................................................................... 4-21
Figure 4-27: Conditional Bitmap Display Item in Workspace Window ................................................................................. 4-22
Figure 4-28: Conditional Bitmap Item Configuration Dialog Box .......................................................................................... 4-23
Figure 4-29: Text String Display Item in Workspace Window .............................................................................................. 4-23
Figure 4-30: Text String Display Item Configuration Window ............................................................................................... 4-24
Figure 4-31: Group Box Display Item Configuration Dialog Box .......................................................................................... 4-24
Figure 4-32: Event Log Display Item Dialog Box .................................................................................................................. 4-25
Figure 4-33: Connecting a Control Object to a Task Block .................................................................................................. 4-26
Figure 4-34: Binary Button Control Display Item in Workspace Window ............................................................................. 4-27
Figure 4-35: Binary Button Display Item Configuration Dialog Box ...................................................................................... 4-28
Figure 4-36: Configure Operating Style to be Radio Button ................................................................................................. 4-29
Figure 4-37: Conditional Button Control Display Item in Workspace Window ..................................................................... 4-29
Figure 4-38: Conditional Button Control Configuration Dialog Box ...................................................................................... 4-30
Figure 4-39: Menu Button Control Display Item in Workspace Window .............................................................................. 4-31
Figure 4-40: Menu Button Display Item ................................................................................................................................ 4-32
Figure 4-41: Numeric Control Display Item in Configuration Window .................................................................................. 4-32
Figure 4-42: Numeric Control Display Item Configuration Dialog Box ................................................................................. 4-33
Figure 4-43: Knob Control Display Item in Workspace Window .......................................................................................... 4-34
Figure 4-44: Configure Knob Control display item ................................................................................................................ 4-35
Figure 4-45: Slider Control in Workspace Window ............................................................................................................... 4-36
Figure 4-46: Configure Slider Control display item ............................................................................................................... 4-37
Figure 4-47: Configure Rectangle Drawing Display Item Configuration Dialog Box ............................................................ 4-38
Figure 5-1: Connecting Your Hardware With GeniDAQ .......................................................................................................... 5-2
Figure 5-2: The Add Devices Toolbar Icon ............................................................................................................................. 5-3
Figure 5-3: Device Installation Utility Main Screen ................................................................................................................. 5-4
Figure 5-4: Device Configuration Dialog Box .......................................................................................................................... 5-4
Figure 5-5: I/O Device Installation Dialog Box Showing New Device ..................................................................................... 5-5
Figure 5-6: OPC Server Properties Configuration Dialog Box ................................................................................................ 5-6
Figure 5-7: OPC Item Select Configuration Dialog Box ......................................................................................................... 5-7
Figure 5-8: Analog Input Block ................................................................................................................................................ 5-7
xix
Figure 5-9: Analog Input Block Configuration Dialog Box ...................................................................................................... 5-8
Figure 5-10: Analog Input Scaling Dialog Box ........................................................................................................................ 5-9
Figure 5-11:Analog Input Block’s Wiring out Dialog Box ...................................................................................................... 5-10
Figure 5-12: Analog Output Block Information ...................................................................................................................... 5-11
Figure 5-13: Analog Output Block Configuration Dialog Box ................................................................................................ 5-11
Figure 5-14: Digital Input Block ............................................................................................................................................. 5-12
Figure 5-15: Digital Input Block Configuration Dialog Box ................................................................................................... 5-13
Figure 5-16:Digital Input Block’s Wiring out Dialog Box ....................................................................................................... 5-13
Figure 5-17: Digital Output Block .......................................................................................................................................... 5-14
Figure 5-18: Digital Output Block Configuration Dialog Box ................................................................................................. 5-15
Figure 5-19: Temperature Measurement Block .................................................................................................................... 5-16
Figure 5-20: Temperature Measurement Block Configuration Dialog Box ........................................................................... 5-17
Figure 5-21: Counter/Frequency Measurement/Pulse Output Block ................................................................................... 5-18
Figure 5-22: Event Counter/Frequency Counter/Pulse Output Configuration Dialog Box ................................................... 5-19
Figure 5-23: Counter/Frequrency/Pulse Block’s Wiring in Dialog Box ................................................................................. 5-21
Figure 5-24: Hardware Alarm Block ...................................................................................................................................... 5-21
Figure 5-25: Digital Alarm Block Configuration Dialog Box .................................................................................................. 5-22
Figure 5-26: Advantech ADAM-4000 Module Parameters Configuration Dialog Box .......................................................... 5-22
Figure 5-27: Hardware Alarm Block’s Wiring in Dialog Box ................................................................................................. 5-23
Figure 5-28: RS-232 Block .................................................................................................................................................... 5-24
Figure 5-29: Serial Port Interface Block Configuration Dialog Box ...................................................................................... 5-25
Figure 5-30: RS-232 Block’s Additional Response String Dialog Box ................................................................................. 5-27
Figure 5-31: Adam Module Driver Performance Figures ...................................................................................................... 5-28
Figure 6-1: Historical Trend Display ........................................................................................................................................ 6-2
Figure 6-2: Historical Trend Configuration Dialog Box ........................................................................................................... 6-3
Figure 6-3: The Historical Trend When Running .................................................................................................................... 6-4
Figure 6-4: Goto Specific Postion Configuration Dialog Box .................................................................................................. 6-5
Figure 6-5: Search Configuration Dialog Box ......................................................................................................................... 6-5
Figure 6-6: Select File | HIST Conversion from the main menu ............................................................................................. 6-6
Figure 6-7: Historical Data Conversion Configuration Dialog Box .......................................................................................... 6-7
Figure 6-8: Conversion Complete Notification Box ................................................................................................................. 6-7
Figure 6-9: Viewing Historical Trend Data in Windows Notepad ............................................................................................ 6-7
Figure 7-1: The Alarm Log Block Architecture ........................................................................................................................ 7-2
Figure 7-2: Runtime Preference Configuration Dialog Box .................................................................................................... 7-3
Figure 7-3: Alarm Log Block Configuration Dialog Box .......................................................................................................... 7-4
Figure 7-4: The Alarm System at Runtime ............................................................................................................................. 7-5
Figure 7-5: Viewing the Log File in Windows Notepad ........................................................................................................... 7-6
Figure 8-1: GeniDAQ Network Architecture ............................................................................................................................ 8-2
Figure 8-2: Network Settings Configuration Dialog Box ......................................................................................................... 8-3
Figure 8-3: Network’s Advanced Option Dialog Box ............................................................................................................... 8-4
Figure 8-4: Network Input Block Information Diagram ........................................................................................................... 8-4
Figure 8-5: Net Tag Block Configuration Dialog Box .............................................................................................................. 8-5
Figure 8-6: Select Task & Tag Name Configuration Dialog Box ............................................................................................. 8-6
Figure 8-7: Running Strategy Showing Network Messages ................................................................................................... 8-6
Figure 8-8: Network Configuration Dialog Box for Windows 98/95 ........................................................................................ 8-7
Figure 8-9:Windows Select Network Component Type Configuration Dialog Box ................................................................. 8-8
Figure 8-10: Windows Select Network Adapters Configuration Dialog Box ........................................................................... 8-8
Figure 8-11: Select Network Component Type Configuration Dialog Box .............................................................................. 8-8
Figure 8-12: Windows Select Network Protocol Configuration Dialog Box ............................................................................ 8-9
Figure 8-13: TCP/IP Properties Configuration Dialog for Windows 98/95 ............................................................................. 8-9
Figure 8-14: Network Adapter Listing Dialog Box ................................................................................................................. 8-10
Figure 8-15: Select Network Adapter Configuration Dialog Box ........................................................................................... 8-11
Figure 8-16: Network Protocols Listing Dialog Box ............................................................................................................... 8-11
Figure 8-17: Network Protocol Configuration Dialog Box ..................................................................................................... 8-12
Figure 8-18: TCP/IP Properties Configuration Dialog Box ................................................................................................... 8-12
Figure 9-1: GeniDAQ Runtime Environment .......................................................................................................................... 9-3
Figure 9-2: Runtime Preference Configuration Dialog Box .................................................................................................... 9-4
Figure 9-3: Event Log Viewer/Alarm Acknowledgment dialog box ......................................................................................... 9-5
Figure 9-4: Invoke Event Log option ....................................................................................................................................... 9-5
Figure 9-5: Login User ID and Password ................................................................................................................................ 9-6
Figure 9-6: Password Configuration Dialog Box ..................................................................................................................... 9-7
Figure 9-7: Users Administration Configuration Dialog Box ................................................................................................... 9-8
Figure 9-8: Change Password Configuration Dialog Box ....................................................................................................... 9-8
xx
Figure 9-9: Runtime Preference Configuration Dialog Box .................................................................................................... 9-9
Figure 9-10: Login Dialog Box ................................................................................................................................................. 9-9
Figure 9-11: GeniDAQ Screen Keypad ................................................................................................................................. 9-10
Figure 10-1: Adding Comments to Script .............................................................................................................................. 10-8
Figure 10-2: Breaking a Statement Across Multiple Lines ................................................................................................... 10-9
Figure 10-3: Checking a Script’s Syntax ............................................................................................................................... 10-9
Figure 10-4: Using the BasicScript Debugger .................................................................................................................... 10-11
Figure 10-5: Tracing a Script Statement ............................................................................................................................. 10-12
Figure 10-6: Setting and Removing Breakpoints ................................................................................................................ 10-13
Figure 10-7: Add a watch variable ...................................................................................................................................... 10-16
Figure 10-8: Main Script Program ....................................................................................................................................... 10-19
Figure 10-9: Pre-task Script Editor ...................................................................................................................................... 10-20
Figure 10-10: Post-task Script Editor .................................................................................................................................. 10-20
Figure 10-11: BasicScript Block Editor ............................................................................................................................... 10-21
Figure 11-1: Data Center Programming Interface ................................................................................................................. 11-2
Figure 11-2: Data Center Data Structure ............................................................................................................................... 11-3
Figure 11-3: The Tags Created By GeniDAQ ......................................................................................................................... 11-4
Figure 11-4: Create a New VB Project ................................................................................................................................... 11-8
Figure 11-5: Name Your Project GoleDB ............................................................................................................................... 11-8
Figure 11-6: Design Your Form .............................................................................................................................................. 11-9
Figure 11-7: Running the Example Program ........................................................................................................................ 11-11
Figure 12-1: Select Windows CE and the screen size in the New Strategy Dialog Box ...................................................... 12-6
Figure 12-2: Save Your Strategy File with a *.gce File Extension ........................................................................................ 12-6
Figure C-1: Creating a New Device from the Main Menu ....................................................................................................... C-4
Figure C-2: Creating a New Device from the New Device Toolbar Icon ................................................................................ C-4
Figure C-3: Device Properties Configuration Dialog Box ....................................................................................................... C-5
Figure C-4: Type the Group Name in the Group Dialog Box .................................................................................................. C-5
Figure C-5: New Tag Pop-Up Context Menu ........................................................................................................................... C-6
Figure C-6: Tag Properties Configuration Dialog Box ............................................................................................................. C-6
Figure C-7: Real-time Value of the Analog Input Channel ..................................................................................................... C-7
Figure C-8: ADAM OPC Server Tool Tree Browser ................................................................................................................ C-8
Figure C-9: ADAM OPC Server’s File Menu ......................................................................................................................... C-10
Figure C-10: ADAM OPC Server’s Add Menu ...................................................................................................................... C-11
Figure C-11: ADAM OPC Server Edit Menu ......................................................................................................................... C-12
Figure C-12: ADAM OPC Server Help Menu ........................................................................................................................ C-13
Figure C-13: Device Properties Configuration Window ........................................................................................................ C-14
Figure C-14: Ground Name Configuration Dialog Box ......................................................................................................... C-15
Figure C-15: Tag Properties Configuration Dialog Box ......................................................................................................... C-16
Figure C-16: Tag Process Settings Configuration Dialog Box .............................................................................................. C-18
Figure C-17: OPC Client ....................................................................................................................................................... C-19
Figure C-18: Starting the OPC Client .................................................................................................................................... C-21
Figure C-19: Adding an OPC Server ..................................................................................................................................... C-21
Figure C-20: Connecting the OPC Client to the ADAM OPC Server ................................................................................... C-22
Figure C-21: Adding a Group for the OPC Server Connected to the OPC Client ................................................................ C-22
Figure C-22: Add Item Dialog Box ........................................................................................................................................ C-23
Figure C-23: Add Item Configuration Dialog Window ........................................................................................................... C-24
Figure C-24: Selecting the Read/Write Menu Item ............................................................................................................... C-25
Figure C-25: Read/Write Item Value Dialog Box .................................................................................................................. C-25
Figure C-26: Read/Write Item Value Dialog Box .................................................................................................................. C-26
Figure D-1: Port Properties Configuration Dialog Box ............................................................................................................ D-4
Figure D-2: Select Add | New Device From the Main Menu ................................................................................................... D-5
Figure D-3: Click the New Device Icon on the Toolbar ........................................................................................................... D-5
Figure D-4: Device Properties Configuration Dialog Box ....................................................................................................... D-5
Figure D-5: Group Dialog Box Configuration Window ............................................................................................................ D-6
Figure D-6: Tag Properties Configuration Dialog Box ............................................................................................................. D-6
Figure D-7: OPC Server Dialog Window ................................................................................................................................. D-7
Figure D-8: Tool Tree Browser Window .................................................................................................................................. D-8
Figure D-9: File Menu Items .................................................................................................................................................. D-10
Figure D-10: The Add Menu .................................................................................................................................................. D-11
Figure D-11: The Edit Menu .................................................................................................................................................. D-12
Figure D-12: The Help Menu ................................................................................................................................................. D-12
Figure D-13: Device Properties Configuration Window ........................................................................................................ D-14
Figure D-14: Group Configuration Dialog Box ...................................................................................................................... D-15
xxi
Figure D-15: Tag Properties Configuration Dialog Box ......................................................................................................... D-16
Figure D-16: Type of I/O Tags and Base Address ................................................................................................................ D-17
Figure D-17: Data Types and Their Description ................................................................................................................... D-17
Figure D-18: Tag Process Settings ....................................................................................................................................... D-18
Figure D-19: OPC Client Browser Window ........................................................................................................................... D-19
Figure D-20: Advantech OPC Client Icon ............................................................................................................................. D-20
Figure D-21: OPC Server Browser Window .......................................................................................................................... D-21
Figure D-22: Add Server Dialog Box ..................................................................................................................................... D-21
Figure D-23: Adding a Group in the Advantech OPC Browser Window .............................................................................. D-22
Figure D-24: Adding an Item in the Advantech OPC Browser Window ............................................................................... D-22
Figure D-25: Add Item Dialog Box ........................................................................................................................................ D-23
Figure D-26: Selecting Read/Write from the OPC Browser Window ................................................................................... D-24
Figure D-27: Read/Write Item Value Dialog Window ............................................................................................................ D-24
Figure D-28: Read/Write Item Value Dialog Window ............................................................................................................ D-24
xxii
1
Introduction
Overview
Congratulations on your purchase of Advantech’s application builder for developing human machine
interfaces — Advantech GeniDAQ.
Advantech GeniDAQ is a comprehensive, flexible data acquisition application environment, that
supports the functions and utilities to develop all types of automation applications in the Windows NT,
Windows 98/95 and Windows CE environment. GeniDAQ provides an icon-based, mouse driven
system for designing real-time Automation and Control Strategies, System Monitor Displays, and
Dynamic Operator Displays.
The package is extremely flexible and easy to use. A library of icon blocks representing data acquisition
and control, industry standard mathematical and control functions is provided to you through the Task
Designer. You simply arrange icon blocks into a strategy, connect them, and then draw your Dynamic
Display. Display Designer provides lots of graphic objects to design monitoring and control pictures. In
addition to being easy to use, GeniDAQ built-in BasicScript programming tools to strengthen the ability
to design complex calculation or analysis.
In addition, Advantech GeniDAQ leverages 32-bit Windows’ preemptive multi-tasking capability to
support Windows NT, 98/95, and Windows CE environments. The GeniDAQ kernel is a multi-threaded
engine for optimal performance. It provides you a secure industrial and real-time environment for your
applications.
Advantech GeniDAQ also provides an open development environment. You can easily communicate
with other applications through DDE, OLE Automation, and TCP/IP networking. For database connectivity, there are embedded ODBC functions for SQL access to a wide range of databases. GeniDAQ’s
open architecture design ensures that you can integrate your process data into existing enterprise
information systems throughout your company. Moreover, GeniDAQ leverages the industry’s OPC
standard to provide plug-and-play connectivity with your devices, including programmable logic
controllers (PLCs).
Advantech GeniDAQ supports different sized HMI models, from 5.7" inch to 15" inch, and different
operating systems from Windows NT, 98/95 to Windows CE. GeniDAQ is all you need to build your
front panel. It saves a lot of effort and time when developing your applications.
For convenience, Advantech GeniDAQ is used interchangeably with GeniDAQ throughout this manual.
Contents
•
System architecture
•
What’s new in Advantech GeniDAQ 4.0
•
Installation
•
How does GeniDAQ work
•
Quick Start to GeniDAQ
•
Compatibility and Upgrade Information
•
Summary
System Architecture
We designed GeniDAQ with a multi-threaded, modular-oriented, and open integrated architecture. The
open platform allows you to easily integrate GeniDAQ with other applications to share real-time control
1-2
data. The performance and number of I/O blocks GeniDAQ can support are increased significantly
through this new architecture. The new architecture is outlined in Figure 1-1.
Strategy
File
(*.GNI)
GeniDAQ
Builder/ Runtime
OPC & I/O Driver
Data Center
Custom
Application
(VB, Delphi,VC)
BasicScript
Engine
TCP/IP
Network
Devices
Ethernet
Figure 1-1: GeniDAQ System Architecture
Module Description
GeniDAQ Builder
GeniDAQ Builder is application development software that allows users to create their HMI applications. The development environment includes task, display and script configuration. It also provides
running mode for verifying the configuration. GeniDAQ Builder provides an intuitive object-based
graphical user interface (GUI) that simplifies control strategy and display setup. You simply select icon
blocks from the toolbox, connect them, configure the parameters, and draw your dynamic display
without any programming.
GeniDAQ Runtime
GeniDAQ Runtime provides runtime execution environment for GeniDAQ application. It doesn’t allow
any change to be made to the application.
BasicScript Engine
The BasicScript engine is a set of DLLs that facilitates the compilation of script source at build-time
and execution of scripts at runtime. Based on the world’s most popular macro language, Microsoft
Visual Basic for Applications, over 600 commands are available to perform any function you can
imagine, including calculations, reading and writing files, DDE and ODBC. It also allows you to access
and share data with other applications, such as Microsoft Access and Microsoft Excel.
Introduction
1-3
OPC (OLE for Process Control) Client
This is responsible for connecting OPC-enabled devices. Through the standard and high performance
driver interface, GeniDAQ can easily integrate your systems.
TCP/IP Network
This is responsible for communication with multiple GeniDAQ nodes. GeniDAQ’s networking capability allows a computer in the control room to display data being collected by computers on the factory
floor, or vice versa, through the TCP/IP protocol.
Data Center
Data Center is the central repository for data acquisition and control data. It manages all of GeniDAQ’s
real-time data and provides two sets of interfaces to the outside world; DDE and OLE Automation.
Through these two interfaces, other applications can retrieve or input data to GeniDAQ.
I/O Driver
This is responsible for accessing real-time data from hardware. GeniDAQ I/O drivers covers all of
Advantech’s industrial automation hardware, including plug-in DA&C cards, PC-based modular
controller MIC-2000, ADAM-4000 remote I/O modules and ADAM-5000 distributed I/O modules.
What’s New in Advantech GeniDAQ 4.0
GeniDAQ 4.0 includes the following new features:
Multi-threaded Engine
GeniDAQ takes maximum advantage of Windows’ multi-tasking capabilities to enhance your system
performance. It speeds up the task scanning by separating time-consuming display drawing from I/O
scanning and raising the scan priority of tasks, no matter how complex your display is. In addition, it
provides parallel scan for each task. It results in more efficient task scanning for independent I/O, such
as COM port devices with long response times. Moreover, because of independent task scanning, it will
not affect the system safety if one task fails. You can also prioritize your tasks to meet time-critical
operation and optimize your system performance. Finally, its multitasking design will not block off the
task scanning or display update when operating your user interface, such as holding on the window. All
of these provide you a secure and real-time industrial environment for your applications. Please refer to
the Task Designer chapter for the details.
OPC Client Support
In your plant or system, there may already be some devices in addition to Advantech I/O cards.
GeniDAQ leverages the industry-standard OPC architecture to provide plug-and-play connectivity with
your devices, such as programmable logic controllers (PLCs). Most major PLC vendors provide the
OPC servers for their hardware. With OPC, you can easily create a data acquisition application that
covers your equipment, not just Advantech devices. GeniDAQ seamlessly integrates OPC client
function in I/O blocks. It allows you to browse the pre-defined tags in the OPC server, and you only
need to click on the item that you want to access. Please refer to Chapter 5, Connecting Your Devices
for the details.
1-4
TCP/IP Networking Capability
GeniDAQ’s networking capability allows a computer in the control room to display data being collected by computers on the factory floor, or vice versa. This means that data and field processes can be
viewed or monitored in real-time from anywhere on your network. GeniDAQ implements a network
system that supports peer-to-peer communication using the TCP/IP protocol. It allows networking
status to be logged and viewed for network monitoring and maintenance. In addition, it also provides
browsing functions to configure remote tags for network input blocks. Please refer to Chapter 8,
Communicating Through TCP/IP Networking.
Supports Different Sized HMI Models
GeniDAQ allows you to build your front panel interface for different sizes of HMI models from 5.7
inch to 15 inch. You can develop your application on Windows NT or Windows98/95, and then run it
on these operating systems or Windows CE. With GeniDAQ, you don’t have to buy and learn different
application software packages for different models. It significantly reduces your development effort and
cost.
New Hardware Support
GeniDAQ is based the 32-bit DLL driver to support Advantech data acquisition and control hardware.
Now GeniDAQ supports Advantech PCI-bus data acquisition and control cards. You can also use our
OPC servers to link ADAM-5000/CAN I/O modules.
Enhanced Historical Trend
GeniDAQ now can support up to 99 historical trending display objects. The historical trending display
object also allows you to go to a specific time and search for a specific value. Other enhancement
includes the automatic scrolling during startup, button tooltips for easy operation, and more intuitive
historical data conversion. Please refer to Chapter 6, Historical Trending System for the details.
Enhanced Virtual Tag with Multiple Data Type Support
GeniDAQ now supports STRING, LONG, and FLOATING POINT data types for virtual tags. It is
more flexible to use the virtual tag to keep your data. It allows you to create customized tags and store
them in the data center, and then share them with different tasks, and other applications.
Enhanced Save and Restore Functions
In the past, GeniDAQ provided save and restore functions for control objects, including knob, numeric
control, slider, button and conditional button. Now this function also supports analog output and digital
output blocks. It allows you to save the output values when the system stops and then restore the values
to initialize the hardware the next time the system starts.
Security Strategy File
GeniDAQ now provides security protection for your strategy file. You can distribute your application
with safety.
User Interface Enhancements
GeniDAQ provide a lot of user interface enhancements, including scrollable display windows for large
Introduction
1-5
displays, a dockable toolbox to customize your working style, new menu bar icons for quick configuration and icon tooltips for easy operation. The new user interface enhancements increase your productivity.
Porting Device Configuration to Another Machine
GeniDAQ now allows you to port the device configuration from one machine to another machine. It
saves your time by being able to avoid reconfiguring the devices on another machine. You must first
export the device configuration from the registry to a *.reg file on one machine. You can then import
the device configuration from the *.reg file to the Windows registry on another machine. Please refer to
Chapter 5, Connecting your Devices for the details.
Project Management
GeniDAQ now utilizes project concepts to design your strategies. It allows you to manage and maintain
your project more easily. GeniDAQ creates a new directory when you create a new strategy. All files
including strategy files, historical data files, exported device configuration files (*.reg) and log files
exist in the directory.
New Basic Script Commands
GeniDAQ adds a few new Basic Script commands, including data lock function for multi-threaded
protection, overrun message disabling, and querying network status functions. Please refer to Chapter
10, Advanced BasicScript Programming for Your Specific Needs for the details.
System Control Block and Event Log Display Item for Version 4.1
GeniDAQ version 4.1 supports two new items: System Control block and Event Log Display item.
OPC Servers for GeniDAQ Version 4.1
GeniDAQ version 4.1 includes two OPC servers, ADAM OPC and ModBus OPC. Please refer to
Appendix C and D for further information.
Installation
System Requirements
1-6
•
OS: Microsoft Windows 98/95, Windows NT 4.0 (SP4 above) or Windows CE (Runtime only)
•
RAM: 64 MB memory (minimum)
•
Disk space: 20 MB (minimum)
•
CPU: Intel Pentium processor 200 MHz or higher
•
Display: VGA resolution or higher
•
Microsoft-compatible mouse
•
Parallel port for software key
Installing Advantech GeniDAQ
GeniDAQ ships with an installation program that helps you install the program to your computer.
Installation can normally be completed within five minutes.
1. Run the GeniDAQ installation program at:
d:\Disk1\setup.exe
where “d” is the drive letter of your CD-ROM drive. The installation program will load and display the
GeniDAQ splash screen.
Figure 1-2: GeniDAQ Installation Program Splash Screen
2. The Welcome screen loads. Click the Next button.
Figure 1-3: GeniDAQ Installation Welcome Screen
Introduction
1-7
3. The Information screen loads. This document contains important information about GeniDAQ that
might not appear in the manual and/or online help system. Read the document and then click the
Next button to advance.
Figure 1-4: GeniDAQ Installation Information Screen
4. The User Information screen loads. Enter your name and company name.
1-8
Figure 1-5: Installation Program Information Screen
5. Select a location where you want to install the GeniDAQ software in the Choose Destination
Location window. The default location is:
C:\Program Files\Advantech\GeniDAQ
6. If you want to select a different path on your computer, click the Browse button. Click the Next
button to advance.
Introduction
1-9
Figure 1-6: Choose Destination Location Dialog Box
7. You can install either the Full version of the program that includes the Runtime and Development
modules or just install the Runtime (Compact) version that only includes the Runtime module.
Enable the radio button of the version that you want to install.
1-10
Figure 1-7: Choose to Install the Full or Compact Versions of the Program
8. The installation program will create program shortcuts on your Windows Start menu so that you can
easily launch the program. The default program folder is:
Advantech GeniDAQ 4.0
If you want to have the shortcuts made in a different folder, type it or select it in the Select
Program Folder dialog box.
Introduction
1-11
Figure 1-8: Select Program Folder Dialog Box
9. The program will start copying the program files to your computer.
Figure 1-9: Copying Program Files to Computer
1-12
10. A message box prompts if you want to set up the shortcuts on the Start menu.
Figure 1-10: Click Yes to Install the Program Shortcuts
11. A copy of the GeniDAQ manual is copied to your computer and a shortcut is set up in the Advantech GeniDAQ 4.0 folder on your Windows Start menu. The manual is in Adobe Acrobat format - if
you want to install the free Adobe Acrobat Reader software, click the Yes button in the dialog box.
Figure 1-11: Click Yes to Install Adobe Acrobat Reader
Introduction
1-13
12. If the DCOM98 components are not already installed on your computer, the installation program
prompts if you want to install them. Answer Yes to the message box.
Figure 1-12: Click Yes to Install the DCOM98 Components
Meanwhile, it will install OPC servers.
13. GeniDAQ is now installed on the computer; however, you must restart the computer before you can
start using the program. If you want to immediately restart the computer, select the Yes radio button,
otherwise click No. Click the Finish button.
Figure 1-13: Setup Complete Dialog Box
1-14
Note:
To run the GeniDAQ program, you first have to install the latest DLL drivers. The
DLL drivers are bundled within the installation CD-ROM. If you have not installed
the DLL drivers on your system or the version you installed is less than this one, the
installation program will start driver installation automatically.
Note:
For Advantech GeniDAQ CE Runtime installation, please refer to Chapter 12,
Advantech GeniDAQ CE WinCE for HMI-640S Platform.
Inserting the Anti-Piracy Hardware Key (Dongle)
In order to prevent software piracy and minimize costs for our customers, GeniDAQ employs an antipiracy parallel port key (or “dongle”). After installing the software, you must must insert the hardware
key into your computer’s parallel (i.e., printer) port before attempting to start the software. The software program checks for the presence of the dongle during start up, and will immediately close if it
does not detect its presence.
If you do not insert the key, you have the option to start a two-hour trial period when the software will
function without the key.
Dongle
A dongle is required to run GeniDAQ. If not installed with the dongle, GeniDAQ can only run in demo
mode for a limit of two hours. Follow the instructions below to install the key:
1. Power off the computer and all peripheral devices prior to installing the key, since it is sensitive to
static electricity.
2. Remove any connections to your computer’s parallel port.
3. Secure the dongle in the parallel port and tighten the screws.
Note:
Do not remove the Advantech GeniDAQ dongle while Advantech GeniDAQ is
running. If you do so, Advantech GeniDAQ must be restarted and dongle may be
damaged.
Versions of the Dongle
Advantech GeniDAQ provides four kinds of software keys: Development key for Development edition,
Runtime key for Runtime edition and Upgrade key for Upgrade edition and CE Development key for
CE Development edition. For the Upgrade edition, you still need to enter the serial number of the old
version when you run Advantech GeniDAQ for the first time.
Introduction
1-15
Uninstalling Advantech GeniDAQ
1. Select Settings | Control Panel from the Windows Start menu and then double-click the the Add/
Remove Programs icon.
2. Select the item Advantech GeniDAQ Version 4.0 and then click the Add/Remove… button.
3. Click the Yes button in the Confirm File Deletion dialog box.
4. The uninstallation program removes the program files and registry entries from your computer.
Click the OK button when the uninstallation program finishes.
Figure 1-14: Removing GeniDAQ From the Computer
1-16
Start Menu Shortcuts
The GeniDAQ installation program creates the following program shortcuts on the computer’s Start
menu.
Figure 1-15: GeniDAQ Start Menu Shortcuts
The links are the following:
•
Device Installation: Install the drivers that enable Advantech hardware
•
GeniDAQ Builder: Create GeniDAQ tasks and displays
•
GeniDAQ Runtime: Run your GeniDAQ tasks and displays
•
Release Notes: View information about the software release, including last-minute program issues
that might not appear in the manual or online help system
•
User’s Guide: View on-line GeniDAQ user’s guide manual. It is written by Acrobat Reader 4.0.
•
GeniDAQ Help: View a help file which can be used to quickly access context-sensitive help for
your operations.
•
BasicScript Help: View a help file which describes the BasicScript function and program syntax.
How Does GeniDAQ Work?
GeniDAQ development system, GeniDAQ Builder includes three different editors: Task Designer,
Display Designer and Script Designer. They are used to edit Tasks, Displays and Main Script respectively. Because there can be multiple tasks in one strategy, you can create multiple Task Designer
windows inside GeniDAQ. For the same reason, you can create multiple Display Designer windows for
editing multiple displays. In any application there can be only one main script. Therefore, only one
Script Designer window can be opened. GeniDAQ can have many other types of script, which will be
described in Chapter 10, Advanced BasicScript Programming For Your Specific Needs.
A task is a collection of icon blocks. A display is a collection of display items. Icon blocks and display
items are the building blocks of a strategy. You can see them as similar objects, except that display
items have a graphic representation (provide some kind of GUI) when running while icon blocks do
not. They are connected to each other by connection wires or invisible links. The connections between
icon blocks are visible in the Task Designer window. The links are referred to as “wires” because of
their appearance. The connection between an icon block and a display item, or one display item and
another, is not visible. Hence, these are referred to as “Links”.
Each task and display has its own properties. When first created, default properties are assigned to the
new task or new display. Users can change properties according to their needs. A task has properties
Introduction
1-17
such as scan period, sample rate, starting method and stopping method. A display has properties such as
display name, visibility, etc.
Any number of blocks and I/O devices can be used at one time, limited only by your system’s speed
and memory. It is suggested that the number of software icon blocks not exceeded 1024 and I/O blocks
not exceeded 512. Otherwise, system performance may be adversely affected. From small applications
interfacing only a few blocks, through full-scale industrial process control systems running many I/O
Devices simultaneously, GeniDAQ provides you with the quickest and most efficient HMI solution.
The following overviews the basic concepts and editing tools for developing your applications with
GeniDAQ.
Project
GeniDAQ utilizes project concept to design your strategies. It allows you to manage and maintain your
project more easily. GeniDAQ creates a new directory when you create a new strategy. All files
including strategy file, historical data files, exported device configuration file (*.reg), and log files exist
in the directory.
Strategy
The design work in GeniDAQ is saved as a strategy file. A strategy file (with extension .GNI) is a
binary file that stores all information about an editing session. A strategy is defined as one or more
“tasks” together with one or more “displays” and one or no “main script”. “Task”, “Display”, and
“Main Script” are the three primary elements used to design strategies. To protect your design work,
GeniDAQ provides security protection for your strategy file. You can distribute your application with
safety.
Task Designer
The Task Designer is to configure the task functions, such as I/O function, DDE function, calculation
function, file function, etc…These functions are represented as function blocks or icons. GeniDAQ uses
a data flow programming model to describe your task and control strategy. You intuitively construct
and connect the function block icons to build your system. In addition, GeniDAQ features block
sequence arrangement functions that determine the order of execution of blocks in a task. Users can
change the execution order of the blocks according to the needs of the system.
GeniDAQ development environment allows you to decompose your system into several smaller
modules or tasks. The modular design is very useful to develop and maintain a large and complicated
system more easily. Each modular or task has its own properties, such as scan rate, start/stop method,
and priority etc. With 32-bit Windows’ multi-tasking capability, all tasks are running simultaneously at
run time. Moreover, GeniDAQ allows you to prioritize your tasks to increase overall performance.
Display Designer
The Display Designer is to configure the display view or operator interface. GeniDAQ provides a wide
variety of graphical wizards, allowing users to quickly create an intuitive user interface. The built-in
display objects include bar graph, button, indicator, real-time trending, historical trending, knob, analog
meter, slider, imported bitmap, numeric display and control. The historical trending display allows you
to scroll backward/forward, go to a specific time, search a specific value, and convert historical data to
a text file.
In addition, GeniDAQ also provide graphic tools to draw rectangles, circles, segments, and polygons.
1-18
These objects or cells can be link to a tag value. They can change color according to the tag value. They
can also be grouped together to make a single object. You can use them to draw pumps, valves or other
industrial symbols.
Script Designer
The Script Designer is essentially a text editor for editing script code. Based on the world’s most
popular macro language, Microsoft Visual Basic for Applications, GeniDAQ integrates a powerful
programming tool BasicScript, helping you to develop complex applications. Over 600 commands are
available to perform any function you can image, including calculations, reading and writing files, DDE
and ODBC. It also allows you to access and share data with other applications, such as Microsoft
Access and Microsoft Excel. With the scripting language, it allows you to reuse existing code and build
your applications more faster and easier.
The Script Designer supports the cut, copy and paste functions, just like the Visual Basic development
environment. It also provides debugging capabilities including the ability to step and trace code, set
break points and debug variables, structures and arrays. In addition, the script source will be compiled
into p-code so it will not need to be compiled again at run-time.
Multi-threaded Runtime Engine
GeniDAQ takes maximum advantage of Windows’ multi-tasking capabilities to enhance system
performance. It speeds up the task scanning by separating time-consuming display drawing from I/O
scanning and raising the scan priority of task, no matter how complex your display is. In addition, it
provides parallel scan for each task. It results in more efficient task scan for independent I/O, such as
COM port devices with long response time. Moreover, because of independent task scanning, it will not
affect the system safety if one task is failed. You can also prioritize your tasks to meet time-critical
operation. Finally, as multitasking design, it will not block off the task scanning or display update at
operating your user interface. All of these provide you the industrial secure and real-time environment
for your applications.
There are three kinds of scheduling timer during GeniDAQ runtime execution. The first one is the I/O
polling time. It is different for internal I/O drivers and OPC servers. For internal I/O drivers, the polling
time is based on the task’s scan time. On the other hand, the polling time for OPC servers is the update
rate configured in the OPC settings of the task property. The second one is the task’s scan time that
represents the time interval between the scans of a task. Each scan will update all blocks in a task. Each
task has its own scan time that is configured in the task property. The last one is the screen’s refresh
period configured in the Runtime Preference under Setup menu. The display update is based on the
refresh period. However, it only updates the display items with input changed. Because of the multitasking characteristics, all of the scheduling timers are executed independently and simultaneously. The
relationship between these scheduling timers is shown below.
Quick Start to GeniDAQ
As a quick introduction to using GeniDAQ, complete the following procedure to run one of the
demonstration strategies that was copied to your computer’s hard disk drive during the software
installation.
1. Launch the Device Installation Utility by selecting Add | Devices from the main menu. Alternatively you can click the Add Devices toolbar icon which is available in both the Task Designer and
Display Designer.
Introduction
1-19
Add Devices Toolbar Icon
Figure 1-16: The Add Devices Toolbar Icon
2. The Advantech IO Device Installation windows loads:
Figure 1-17: Device Installation Utility Main Screen
1-20
The Installed Devices pane displays the Advantech hardware that is currently set up to run on your
computer. The List of Devices pane shows Advantech hardware for which the drivers can be installed to
enable their use.
3. Highlight the Advantech DEMO Board entry in the List of Devices pane and click the Add… button.
A configuration dialog box is displayed to configure the device that you are adding.
Figure 1-18: Device Configuration Dialog Box
4. Use the default value and press the OK button. You will see a new entry in the Installed Devices
list.
Figure 1-19: I/O Device Installation Dialog Box Showing New Device
5. If you want to test the device that you have just installed, click the device entry in the Installed
Devices pane and then click the Test… button.
6. Click the Close button and exit the Device Installation Utility.
Introduction
1-21
7. Select Programs | Advantech GeniDAQ 4.0 | GeniDAQ Builder from your Windows Start menu.
8. The GeniDAQ Builder application opens. Select File | Open from the GeniDAQ Builder’s main
menu.
9. Select \Strategy\Alarm\alarm.gni from the folder where you installed the GeniDAQ program.
Figure 1-20: Open the Alarm.gni Strategy
10. The strategy loads and you will see the strategy’s blocks on the Task Designer configuration
window.
11. Click the Run menu command to run the strategy file.
1-22
Figure 1-21: Running Alarm.gni
Compatibility and Upgrade Information
This version allows users to load the old strategy files and save them into the new format. However,
since this version supports multi-tasking operating system that is very different from the previous one,
it can not guarantee that the previous strategy file will run normally in this version, especially for the
strategies with multiple tasks. Also this version removes the function blocks, including user programming block, user-defined DLL icon, network output block, and report designer. After you save the old
strategy files into the new format, these blocks or functions will be discarded.
Summary
The GeniDAQ application software combines icon-based graphical development and the flexibility of a
powerful programming tool, BasicScript. With GeniDAQ, you can easily develop both simple and
complex applications. Types of applications include process and utility monitoring, data acquisition and
control, factory automation, and test and measurement.
GeniDAQ is a multi-threaded, modular-oriented, and open integrated architecture. The multi-threaded
engine provides you the industrial secure and real-time environment for your applications. The modular-oriented design simplifies the development for a complex application. The open platform allows you
to easily integrate GeniDAQ with other applications and devices to share real-time control data.
Introduction
1-23
1-24
2
Tutorial
Overview
In general, the design procedure consists of the following steps. The first step is to outline exactly what
you expect to accomplish with GeniDAQ. You can decompose your system into several modules and
determine how many tasks you want in your strategy. The second one is to make a sketch detailing the
flow of data, timing, and so forth. Then implement the system or task functionality and configure your
display view or operator interface with GeniDAQ’s Task Designer and Display Designer. If your
system needs some specific functionality, such as special mathematical or calculation function, logic
operation, task or display control, or link with other applications, which are not built into GeniDAQ,
you can make use of GeniDAQ’s BasicScript programming to implement them. The last step is to
optimize the overall performance by tuning the task scanning, display update and I/O polling.
The intent of this chapter is to provide some general instructions and guidelines for performing basic
Advantech GeniDAQ operations. Throughout this chapter it is assumed that you can understand the
fundamentals of GeniDAQ. It is assumed that the Advantech GeniDAQ software has been successfully
installed. If the Advantech GeniDAQ software has not been installed, install it now. The installation
procedure is provided in Chapter 1: Introduction. It is also assumed the Demo board has been installed.
If not, install it now. The installation procedure is provided in Chapter 1, Introduction.
Contents
•
Working with Advantech GeniDAQ
•
GeniDAQ Tutorials
•
Summary
Working with GeniDAQ
The sections that follow describe how to use some of the basic functions in the GeniDAQ Task Designer, Display Designer, Report Designer, and Script Designer. This chapter does not provide detailed
instructions for all GeniDAQ functions. Specific instructions for the various GeniDAQ functions are
provided in the following chapters.
Before You Begin
You use a mouse to construct strategies and operator display panels within the Task and Display
Designers. The ability to work with a mouse while developing your process strategies and corresponding displays helps make using GeniDAQ intuitive.
Mouse support has been extended to the Runtime system. This allows operators to use a mouse or other
pointing device, such as a trackball, touchscreen, etc., to interface with the process. The following terms
are used throughout the manual.
Pointing
Positioning the cursor on an icon block, object, field, etc., on the screen by moving the mouse. The
mouse is often referred to as the pointing device since it allows you to indicate graphically where you
want to work.
2-2
Clicking or Double-Clicking
Positioning the cursor on an icon block, object, field, filename, etc., then pressing and releasing the left
mouse button quickly. Double-clicking is to press the left mouse button twice in quick succession. This
simultaneously selects and performs a field-associated operation.
Selecting
Pointing to something on the screen and clicking on it. Selecting a Block in the Task Designer or
Display Item in the Display Designer causes square selection dots to form around the perimeter of the
selected object. The dots remain (object selected) until another operation is performed.
Dragging
Holding the left mouse button down while you move the mouse, then finally releasing the button. As
you move the mouse across your desk, the respective item moves across the screen and stops when you
release the mouse button.
Planning Your Strategy
Before you begin using GeniDAQ to construct your strategy and corresponding operator display panels
you should outline exactly what you expect to accomplish with the strategy. Make a sketch detailing the
flow of data, timing, and so forth. This may save you valuable re-work time later in your project.
Starting GeniDAQ
After the GeniDAQ software and the desired I/O Device Drivers have been successfully installed, you
are ready to start using GeniDAQ. The first step in using GeniDAQ is to develope a strategy from
within GeniDAQ Task Designer.
To begin working with GeniDAQ, you must first boot with Windows 95/98 or Windows NT, enter the
Advantech GeniDAQ program group and double-click on the GeniDAQ Builder icon. The GeniDAQ
software loads, and you should see a pop-up window to introduce GeniDAQ and its version. After
several seconds, the pop-up window disappears and a blank GeniDAQ main window opens.
Tutorial
2-3
Figure 2-1: GeniDAQ information
Using On-Line Help
You can get Help while using GeniDAQ by choosing a command from the Task Designer Help menu
or by pressing F1. GeniDAQ also includes a Help button in each dialog box, so that you may access
context-sensitive help on a specific topic.
To access Help from GeniDAQ:
1. From the Help menu in the Task Designer, choose a Help command.
2. Or press F1 while using GeniDAQ.
3. Or choose the Help button in a dialog box.
A Help window appears. The topic that is displayed depends on which Help command you chose, what
was selected when you pressed F1, or which dialog box you were using when you chose the Help
button. The Help Contents for GeniDAQ appear when you enter Help using the menu item labeled
Index. Within GeniDAQ, a Help topic on the selected command or dialog box appears when you use
the Help Button within the current dialog box.
Building Your Strategy
Before you can use GeniDAQ to run a process strategy interactively with its corresponding operator
displays in real time, you must first develop a strategy and design the corresponding operator panel(s).
GeniDAQ Task Designer and Display Designer are used to accomplish these tasks.
After entering the GeniDAQ program, a new strategy file can be designed (invoked first because the
process strategy is the basis of your process control/monitoring). Select New form the File menu bar in
the Advantech GeniDAQ Main window. You will see a Task Designer window entitled “Task Designer - TASK1” and a Display Designer window entitled “Display Designer - DISP1” on your screen.
2-4
Figure 2-2: New strategy file
You start GeniDAQ by double clicking the GeniDAQ Builder icon in the GeniDAQ program group or
executing GENIDAQ.EXE in the command line. A blank window will be displayed within the
GeniDAQ main window. This is the beginning of developing a strategy. If you click symbol in the
Main window, Task Designer and Display Designer will be activated and appear in the upper part of the
Main window. You can activate Script Designer by clicking on File, Add/Delete, Add Main Script
option of the Main window.
GeniDAQ Tutorials
In order to help you become familiar with GeniDAQ quickly, we provide nine tutorial programs located
in the GeniDAQ\Strategy directory. All example strategies use the Advantech DEMO I/O=1H device
that is included with GeniDAQ, allowing you to run the demonstration programs without additional
hardware.
The following is a step-by-step tutorial on how to use the demonstration strategies, as well as how to
design strategies within GeniDAQ. It is designed with the beginner in mind. If you follow the tutorial,
you should not encounter problems. The first demonstration, “TUTOR1.GNI” will be fully explained.
Following examples will be more concise and use the understanding gained in the first demonstration as
building blocks.
Tutorial 1: One Task with Display
Purpose
The purpose of this tutorial is to demonstrate how to work with GeniDAQ. In this tutorial, we will show
you the easy way to use GeniDAQ to acquire data and display it with numeric display and trend graphs
in the display window. This tutorial introduces GeniDAQ.
Tutorial
2-5
Function
Use Advantech DEMO I/O device AI block to acquire simulated I/O data and show the data by numeric
value and trend chart in the display window.
Procedure
1. Invoke GeniDAQ by double clicking on the GeniDAQ Builder icon in the GeniDAQ workgroup.
After double clicking, a blank window will be displayed on your screen. Click once on the File
menu to pull down the menu, and choose New. After creating a new strategy file, two blank
windows will pop up. One is TASK1 of Task Designer and another is DISP1 of Display Designer.
The new TASK1 window will appear on the front of your screen and TASK block toolbox will be
displayed on the left of TASK1 window. The window should look like Figure 2-3.
2. Choose the AI block from the Task block Toolbox and click on it. AI block will be chosen. Move
the mouse to the working area of the TASK1 window and press the left mouse button. An AI block
will be added to the working area as AI1. This operation is called Drag and Drop
Figure 2-3: Add an AI block
3. Double click on the AI1 block. You will see a dialog box like that shown below:
2-6
Figure 2-4: Configure AI block I/O device
4. In the AI configuration dialog, if the Device: box is empty, click on the downward pointing arrow at
the end of the box and click once on Advantech DEMO I/O:0H. This will configure this analog
input block to use the data from the Advantech DEMO I/O device, which has an I/O address of 0H.
(0 hexadecimal). The channel should be set to 0 to view a sine wave. Now that the AI1 block is
configured, click once on the OK button, which will save the configuration of the block and close
the dialog box, returning you to the task window.
5. After creating an AI block in Task Designer “TASK1” you can change the activated window to
Display Designer “DISP1” by clicking once on the Window menu and pulling the menu down.
Select “Display Designer : DISP1” item to activate Display Designer “DISP1”. A Display item
Toolbox will be displayed on the left of the Display1 window, like the following:
Tutorial
2-7
Figure 2-5: Switch Task and Display
6. Choose the numerical display item from the display item toolbox. The numerical display item will
be in depressed mode. Move your mouse to the working area of DISP1 window and press the left
button of the mouse. A numerical display item is added to the Display1 window, as shown below:
Figure 2-6: Add a numerical display item
7. Double click on the numerical display item. You will see a dialog box appear like the following:
2-8
Figure 2-7: Configure a numeric display item
If the Input from box is empty, click on the Select button once. A pop-up dialog panel will appear to
configure the data input from, like the following:
Figure 2-8: Connect Task and Display
In this pop-up dialog window, you have to choose TASK1 from the Task/Display field and choose AI1
from the TAG field. The channel field will display the default channel number: Output 0. You can
select another channel number from this field. We use Output 0 in this example.
8. Now that the numerical display block is configured, click once on the OK button at the dialog
window to save the configuration.
9. Do the same way as step 6 to add a Trend graph display item at the Display1 window and configure
it to link with the same task block (AI1) and the same channel.
Tutorial
2-9
Figure 2-9: Add a trend graph item
10. Click once on the File menu and choose the Save option from the submenu. A window will pop up
to save your strategy file. The saving operation is the same as any other Windows file saving
operation. Enter the filename tutor1.gni, choose the desired directory, and press the OK button. The
strategy file will be saved to disk.
Figure 2-10: Configure a trend graph item
2-10
Figure 2-11: Save a strategy file
After saving your strategy file, you can run this strategy file immediately. Click on the Run menu and
choose the Task option on the drop down menu. The strategy file will be executed and Numeric Display
item and Trend Graph Display Item will immediately show the current value in the Display window,
like the following:
Figure 2-12: Start to run strategy file
Tutorial
2-11
Figure 2-13: Strategy file execution results
Tutorial 2: Multiple Displays and switching
Purpose
The purpose of this tutorial is to teach you how to design multiple display windows in GeniDAQ and
switch the display window while running.
Function
Use Advantech DEMO I/O device AI block to acquire simulated I/O data and show the data by numeric
value and trend chart in different display windows. Add a menu button on each display window for
switching between windows.
Procedure
1. Refer to Tutorial 1 Step 1.
2. Refer to Tutorial 1 Step 2 to Step 8 to create an AI block at Task1, a Numeric Display item at DISP1
and a trend graph display item at DISP2.
3. Click once on the File menu and choose Add Display from the Add/Delete submenu. “DISP2”
display window will be added at the front of the screen. Create a trend graph display item at DISP2.
4. Choose the Menu Button Control item from display item toolbox at DISP1. Drag the item to DISP1
working area and click the left mouse button to drop it in DISP1.
2-12
Figure 2-14: Add a display window
Follow the same procedures to add a Menu button control item to DISP2.
5. Double click on the menu button control item MENU1 at DISP1. A dialog box will appear to
configure the Menu button. Set the function field in the dialog to be Display Switching and select
the Display Switch field of the dialog to be DISP2. Save the configuration by clicking on the OK
button.
Figure 2-15: Configure display switch to DISP2
6. Follow the same procedures for DISP2, but change the Display Switch field of the dialog window to
be DISP1.
Tutorial
2-13
Figure 2-16: Configure display switch to DISP1
7. Save the strategy file as “TUTOR2.GNI”
8. Run the strategy file by selecting Task from the Run menu. The screen will first show DISP1 on the
screen. DISP1 shows a numerical item value that is updated dynamically. Press the menu button on
the DISP1 window and the display window will be changed to be DISP2 window. You will see a
trend graph chart drawing a sine wave. Press the menu button on the DISP2 window, and the screen
will return to the DISP1 window.
Figure 2-17: Change between screens
2-14
Tutorial 3: Execution Order Arrangement
Purpose
The purpose of this tutorial is to teach you how to design multiple tasks in a strategy file and how to
arrange the execution order of task blocks.
Function
Create two AI block and one single operator block in a task and execute a symbol, addsymbol operation
in single operator to add two AI blocks and show their result. Repeat the above operations with another
task and show the result on the same display. Rearrange the execution order to see the impact.
Procedure
1. Refer to Tutorial 1 to start GeniDAQ and add a new Task.
2. Add two AI blocks and a single operator calculation block Add into Task1. Configure AI1 block to
be the input from Advantech DEMO I/O channel 0 and AI2 block to be the input from the same
device and channel.
Figure 2-18: Add two AI blocks and a single operator block
3. Click on the Wire block in the task block toolbox. The mouse will change to a wiring icon. Click
once on the AI1 block to be the source of a link connection and move the mouse to the single
operator block and click once again. A wire connection will be established between AI1 and the
single operator block. A pop-up panel will be displayed to choose the output channel number of
AI1. Select the channel 0 to be the output channel, refer to Fig 2-20. Another pop-up panel will be
displayed to choose the operand of operator Add. Select the operand 1. Refer to Fig 2-21.
Figure 2-19: Select output channel of AI block
Tutorial
2-15
Figure 2-20: Select the operand of single operator
Do the same thing as above for AI2 block to link with single operator block. Select channel 0 and
operand 2 as the output channel and the operand of operator Add.
Figure 2-21: Wire two AI blocks to a single operand block
4. Repeat Step 2 and Step 3 to add a single operator calculation block Subtract.
Figure 2-22: Wire two AI blocks to two single operands
5. Click on the View menu and activate Order Layout option to show the execution order number at
the upper half of each block.
2-16
Figure 2-23: View the execution order
6. To arrange the execution order, click on the Layout menu. From the Layout submenu select the
Complete reorder menu option. You can change the order of task blocks immediately. Move the
mouse to the AI1 block and click once, the order number of AI1 will be 1. Move the mouse to the
AI2 and click once, the order number of AI2 will be 2. Move the mouse to single operator calculation block Add and click once. The single operator block will show order number 3 at the upper half
of icon. The single operator calculation block Subtract will be set as number 4.
Figure 2-24: Arrange the execution order
7. If you want to exchange the order between single operator calculation block Subtract and single
operator calculation block Add, you have to click on the Layout menu and activate the Exchange
order option. After activating Exchange order function, move the mouse to the desired two blocks
and click on them. The order numbers will be changed automatically.
Tutorial
2-17
Figure 2-25: Exchange execution order
8. Refer to Tutorial 1 Step 9 to save the strategy file as “TUTOR3.GNI”
9. Run the strategy file to see the impact of different ordering.
Tutorial 4: Drawing tool in Display Designer
Purpose
The purpose of this tutorial is to teach you how to use the drawing tools in display item toolbox to
customize you display.
Function
Use oval and rectangle drawing blocks to draw a pump and combine them into a pump object using the
Make Object option of the Edit menu. After that, link a binary control display item to the combined
object and use the control item to assign different values to the pump object and change its color.
Procedure
1. Refer Tutorial 1 to start GeniDAQ and add new Tasks.
2. Add a binary button control item at the Display1. Configure this control button to be an ON/OFF
control and output a 0 or 1 data value.
2-18
Figure 2-26: Add a binary button control item
3. Click once on the oval drawing item in the display item toolbox. Drag the oval drawing item to the
display working area. Choose the added oval item and press “Ctrl+C” to copy it. Press “Ctrl+V” to
paste it to the same display working area. Select one oval drawing item and move your mouse to
one corner of the rectangle and enlarge the drawing item.
Tutorial
2-19
Figure 2-27: Add a binary button control item
4. Add two rectangle drawing items on the same display working area by drag and drop or copy and
paste operations.
Figure 2-28: Add two rectangle drawing items
5. Configure the drawing items by double clicking on each one. A pop-up dialog will be displayed for
configuring the input.
2-20
Figure 2-29: Configure Drawing item
Select Display1 from Task/Display field and BBTN1:ON/OFF from TAG field in configuration dialog.
Set the color to be red while the input is equal to 1 and Set the color to be green while the input is equal
to 0. Press OK to save the configuration.
6. Arrange these drawing items to be a pump picture, like the following. You can send the rectangle
objects to the back of oval objects by clicking on the Edit menu and Send to Back option. After that,
select all the parts you wants to build into an object, and click on the Edit menu and Make Object
menu option in Display Designer to combine these four drawing items into one drawing item, like
the following.
Figure 2-30: Make object
7. Save the strategy file to be “TUTOR4.GNI”
8. Run the strategy file. You will see the color of pump picture will be red while you press the binary
control item. The color will be green while you press the binary control item again.
Tutorial
2-21
Figure 2-31: Run strategy file “TUTOR4.GNI”
9. If you want to modify the integrated drawing item, select the Break Object option from the Edit
menu in Display Designer.
Tutorial 5: TAG block for integrating Task with Display
Purpose
The purpose of this tutorial is to teach you how to use TAG block in Task Designer to retrieve user
input data in Display and process it in Task.
Function
Creates a numeric control item to input a control value in a display. Design TAG block to retrieve user
input value and Alarm block to check if the input value is out of alarm range. If it is out of range, then a
red lamp is displayed, otherwise a green lamp is displayed.
Procedure
1. Refer to Tutorial 1 to start GeniDAQ and add new Tasks and Displays.
2. Design a numeric control display item and a indicator display item in the Display1 window.
Configure the numeric control display input type to be a floating number and configure the indicator
display to be a round lamp shape. Set the color to be red while the input is equal to 1 and green
while input is equal to 0.
2-22
Figure 2-32: Add numeric control and indicator display item
Figure 2-33: Configure indicator display and link to Task
3. Design an Alarm block and a TAG block in Task1.
Tutorial
2-23
Figure 2-34: Add alarm block and TAG block
Double click Alarm block to configure the value of hi-hi field to be 90, the value of Hi field to be 80,
the value of lo field to be 20 and the value of lo-lo field to be 10.
Figure 2-35: Configure alarm block
Double click TAG block to configure TAG as a linkage to the numeric control item of Display1 by
setting the Task/Display field to be Display1, the TAG field to be CTRL1 in configuration dialog.
2-24
Figure 2-36: Configure TAG to link with display item
4. Connect the TAG block to Alarm block in Task1 by wire link. Take TAG value as the input value
for alarm block and compare the value with hi-hi, hi, lo, and lo-lo field of alarm block. If the TAG
value is exceeded or beyond the set values of the alarm block, an alarm value will be output to the
button display.
Figure 2-37: Connect TAG block to alarm block
5. Double click indicator display item in DISP1 to configure it and link to the output value of alarm
block in Task1. You are advised to add two label display items in DISP1 for showing hi and lo
alarm values. In this example, the label display items are “Upper Limit=80” and “Lower Limit=20”
Tutorial
2-25
Figure 2-38: Run strategy file “TUTOR5.GNI”
6. Refer to Tutorial 1 Step 9 to save the strategy file as “TUTOR5.GNI”
7. Run the strategy file and type a value in the numeric control item. If you type 50 in the field, you
will find the indicator display is green. However, if you type 81 or 19, the indicator display will be
red.
Tutorial 6: BasicScript block
Purpose
The purpose of this tutorial is to give you a guide on how to program the BasicScript block.
Function
1. Get Advantech DEMO I/O AI channel 0 value
2. Compare the AI channel 0 value with the value the user typed in.
3. If AI value is greater than input value, then turn on the alarm lamp to be red, otherwise turn it off to
be green.
Procedure
1. Refer Tutorial 1 to start GeniDAQ and add new Tasks.
2. Add a numeric display item, a numeric control display item, a indicator display item and two text
display items into Display1 window.
2-26
Figure 2-39: Build display screen
3. Add AI block, BasicScript block and TAG block in Task1. Configure AI block to be Advantech
DEMO I/O channel 0. Connect AI1 block to BasicScript block and NCTL1 block to BasicScript
block by wire link.
Figure 2-40: Build Task icon and wiring
Link TAG1 with numeric control item in Display1 window.
Tutorial
2-27
Figure 2-41: Link TAG to numeric control item
4. Double click the BasicScript block to edit a Basic script program. Key in the following text program
in the pop-up window:
Sub SCR1()
dim mytag1 as TAG
dim mytag2 as TAG
set mytag1 = GetTag(“Task1”, “AI1”)
set mytag2 = GetTag(“Disp1”, “NCTL1”)
if mytag1 > mytag2 then
outputi 1
else
outputi 0
end if
End Sub
5. Double click on the numeric display item in Display1 and configure it to display the value of AI1 in
Task1. Double click on the indicator display item in display1 and configure it to display the value of
scr1 in Task1.
2-28
Figure 2-42: Link BasicScript output to indicator display
6. Refer to Tutorial 1 Step 9 to save the strategy file as “TUTOR6.GNI”
7. Run the strategy file. If you type 0 in the numeric control display item, the indicator display item
will be red if the AI1 current value is positive, otherwise the indicator display item will be green.
Tutorial 7: BasicScript block with Virtual TAG block
Purpose
The purpose of this tutorial is to guide you on how to use BasicScript block and Virtual TAG block to
calculate or analyse I/O data.
Function
Add three blocks in Task1 window. The first one is an AI block in Task1 that inputs values from
Advantech DEMO I/O channel 0. The second one is a virtual TAG block that stores the max. value of
AI block. The last is a BasicScript block that calculates the max value of AI block and stores it into
virtual block. After that, use five items in display designer to show the current AI value, label the max
AI value, and add a lamp for max. value changed.
Procedure
1. Refer to Tutorial 1 to start GeniDAQ and create a new task and display.
2. Create a virtual TAG in system by clicking on the SETUP menu and choose the Add/Delete Virtual
Tags option, as follows:
Tutorial
2-29
Figure 2-43: Add Virtual TAG
A pop-up window will be displayed to add or delete virtual tags. Choose VR1 at input field and press
ADD button to add the virtual tag “R1”. Pressing OK will exit this pop-up window and return you to
Task Designer.
Figure 2-44: Create a new Virtual TAG
3. Add an AI block, a BasicScript block and a TAG block in Task1.
2-30
Figure 2-45: Build Task icons
Double click on the AI1 block to configure the input value from Advantech DEMO I/O channel 0.
Double click on TAG block to link with Virtual Tag.
Figure 2-46: Link Tag block to Virtual TAG
Select VIRTASK in the Display/Virtual Tag field and VR1 in tag name field of the above window.
4. Double click BasicScript block to edit Basic script program. Key in the following text program in
the pop-up window:
Tutorial
2-31
Sub SCR1()
dim mytag1 as TAG
dim mytag2 as TAG
set mytag1 = GetTag(“TASK1”, “AI1”)
set mytag2 = GetTag(“VIRTASK”, “VR1”)
if (mytag1.value > mytag2.value) then
mytag2.value = mytag1.value
outputi 1
else
outputi 0
end if
End Sub
5. Add 2 numeric display items, 2 labels and 1 indicator display item in the Display1 window. The 2
numeric display items will be configured to link and display the AI1 value and the virtual tag value
in Task1. “Max Value” reflects the virtual tag value and “Current Value” reflects the AI1 value.
Figure 2-47: Build display screen
Configure the indicator display item to link with the output 0 of BasicScript block.
2-32
Figure 2-48: Link BasicScript output to indicator display
6. Refer Tutorial 1 Step 9 to save the strategy file as “TUTOR7.GNI”
7. Run the strategy file. At the display window, you will see the AI current value and its max. value. If
the AI1 current value is greater that its max. value, the indicator display item will be red. Otherwise,
the indicator display item will be green.
Tutorial 8: Main Script programming
Purpose
The purpose of this tutorial is to give you a guide on how to design a Main Script program and use it to
control tasks.
Function
1. Create a main script and a task
2. Use main script to start the task and run the task 100 times in main script.
Procedure
1. Refer to Tutorial 1 to start GeniDAQ and add new Tasks.
2. Repeat Tutorial 1 steps to show Advantech DEMO I/O channel 0 value using a Trend graph.
3. Change the properties of Task1 to be controlled by main script. Click on the Setup menu and Task
properties... option to invoke the task properties pop-up window.
Tutorial
2-33
Figure 2-49: Setup Task properties
In the task properties window, change the starting method field to be inactive (activated by command).
Figure 2-50: Setup ScanTask properties
4. Click on the File menu and choose the Add/Delete, Add Main Script option to invoke Script
Designer for editing the Main Script program.
2-34
Figure 2-51: Add a main script to the strategy
5. Edit the following program text in the Script Designer window:
Sub Main()
dim mytask as ScanTask
set mytask = GetScanTask(“Task1”)
mytask.start
End Sub
Figure 2-52: Edit main script program
Tutorial
2-35
6. Refer to Tutorial 1 Step 9 to save the strategy file as “TUTOR8.GNI”
7. Run the main script program by clicking on the Run menu and Main Script menu options in Task
Designer.
Tutorial 9: Controlling multiple tasks
Purpose
The purpose of this tutorial is to give you a guide on how to control multiple tasks in your data acquisition and control system through task properties.
Function
1. Create two tasks within an AI block individually
2. Create a display window and add two trend graphs and labels to show the value of AI blocks in two
different tasks.
3. Configure task properties to different working modes.
Procedure
1. Refer to Tutorial 1 for instructions on starting GeniDAQ and creating a new strategy.
2. From the File menu select the Add/Delete, Add Task option to add Task2 window.
Figure 2-53: Create a new Task
3. Add AI blocks into Task1 and Task2 windows. Configure the AI1 block in Task2 to display the
value of Advantech DEMO I/O channel 0 and AI2 block in Task1 to display the value of Advantech
DEMO I/O channel 1.
2-36
Figure 2-54: Build multiple Task icons
4. Add two trend graphs and two labels in the DISP1 window. Configure the two graphs to show the
values of AI1 and AI2.
Figure 2-55: Configure trend graphs
5. Configure task properties by activating the task window and clicking on Setup menu and Task
properties... options. The duration of Task1 is set to be Indefinitely and the starting method is set to
be Immediate. The duration of Task2 is set be 100 times and the starting method is set to be Delayed
5 seconds.
Tutorial
2-37
Figure 2-56: Setup TASK1 to be started immediately
Figure 2-57: Setup TASK2 to be started after a 5 second delay
6. Refer Tutorial 1 Step 9 to save the strategy file as “TUTOR9.GNI”
7. Run multiple tasks by clicking on the Run menu and Start menu options in Task Designer.
Summary
Besides the tutorial examples, we also provide a lot of examples in the \Strategy directory. Please check
the directory for the details.
2-38
3
Configuring Your
System Functions
With Task Designer
Overview
Advantech GeniDAQ provides an intuitive object-based graphical user interface (GUI) that simplifies
control strategy and display setup. You simply select icon blocks from the toolbox, connect them,
configure the parameters, and draw your dynamic display without any programming. A library of
function block icons representing industry standard data acquisition, control, mathematical and display
functions, lies at your fingertips.
Advantech GeniDAQ uses a data flow programming model to describe your task and control strategy.
You intuitively construct and connect the function block icons to build your system. The execution
order in GeniDAQ is determined by the flow of data between blocks. You can change the execution
order of the blocks according to the needs of the system.
The Advantech GeniDAQ development environment allows you to decompose your system into several
smaller modules or tasks. The modular design is very useful to develop and maintain a large and
complicated system more easily. Each modular or task has its own properties, such as scan rate, start/
stop method, and priority etc. With 32-bit Windows’ multi-tasking capability, all tasks are running
simultaneously at run time. Moreover, GeniDAQ allows you to prioritize your tasks to increase overall
performance.
Contents
•
Working with tasks
•
Working with blocks
•
Working with calculation blocks
•
Working with file I/O blocks
•
Working with DDE blocks
•
Working with tag block and virtual tag
•
Working with other blocks
•
Summary
Working with Tasks
Depending on the characteristics of your control strategies, you can break down your strategies into
several smaller modules. In GeniDAQ, a module is a task. GeniDAQ allows you to create multiple
tasks. The number of tasks depends on the system resources. The elements of a task window are as
below:
The elements of task windows include:
3-2
Title Bar Icon
Task Toolbar
Window Button
Task Toolbox
Scroll Bar
Working Area
Figure 3-1: Main Parts of the Task Designer Window
Configuring Your System Functions With Task Designer
3-3
Task Toolbox
Task blocks can be placed in the Task Designer configuration window by selecting them from the task
toolbox. The following icons are available:
Connection W ire
Tag B lock
Analog Output
Digital Output
Hardw are Event/Frequency/P ulse O utput
RS-232
On/Off Control
Average
Analog Input
Digital Input
Tem perature M easurem ent
Hardw are Alarm
PID Control
Single Operator Calculation (S OC)
BasicScript
Event Counter
Tim er
Tim e Stam p
Ram p
Data File
DD E Server
Netw ork Input
Beep
Log File
DD E Client
Alarm Log
Sound
System Control
Figure 3-2: Task Designer Task Toolbox
•
I/O blocks include the Analog Input, Analog Output, Digital Input, Digital Output, Temperature
Measurement, Hardware Event/Frequency/Pulse Output, Hardware Alarm and the RS-232 block.
Please refer to Chapter 5, Connecting Your Devices.
•
For information about the BasicScript block, refer to Chapter 10, Advanced BasicScript Programming For Your Specific Needs
•
For information about the Network Input block, refer to Chapter 8, Communicating Through TCP/IP
Networking.
•
For information about the Alarm Log, refer to Chapter 7, Monitoring Alarm and Event.
Note:
3-4
BasicScript, DDE Server, DDE Client and Sound block are not supported by the
current version of Advantech GeniDAQ CE.
Creating and Configuring Tasks
GeniDAQ creates a task by default when you create a new strategy. You can create more tasks by
selecting File | Add/Delete | Add Task from the main menu or you can delete a task by switching to the
task (click Window from the main menu and then choose the task that you want to delete to make it
active) and the selecting File | Add/Delete | Delete Task from the main menu.
Alternatively, you can use the Add Task and Delete Task toolbar icons to add a new task or delete the
active task, respectively.
Add Task Icon
Delete Task Icon
Figure 3-3: Add Task/Delete Task Toolbar Icons
After you create a new task, you should configure the runtime properties of the task. First you switch to
the task window, then choose Setup | Task Properties… from the main menu.
Alternatively, you can use the Task Properties icon on the toolbar to open the ScanTask Setup configuration dialog box:
Configuring Your System Functions With Task Designer
3-5
Task Properties Icon
Figure 3-4: Task Properties Toolbar Icon
The ScanTask Setup configuration dialog box appears:
Figure 3-5: ScanTask Setup Configuration Dialog Box
ScanTask Setup Field Description
•
3-6
Tag is the name assigned by GeniDAQ to refer to the task. This is the object name that should be
called from BasicScript programming code.
•
Description is a field that the user can enter to describe the task’s function and purpose
•
Scan Period is the time interval between successive retrievals of information used by the task
•
Duration is the time when you want the task to run. Free Run will enable the task to run continuously, Time-based will run the task for a given period of time and Scan-based will run the task for a
specified number of scans (i.e., retrievals of data).
•
Starting method controls when the task starts to run. Immediate automatically runs the task when the
runtime is enabled, Inactive keeps the task disabled until invoked by BasicScript code or System
Control Block, Delayed enables the task after a period of time has elapsed from starting the runtime
and System Time uses the computer’s real-time clock to enable the task.
•
Clicking the OPC Setting button loads the OPC Server Properties configuration dialog box:
Figure 3-6: OPC Server Properties Configuration Dialog Box
•
Scan Mode: Specifies asynchronous or synchronous mode scan. Asynchronous mode configures
the OPC server to transfer data only when data is changed. It is more efficient. Synchronous
mode always scans data from the OPC server.
•
Data Source: Specifies the data source from cache or device when GeniDAQ requests data for
the OPC server. The OPC server scans the physical device at a fixed rate (the Update Rate). The
scan data will stored in memory. The cache option means the data is stored in the memory of the
OPC server. It’s more efficient. For a device data source, the OPC server retrieves data from the
physical device.
•
Update Rate: Specifies the update rate that the OPC server scans the physical device. 0 means
the maximum speed of the OPC servers.
•
Deadband: Specifies the percentage change in an item value when the OPC server causes a
callback to GeniDAQ. 0 means the OPC servers will pass the data to GeniDAQ as long as the
data is changed.
•
Clicking the Advanced button will load the Advanced Option configuration dialog box:
Figure 3-7: Advanced Option configuration Dialog Box
Configuring Your System Functions With Task Designer
3-7
•
Priority is the relative priority that the task has when using the operating system’s multitasking
features. The priorities are (from lowest to highest) are Lowest, Below normal, Normal, Above
normal and Time critical.
Note:
Note:
3-8
All items in a task have the same OPC properties. Each task has its own OPC
properties.
The default resolution for the scan period is 10 ms. The scan period must be
mutiple of 10 ms. You can change the resolution under [system] section in Windows/
GeniDAQ.ini file. TaskScheduleRes=10. The minimum is 5 ms. Be careful when
changing it. It will affect your system’s performance.
Working with Blocks
Once you have created a new task in your strategy, you are ready to design your control logic in the
task’s workspace.
Connecting Blocks
All block connections are made while the Connection Wire function is enabled. Enabling the Connection Wire function is accomplished by clicking the Connection Wire icon (the angled wire) on the Task
Toolbox. When the function is enabled, a “roll of wire” appears instead of the standard mouse cursor.
In this mode, connections can be started and terminated between various Task Designer blocks. Please
check the input/output capacities and ata types for each block. Make sure the data type is matched
between the source block and target block at connecting them.The following connections may be made:
Block to Block
This is the most common connection in a strategy. You simply click on the source block and then click
on the target block. If the source block or target block provides multiple inputs or outputs, then you
need to select one of them in the listbox.
Block to Display Item
When connecting a block to a display item, you have to open the Display Designer window, doubleclick the display item you want to connect to to open its configuration dialog box and then select the
source block from the combo box in the dialog. This is normally done by configuring the Input from
field in the configuration dialog box. This completes the connection from a block to a display item. For
example, the following figure shows Numeric/String display item being configured to receive input
from a Temperature Measurement block in TASK1.
Figure 3-8: Connect a block to a display item
Configuring Your System Functions With Task Designer
3-9
Display Item to Block
If the source of the connection is a display item then a Tag block in the Task toolbox needs to be
created first in order to make a connection. After creating a display control item in Display Designer
window, you have to create a TAG block in Task Designer window and configure it to represent this
display control item. For example, the following figure shows a block TAG1 in the Task Designer
being connected with a Slider control SPIN1 in the Display Designer.
Figure 3-9: Connect display control item to Task block
Display Item to Display Item
This type of connection can be made between different display windows or in the same window. There
are two ways to implement this type of connection. One is to create a first display item and then
configure a second display item to link with the first. These two display items can be in different
display windows. The other way is to link different display items through TAG in Task Designer. That
is, one display item can pass data to the TAG of Task Designer, and another display item is configured
to access this TAG.
Duplicating Blocks
If you want to duplicate a block (including its configuration settings) that is already part of your
display, complete the following procedure:
1. Select the block with your mouse cursor. You can also select multiple blocks by dragging your
mouse cursor around them.
2. Select Edit | Copy or click the Copy toolbar icon.
3. Select Edit | Paste or click the Paste toolbar icon.
4. The block(s) that you selected will be displayed in the task window.
Cutting Blocks
You can cut blocks from one task window and then paste them into another task window.
1. Select the block with your mouse cursor. You can also select multiple blocks by dragging your
mouse cursor around them.
2. Select Edit | Cut or click the Cut toolbar icon.
3. Select Window on the main menu and then switch to the task target task window.
3-10
4. Select Edit | Paste or click the Paste toolbar icon.
5. The block(s) that you selected will be displayed in the task window.
Arranging Blocks’ Execution Order
GeniDAQ is a data flow programming model. The execution order of the blocks depend on the data
flow. GeniDAQ will assign the execution order automatically. You can also change the programming
model to meet your needs. GeniDAQ provides two methods to change the order.
The Task Designer includes block sequence arrangement feature that shows the order of execution on
all blocks. Users can rearrange the order of execution of the blocks (icons) under some restrictions. It
shows the order of execution among blocks in the run-time program. The user selects Order Layout
from the View menu to display the order number of each block. The order of blocks can be changed
using the Complete Reorder and the Exchange Order options from the Layout menu.
Arranging Blocks’ Layout
GeniDAQ provides “Align” and “Space Evenly” to arrange the task block layout.
Copying DDE Link
GeniDAQ provides “Copy DDE Link” and “Paste DDE Link” menu options to establish the DDE
connections between GeniDAQ and other applications. After you select “DDE Server” blocks, including Analog Input, Digital Input, Temperature, and DDE Server blocks, you can select the “Copy DDE
Link” menu option from the Edit menu to setup DDE linkage or other applications.
Pasting DDE Link
After copying DDE link, you select “DDE Client” blocks, such as Analog Output, Digital Output and
DDE Client blocks. Then select the “Paste DDE Link” menu option from the Edit menu to paste the
DDE linkage from another application.
Working with Calculation Blocks
The calculation blocks are used to perform some calculation. Their descriptions are as follows:
Single Operator Calculation Block
Block Information
Input 1 (integer/floating-point)
Input 2 (integer/floating-point)
Single Operator
Calculation
Block
Output 1 (integer/floating-point)
Figure 3-10: Single Operator Calculation Block Information
Configuring Your System Functions With Task Designer
3-11
Interface
•
Number of inputs: 2
•
Input type: integer/float
•
Number of outputs: 1
•
Output type: integer/float
Description
This block does single operator math computations, such as add, subtract, multiply, etc. At least one
block must be connected as an input block; this will be the first operand. The second operand can be
either another block or a constant entered in the Single Operand Calculation block’s dialog box.
Figure 3-11: Single Operator Calculation Block
Field Description
Once two operands are selected, the order can be switched by pressing the Swap Operands button. This
is important, since some operators, such as div or mod, will yield different results depending upon what
values you use for OP1 and OP2 (first operand and second operand). The first block that is connected
to the Single Operator Calculation block will be the default first operator in the dialog box. If you wish
to have a different order, press the Swap Operands button. This will switch the order of operation of the
SOC block.
The Result Data Type (output data type) can be either Floating Point (Real) or Integer.
3-12
Operator
nop
+
-
Function (Output)
Outputs 0 always
OP1 + OP2
OP1 - OP2
x
OP1 * OP2
/
OP1 / OP2
pow
OP1 ^ OP2
* mod
Outputs remainder of OP1 / OP2
* and
Logical AND of OP1 and OP2
* or
Logical OR of OP1 and OP2
* xor
Logical XOR of OP1 and OP2
max
Outputs the maximum of OP1 and OP2
min
Outputs the minimum of OP1 and OP2
>=
Outputs 1 if OP1 >= OP2, 0 otherwise
<=
Outputs 1 if OP1 <= OP2, 0 otherwise
>
Outputs 1 if OP1 > OP2, 0 otherwise
<
Outputs 1 if OP1 < OP2, 0 otherwise
equ
Outputs 1 if OP1 == OP2, 0 otherwise
neq
Outputs 1 if OP1 is not equal to OP2, 0 otherwise
abs
Outputs the absolute value of OP1
* not
Logical NOT of OP1
inv
Outputs 1 / OP1 (inverse of OP1)
sqrt
Outputs the square root of OP1
log
Outputs the log of OP1 (base 10)
ln
Outputs the natural log of OP1 (base e)
exp
Outputs e ^ OP1
jct
Junction block (see below)
Figure 3-12: Single Operator Calculation Block Operators and Functions
Operators with an asterisk “*” next to them require an integer operand. Some of the above mentioned
operators need only one operand, while others need two. The logical operators (AND, OR, XOR)
require two operands which must be integers. Other operators (ABS, NOT, INV, SQRT, LOG, LN,
EXP, JCT) only require one operand, which can be either integer or floating point format, depending on
the operator.
Some care is needed when providing input operands to certain operators. The MOD and “/” operators
cannot have 0 (zero) as an operand to avoid a divide-by-zero situation. In the same way, some operators (SQRT, LN, LOG) require a positive value as an operand. Runtime errors will occur if these rules
are not followed.
Configuring Your System Functions With Task Designer
3-13
The JCT operator has a special function of simply outputting its input. It’s useful for connection
between a button display item and many other blocks. In the display editor, the button display item is
designed to output to one and only one other block. Use of the JCT operator allows you to connect the
button display item to many other blocks. by using the JCT operator as a branching point.
•
Wiring In: Single Operator Calculation block accepts input data as operands for the operator.
•
Wiring Out: Single Operator Calculation block outputs the calculated value to connected block(s).
Average Block
Block Information
Input 1 (integer/floating-point)
Average Block
Output 1 (integer/floating-point)
Input 2 (integer/floating-point)
Figure 3-13: Average Block Information
Interface
•
Number of inputs: 2
•
Input type: integer/float
•
Number of outputs: 1
•
Output type: integer/float
Description
This block allows for input and output.
Field Description
There are two averaging methods available. If “Moving Average” method is selected, the input is
averaged over a number of samples. The moving average is defined in the “Number of points to be
averaged” field. If “Whole Average” method is used then the output is the average of all samples. For
instance, if it is desired to average the present sample value with the previous 9 samples, then the user
chooses the moving average method and uses 10 as the number of samples to be averaged. This will
tend to smooth out noise and any extraneous signals. The Moving Average block should be placed
between the sampling block and the next logical block, i.e. the display block, etc.
3-14
Figure 3-14: Average Block Configuration Dialog Box
•
Wiring In: Average Block accepts the wiring input data as sampled data and performs calculation.
•
Wiring Out: Average Block outputs the average value to the connected block.
On/Off Control Block
Block Information
Input 1 (integer/floating-point)
SetPoint (floating-point)
On/Off Control
Block
Output 1 (floating-point)
Figure 3-15: On/Off Control Block Information
Interface
•
Number of inputs: 2 (input and setpoint)
•
Input type: integer/float, float
•
Number of outputs: 1
•
Output type: float
Description
This block allows both input and output. The input consists of a measured value (feedback) to be
controlled to within a certain tolerance (deadband), determined by a setpoint (either dynamic or static).
The output is either digital low or high, depending on controller output.
Theory
Non-proportional control, in which the controlled process input is either fully ON or fully OFF,
depends on whether the measured value (feedback) is above or below the control point (setpoint)
deadband.
Configuring Your System Functions With Task Designer
3-15
Figure 3-16: On/Off Control Block Configuration Dialog Box
Setpoint
The On/Off setpoint value, or desired value. This value can be changed on the fly (dynamic) by
specifying a ramp or other block to be used as the dynamic setpoint. If there is no dynamic setpoint
from connection, a constant setpoint will be enabled. You can enter the static setpoint.
Delta Low
Low value for generation of the deadband. Lower section of deadband is equal to Setpoint - Delta Low.
Delta High
High value for generation of the deadband. Upper section of the deadband is equal to Setpoint + Delta
High.
In addition, you have the option of outputting either a 0 or a 1 value for inputs over the high limit,
which would make the output 1 or 0, respectively, for inputs under the low limit.
If no deadband is desired, simply set the delta low and delta high values to zero. In this way, ALARM
CONTROL can be achieved using a static setpoint.
•
Wiring In: On/Off Control Block accepts data as input data or setpoint data.
•
Wiring Out: On/Off Control Block outputs either digital low or high to connected block.
Note:
3-16
The \Strategy\OnOff example demonstrates how to use On/Off block. Please refer
to it for the detailed.
PID Control Block
Block Information
Feedback (floating-point)
SetPoint (floating-point)
Dynamic P (floating-point)
Dynamic I (floating-point)
Dynamic D (floating-point)
Trigger (integer)
PID Control
Block
Output 1 (floating-point)
Figure 3-17: PID Control Block Information
Interface
•
Number of inputs: 6 (feedback, setpoint, dynamic P, dynamic I, dynamic D, and trigger signal)
•
Input type: float, float, float, float, float, integer
•
Number of outputs: 1
•
Output type: float
Description
This block allows for input and output. The input consists of a measured value (feedback) to be
controlled by the setpoint value (either dynamic or static). The block’s output is the controller output.
Theory
A controller is capable of receiving a signal from a sensor (usually temperature) within a process and
regulating an input to that process in order to maintain a selected value or set point/control point.
The PID controller is the most widely used type of process controller. It is the ability to tune its control
action to specific time constants and therefore to deal with process changes over time. These features
have earned the PID controller wide acceptance. To perform the control, the object is to measure the
difference (error) between the desired value (setpoint) and the measured value (feedback), and reduce
that error. The PID controller is the most efficient type of process controller.
The control functions of the PID controller may be separated according to application requirements into
three types. The three functions are: one, two, and three mode control.
One Mode Control (Proportional)
This is the simplest type of proportional control. Using this method, the controlled process input is
regulated to a value proportional to the difference between the control setpoint and the measured value.
This controls the proportional band. The larger the value of the proportional constant, the harder the
system will react to differences between the setpoint and the actual measured value. A simple proportional controller may be achieved by setting the reset rate (I) and derivative times (D) to zero.
Two Mode Control (Proportional/Integral)
This method introduces an additional reset control action depending upon the accumulated error x time
product (integral). The sum of the error and reset signals continuously act to make the actual error
signal smaller, stopping when the measured value reaches the desired control setpoint. A PI controller is
created by setting the derivative (D) value to zero.
Configuring Your System Functions With Task Designer
3-17
Three Mode Control (Proportional/Integral/Derivative)
This mode uses an additional rate sensing (derivative) action, which reduces the tendency to overshoot
a control setpoint. This is done by anticipating the approach of a zero value error signal and initiating a
control response reversal before the measured value (usually sensed temperature) actually gets there.
Proper use of the derivative term can result in much faster process response.
Figure 3-18: PID Control Block Configuration Dialog Box
Type of PID control
The output of the position method is an absolute value for setting the controlled variable. Since the
output of the velocity method is a relative amount to change the controlled variable. For example, if the
current value of the controlled variable is 5, and the output of the PID position algorithm is 2, then the
controlled variable is set to 2. If the current value of the controlled variable is 5, and the output of the
PID velocity algorithm is 2, then the controlled variable should be set to 5+2=7.
•
P: PID proportional control constant
•
I: PID integral mode gain constant
•
D: PID derivative mode gain constant
The P, I, D parameters can be set on the fly (dynamic) by specifying data from other blocks as the
dynamic inputs. The change of any of the P, I, D parameters is not effective until the Trigger for PID
change is triggered.
3-18
•
Trigger for PID change: If you use dynamic P, I, D parameters, you have to connect a value from
another block to the input (Trigger for PID change) to activate the PID changes. In other words,
dynamic P, I, D and Trigger should all be connected. If they are not, the control system will not
work. When dynamic values are used, static values will be disabled and ignored.
•
Low Clamp: Low clamping value for output. Prevents voltage swings from exceeding the range of
the hardware used for the control (usually D/A converter).
•
High Clamp: High clamping value for the output.
•
Rate Clamp: Rate of change clamp for output, measured in units/minute. If there is a large change
in the setpoint or feedback, the rate clamp parameter will prevent the PID output value from making
a change larger than the hardware is able to support. Instead the output value will be limited to
change at the specified rate.
•
Filter Constant: The value for the measured variable can be automatically filtered if it is noisy.
Filter value of 0.0 means that no filtering takes place. As the values increase toward 1.0, the
filtering effect becomes more and more pronounced.
•
Setpoint: The PID setpoint value, or desired value. The value can be changed on the fly (dynamic)
by specifying a ramp or other block to be used as the dynamic setpoint. If a constant setpoint is
desired, enter the static setpoint.
•
Dynamic Setpoint: If an outside value is connected to this entry, the setpoint value becomes dynamically changed by the outside value instead of using the constant value. When the dynamic setpoint
is active, the static one is disabled and ignored.
•
Wiring In: PID Control block accept wiring input data as Feedback, Setpoint, P parameter,
parameter, D parameter and Trigger for PID change value and use them in block configuration.
•
Wiring Out: PID Control block outputs the controller value to a connected block.
Note:
The \Strategy\PID example demonstrates how to use PID block. Please refer it for
the detailed.
Note:
The PID algorithm is as below:
U(n) = P*e(n)+P*I*TsSe(k)+((P*D)/(6*Ts))*(e(n)+3(e(n-1)-e(n-2))-e(n-3))
Where:
•
U(n): PID block output at sample time n
•
P: Proportional parameter (Gain)
•
I: Integral parameter (Reset)
•
D: Derivative parameter (Rate)
•
e(n): Setpoint - Feedback, error at sample time n
•
Ts: Sample period (task’s scan time) in minute
Configuring Your System Functions With Task Designer
3-19
Event Counter Block
Block Information
Input (integer)
Reset (integer)
Event Counter
Block
Output 1 (integer)
Hold (integer)
Figure 3-19: Event Counter Block Information (4-h.vsd)
Interface
•
Number of inputs: 3 (input, reset, and hold)
•
Input type: integer, integer, integer
•
Number of outputs: 1
•
Output type: integer
Description
This block has both input and output capability. A software event counter that counts digital rising
edges (digital high events) from any block supplying digital information (1’s and 0’s). The block’s
output can be sent to another block. Each count is performed with each scan; therefore counting speed
is equal to the sample period of the system. By connecting a high digital value to the reset input, the
count can be reset to its starting value and counting is stopped. A low value to the reset input will
enable counting. If reset input is not connected, this value is simply treated as a low. By applying a high
digital value to the hold input, the count may be temporarily held at the current value. A low on the
hold input will resume counting.
Figure 3-20: Event Counter Block Configuration Dialog Box
3-20
Start Value
An integer value at which the Counter will start. (maximum 65535)
Stop Value
An integer value at which the Counter will finish. The value can be above or below the Start value.
(maximum 65535)
Increment/Decrement
Each integer up/down count will be equal to this value.
Input from
The block from which you would like to count pulses (rising edges).
Reset from
The trigger block (any digital type block) used to apply a digital high/low to reset/start the counter. A
digital high applied to this input resets the counter and stops counting. A digital low allows counting to
occur. No reset input is treated as a low input; counting will free-run in this case.
Hold from
Any digital type block used to hold the count at the current value. A high digital signal applied to this
input stops counting at the current value. A low applied to this input will enable/resume counting. No
hold input is treated as a low input.
•
Wiring In: Event Counter Block accepts data as input, reset and/or and then displays the data in the
configuration dialog box.
•
Wiring Out: Event Counter Block outputs the current counter value to connected block(s).
Working with File I/O Blocks
File I/O blocks are used to perform file I/O operation. The blocks include
Data File Blocks
Block Information
Data File Block
Output 1 (floating-point)
Figure 3-21: Data File Block Information
Configuring Your System Functions With Task Designer
3-21
Interface
•
Number of inputs: 0
•
Input type: none
•
Number of outputs: 1
•
Output type: float
This block has output capability. By using this block, data can be retrieved from a file. The data will be
retrieved one line at a time with each system scan (sample). When the end of the data is reached, it will
be re-scanned (loop back will occur). An ASCII file must be created containing the data formatted into
one column of either integer or floating point values. Specify the filename in the associated dialog box.
Connect the Data file block to the block to where data will be sent.
Figure 3-22: Data File Block Configuration Dialog Box
•
Wiring In: No input allowed
•
Wiring Out: This block passes the value from data file to connected block.
Log File Blocks
Block Information
On/Off (integer)
Open/Close (integer)
Log File Block
16 Logged Data (floating-point)
Figure 3-23: Log File Block Information
Interface
•
Number of inputs: 18 (on/off, open/close, and 16 inputs for logged data)
•
Input type: integer, integer, float (for 16 inputs)
•
Number of outputs: 0
•
Output type: none
This block has input capability. The block allows data from inputs to be logged to a file in multiple
column format. Each block from which data is to be logged corresponds with one column in the file.
3-22
Figure 3-24: Log file Block Configuration Dialog Box
The Restore the previous file name option, if checked, let you save the last used file name when you
stop the run-time. A new file name follows the saved file name will become the file name at the next
run. This option is useful only when the file name contains wildcard characters. Note the filename will
be saved only when you stop the running session properly.
You can specify the storage type (format) for the file as ASCII, binary float, byte, integer, or long
integer.
Figure 3-25: Select data storage type
Configuring Your System Functions With Task Designer
3-23
The update method can be either to append new data or to overwrite old data.
Figure 3-26: Select file update method
The delimiter between data in log file can be space, comma or tab.
Figure 3-27: Select the delimiter between data
You can include a header and comments at the beginning of your file if you desire. You can specify the
width, in characters, of each column of data, along with decimal point placement. For each input to be
logged, you can specify to which column number the input block’s data will be sent. When the file log
block is selected, all input block tag names are displayed with the default column number starting at
one (1).
You can change the column numbers by double clicking on each input tagname so that a dash (—) is
displayed instead of the column number. Double clicking again on each input’s tagname, starting at the
one you want to be logged as column one (1) in the file, will cause them to be numbered the way you
want. By pressing the Options button, you can specify each column’s width (in characters), desired
header information and decimal point format. For example, if the format is specified as “0.000”, the
output would be displayed as “9.876. If you specify the output as “0.0”, the output value would be 9.8.
The “Log On/Off” input, if connected, is used to control the logging of the input data. A nonzero input
allows input data to be logged, while a zero input suspends the data logging process. You can use this to
select the right data to be logged or to take one of every N readings.
The “Open/Close” input, if connected, is used to control the opening and closing of the log file. This
option only works with a wildcard ( * ) file name, since opening a file will trigger the block to use the
next file name based on the wildcard characters. The Advanced button will allow you to set up a total of
16 possible combinations for opening and closing the file (4 options for opening and 4 options for
closing).
3-24
Figure 3-28: Log file open/close methods
The four OPEN options are as follows:
A. Open at the beginning of the run: The file is opened immediately when the run is started.
B. Open after every N scans: GeniDAQ waits until N scans have passed to open the file.
C. Open if “File Control” is 1: “File Control” is a control signal to the Log File Block from another
block. The file is opened when this signal is 1. The file is closed when this signal is 0.
D. Open at N minutes from midnight: This option is good for doing a job that is repeated daily at the
same starting time. This allows the file to be opened at N minutes from midnight for the first fileopen. The subsequent files are controlled by file-close options.
The four CLOSE options are as follows:
A. Close at the end of the run: This is the same as the original file-close of version 1.0. The file is
closed immediately after the run is stopped.
B. Close after every N records: GeniDAQ waits until N records have been recorded to close the file.
C. Close if “File Control” is 0: “File Control” is a control signal to the Log File Block from another
block. The file is closed when the signal becomes 0. The next file is opened when the signal
becomes 1 again.
D. Close after every N minutes: Starting from the moment the first file is opened, this option allows the
file to be closed every N minutes. The next file is opened right after the previous file is closed, if
needed.
Configuring Your System Functions With Task Designer
3-25
In order to generate a different filename each time a file is created, some of the OPEN/CLOSE options
listed above require wildcard character(s) in the filename. The only wildcard character supported is the
# (pound sign). The “#” character can appear at any position in the standard DOS file name in the place
of a regular character. It will be replaced by a digit (0-9) to form a real file name. Use more “#”
characters together if you need a larger number of files. A wildcard such as “FILE###.LOG” can
generate 1000 file names from “FILE000.LOG” to “FILE999.LOG”. Make sure there are enough digits
there for your strategy. All wildcard characters must be together (contiguous).
Valid filename examples using wildcards:
MYFILE##.LOG
MY###R.LOG
MYFILE.###
MYFILE.L##
########.TXT
#RECORD.TXT
Invalid filename examples using wildcards:
MY#FILE#.LOG
# sign should be adjacent to each other
FILE##.##T
# sign should be adjacent to each other
•
Wiring In: Log File Block accepts input data as logged data, open/close control and data logging on/
off. This data is displayed in the block configuration dialog box.
•
Wiring Out: No output available
Note:
The \Strategy\LogFile example demonstrates how to use the Log File block. Please
refer to it for the detailed.
Working with DDE Blocks
You can use DDE blocks to share data with other applications, such as Excel or PLC’s DDE drivers.
DDE allows you to exchange data between GeniDAQ and other Windows applications.
There are two DDE blocks included in GeniDAQ, known as DDE Server, and DDE Client. In addition,
there are four blocks that have DDE capability built into them. These include the Analog Output,
Digital Input, Digital Output, and Temperature Measurement blocks. For these four blocks, DDE
capability is accessed through the dialog box that appears when you setup the blocks.
DDE Server Block
Block Information
Input 1 (integer/floating-point/string)
DDE Server
Block
Figure 3-29: DDE Server Block Information
Note:
3-26
The version of Advantech GeniDAQ CE doesn’t support DDE Server Block.
Interface
•
Number of inputs: 1
•
Input type: integer/float/string
•
Number of outputs: 0
•
Output type: none
The DDE Server block provides data from GeniDAQ to another Windows application. Since DDE
uses a broadcast-type communication, the DDE server will “publish” its data, and other applications
have the responsibility to find it and use it as they wish. When a block is connected to the DDE server
block, a link is established. Double clicking on the DDE server block will tell you the name of the
Service, Topic and Item. This information is what the other applications will need to locate a link that
you create in GeniDAQ.
Figure 3-30: DDE server block setting
The Service, in this case, is GeniDAQ. It is the program name of the Windows application that is
providing the data.
The Topic is the name of the particular file that is providing the data. In GeniDAQ, it would be the
name of your particular strategy (*.GNI). The extension (.GNI) is not needed here, only the name of
the strategy. For example, if your strategy were named DDEDEMO.GNI, the topic would be DDEDEMO. Keep in mind that an untitled strategy will not be able to provide data through DDE; it must be
a unique, saved filename.
The Item is the tagname of the block that is providing the data (DDES1, DDES2, DDEC1, etc.). Other
valid tagnames are AI1, DO3, etc. (first Analog input block, third digital output block, third elapsed
timer block, etc.). These I/O blocks have DDE capability built-in to their dialog boxes. It is important
to realize that these are the tagnames that GeniDAQ assigns to the particular blocks, and not the
description that the user can change.
These three fields are what the other Windows applications will be looking for. Usually, most other
Windows applications will separate the fields in the following manner:
Service|Topic!Item
Note that this is not a universal standard, only common practice. You should refer to the documentation for your particular Windows application to learn how DDE syntax is implemented for each
program.
•
Wiring In: Accepts the input data and pass this data to other windows DDE client applications. One
data source is allowed. If there is more than one input, “The input already connected” message will
be displayed.
•
Wiring Out: Passes the input data to a connected block directly.
Configuring Your System Functions With Task Designer
3-27
DDE Client Block
Block Information
DDE Client
Block
Output 1 (integer/floating-point/string)
Figure 3-31: DDE Client Block Information
Interface
•
Number of inputs: 0
•
Input type: none
•
Number of outputs: 1
•
Output type: integer/float/string
The DDE Client block receives data from another Windows application. This block will require that
you input the Service, Topic, and Item for the application that will be providing data to GeniDAQ. It
may also be necessary for other Windows applications to be set up to publish data. You should refer to
documentation provided with the application for this information.
Figure 3-32: DDE Client block
The DDE client block will receive data from another application, then input that data to the blocks that
are connected to the DDE client block via the connection wire. Any number of blocks can be connected to a DDE client block, and they can all use the data that the DDE client block is receiving from the
server application.
To setup a DDE client block, your other application should be running in the background. Place the
DDE client block on the Task Designer workspace, and connect it to the blocks to which you wish to
input data (from the DDE client block or from another application). Next, double click on the DDE
client block. This will invoke the DDE client dialog box. Within this dialog box, click on the Connect...
button. In the dialog box that appears (Create DDE Link), you should see your application name in the
box under Service. All of the applications that are currently running which have DDE capabilities
should be displayed in the Service box. It is possible that some applications will not be shown. If the
other applications are listed, click once on the Service that you wish to use, which will then place the
available Topics in the next box under Service Topics. Click once on the appropriate topic, which will
then place the available Items in the box under Topic Items. Clicking on the OK button after going
3-28
through this sequence will place the service, topic and item in the format
Service|Topic!Item
in the Create DDE Link dialog box. The link is then created and you can receive data from the other
application.
Figure 3-33: Create DDE links
If your other application’s Service, Topic and Item is not shown in the list boxes and you want to
exchange data with them, you must manually enter the Service, Topic and Item in the appropriate Text
Box within the DDE Client dialog box.
•
Wiring In: GeniDAQ will display a window with the error message “Cannot accept input”.
•
Wiring Out: Passes the input data from another DDE server Windows application to a connected
block.
Note:
The \Strategy\Dde example demonstrates how to use DDE Server and Client
blocks. Please refer to it for the detailed.
Note:
The current version of Advantech GeniDAQ CE doesn’t support DDE Client block.
Working with Tag Block and Virtual Tag
Tag Block
Block Information
Input 1 (integer/floating-point/string)
Tag
Block
Output 1 (integer/floating-point/string)
Figure 3-34: Tag Block Information
Configuring Your System Functions With Task Designer
3-29
Interface
•
Number of inputs: 1
•
Input type: integer/float/string
•
Number of outputs: 1
•
Output type: integer/float/string
The tag block is used to link a task block to a display control object or a virtual tag. GeniDAQ allows
you to create your own software tags. You can store some information in it and share it among multiple
tasks.
Description
Figure 3-35: TAG Block Configuration Dialog Box
This block is used to link a task block to a display item or a virtual tag. The value of a display control
item can be passed to other blocks. Virtual tags must be selected from within the TAG block. Once the
virtual tag is thus linked, its value can be applied to other task blocks.
•
Wiring In: TAG block accepts the input value from the display window.
•
Wiring Out: TAG block passes the values to connected block(s).
To link a task block to a display control object using a tag block:
1. Place a tag block on the Task Designer configuration area.
2. Right-click the tag block. The Tag Block configuration dialog box opens.
3. Select the display that contains the control object that you want to link in the Display/Virtual Tag
list box.
4. The Tag Name list box will show the control objects in the selected display that can be linked to
your tag block. Select the object from the list.
Virtual Tag
Virtual Tag is a powerful feature that provides the ability to create customized tags in Task Designer.
The virtual tag is created by Task Designer and stored in data center as other built-in blocks. The virtual
tags are globally available to all tasks, and can thus be used to share data among multiple tasks.
3-30
Add/Delete Virtual Tag
To create a virtual tag, select the Add/Delete Virtual Tag option from the Setup menu. A dialog box
will be displayed to add/delete virtual tags.
Figure 3-36: Virtual Tag Table
When the dialog box appears, a list of available virtual tags will be displayed in the dialog box. To add
a virtual tag, key in the name of the new virtual tag at the input line and press the Add button. A new
virtual tag will be added to the list of available virtual tags. After adding, you can press the OK button
to exit the dialog box. To Delete a virtual tag, click on the same menu and option as used to add a
virtual tag, select the desired virtual tag in the available listing and press the Delete button.
Using Virtual Tag in Task Designer
Once created, virtual tags are not displayed in or added to the Toolbox. It is an internal tag block. You
have to use and configure a TAG block to link with it. The configuration is displayed in the dialog box
below. Choose VIRTASK in the Task/Display field of dialog box and select the name of the virtual tag
in TAG field. The configuration is then complete. After linking with a TAG block, you can connect the
virtual tag with other blocks in Task Designer which have input and output capabilities. That is, virtual
tags can accept data from other blocks, such as an AI block, and output values to other blocks, such as
DO blocks.
Figure 3-37: Link Virtual Tag to Tag block
Configuring Your System Functions With Task Designer
3-31
Using Virtual Tag in Display Designer
Virtual tag values can be displayed on screen by configuring the display item to link with virtual tag.
Refer to the figure below. Choose VIRTASK in Task/Display field of the dialog box and select the
name of the virtual tag in the TAG field. The configuration is then complete.
Figure 3-38: Use Virtual Tag in Display Designer
Using Virtual Tag in BasicScript
Virtual tag is same as other blocks in BasicScript. You can get tag values and set tag values. The
difference between virtual tag and task blocks is that task block values do not read back to GeniDAQ
tasks from data center after setting new values. Virtual tag values can be read back to GeniDAQ tasks
from the data center. Because of this difference, you can retrieve data from BasicScript programs or
other applications for GeniDAQ tasks or displays.
Figure 3-39: Use Virtual Tag in BasicScript
To link a tag block to a virtual tag:
1. Place a tag block on the Task Designer configuration area.
2. Right-click the tag block. The Tag Block configuration dialog box opens.
3. Select the VIRTASK virtual task in the Display/Virtual Tag list box and click the OK button.
3-32
Working with Other Blocks
Timer Block
Block Information
Input 1 (integer)
Timer
Block
Output 1 (integer)
Figure 3-40: Timer Block Information
•
Number of inputs: 1 (reset)
•
Input type: integer
•
Number of outputs: 1
•
Output type: integer
Interface
Figure 3-41: Timer Block Configuration Dialog Box
Description
Accepts inputs (for reset purposes) and also allows outputs. Time can be absolute, or elapsed, and
resolution can be in ticks (0.1 seconds) or seconds. The time cycle range can be set from each minute to
each year. Output (elapsed or absolute time) can be sent to another block.
The Timer Block’s output is a long integer from 0 to 4294967295. This block is very useful for any
type of control strategy that involves time as an element.
The unit of the timer’s output value is in either seconds or ticks, depending upon the resolution that you
choose. Because of the constraints of the Windows environment, it is difficult to get better resolution
than that provided here.
Configuring Your System Functions With Task Designer
3-33
The output of the timer block is cyclic if one of the cycle options is chosen. For example, the output of
the timer block with “Elapsed time” type, “Second” resolution and “Minutely” cycle goes from 0 to 59
and back to 0. The same block with hourly cycle will output 0 to 3599 and back to 0.
The timer block can be reset by another block; a value of 1 input to the timer block reset will reset the
timer.
For a timer block with Time-Of-Day (absolute) type, the output doesn’t start from 0 at the beginning of
the run. It gives the number of seconds or 1/10 seconds since the boundary of the cycle, according to
the computer’s clock. For example, the output of an hourly timer (with seconds resolution) is 0 every
hour on the hour, then incremented to 1,2,3, .... ,3599, then back to 0 on the next hour. The boundary of
various timer cycles are listed as follows:
•
YEARLY: Starts from 0 at 00:00:00 AM January 1st every year.
•
MONTHLY: Starts from 0 at 00:00:00 AM the first day of each month.
•
WEEKLY: Starts from 0 at 00:00:00 AM on Sunday every week.
•
DAILY: Starts from 0 at 00:00:00 AM every day.
•
HOURLY: Starts from 0 every hour on the hour.
•
MINUTELY: Starts from 0 every minute on the minute.
It’s easy to calculate the actual time based on the cycle type. For example, the weekly timer outputs
86400 at 0:00 AM Monday morning and 518400 at 12:00 PM Friday midnight. You can use this value
as input to the User Program Block and use it to turn something off during the weekend or turn something on during the weekdays. You can also use several timers with different cycles to do more complicated timer control.
See TIMER.GNI (in the \Strategy\Timer directory) as an example of how to use the Timer Block. This
strategy makes 3 beeps at 0th, 2nd and 4th second of every minute for the first 5 minutes of every hour
Monday through Friday.
•
Wiring In: Timer blocks accept input data to reset timer(s).
•
Wiring Out: Timer blocks output elapsed or absolute time values (a long integer), to a connected
block.
Time Stamp Block
Block Information
Time
Stamp
Block
Output 1 (integer)
Figure 3-42: Time Stamp Block Information
3-34
•
Number of inputs: 0
•
Input type: none
•
Number of outputs: 1
•
Output type: string
Interface
Figure 3-43: Time Stamp Block Configuration Dialog Box
Description
This block has output capability. The current time may be assigned to the display or to a log file by
connecting this block’s output to a log file or Numeric/string display item.
Different output formats are allowed, and these outputs are in the form of a string.
•
Wiring In: No wiring input connection. “Cannot accept input” message will be displayed.
•
Wiring Out: Time Stamp block outputs the current time to connected block(s). There are multiple
time formats for selection.
Figure 3-44: Time Stamp Output Format
Ramp Block
Block Information
Reset (integer)
Ramp
Block
Hold (integer)
Output 1 (floating-point)
Figure 3-45: Ramp Block Information
•
Number of inputs: 2 (reset, hold)
•
Input type: integer, integer
•
Number of outputs: 1
•
Output type: float
Configuring Your System Functions With Task Designer
3-35
Interface
Figure 3-46: Ramp Block Configuration Dialog Box
•
Start Value: A floating point value at which the ramp will start.
•
Stop Value: A floating point value at which the ramp will finish. Can be above or below the Start
value.
•
Increment/Decrement: Each step up/down the ramp will be equal to this value.
•
Reset from Block: Any digital type block used to apply a digital high/low to reset/start the ramp. A
digital high applied to this input resets the ramp and stops ramping. A digital low allows ramping to
occur. No reset input is treated as a low input.
•
Hold from Block: Any digital type block used to hold the ramp at the current value. A high digital
signal applied to this input stops ramping at the current value. A low applied to this input will
enable/resume ramping. No hold input is treated as a low input.
Description
This block allows input and output. A ramp of floating point values may be generated by using this
block. By connecting a high digital value to the reset input, the ramp can be reset to its starting value.
By applying a high digital value to the hold input, the ramp may be temporarily held at the current
value. The rate of increase/decrease of the ramp is proportional to the sample rate (scan task period)
selected.
3-36
•
Wiring In: Ramp blocks accept input data as Reset from or Hold from data and use the data in block
configuration.
•
Wiring Out: Ramp blocks output generated analog values to connected blocks.
Beep Block
Block Information
Input 1 (integer)
Beep
Block
Figure 3-47: Beep Block Information
•
Number of inputs: 1
•
Input type: integer
•
Number of outputs: 0
•
Output type: none
Interface
Figure 3-48: Beep Block Configuration Dialog Box
Description
This block accepts one input. It provides alarm output to the speaker in the PC or an external speaker.
Digital blocks are used as input.
•
Wiring In: Beep blocks accept digital input data to trigger sound alarms.
•
Wiring Out: Beep blocks pass the input data to connected block(s).
Configuring Your System Functions With Task Designer
3-37
Sound Block
Block Information
Input 1 (integer)
Sound
Block
Figure 3-49: Sound Block Information
•
Number of inputs: 1
•
Input type: integer
•
Number of outputs: 0
•
Output type: none
Interface
Figure 3-50: Conditional Wavefile Block Configuration Dialog Box
Description
This block has input capability. It accepts a value between zero (0) and seven (7) from another block,
each value providing capability to select a wavefile to be played via a sound card during runtime.
When this block is double clicked on, a dialog box will appear displaying all wavefiles currently
installed.
3-38
•
Wavefile Name: Specify the wavefile to be selected with the currently highlighted Input Value.
Enter the full path, or Browse to locate the desired wavefile.
•
Wiring In: This block accepts input values between zero (0) and seven (7) from another block, each
value providing capability to select a wavefile to be played via a sound card during runtime
•
Wiring Out: No output available
Note:
The current version of Advantech GeniDAQ CE does not support Sound Block.
System Control Block
Interface
•
Number of inputs: 1
•
Input type: integer
•
Number of outputs: 0
•
Output type: 0
Figure 3-51: System Control Block Dialog Box
Description
This block has input capability. There are three functions provided by this block. One is to start/stop/
pause/resume/lock/unlock/login/logout/close/exit system execution. Second is to switch between
multiple display windows. Third is to start/stop/Run once system execution.
Field Description
•
Function: You can set the System Control block to control system operation, task operation or to act
as a display switch.
•
Action: If you select Action mode, you can specify Start, Stop, Pause, Resume, Lock, Unlock,
Login, Logout, Close, Exit or Refresh in this field. If you select Display switching mode, you must
specify the window to switch. If you select Task control mode, you must specify the task to control.
•
Task Control Only: If you select Task control mode in the Function field, you can specify Start/
Stop/Run once in this field.
Note:
•
You have to enable “Inactive” option in the Setup/Task Properties menu.
Wiring In: System control block accepts data as trigger for the specified operation.
Configuring Your System Functions With Task Designer
3-39
Summary
Task Designer uses a data flow programming model that frees you from the linear architecture of textbased languages. With GeniDAQ, you can learn and build a simple application within a few hours
without worrying about the many syntactical details of conventional programming.
In addition to the intuitive programming model, GeniDAQ fully integrates BasicScript engine in its
kernel to meet your specific needs. With BasicScript engine and the GeniDAQ environment, you can
create code to execute BasicScript commands. It allows you to access and share data with other
applications, such as Microsoft Access, Microsoft Excel, etc. In addition, you can also control
GeniDAQ’s operation, including task start/stop and display switching. It saves development and
learning time. Please refer to Chapter 10, Advanced BasicScript Programming for Your Specific Needs
for detailed information.
3-40
4
Configuring Your
Display View With
Display Designer
Overview
Display Designer provides an object-based development environment that you use to create your
operator display panel. You can create a panel that is similar to test equipment or industrial process
displays. You can also attach a bitmap background to customize your display. The operator display
allows you to monitor, supervise, and control your process during runtime. When complete, the panel
can use meters, bar graphs, waveform displays, chart recorders, buttons, numeric readouts, and LED
indicators.
Advantech GeniDAQ provides multiple windows so you can view your process in different formats. You
can divide the process into logical segments with summary screens showing the complete process, and
other screens showing detailed parts of the process.
In addition, Advantech GeniDAQ also provide graphical tools to draw rectangles, circles, segments, and
polygons. These objects or cells can be linked to a tag value. They can change color according to the tag
value. They can also be grouped together to make a single object. You can use them to draw pumps,
valves or other industrial symbols.
Contents
•
Working with the display window
•
Working with objects
•
Working with display objects
•
Working with control objects
•
Working with cell objects
•
Summary
Working with the Display Window
Advantech GeniDAQ allows you to create multiple displays. The number of displays depends on the
system resources. You can switch to or toggle between the displays using the menu button object or
BasicScript’s Display command. When you create a new display window, you will be required to define
certain properties for that window such as pop-up placement, default size, title bar icon and window
button options. The elements of a display window are as shown below.
The elements of display windows include:
4-2
Window
Button
Title Bar Icon
Display
Toolbar
Display
Toolbox
Display Design Area
Figure 4-1: Display Designer Screen
Configuring Your Display View With Display Designer
4-3
Display Toolbox
Binary B utton Control
Conditional B utton Control
Num eric Control
Slider Control
Num eric String
Bar Graph D isplay
Trend G raph Display
XY G raph D isplay
Text String Display
Rectangle C ell
M enu B utton Control
Knob Control
Indicator Display
Conditional Text D isplay
Analog M eter Display
Historical Trend Display
Conditional B itm ap D isplay
G roup B ox D isplay
Rounded R ectangle Display
O val C ell
Polygon Cell
Line Cell
Event Log D isplay
Figure 4-2: Display Designer’s Design Toolbox
•
For more information about the Historical Trend Display, refer to Chapter 6, Historical Trending
System.
Creating and Configuring a Display
When you create a new strategy, GeniDAQ creates a display by default. You can create more displays by
selecting File | Add/Delete | Add Display from the main menu or you can delete a display by switching
to the display and selecting File | Add/Delete | Delete Display from the main menu.
4-4
Figure 4-3: Adding and Deleting Displays
You can also add and delete displays by choosing the Add Display and Delete Display icons on the
Display Designer’s toolbar:
Add Display icon
Delete Display icon
Figure 4-4: The Add Display and Delete Display Toolbar Icons
After you create a new display window, you should configure the runtime properties of the display
windows. Switch to the display window and then click on the Setup | Display Properties… menu. A
Display Properties configuration dialog box appears:
Configuring Your Display View With Display Designer
4-5
Figure 4-5: Display Properties Window
You can also open the Display Properties configuration window by clicking on the Display Properties
toolbar icon:
Display Properties Icon
Figure 4-6: Display Properties Icon on the Task Designer Toolbar
Field Descriptions
•
Title: Type the name of the display that you want to appear in the window’s title bar.
•
Style: Choose the style of the display window – either Overlap or Replace.
•
Default state: Choose the default state of the window – either Normal, Maximize or Hide
Click OK to save your configuration changes or click Cancel to close the Display Properties dialog box
without saving your changes.
Attaching/Detaching a Background Bitmap
You can import a bitmap file as a background picture for a display window. Switch to the display
window and select File | Attach Bitmap from the main menu. The following dialog box appears. A
standard Windows Open dialog appears to enable you to select a bitmap from your computer’s drives.
To attach a background bitmap:
1. Select File | Attach Bitmap from the main menu.
2. A standard Windows Open dialog box loads. Select the bitmap that you want to add to your display
and click the Open button.
4-6
Figure 4-7: Select the Bitmap to Attach
3. The bitmap will appear, aligned with the top-left corner of your display window.
Figure 4-8: Attached Bitmap will Appear in Display Window
Note:
A previously attached bitmap picture can be removed by choosing File | Detach
Bitmap from the main menu.
Working with Objects
Once you have created a new display window in your strategy, you are ready to populate it with display
objects, control objects and cell objects. GeniDAQ provides an intuitive environment for editing and
arranging these graphic objects.
Configuring Your Display View With Display Designer
4-7
Populating a Display with Objects
To add an object to your display window:
1. The Display Designer toolbox should be visible at the top of your screen. If it is not showing, select
View | Toolbox from the main menu and make sure it is checked.
2. Click the object in the toolbox that you want to add. The toolbox item will appear as selected and
your cursor will change to appear as a cross-hair.
3. Click the Display Designer configuration area. The oject will be appear in the configuration area.
Selecting and Sizing Objects
When you click an object in your configuration area, several little boxes will surround it. These boxes
are called “handles”. You use these handles to resize the object. Click and drag the handles until the
object is the size and shape that you want. Handles on the corners of the object enable you to size the
object in both horizontal and vertical directions, while clicking the handles on the sides of the object
enable sizing in only one dimension.
Duplicating Objects
If you want to make a duplicate copy of an object that appears in the Display Designer window, select
the object by clicking it. Select Edit | Copy from the main menu and then select Edit | Paste. A new
object will appear in the window.
Cutting Objects
To cut objects and then paste them into other displays that you have created for the strategy, complete
the following procedure:
1. Select the object that you want to cut in the Display Designer window.
2. Select Edit | Cut from the main menu.
3. Select Window on the main menu and then choose the display to which you want to paste the object.
4. Select Edit | Paste from the main menu.
Moving Objects
If you want to move an object that appears in the Display Designer window, select the object by clicking
it. Use keyboard or mouse to move it. If you need finer tuning for arranging display items, click View |
Grid menu to disable the grid function. These grid lines will be the bases of display item arrangement.
Arranging Objects
You can layer the objects in your window by positioning the objects in front or behind each other. Also
you can use grid lines to arrange objects. For example, consider the following display that shows a
conditional text display item overlapping another conditional text display item:
4-8
Figure 4-9: Example of Send to Back/Bring to Front
To change the z-order of two overlapping display items:
1. Select the object whose z-order you want to change.
2. Select Edit | Bring to Front from the main menu to make the selected object appear “on top” of the
other objects. Select Edit | Send to Back to make the selected object appear “behind” the other
objects.
The display will now appear as follows:
Figure 4-10: Example of Send to Back/Bring to Front
Configuring Your Display View With Display Designer
4-9
Working with Display Objects
The display objects are used to display data. They include
•
Indicator display
•
Numeric/String display
•
Conditional Text display
•
Bar Graph display
•
Analog Meter display
•
Trend Graph display
•
XY Graph display
•
Conditional Bitmap display
•
Text String display
•
Group Box display
General Guidelines for Using Display Objects
Display objects that are available for inclusion in your display appear on the display toolbar. To add a
display object to your display, click the toolbar icon (it will appear as being selected) and then click the
display area. The display object will appear in the display window at its default size. You can then drag
the object’s handles to resize it. Alternatively, you can click the display object and then drag a region in
the display window where you want the display object to appear. Using this second method will size the
object to your preference.
Once the display object is in the display window, you must configure its properties and choose its input
source. Either double-click or right-click the display object and the display object’s configuration dialog
box will open.
Choosing Input for Display Objects
You must specify an input source for all display objects. This is normally from a task object that you
have previously created in the Task Designer. The following example illustrates the configuration of an
input source (from a Temperature Measurement object in the Task Designer) for the Analog Meter
display. The process of configuring input sources for other display objects is the same.
To configure a display object’s input source:
1. Switch to the Task Designer window by choosing Window | Task Designer:TASK1 from the main
menu.
2. Place a Temperature Measurement object on the Task Designer window.
3. Switch to the Display Designer window by choosing Window | Display Designer:DISP1 from the
main menu.
4. Place an Analog Meter display object on the Display Designer window. Right-click the object to
open the Analog Meter Display Object configuration dialog box.
5. Click the Select button. The Connection configuration dialog opens that allows you to select the
input source for the display object. The list boxes in the Connection dialog box will show you the
available input sources in your system (see the following figure for more information):
•
4-10
Task/Display/Virtual: Select the task or display name where the input is located.
•
TagName: Select the tag name that provides the input source.
•
Channels: Select the channels for the input source.
Figure 4-11: Connection Configuration Dialog Box
Indicator Display Item
Figure 4-12: Indicator Display Item in Workspace Window
Configuring Your Display View With Display Designer
4-11
Description
An LED indicator, displaying the output state of a tagged digital block, may be simulated here by
specifying a digital tag name from the Task variable. A digital 1 turns on the indicator and a 0 turns it
off. The color and size of the indicator may be chosen.
Configuration Dialog Box
Figure 4-13: Indicator Display Item Configuration Dialog Box
Field Description
•
Input from: The Indicator Display Item may be drawn and interfaced to a Task block variable with a
certain tag name. When in associated configuration dialog box (double-click on the Indicator Display
Item), you must first choose which Task block’s data you would like to display. You can select the
available icon blocks by pressing the select button and setting the appropriate task/display name, tag
name and channel name. The tagged block’s dynamic value is displayed during runtime.
•
Style: This field is used to select the graph for indicator display. There are two kinds of graphs:
Rectangle, Round or Ellipse.
•
Color for On/Off State: This field is used to select the colors for On/Off value of indicator display.
GeniDAQ provides 16 colors to choose from.
Numeric/String Display Item
Figure 4-14: Numeric/String Display Item in Workspace Window
4-12
Description
The numeric display item displays output data from the Task block during runtime.
A numeric/string display may be drawn and interfaced with a Task block variable with a certain tag
name. The size of the display may be chosen. The data format can be set as floating point (real), integer,
or string. You can also set the display format, including the number of digits and location of the decimal
point (for floating point format). In addition, you can choose the font, size and color of the numbers or
text to be displayed. Justification is also possible.
Configuration Dialog Box
Figure 4-15: Numeric/String Display Item Configuration Dialog Box
Field Description
•
Input from: The Numeric/String Display Item may be drawn and interfaced to a Task block variable
with a certain tag name. When in associated configuration dialog box (double-click on the Numeric/
String Display Item), you must first choose which Task block’s data you would like to display. You
can select the available icon blocks by pressing select button and setting the appropriate task/display
name, tag name and channel name. The tagged block’s dynamic value is displayed during runtime.
•
Data Type: This field is used to select the data type of a display value. The type can be floating point
(real), integer or string.
•
Display Format (precision): If you select the data type to be floating point or integer, then you can
set the display format for output value. For example, set the format to be “0.00”
•
Justification: You can use this setting to adjust the position of display output in the display field.
•
Foreground color/Background color: This field is used to select the Foreground color/Background
color of numeric/string value. GeniDAQ provides 16 colors to choose from.
•
Update rate: The Update rate is a divisor that allows the Numeric/String Display block to have a
different effective scan rate than the rest of the Task. This is useful if, for example, your Task is
running at 100 Hz, but you only want to display data at a rate of 20 Hz. For this example, you would
set the Update Rate to 5 (100 divided by 5 (the update rate) gives an effective scan rate of 20 Hz).
For this example, only one in five samples would be displayed; the others would be ignored.
Configuring Your Display View With Display Designer
4-13
Conditional Text Display Item
Figure 4-16: Conditional Text Display Item in Workspace Window
Description
This display item has input and output capability. It accepts a value between zero (0) and seven (7) from
a Task block, each value providing capability to select text to be displayed. In addition, the string may
be output to a block accepting a string as input, such as to the RS-232 block. When this display item is
double-clicked upon, a dialog box will appear displaying all text currently installed.
Configuration Dialog Box
Figure 4-17: Conditional Text Display Item Configuration Dialog Box
4-14
Field Description
•
Text: Specify the Text file to be selected corresponding with the currently highlighted Input Value.
•
Foreground/Background color: Specify the Text and Background color for the currently highlighted
Input Value.
•
Alignment: Specify the Text Alignment for the currently highlighted Input Value.
Bar Graph Display Item
Figure 4-18: Bar Graph Display Item in Workspace Window
Description
The Bar graph display item allows you to view output data from the task designer icon block during
runtime.
Configuration Dialog Box
Figure 4-19: Bar Graph Display Item
Configuring Your Display View With Display Designer
4-15
Field Description
•
Input from: The bar graph may be drawn and interfaced to a Task Block variable with a certain tag
name. The color and size of the bar graph may be chosen. When in associated configuration dialog
box (double-click on the bar graph), you must first choose which Task Designer block’s data you
would like to display. You can select the available icon blocks by pressing select button and setting
the appropriate task/display name, tag name and channel name. The tagged block’s dynamic value is
displayed during runtime.
Figure 4-20: Connect Bar Graph display with Task
You can choose the bar’s color, the range, the orientation (vertical or horizontal), and the style of the bar
graph. The style section is a series of check boxes allowing you to choose whether you see an outer
frame, bordered bar, or whether or not you want numbers or tick marks to be displayed.
4-16
•
Style: This field is used to specify the graph style as filled bar or moving mark.
•
Bar Color: This field is used to specify the color of graph. There are 16 colors provided in
GeniDAQ.
•
Range: This field is used to specify the value range that is displayed by the bar graph.
•
Orientation: This field is used to specify the orientation of bar graph motion. That is, you can set the
bar graph to move either vertically or horizontally.
•
Options: This field is to enable/disable the display of outer frame, boarded bar, Y numbers and tick
marks on the bar graph.
Analog Meter Display Object
Figure 4-21: Analog Meter Display Object in Workspace Window
Description
The Analog Meter display object displays output data from the Task block during runtime in the form of
an analog meter. The Analog Meter may be drawn and interfaced to a Task block variable with a certain
tag name. The number, color and size of the color segments may be chosen. When in the associated
configuration dialog box (double-click on the Analog Meter), you must first choose which Task block’s
data you would like to display.
Available icon blocks are displayed in a list box labeled “Input from”. The tagged block’s dynamic value
is displayed during runtime. You can choose the segment color, range, orientation (vertical or horizontal), and the initial Analog Meter value. Up to five segments can be specified. The style section is a
series of check boxes allowing you to choose whether you see an outer frame, bordered bar, or whether
or not you want numbers or tick marks to be displayed.
Configuring Your Display View With Display Designer
4-17
Configuration Dialog Box
Figure 4-22: Analog Meter Display Object Configuration Dialog Box
Field Description
4-18
•
Show Ticks: Specify whether Ticks will be displayed.
•
Start Ticks: Specify the Ticks start number.
•
End Ticks: Specify the Ticks ending number.
•
Number of Ticks: Specify how many total Ticks
•
Meter Span: Specify the total numeric span of the meter.
•
Orientation: Specify the meter orientation (Up, Down, Right, or Left).
•
Initial Value: Specify the value to which the meter needle will point upon Runtime Startup.
•
Number Of Segments: Specify the total number of color segments (up to five) for the span of the
meter.
•
Segment 1-5 Start, End, and Color: For each enabled meter segment, specify the numeric start, end,
and color of the meter segment.
Trend Graph Display Item
Figure 4-23: Trend Graph Display Item in Configuration Window
Description
A Trend Graph may be drawn and interfaced with one or many Task Block variable(s) with a certain tag
name or names. The color and size of the graph may be chosen. It can display data from any number of
Task Blocks on the Y-axis, against time on the X-axis. It can also display data from two Task Blocks on
its axes.
The Update rate is a divisor that allows the Trend Graph Display item to have a different effective scan
rate than the rest of the Task. This is useful if, for example, your Task is running at 100 Hz, but you only
want to display data at a rate of 20 Hz. For this example, you would set the Update Rate to 5 (100
divided by 5 (the update rate) gives an effective scan rate of 20 Hz). For this example, only one in five
samples would be displayed; the others would be ignored. Using the update rate option in this way will
alleviate a flickering effect when using a very fast scan rate.
The Trend graph allows you to plot data from two separate blocks against each other. The colors of the
trace and background can be chosen, as well as the length of the trace. Using a trace with a smaller
number of points will use less machine memory, and your display will run much more efficiently.
The graph style can be selected, giving you flexibility in your display, allowing you to show ticks and/or
numbers on the axes. In addition, ranges for both axes can be selected. This permits you to make your
display any size or scale.
Note:
Keep in mind that when using an X-axis with a large scale (i.e. long time spans),
and especially if you are displaying more than one trace, memory requirements are
increased. All data points that are displayed must reside in memory; the more data
points you display, the more memory you will need.
Configuring Your Display View With Display Designer
4-19
Configuration Dialog Box
Figure 4-24: Trend Graph Display Item Configuration Dialog Box
Field Description
4-20
•
Type: Select the kind of trend graph that you want to use in your display
•
YT Trend Graph: For the YT Trend graph, you can choose the colors and the ranges that will be
displayed. You next need to choose which Strategy Editor block’s data you would like to display,
corresponding with your chosen trace colors. Available icon blocks are displayed in a list box labeled
“Input Blocks”. Any number of blocks can be interfaced for display in one graph (however, eight
seems to be the practical limit). By double clicking on each desired icon block tagname, tagnames
are selected for graphical display. When blocks are selected, an asterisk appears to the left of the
tagname. As you select tagnames for display, you can choose separate trace colors for each tagname.
The color for a trace is displayed and can be changed each time a selected tagname is highlighted
with the mouse. You can also change the style of your graph. The style section is a series of check
boxes displaying available options.
•
Background Color: Select the background color
•
Input from: Select the data source
•
Trace Color: Select the color of the data line
•
Style: Select the optiosn that you want to use the customize the appearance of your trend graph
display
•
Range of x axis: Enter the maximum and minimum values for the x (i.e., horizontal) axis
•
Range of y axis: Enter the maximum and minimum values for the y (i.e., vertical) axis
•
Update Rate: Enter the update rate (in seconds)
XY Graph Display Item
Figure 4-25: XY Graph Display Item in Workspace Window
Description
The XY graph allows you to plot data from two separate blocks against each other. The colors of the
trace and background can be chosen, as well as the length of the trace. Using a trace with a smaller
number of points will use less machine memory, and your display will run much more efficiently. The
XY Graph displays data from two Strategy Blocks on its axes.
Configuration Dialog Box
Figure 4-26: Trend Graph Display Item Configuration Dialog Box
Configuring Your Display View With Display Designer
4-21
Field
•
X/Y axis from: The XY graph allows you to plot data from two separate blocks against each other.
You can change the input data using the CHANGE button.
•
Trace/Background color: This field is used to specify the color of trace and background for a given
XY display.
•
Size of the Trace Buffer: This field is used to specify the size of the trace buffer for a given XY
display.
Note:
Keep in mind that when using an X-axis with a large scale (i.e. long time spans),
and especially if you are displaying more than one trace, memory requirements are
increased. All data points that are displayed must reside in memory; the more data
points you display, the more memory you will need.
•
Style: This field is used to enable/disable several display items in an XY or YT Graph Display chart,
including X numbers, Y numbers, X ticks, Y ticks and outer frame.
•
Range of X/Y axis: These fields are used to specify the maximum and minimum value ranges of X
and Y display data.
•
Update rate: The Update rate is a divisor that allows the Numeric/String Display block to have a
different effective scan rate than the rest of the Task. This is useful if, for example, your Task is
running at 100 Hz, but you only want to display data at a rate of 20 Hz. For this example, you would
set the Update Rate to 5 (100 divided by 5 (the update rate) gives an effective scan rate of 20 Hz).
For this example, only one in five samples would be displayed; others would be ignored.
Conditional Bitmap Display Item
Figure 4-27: Conditional Bitmap Display Item in Workspace Window
Description
This display item has input capability. It accepts a value between zero (0) and seven (7) from a Task
block, each value providing capability to select a bitmap file to be displayed during Runtime. When this
display item is double-clicked upon, a dialog box will appear displaying all bitmaps currently installed.
4-22
Configuration Dialog Box
Figure 4-28: Conditional Bitmap Item Configuration Dialog Box
Field Description
•
Bitmap File Name: Specify the bitmap file to be selected corresponding with the currently highlighted Input Value. Enter the full path, or Browse to locate the desired Bitmap file. For setting corresponding the bitmap filename, you have to select the related input value and select bitmap file, then
press the ENTER button to configure it.
Text String Display Item
Figure 4-29: Text String Display Item in Workspace Window
Configuring Your Display View With Display Designer
4-23
Description
A text string label may be entered for display purposes only. No interface to Task blocks is provided.
Within the Text String Display Item, you can choose the font, color and size of the displayed text by
pressing the Font... button in the Text String Display Item dialog box.
Configuration Dialog Box
Figure 4-30: Text String Display Item Configuration Window
Field Description
•
Text: This field is used to input desired text for display.
•
Background Color: This field is used to specify the background color of this text field. If you want to
specify the text color, you can assign it by disabling Auto Font Sizing and selecting the Font...
button.
Group Box Display Item
Description
The group box display item is used to group together display objects.
Configuration Dialog Box
Figure 4-31: Group Box Display Item Configuration Dialog Box
Field Description
•
4-24
Border Width: Specify the width of the group box when displayed in the Display Designer window.
Event Log Display Item
Interface
•
Number of inputs: 0
•
Input type: none
•
Number of outputs: 0
•
Output type: none
Figure 4-32: Event Log Display Item Dialog Box
Description
The Event Log Display Item is used to show all alarms and events. It should be used with the Alarm Log
block and enable the Event Log option in Setup | Runtime Preference menu. Refer to the Alarm Log
Block section. You can double-click on any alarm entry to acknowledge the message. The message’s
color will change from red to black and an acknowledgement message will appear in the window.
Field Description
•
Text color: Set the text color
•
Backgound color: Set the background color
Configuring Your Display View With Display Designer
4-25
Working with Control Objects
Control objects are used to supervise or control your process. The objects include
•
Binary button control
•
Conditional button control
•
Menu button control
•
Numeric control
•
Knob control
•
Slider control
Connecting a Control Object to a Task Block
You can connect a control object to a block in a task window through a tag block. For example, you can
use a binary button control to open or close a valve through a digital output block. Alternatively, you can
use a knob to control an analog output value. The following example shows a Binary Button control
object being connected to a Rectangle Drawing block:
To connect a control object to a task block:
1. Place a Binary Button control object on the Display Designer window and a Task Block on the Task
Designer window
2. Switch to the Task Designer window. Right-click the Tag Block.
3. The Tag Block configuration dialog box opens. In the Display/Virtual Tag combo box, select the
display that controls the binary button. Select BBTN1 in the Tag Name combo box.
Figure 4-33: Connecting a Control Object to a Task Block
4-26
Connecting a Control Object to a Display Block
You can connect a control object to a display block.
Restore the Previous Stop Value
For control objects, GeniDAQ provide a “Restore the previous stop value” function. This function is
used to save the values of control objects when the system stops. These values will then be restored
when the system restarts. This function is included in the Binary Button, Conditional Button, Numeric,
Knob and Slider controls.
Privilege Levels
In order to avoid unintentional or unauthorized operations which may affect system stability, GeniDAQ
System Administration provides privilege control and password protection. Password protection offers
built-in log-on with up to 255 levels of assignable access, providing extensive control for password
access and conditional operations. To learn more about privilege level protection, please refer to
Chapter 9, Runtime and Security System chapter.
Binary Button Control Display Item
Figure 4-34: Binary Button Control Display Item in Workspace Window
Description
A binary button control display may be drawn and interfaced to a Task Block variable with a certain tag
name. The size of the display may be chosen. This display item is an output from the display. The button
is pressed by use of the mouse, and a digital 1 or 0 is sent to the tagged digital Task Block. The Button
Display may also be toggled by use of the ENTER key, if the focus is currently on the Button. (The
“focus”, a standard Windows term, refers to the display item which can currently be controlled by the
keyboard). Focus may be shifted from one display item to another using the TAB key. In addition, a “hot
key” may be specified to activate the button without changing the focus. This is done by changing the
Keyboard Mapping parameter in the dialog box. Using control buttons, Supervisory Control can be
achieved.
The size and properties of the font used in the button text can be changed in this block by pressing the
Font... button in the Binary Button Display Item dialog box.
Configuring Your Display View With Display Designer
4-27
Configuration Dialog Box
Figure 4-35: Binary Button Display Item Configuration Dialog Box
Field Description
4-28
•
Tag: This field is used to specify the tag name of the binary button control display item. The tag
name is used to represent the output value of this button. If you want to access this button value, you
can configure a TAG in task designer to link with display number and tag name and this button value
will be available for other blocks in task designer.
•
Label: This field is used to specify the meaning of the button. The label will be displayed at the front
of the button. You can change it using any alphanumeric characters. The maximum number of
characters is 30.
•
Operating Style: This field is used to specify the operating style of binary button to be On-Off,
momentary or radio button. For On-Off style, the button will act as a switch to turn on or turn off and
output digital 1 or 0 (based on the output value field setting). For Momentary style, the button will
act as a pulse; that is it will return to depressed status immediately after the button is pressed. The
button will output a down value and an up value immediately (based on the output value field
setting). For Radio Button style, the button will be exclusive from other binary buttons. If the button
is pressed down, other related buttons will come back up. In this style, you have to configure the
related buttons by double clicking buttons in the “Buttons to eject when pressed” field. A start
character will pop up at the front of related buttons. The output values of Radio Button style are the
same as the On-Off style.
Figure 4-36: Configure Operating Style to be Radio Button
•
Keyboard mapping: This field is used to set up the linkage between buttons and keywords. You can
configure function key (‘F2’ to ‘F8’) or alphabetic character (‘A’ to ‘Z’) as a shortcut key for this
button.
•
Privilege level: This field is used for protection of system control. The privilege level is from 0 to
255, with larger numbers having the higher privilege. For example, if the privilege level of a button
is 100, then the user’s privilege must be larger than or equal to 100 to press this button.
•
Label Color: This field is used to select the normal label color and the depressed label color of the
button. VisiDAQ provides 16 colors from which to select.
•
Output value: This field is used to configure the output value of a button. There are two output
modes for your selection. You can select “Up = 0 and Down = 1” or “Up = 1 and Down = 0”.
•
Options: You can enable/disable these option fields as you want.
•
Restore the previous stop value: This field is used to save the value of the control display at system
stop. This value will be restored at the next system start.
Conditional Button Control Display Item
Figure 4-37: Conditional Button Control Display Item in Workspace Window
Description
The Conditional Button Display Item has both input and output capability. The output may be interfaced
to a Task Block variable with a certain tag name. The button is pressed by use of the mouse, and a digital
1 or 0 is sent to the tagged digital Task Block. The Conditional Button Display may also be toggled by
use of the ENTER key, if the focus is currently on the Conditional Button. The “focus”, a standard
Windows term, refers to which display item currently can be controlled by the keyboard. Focus may be
Configuring Your Display View With Display Designer
4-29
shifted from one display item to another using the TAB key. Using conditional buttons, Supervisory
Control may be achieved. The input may be interfaced to a Task Block variable with a certain tag name
and is used for controlling the button’s status from the Task (by sending a digital 1 or 0) instead of with
the mouse. The size of the display may be re-sized with the mouse.
The size and properties of the font used in the button text can be changed in this block by pressing the
Font... button in the Conditional Button Display Item dialog box.
Configuration Dialog Box
Figure 4-38: Conditional Button Control Configuration Dialog Box
Field Description
4-30
•
Tag: This field is used to specify the tag name of the binary button control display item. The tag
name is used to represent the output value of this button. If you want to access this button value, you
can configure a TAG in task designer to link with display number and tag name and this button value
will be available for other blocks in task designer.
•
Label: This field is used to specify the meaning of the button. The label will be displayed at the front
of the button. You can change it using any alphanumeric characters. The maximum number of
characters is 30.
•
Input from: The Conditional Button Display Item may be drawn and interfaced to a Task Block
variable with a certain tag name. When in associated configuration dialog box (double-click on the
Conditional Button Display Item), you must first choose which Task block’s data you would like to
display. You can select the available icon blocks by pressing select button and setting the appropriate
task/display name, tag name and channel name. The tagged block’s dynamic value is displayed
during runtime.
•
Label Color: This field is used to select the normal label color and the depressed label color of the
button. GeniDAQ provides 16 colors from which to select.
•
Privilege level: This field is used for protection of system control. The privilege level is from 0 to
255, with larger numbers having the higher privilege. For example, if the privilege level of a button
is 100, then the user’s privilege must be larger than or equal to 100 to press this button.
•
Output value: This field is used to configure the output value of a button. There are two output
modes for your selection. You can select “Up = 0 and Down = 1” or “Up = 1 and Down = 0”.
•
Options: You can enable/disable these option fields as you want.
•
Restore the previous stop value: This field is used to save the value of the control display at system
stop, and the value will be restored at next system start.
Menu Button Control Display Item
Figure 4-39: Menu Button Control Display Item in Workspace Window
Description
This menu item is used while the system is in Runtime mode. There are two functions provided by this
menu button. One is to start/stop/halt/resume system execution. Another is to switch between multiple
display windows.
Configuring Your Display View With Display Designer
4-31
Configuration Dialog Box
Figure 4-40: Menu Button Display Item
Field Description
•
Function: You can set the menu button to act as a display switch or to control system/task operation. If you select ‘Action’ mode, you can stop, pause, resume, close, lock or exit system operation
while in Runtime mode. In the ‘Action’ mode, you can also refresh the display.
If you select ‘Display switching’ mode, you can specify display window names (for example,
“DISP1”) in this field and use this button to switch between displays while in Runtime.
For “Task Control” mode, you can specify Start/Stop/Run once. Note that you should first enable the
“Inactive” mode in Setup/Task Properties menu before you can apply the “Task Control” mode.
Numeric Control
Figure 4-41: Numeric Control Display Item in Configuration Window
4-32
Description
A numeric-type control may be drawn and interfaced to control a Task block variable with a certain tag
name. The size of the display may be chosen. This display item is used as an output from the keyboard
or mouse; data is to be sent to a Task block variable by an operator who specifies the data. Using this
method, Supervisory Control may be achieved. The data format can be set to integer or real. The display
format (how many digits and the location of the decimal point) can be set for floating point format only.
The size and properties of the font used in this block can be changed by pressing the Font... button in
the Numeric Control Display Item dialog box.
Configuration Dialog Box
Figure 4-42: Numeric Control Display Item Configuration Dialog Box
Field Description
•
Data Type: This field is used to select the data type of a display value. The type can be floating point
(real), integer.
•
Privilege level: This field is used for protection of system control. The privilege level is from 0 to
255, where the larger number has the higher privilege. For example, if the privilege level of a button
is 100, then a user’s privilege must be larger than or equal to 100 to press this button.
•
Initial Value: This field is used to set the initial value of the numeric control field.
•
Step Value: This field is used to set the value of the numeric control field for each step.
•
High limit/Low limit: This field is used to set high/low limit values of the numeric control field.
•
Restore the previous stop value: This field is used to save the value of the control display at system
stop, and the value will be restored at next system start.
Configuring Your Display View With Display Designer
4-33
Knob Control
Figure 4-43: Knob Control Display Item in Workspace Window
Description
A numeric-type knob control may be drawn and interfaced (Output) to control a Task block variable
with a certain tag name. The size of the display may be adjusted. This display item is used as an output
from the keyboard or mouse; data is to be sent to a Task block variable by an operator who specifies the
data. The knob may also be turned using the keyboard UP and DOWN arrow keys, if the focus is
currently on the knob to be turned. (The “focus”, a standard Windows term, refers to which display
item currently can be controlled by the keyboard). The TAB key can be used to shift the focus from one
item to another.
Knobs can be used to achieve supervisory control. The data is in real (floating point) format, and the
display format (number of digits and location of the decimal point) may be chosen. The size and
properties of the font used in this block can be changed by pressing the Font... button in the Knob
Control Display Item dialog box.
4-34
Configuration Dialog Box
Figure 4-44: Configure Knob Control display item
Field Description
•
Display Current Value: Specify whether the numeric display below the knob is active or not.
•
Knob Action: Specify the knob action (either smooth or incremental).
•
Decimal Places: Specify the desired number of decimal places after the decimal point.
•
Initial Value: Specify to which numeric value the knob will point at Runtime Startup.
•
Privilege level: This field is used for protection of system control. The privilege level is from 0 to
255, with the larger number having a higher privilege. For example, if the privilege level of a button
is 100, then a user’s privilege must be larger than or equal to 100 to press this button.
•
Show Ticks: Specify whether Ticks will be displayed.
•
Start Ticks: Specify the lowest number the knob will output (i.e. where the Ticks will start).
•
End Ticks: Specify the highest number the knob will output (i.e. the Ticks ending number).
•
Ticks Rate: Specify the rate at which the Ticks will increment.
•
Restore the previous stop value: This field is used to save the value of the control display at system
stop, and the value will be restored at next system start.
Configuring Your Display View With Display Designer
4-35
Slider Control
Figure 4-45: Slider Control in Workspace Window
Description
A numeric-type slider control may be drawn and interfaced (Output) to control a Task block variable
with a certain tag name. The display and slider size may be changed. This display item is used as an
output from the keyboard or mouse. Data is to be sent to a Task block variable by an operator who
specifies the data.
The slider may also be moved using the UP and DOWN arrow keys, provided the focus is currently on
the slider (The “focus”, a standard Windows term, refers to which display item currently can be controlled by the keyboard). Choosing which display item currently has the focus may be done using the
TAB key. The slider control can be used to achieve Supervisory Control. The data is in real (floating
point) format.
4-36
Configuration Dialog Box
Figure 4-46: Configure Slider Control display item
Field Description
•
Slider Action: Specify the slider action (either smooth or incremental).
•
Initial Value: Specify to which numeric value the slider will point at Runtime Startup.
•
Privilege level: This field is used for protection of system control. The privilege level is from 0 to
255, with the larger number having the higher privilege. For example, if the privilege level of a
button is 100, then the user’s privilege must be larger than or equal to 100 to press this button.
•
Show Ticks: Specify whether Ticks will be displayed.
•
Ticks Start: Specify the lowest number the slider will output (i.e. where the Ticks will start).
•
Ticks End: Specify the highest number the slider will output (i.e. the Ticks ending number).
•
Ticks Number: Specify how many total Ticks will be displayed. This entry will be grayed out if
“Show Ticks” is set to “No”.
•
Restore the previous stop value: This field is used to save the value of the control display at system
stop, and the value will be restored at next system start.
Configuring Your Display View With Display Designer
4-37
Working with Cell Objects
You can use cell objects to assemble your own pictures, such as pumps or valves. The cell objects
include:
•
Rectangle cell
•
Rounded rectangle cell
•
Oval cell
•
Polygon cell
•
Line cell
GeniDAQ provides graphical tools to draw pumps, valves, rectangles, circles, segments, and polygons.
It allows the user to configure the colors and sizes of these figures. These drawing tools include oval,
rectangle, round rectangle, polygon and line. In addition, GeniDAQ provides Make Object and Break
Object commands to let you integrate drawing components into a meaningful picture for your data
acquisition and control.
Grouping and Rotating Cell Objects
To group two or more cell objects:
1. Use the cell object icons to draw the objects that you want to group.
2. Use your mouse pointer to surround all of the objects. All of the handles on all of the objects should
be visible to signify that they are selected.
3. Select Edit | Make Object from the main menu. Your objects have now been grouped into a single
object. To break the object apart, select it and then select Edit | Break Object from the main menu.
To rotate an object:
1. Highlight the object that you want to rotate and then select Edit | Rotate Clockwise or Edit | Rotate
C-Clockwise from the main menu.
Configuring Cell Objects
All of the cell objects share a common configuration dialog box:
Figure 4-47: Configure Rectangle Drawing Display Item Configuration Dialog Box
4-38
Field Description
•
Input from: Specify the input from value.
•
Pen Color: Specify the color of pen to fill the rectangle graphic object. There are 16 colors from
which to choose.
•
Pen Size: Specify the size of pen to draw the shape of graphic object. The unit of size is dots.
•
Color in Normal: Specify the display color of the graphic object while the input value is equal to 1.
•
Color in Activation: Specify the display color of the graphic object while the input value is equal to
0.
Rectangle Drawing Display Item
This display item is used to draw a rectangle graphic object in the display window. When a graphic is
selected, you can drag the corner to size the object. This display item has input capability. It accepts a
value between zero (0) and one (1) from a Task block, each value providing capability to select color to
be displayed. When this display item is double-clicked upon, a dialog box will appear for configuration.
Rounded Rectangle Cell
This display item is used to draw a rounded rectangle graphic object at the display window. The functions of the rounded rectangle drawing tool are the same as those of the rectangle drawing tool. Please
refer to the previous section.
Oval Cell
This display item is used to draw an oval graphic object at the display window. The functions of the oval
drawing tool are the same as those of the rectangle drawing tool. Please refer to the previous section.
Polygon Cell
This display item is used to draw a polygon graphic object at the display window. The functions of the
polygon drawing tool are the same as those of the rectangle drawing tool. Please refer to the previous
section.
Line Cell
This display item is used to draw a line graphic object at the display window. The functions of the line
drawing tool are the same as those of the rectangle drawing tool. Please refer to the previous section.
Note: The \Strategy\Tutor4 example demonstrates how to use drawing tools to customize your display.
Please refer to it for the detailed.
Configuring Your Display View With Display Designer
4-39
Summary
Advantech GeniDAQ’s display designer provides an object-based development environment that allows
you to create your operator display panel intuitively. You can create a panel that is similar to industrial
process displays or test equipment. You can also attach a bitmap background to customize your display.
The operator display allows you to monitor, supervise, and control your process during runtime. For
control objects, they can be controlled using a mouse or a keyboard protected with security.
In addition, Advantech GeniDAQ also provide graphic tools to draw rectangles, circles, segments, and
polygons. These objects or cells can be link to a tag value. They can change color according to the tag
value. They can also be grouped together to make a single object. You can use them to draw pumps,
valves or other industrial symbols.
4-40
5
Connecting Your
Devices
Overview
There are two ways to link with your devices. The first one is the interface with internal I/O drivers for
Advantech I/O hardware. With the interface, GeniDAQ accesses Advantech I/O hardware through
Advantech DLL drivers. The other one is the interface with OLE for Process Control (OPC) standard
driver interface. In your plant or system, there may already exist some devices, instead of Advantech I/
O. GeniDAD leverages the industry OPC standard to provide the plug-and-play connectivity with your
devices, such as programmable logic controllers (PLCs). Most of major PLC vendors provide the OPC
servers for their hardware. With OPC, you can easily integrate your devices.
For Advantech I/O hardware, it supports Advantech’s DLL driver. The DLL drivers are bundled with
GeniDAQ. For devices other than Advantech I/O hardware, it supports OPC servers. If your device
provides an OPC server, GeniDAQ can access it.
Use Advantech
Hardware?
Yes
No
Install and Configure
Driver with Device
Installation Program
Install and Configure
Server with OPC Server
Select AI/AO/DI/DO/
Counter/Temperature/
Alarm Blocks and Map to
Your Advantech Devices
Select AI/AO/DI/DO/
Counter/Temperature
Blocks and Enable
"Connect to OPC Server"
Figure 5-1: Connecting Your Hardware With GeniDAQ
If you are using Advantech I/O hardware, you must use the Device Installation Utility, bundled with
GeniDAQ, to install and configure the device. You can then use I/O blocks, such as AI/AO/DI/DO/
Counter/Temperature/Alarm to map to your devices. If your are not using Advantech I/O hardware, you
can use an OPC server interface by enabling the “Connect to OPC Server” option in these I/O blocks
except Alarm block. However, before connecting to the OPC server, you must install and/or configure
your OPC server. Please refer to your OPC server documentation.
I/O Blocks
Analog Input
5-2
Temperature Measurement
Analog Output
Hardware Event/Frequency/Pulse Output
Digital Input
Hardware Alarm
Digital Output
RS-232
Contents
•
Using Advantech DLL drivers
•
Connecting devices with OPC standard interface
•
Analog input
•
Analog output
•
Digital input
•
Digital output
•
Temperature measurement
•
Counter/Frequency measurement/Pulse output
•
Hardware alarm
•
RS-232
•
Performance Test
•
Summary
Note:
GeniDAQ includes two OPC servers, ADAM OPC and ModBus OPC. Please refer
to Appendix C and D.
Note:
The current version of GeniDAQ CE doesn’t support DDE functions in I/O blocks.
Note:
For I/O configuration of GeniDAQ CE, please refer to Chapter 12.
Using Advantech DLL Drivers
Using Advantech DLL drivers to connect Advantech I/O devices. GeniDAQ is compatible with the
DLL drivers V1.3 or higher. The DLL drivers are bundled with GeniDAQ installation CD-ROM disc.
When you install GeniDAQ, it will detect the driver on your system and install it automatically if no
driver installed or the driver version less than V1.3.
Installing and Configuring Advantech I/O Devices
This section describes how to use the Device Installation Utility (DEVINST.EXE) to install and
configure your device before using I/O blocks within GeniDAQ. It applies to Advantech I/O hardware.
The basic steps are as follows. The following example installs and configures a demo board, and you
follow this general procedure to set up and configure any device that you need to use.
1. Launch the Device Installation Utility by selecting Add | Devices from the main menu. Alternatively you can click the Add Devices toolbar icon which is available in both the Task Designer and
Display Designer.
Add Devices Toolbar Icon
Figure 5-2: The Add Devices Toolbar Icon
2. The Device Installation Utility loads as shown below:
Connecting Your Devices
5-3
Figure 5-3: Device Installation Utility Main Screen
The Installed Devices pane displays the Advantech hardware that is currently set up to run on your
computer. The List of Devices pane shows Advantech hardware for which the drivers can be
installed to enable their use.
3. Highlight the Advantech DEMO Board entry in the List of Devices pane and click the Add… button.
A configuration dialog box is displayed to configure the device that you are adding.
Figure 5-4: Device Configuration Dialog Box
4. Use the default value and press the OK button. You will see a new entry in the Installed Devices
list.
5-4
Figure 5-5: I/O Device Installation Dialog Box Showing New Device
5. If you want to test the device that you have just installed, click the device entry in the Installed
Devices pane and then click the Test… button.
6. Click the Close button and exit the Device Installation Utility.
Porting Device Configuration to Another Machine
GeniDAQ allows you to port the Advantech device configuration from one machine to another machine. It saves your time to reconfigure the devices on another machine. First you export (run
“ADSDEVICEINSTALL.EXE”) the device configuration from Registry to a *.reg file on one machine.
Then import the device configuration from the *.reg file to Registry on another machine.
To import the Advantech device configuration, run “ADSDEVICEINSTALL.EXE” from the directory
where GeniDAQ is installed. Select the “Import” option from the “File” menu in the
“ADSDEVICEINSTALL.EXE” utility.
To export a device configuration, you have to launch the device installation program by clicking on the
Device Installation icon in the GeniDAQ 4.0 folder from the Start menu. Then click on the File|Export
menu to export the configuration file to a *.reg file. Also you can import a device configuration by
clicking on the File | Import menu.
To export the Advantech device configuration, run “ADSDEVICEINSTALL.EXE” from the directory
where GeniDAQ is installed. Select the “Export” option from the “File” menu in the
“ADSDEVICEINSTALL.EXE” utility.
Connecting Your Devices
5-5
Connecting Devices with OPC Standard Interface
Configuring OPC Communication Settings
After you install and configure your OPC servers, you can configure GeniDAQ’s OPC settings to
optimize communication with the OPC servers. These include asynchronous or synchronous communication, cache or device data type, update rate and deadband. You can activate the OPC configuration
dialog box by selecting Setup | Task Properties from the main menu of Task Designer and clicking the
OPC Setting button.
Figure 5-6: OPC Server Properties Configuration Dialog Box
Field Description
•
Scan Mode: Specifies asynchronous or synchronous mode scan. Asynchronous mode configures the
OPC server to transfer data only when data is changed. It is more efficient. Synchronous mode
always scans data from the OPC server.
•
Data Source: Specifies the data source from cache or device when GeniDAQ requests data for the
OPC server. The OPC server scans the physical device at a fixed rate (the Update Rate). The scan
data will stored in memory. The cache option means the data is stored in the memory of the OPC
server. It’s more efficient. For a device data source, the OPC server retrieves data from the physical
device.
•
Update Rate: Specifies the update rate that the OPC server scans the physical device.
•
Deadband: Specifies the percentage change in an item value when the OPC server causes a callback
to GeniDAQ.
Note:
All items in a task have the same OPC properties. Each task has its own OPC
properties.
Mapping OPC Items to I/O Blocks
After you configure the OPC communication settings, you can map OPC items to I/O tags. You can
activate the OPC item configuration dialog box in all I/O blocks by enabling the Connect to OPC server
option button. The OPC Item Select configuration dialog box is shown as below.
5-6
Figure 5-7: OPC Item Select Configuration Dialog Box
Field Description
•
Access Path: The access path is intended as a way for the client to provide the server a suggested
data path (e.g., a particular modem or network interface). It indicates how to get the data. It is
optional and depends on the OPC server. You can input the access path manually or by pressing the
Browse button to select the access path.
•
Server: Specifies the OPC server that supports the desired device. The Server lists all of the installed
OPC servers. Select one in the Server listing and click the Connect button. Then it will retrieve all
defined items in the Server and put them in the ItemID list.
•
ItemID: Specifies the OPC item that maps to the physical I/O point. The ItemID lists all of the
defined items. Select the one you want to access.
Analog Input
AI
.
.
.
Output 0 (floating point)
Output 31 (floating point)
Figure 5-8: Analog Input Block
Connecting Your Devices
5-7
Block Information
Interface
•
Number of inputs: 0
•
Input type: None
•
Number of outputs: depends on the hardware. The maximum is 32. For the devices connecting
through OPC interface, there is only one channel output.
•
Output type: floating point
Description
This block has output capability that supplies other blocks with analog input information from the I/O
device. The Analog Input block supports
•
Advantech I/O hardware: includes plug-in DA&C cards and ADAM-4000/5000 modules
•
OPC standard interface
Dialog Box Configuration
Figure 5-9: Analog Input Block Configuration Dialog Box
5-8
Field Description
•
Device/Item field: Specifies the device or OPC item associated with the block.
•
From channel: specifies the starting polling channel. The value ranges from zero (0) to the maximum number of hardware channels.
•
To channel: specifies the ending polling channel. The value should be equal to or larger than the
From Channel number.
•
Input range: specifies the input value range of each hardware channel, for example -5V to +5V.
This value is dependent on the hardware device. If there are multiple channels for a connected
hardware device, you are advised to specify each channel’s input range.
•
Expansion channel: specifies the expanded daughterboard on a connected mainboard. Use this
feature to select the correct expansion channel and board ID.
•
Update times: The “Update times” is a divisor that allows the Analog Input block to have a different
effective scan rate than the rest of the strategy. This is useful if, for example, your strategy is
running at 100Hz, but you only want to sample at a rate of 20Hz. For this example, you would set
the Update times to 5 (100 divided by 5 (the update times) gives an effective scan rate of 20Hz). In
this scenario, you will still get 100Hz data if you send the output to a Log File block or a display
block, but only one in five samples will be “real”. The other samples are merely copies of the “real”
sample. Valid values for the Update times are between 1 and 32767.
•
Establish DDE Link field: The Digital Input block also has DDE capabilities which allow it to
exchange data with other Windows applications. For more information about DDE, please refer to
DDE Client/Server block.
•
Scaling button: Scaling button is used to re-scale input value range to the desired value range. The
scaling dialog box is below:
Figure 5-10: Analog Input Scaling Dialog Box
Connecting Your Devices
5-9
For example, if the input range is -5 to +5, then you can adjust it to be 0 to 10.
•
Wiring In: GeniDAQ will display a window with the error message “Cannot accept input”.
•
Wiring Out: Multiple channels can be selected to output data to another connected block. The
maximum number of channels is 32.
Figure 5-11:Analog Input Block’s Wiring out Dialog Box
Through Advantech DLL Driver Interface
Connecting Plug-in DA&C Cards
Depending on the hardware that you’re using, the analog input may have multiple channels. The From
channel and To channel fields specify the scan channels. Configure the input ranges in the Input Range
field for all channels. Some plug-in DA&C cards can connect to an expansion board to measure the
signal. In this case, use the Expansion channel field to select the corresponding expansion channel and
board ID. The field is enabled only when you have configured an expansion board with the Device
Installation Utility.
Note:
If the “From channel” is 2 and the “To channel” is 4, and you want to get the value of
Channel 3, you have to select the Output 3 by connecting the analog input block to
another block.
Connecting ADAM-4000/5000 Series Modules
Depending on your hardware, the analog input may have multiple channels. The From channel and To
channel fields specify the scan channels. The Input range and Expansion channel fields are disabled.
Through OPC Interface
To connect devices through an OPC interface, you have to enable the Connect to OPC server option
button and then click the Select button. You can then map an OPC item to output 0 of the analog input.
Please refer to the Connecting Devices with OPC Standard Interface section.
Note:
5-10
For OPC connection, analog input only has one output.
Analog Output
Input 0 (floating point)
AO
Output 0 (floating point)
Figure 5-12: Analog Output Block Information
Block Information
Interface
•
Number of inputs: 1
•
Input type: floating point
•
Number of outputs: 1
•
Output type: floating point
Description
This block has input capability that accepts another block’s analog data, then forwards the data to the
selected I/O device. Analog output block supports
• Advantech I/O hardware: includes plug-in DA&C cards and ADAM-4000/5000 modules
• OPC standard interface.
Dialog Box Configuration
Figure 5-13: Analog Output Block Configuration Dialog Box
Connecting Your Devices
5-11
Field Description
•
Device/Item field: Specifies the device or OPC item associated with the block.
•
Channel field: This field is used to specify the hardware device channel that AO block will output
data to. The value of channel field will depend on the connected hardware device.
•
Update times field: The “Update times” is a divisor that allows the Analog Output block to have a
different effective scan rate than the rest of the strategy. This is useful if, for example, your strategy
is running at 100Hz, but you only want to output data at a rate of 20Hz. For this example, you
would set the “Update times” to 5 (100 divided by 5 (the update times) gives an effective scan rate
of 20Hz).
•
DDE field: The Analog Output block has DDE capabilities, which allow it to exchange data with
other Windows applications. Through DDE field, other Windows applications can exchange data
with AO block and/or output data to hardware device(s) directly. For more information about DDE,
see “DDE Blocks (Client and Server)”.
•
Initial value settings: Specifies the initial value of the Analog Output block. There are three options,
no initial value, with initial value and initial value form the previous stop.
Wiring Information
•
Wiring In: Another block provides output data to the AO block and connected hardware device(s).
There is only one input source. If an input source already exists, “The input already connected”
message will be displayed.
•
Wiring Out: Passes the input data to a connected block directly.
Digital Input
All Channels (Integer)
DI
.
.
.
Channel 0 (Integer)
Channel 15 (Integer)
Figure 5-14: Digital Input Block
Block Information
Interface
•
Number of inputs: 0
•
Input type: none
•
Number of outputs: 17 (“All Channels”, and “Channel 0” to Channel 15”)
•
Output type: integer
Description
This block has output capability that supplies other blocks with digital input information from the I/O
device. For “All Channels” output, the output value is from 0 to 2^16. For “Channel 0” to “Channel 15”
output, the output value is 0 or 1. Digital Input block supports
5-12
•
Advantech I/O hardware: includes plug-in DA&C cards and ADAM-4000/5000 modules
•
OPC standard interface.
Dialog Box Configuration
Figure 5-15: Digital Input Block Configuration Dialog Box
Field Description
•
Device/Item field: Specifies the device or OPC item associated with the block.
•
Port field: It is enabled only for using Advantech DLL driver interface. A port consists of 8 bits.
•
Update times: The “Update times” is a divisor that allows the Digital Input block to have a different
effective scan rate than the rest of the strategy. This is useful if, for example, your strategy is
running at 100Hz, but you only want to sample at a rate of 20Hz. For this example, you would set
the Update times to 5 (100 divided by 5 (the update times) gives an effective scan rate of 20Hz). In
this scenario, you will still get 100Hz data if you send the output to a Log File block or a display
block, but only one in five samples will be “real”. The other samples are merely copies of the “real”
sample. Valid values for the Update times are between 1 and 32767.
•
Establish DDE Link field: The Digital Input block also has DDE capabilities which allow it to
exchange data with other Windows applications. For more information about DDE, please refer to
DDE Client/Server block.
Figure 5-16:Digital Input Block’s Wiring out Dialog Box
Connecting Your Devices
5-13
Wiring Information
•
Wiring In: GeniDAQ will display a window with the error message “Cannot accept input”.
•
Wiring Out: Passes the hardware device data to a connected block directly.
For “All Channels” output, the output value is from 0 to 2^16. For “Channel 0” to “Channel 15” output,
the output value is 0 or 1.
Digital Output
Input 0 (Integer)
DO
Output 0 (Integer)
Figure 5-17: Digital Output Block
Block Information
Interface
•
Number of inputs: 1
•
Input type: integer
•
Number of outputs: 1
•
Output type: integer
Description
This block has input capability that accepts another block’s integer data and then forwards the data to
the selected I/O device. The Digital Output block supports
• Advantech I/O hardware: includes plug-in DA&C cards and ADAM-4000/5000 modules
• OPC standard interface.
5-14
Dialog Box Configuration
Figure 5-18: Digital Output Block Configuration Dialog Box
Field Description
•
Device/Item field: Specifies the device or OPC item associated with the block.
•
Enable block output field: The Digital Output block can output value to one digital output channel
or 16 digital output channels at one scan. You can select 16 channels output by enabling the block
output. The default is one channel (or bit) output. If you enable this option, you have to input a 16bit value to this block.
•
Port field: It is enabled only for using Advantech DLL driver interface. A port consists of 8 bits.
•
Channel field: Specifies the output channel for one channel output.
•
Initial value settings: Specifies the initial value of the Digital Output block. There are three options,
no initial value, with initial value and initial value form the previous stop.
•
Initial value: Specifies the initial value for block output or channel output. It is only enabled for the
option with initial value checked.
•
Update times field: The “Update times” is a divisor that allows the Digital Output block to have a
different effective scan rate than the rest of the strategy. This is useful if, for example, your strategy
is running at 100Hz, but you only want to output data at a rate of 20Hz. For this example, you
would set the “Update times” to 5 (100 divided by 5 (the update times) gives an effective scan rate
of 20Hz).
Connecting Your Devices
5-15
•
DDE field: The Digital Output block has DDE capabilities, which allow it to exchange data with
other Windows applications. Through DDE field, other Windows applications can exchange data
with AO block and/or output data to hardware device(s) directly. For more information about DDE,
see “DDE Blocks (Client and Server)”.
Wiring Information
•
Wiring In: Another block directly outputs data to DO block and connected hardware device(s).
There is only one input. If there is more than one input, “The input already connected” message will
be displayed.
•
Wiring Out: Passes the hardware device data to connected block(s) directly
Temperature Measurement
TMP
Output 0 (floating point)
Figure 5-19: Temperature Measurement Block
Block Information
Interface
•
Number of inputs: 0
•
Input type: none
•
Number of outputs: 1
•
Output type: floating point
Description
Similar to the AI (analog input) block, this block allows for outputting data to another block directly
from the I/O device. Transforms the analog input data from the I/O device into linearized temperature
data in degrees Celsius, Fahrenheit, Kelvin, or Rankine. Thermocouple types supported are J, K, S, T,
R, and E. Temperature measurement block supports
5-16
•
Advantech I/O hardware: includes plug-in DA&C cards and ADAM-4000/5000 modules
•
OPC standard interface.
Dialog Box Configuration
Figure 5-20: Temperature Measurement Block Configuration Dialog Box
Field Description
•
Device/Item field: Specifies the device or OPC item associated with the block. For using Advantech
DLL driver interface, you should install daughterboard for signal amplification with Device
Installation program before configuring the Temperature Measurement block.
•
Channel: Chooses the analog input device channel.
•
Input range: Chooses the input range, if applicable.
•
Expansion channel: Chooses the expansion (mux) card channel.
•
Temperature scale: Chooses the desired temperature scale in degrees C (Celsius), F (Fahrenheit), K
(Kelvin) , or R (Rankine).
•
Thermocouple type: Chooses the type of thermocouple that the hardware supports.
•
Establish DDE Link: Allows you to establish a link with other Windows applications. See “DDE
Blocks (Client and Server)”.
•
Update times: Changes the effective scan rate of this particular block. The value entered acts as a
divisor; the scan rate divided by the update rate gives the effective scan rate for this block.
Wiring Information
•
Wiring In: No wiring input connection. “Cannot accept input” message will be displayed.
•
Wiring Out: Temperature Measurement block transforms the analog input data from the I/O device
into linearized temperature data in degrees C, F, K, or R. Thermocouple types supported are J, K, S,
T, R, and E.
Connecting Your Devices
5-17
Counter/Frequency Measurement/Pulse Output
Reset Input (integer)
Start/Stop Input (integer)
CTFQ
Output 0 (floating point)
Total Period (floating-point)
First ‰ Cycle (floating-point)
Figure 5-21: Counter/Frequency Measurement/Pulse Output Block
Block Information
Interface
•
Number of inputs: 4
•
Input type: integer/floating point
•
Number of outputs: 1
•
Output type: floating point
Description
This block has output capability that supplies other blocks with analog values from the I/O device. The
Hardware Counter block supports
• Advantech I/O hardware: includes plug-in DA&C cards and ADAM-4000/5000 modules:
• OPC standard interface
5-18
Dialog Box Configuration
Figure 5-22: Event Counter/Frequency Counter/Pulse Output Configuration Dialog Box
Field Description
•
Device/Item field: Specifies the device or OPC item associated with the block.
•
Counter Input/Frequency Measurement option: A hardware device’s counter/timer chip is used as a
hardware event or frequency counter that counts digital rising edges (digital high events) from an
external source that supplies digital information (TTL or other level 1’s and 0’s). The block may be
used to control the output of the timer/counter chip (when supported by the driver), to be used as a
pulse generator. The block’s output can be sent to another block, such as the display block. All
counting or pulse output is performed by the I/O card’s timer/counter chip, and is not dependent on
the sample rate of the strategy. The event counter is implemented as an up - counter; that is, the
count starts at 0 (zero) and counts until it reaches the counter’s maximum value (hardware/driver
dependent). A down - counter may be constructed by using this block in conjunction with a BasicScript Block or Single Operation Calculation (SOC) block and subtracting the counter output from
the maximum count. In this way, the count will start at the maximum and will end at zero.
•
Start/stop from: If the Start/Stop Input is connected, the counter or pulse generator is started and
stopped by this input. This allows for total control over counter operation during runtime. If the
start/stop input is not connected, the counter will start when the strategy begins and stop when it
ends. To start the counter using the start/stop input, provide a rising edge (from low (zero) to high)
to this input from another block. This will start the hardware counter from zero. Counter status is
output from the counter/frequency/pulse output block with every scan of GeniDAQ, unless the
Connecting Your Devices
5-19
divisor (explained below) is set to a value other than 1 (one). By applying a falling edge (from high
to low) digital value to the start/stop input, the counter may be stopped at the current value.
•
Reset from: By connecting a rising edge value to the block’s Reset Input, the count can be reset to
its starting value and counting is resumed. A falling edge value to the reset input will have no effect
on counting (reset input not connected is treated as a low).
•
Pulse Output Option: You can create a pulse generator output from the counter/timer section of the
I/O device if supported by the DLL driver. To do so, specify the Total Period and first 1/2 cycle
time (in seconds). You can use the static values specified in the dialog box or supply the block with
floating point values on its input from another block. Not all I/O devices support a varying first 1/2
cycle due to hardware limitations of the counter/timer chip. In this case, when you specify a total
period the device will generate a 50% duty cycle square wave on its output pin. Check the DLL
driver on-line help for specifications on hardware support.
If the Total Period Input is connected to a block that supplies floating point output, such as the User
Programmable Block, the total pulse time (1/frequency) of the pulse output is controlled by this input.
This allows for control over total pulse frequency operation during runtime. If the Total Period input is
not connected, the counter will use the static values entered in the dialog box when the strategy begins.
If the First 1/2 Cycle Input is connected to a block that supplies floating point output such as the User
Programmable Block, the first 1/2 cycle time (1/frequency) of the pulse output is controlled by this
input. This allows for total control over first 1/2 cycle pulse frequency operation during runtime. If the
first 1/2 cycle input is not connected, the counter will use the static values entered in the dialog box
when the strategy begins.
•
Gate Mode: External Gating — the counter/timer chip may be started and stopped via external level
control on a special input pin. If the hardware timer/counter and DLL driver supports external
hardware gating, setting this value to high level or low level will enable the timer/counter chip to
allow for gating control. Thus, if the counter is started at either the strategy start or using the start/
stop input, the actual counting can’t take place until the external gate senses the proper level on its
input pin.
•
Update times field: The “Update times” is a divisor that allows the Counter/Frequency/Pulse Output
block to have a different effective scan rate than the rest of the strategy. This is useful if, for
example, your strategy is running at 20Hz, but you only want to sample the counter at a rate of 4Hz.
For this example, you would set the Update Rate to 5 (20 divided by 5 (the update rate) gives an
effective scan rate of 4Hz). In this scenario, you will still get 20Hz data if you send the output to a
Log File block or a display block, but only one in five samples will be “real”. The other samples are
merely copies of the “real” sample. Valid values for the update rate are between 1 and 32767.
Note:
A separate Counter/Frequency/Pulse Output block is needed for each individual
hardware counter/timer channel.
Wiring Information
•
5-20
Wiring In: There are four input items for this block: Start/Stop Input, Reset Input, Total Period Input
and First 1/2 Cycle Input. For each wiring input, you have to select one of the above.
Figure 5-23: Counter/Frequrency/Pulse Block’s Wiring in Dialog Box
•
Wiring Out: Passes the counter/frequency/pulse data to another connected block.
Hardware Alarm
Reset Input (integer)
ALM
Output 0 (integer)
Enable/Disable (integer)
Figure 5-24: Hardware Alarm Block
Block Information
Interface
•
Number of inputs: 2
•
Input type: integer
•
Number of outputs: 1
•
Output type: integer
Description
This block has output capability that supplies other blocks with alarm information from the I/O device.
Hardware alarm block supports
Advantech I/O hardware: includes ADAM-4000/5000 modules:
Connecting Your Devices
5-21
Dialog Box Configuration
Figure 5-25: Digital Alarm Block Configuration Dialog Box
Field Description
•
Device/Item field: Specifies the device associated with the block. Please make sure the hardware
alarm is enabled when the device is installed (“Alarm enabled” field is YES) as below.
Figure 5-26: Advantech ADAM-4000 Module Parameters Configuration Dialog Box
5-22
•
Alarm limit settings: After selecting the hardware alarm channel, you can set the alarm range (high
and low values).
•
Enable/disable input: If the Enable/Disable Input is connected, the alarm is enabled and disabled
using this input. This allows for total control over alarm operation during runtime. If the enable/
disable input is not connected, the alarm will be enabled when the strategy begins and disabled
when it ends. To enable the alarm using the enable/disable input, provide a rising edge (from low
(zero) to high) to this input from another block. Alarm status is output from the hardware alarm
block with every scan of GeniDAQ, unless the divisor (explained below) is set to a value other than
1 (one). By applying a falling edge (from high to low) digital value to the enable/disable input, the
alarm may be disabled.
•
Reset Input option: By connecting a rising edge value to the block’s Reset Input, the alarm is reset
to zero and alarm operation is resumed. If the option is not enabled, a falling edge will be treated as
a low.
•
Update times field: The “Update times” is a divisor that allows the Alarm block to have a different
effective scan rate than the rest of the strategy. This is useful if, for example, your strategy is
running at 20Hz, but you only want to sample the alarm status at a rate of 4Hz. For this example,
you would set the Update Rate to 5 (20 divided by 5 (the update rate) gives an effective scan rate of
4Hz). In this scenario, you will still get 20Hz data if you send the output to a Log File block or a
display block, but only one in five samples will be “real”. The other samples are merely copies of
the “real” sample. Valid values for the update rate are between 1 and 32767.
Wiring Information
•
Wiring In: Hardware Alarm Block accepts the input data as reset or enable/disable and displays the
information in the configuration dialog box.
Figure 5-27: Hardware Alarm Block’s Wiring in Dialog Box
•
Wiring Out: The Hardware Alarm block outputs one of three levels:
0 = No Alarm has occurred
1 = Low Alarm is now set
2 = High Alarm is now set
Connecting Your Devices
5-23
RS-232
Output 0 (string)
Input 0 (string)
SER
Output 7 (string)
Figure 5-28: RS-232 Block
Block Information
Interface
•
Number of inputs: 1
•
Input type: string
•
Number of outputs: 8
•
Output type: string
Description
The RS-232 block (or Serial Interface block) is used for communication between the GeniDAQ host
computer and other serial devices (other computers, ADAM modules, etc.) that support the RS-232
standard.
Data in the form of a prompt string can be sent out to the serial device, and the response can be fed to
another block within GeniDAQ. If the prompt string is to be static (not to be changed), then the string is
entered in the dialog box by the user. As a dynamic alternative, the prompt string may be sent in the
form of an input to the block by connecting a BasicScript block or other block capable of outputting
string variable types.
This block has output capability that supplies other blocks with a string from the serial port. The RS232 block supports the standard serial port devices.
5-24
Dialog Box Configuration
Figure 5-29: Serial Port Interface Block Configuration Dialog Box
Field Description
•
Device/Item field: Specifies the COM port device associated with the block. Please make sure to
install and configure COM port settings with Device Installation program before using the block.
•
Idle time: the time (in ms) that GeniDAQ will wait before it starts looking for a response from the
serial device. This feature is very convenient since some serial devices are very slow to respond.
Using an idle time will eliminate time-out errors when slow serial devices are used.
•
Wait time: the time (in ms) that GeniDAQ will wait for a return string after the idle time has elapsed.
If the wait time passes with no string received, or no final character, then GeniDAQ will retry
sending the prompt string (see below).
•
Retry: the number of times that GeniDAQ will retry sending the prompt string before terminating.
Acceptable numbers for retry are between 0 and 3.
Note:
The sum (Idle+Wait) must be less than the scan task period.
•
Initial string (Init String): Used to configure the serial device. It will be sent out as a first string,
and the data that is sent back to GeniDAQ will be thrown away.
•
Prompt String: After the initial string is sent, and the response (which is ignored) is received, the
Prompt String will be sent, after which all data received back (Response String) can be used by
another block that is connected to the RS-232 block. You must specify the starting and ending point
with respect to the data in the string. By pressing More button, additional response strings may be
entered in the Additional Response Strings dialog box (shown below).
Connecting Your Devices
5-25
Note:
The “Init String” and “Prompt String” fields allow the user to enter control characters
in the range of ASCII 0 to ASCII 31.
For example, entering “This ^A^B^C^[ String^M” is converted to “This
<Ctrl_A><Ctrl_B><Ctrl_C><ESC> String<CR>” where <Ctrl_A> is ASCII 1 and <ESC> is ASCII 27.
ASCII
0
1
2
3
4
5
6
7
8
9
10
11
12
13
14
15
16
17
18
19
20
21
22
23
24
25
26
27
28
29
30
31
Enter
^@
^A
^B
^C
^D
^E
^F
^G
^H
^I
^J
^K
^L
^M
^N
^O
^P
^Q
^R
^S
^T
^U
^V
^W
^X
^Y
^Z
^[
^\
^]
^^
^_
Meaning
Null
Start of Heading
Start of Text
End of Text
End of Tape
Enquiry
Acknowledge
Bell
Backspace
Horizontal Tab
Line Feed
Vertical Tab
Form Feed
Carriage Return
Shift Out
Shift In
Data Link Escape
Device Control 1
Device Control 2
Device Control 3
Device Control 4
Negative Acknowledge
Synchronize
End of Transmitted Block
Cancel
End of Medium
Substitute
Escape
File Separator
Group Separator
Record Separator
Unit Separator
The string entered will be converted to a final string using the following scheme:
1. The “^” character followed by a character from “@” to “_” is interpreted as the lower 32 control
characters in the ASCII table. ^@ is NUL, ^A is control-A, ^B is control-B, etc. (letters: ‘A’ to ‘Z’
are upper case only)
2. Backquote character “`”, which is also called a grave accent, means the next character will be
recognized literally, rather than converted to a special character. For example “`|” is the ASCII
124, “`^” is the “^” character, and “``” is a single backquote character because the first single
backquote character protects the second one from being converted.
•
5-26
More button: By pressing More button, an Additional Response Strings dialog box will appear.
Figure 5-30: RS-232 Block’s Additional Response String Dialog Box
In this dialog box, you can specify up to seven (7) additional response starting and ending locations
with respect to characters in the string.
•
Wiring In: RS-232 blocks accept input data as prompt string. If a prompt string is to be in static
mode (not to be changed), then the string is entered in the dialog box by the user. As a dynamic
alternative, the prompt string may be sent in the form of an input to the block by connecting a User
Programmable or other block capable of string variable types.
•
Wiring Out: RS-232 blocks output the response to another connected block within GeniDAQ.
Connecting Your Devices
5-27
Performance Test
The purpose of this section is to provide a framework for understanding the performace connected to
ADAM modules.
Procedure
•
Connect an input module to a PC, including ADAM 4000 and 5000 series.
•
Use ADAM, OPC for ADAM, OPC for ModBus as interface drivers.
•
Build an AI or a DI block in GeniDAQ Task, to get the input value.
•
Each AI or DI block scan channel 0-7, total 8 points.
•
Duplicate N blocks to get N * 8 points.
•
Build a Timer block & a Basic Script block to get the time difference between each scan.
Testing Condition
•
Communication Baud Rate: 38400
•
Platform: IPPC-950 with Pentium-233 CPU and 64 MB RAM.
•
I/O modules: Choose ADAM-4018/4052/5017/5051D as test module.
The other modules’ performace is similar.
Test Result
Units: Seconds
Adam Driver
Blocks*
Points
ADAM-4018
ADAM-4052
ADAM-5017
ADAM-5051D
1
8
0.156
0.06
0.09
0.072
8
64
1.13
0.305
0.301
0.169
16
128
2.19
0.4
0.565
0.307
32
256
4.47
0.626
1.07
0.603
64
512
8.78
1.24
2.12
1.17
128
1024
17.2
2.32
4.22
2.30
256
2048
34.2
4.61
8.36
4.66
Figure 5-31: Adam Module Driver Performance Figures
5-28
Summary
GeniDAQ can control the following devices: Advantech I/O hardware, serial port devices and the
devices with OPC servers. In addition, GeniDAQ supports the following I/O functions:
•
Analog input
•
Analog output
•
Digital input
•
Digital output
•
Temperature measurement
•
Counter/Frequency measurement/Pulse output
•
Alarm
•
Serial port communication
Connecting Your Devices
5-29
5-30
6
Historical
Trending System
Overview
GeniDAQ provides a historical trending display object that allows you to record past data and then play
it back at any time. Up to eight pens can be trended with one historical trending display object and up to
99 historical trending display objects are supported.
Besides scrolling backward and forward, the historical trending display object also allows you to go to a
specific time and search for a specific value. You can convert historical data to a text file for subsequent
use by other software programs.
Contents
•
Creating a historical trend
•
Configuring a historical trend
•
Going to a specific time with the GoTo button
•
Going to a specific value with the Search button
•
Converting historical trend data into a text file
•
Summary
Note:
GeniDAQ CE does not support the Historical Trend function.
Creating a Historical Trend
To create a historical trend:
1. Switch to the Display Designer
2. Select the historical trend display object in the display toolbox.
3. Drag and drop the historical trend object into the Display Designer. The historical trend appears in
the window
Figure 6-1: Historical Trend Display
6-2
The two buttons on the left are:
Previous Section button: Push it to scroll the historical data to previous section
Backward button: Push it to scroll the historical data back a half page
The two buttons on the right are
Forward button: Push it to scroll the historical data forward half a page.
Next Section button: Push it to scroll the historical data to next section.
The three buttons in the middle are:
GoTo button: Push it to go to a specific time.
Search button: Push it to go to a specific value.
Latest page button: Push it to go to the latest page.
Note:
A section is a collection of data spanning for a day, or for a duration from the
started run time to the stopped point.
Configuring a Historical Trend
To configure a historical trend:
1. Double-click the trend. The historical trend configuration dialog box appears:
Figure 6-2: Historical Trend Configuration Dialog Box
Historical Trending System
6-3
2. Press the ADD… button. The tagname selection dialog box appears. Specify the tagname that you
want to use for the trend.
3. Click the OK button.
Field Description
•
Number of samples in each graph point: A divisor similar to the “Update Rate” in many blocks. For
each point in the historical trending display, you can specify how many actual strategy samples will
pass before the point is displayed.
•
Number of graph points in one span: Specify the total number of graph points that will be displayed
at once.
•
Show grid: Specify whether to display the grid.
•
Vertical/Horizontal Resolutions: Specify the number of tick marks between each grid line.
•
# of tics: Specify the number of tick marks will be displayed for the vertical (Y-axis)
•
Start tics: Specify the number for the starting tick
•
End tics: Specify the number for the last tick
•
Historical trend channel: This field is used to add input data to display its historical values. You can
add a new input or delete an existing input. You can also specify the pen color of each data to draw
the historical trend.
Going to a Specific Time with GoTo Button
After launching the GeniDAQ runtime, the Forward button of the historical trend will be pushed by
default. It means that the historical trend draws the traces automatically.
Figure 6-3: The Historical Trend When Running
The starting date and time appears in the top-left corner of the historical trend. The ending date and time
is shown in the top-right corner.
You can push the Backward or Previous Section button to scroll back a half page or previous section.
You can also push the Forward or Next Section button to scroll forward a half page or next section. All
of them are toggled.
The GoTo button allows you to go to a specific time. When you click the GoTo button of the historical
trend at runtime, a dialog box appears:
6-4
Figure 6-4: Goto Specific Postion Configuration Dialog Box
Select the desired date and time section and then click the OK button. The historical trend will go to the
position that you specified and show the value on the page.
Searching a Specific Value with the Search Button
The Search button allows you to go to a specific value. When you click the Search button of the
historical trend at runtime, a dialog box appears:
Figure 6-5: Search Configuration Dialog Box
Historical Trending System
6-5
Select the channel number and the values for the searching condition, and then set the Start Searching
Position, Date and Time section. GeniDAQ allows you to search a specific section or all past sections by
selecting Search scope. Click the Find Next button to start searching. Historical trend searches the
position that matches the condition from the start searching position. If it finds the matched position, it
goes to the position and shows the value on the page.
Converting Historical Trend Data to a Text File
After the acquisition is complete or runtime is stopped, you can convert the historical trend data into a
text file.
1. Select File | HIST Conversion from the main menu:
Figure 6-6: Select File | HIST Conversion from the main menu
2. The Historical Data Conversion dialog box appears:
6-6
Figure 6-7: Historical Data Conversion Configuration Dialog Box
3. Select the desired historical trend and conversion range, data and time section. Then specify the
output file name. Click the OK button to start conversion. After the conversion is complete, a
message is displayed.
Figure 6-8: Conversion Complete Notification Box
4. You can use Windows Notepad or any other text editor to view the converted file.
Figure 6-9: Viewing Historical Trend Data in Windows Notepad
Note:
Historical trend keeps the historical data for 30 days by default. You can change it in
GeniDAQ.ini file by setting “HistDaysAgo” entry under the [System] section in
\Windows directory.
Historical Trending System
6-7
[System]
HistDaysAgo = 30
Note:
If you want to keep all historical files, you should set “HistDaysAgo=0”
Note:
The filename format of the binary file keeping the historical trend data is as follows:
YYYYMMDD.HNN
6-8
•
YYYY: represents the year, for example 2002
•
MM: represents the month, for example 10
•
DD: represents the date, for example 25
•
NN: represents the ordinal number for historical trend, for example, the HIST2 historical trend is
represented NN=02.
7
Monitoring Alarm
and Event
Overview
GeniDAQ provides an alarm notification feature to inform operators of process and system conditions.
This feature supports the display, logging, and printing of process alarms and network and system
events. Alarms represent warnings of process conditions, while events represent normal network or
system status messages.
GeniDAQ
Event Window
Alarm Display
Event Log File
(GeniDAQ.ELF,
GeniDAQ.ELH)
Alarm Log Block
Alarm Display
Printer
Figure 7-1: The Alarm Log Block Architecture
Contents
•
Configuring alarm settings using the Runtime Preference configuration dialog box
•
Configuring the alarm log block
•
Alarm system at runtime
•
Summary
Note:
GeniDAQ CE does not support alarm printing.
Configuring Alarm Settings Under the Runtime Preferences
To enable alarm and event logging and printing, you must check the Enable Event Log and Print Events
in the Runtime Preference configuration dialog box. You can open this dialog box by choosing Setup |
Runtime Preference… from the main menu.
7-2
Figure 7-2: Runtime Preference Configuration Dialog Box
Monitoring Alarm and Event
7-3
Configuring the Alarm Log Block
To configure alarm limits for a signal, you must use an alarm block to set the alarm limits and check the
alarm. Place an Alarm Log icon on the Task Designer configuration window and right-click the icon.
The Alarm Log Block configuration dialog box opens:
Figure 7-3: Alarm Log Block Configuration Dialog Box
This block has input and output capability. The block allows Alarm data from inputs to be logged to the
GeniDAQ Event Log File (\GENIDAQ\GENIDAQ.ELF). This data can also be displayed and acknowledged during runtime via the Event Log Viewer when the input data falls within the following regions:
1. If the input data is above the High-High value
2. If the data is between the High and High-High value
3. If the data is between the High and Low value
4. If the data is between the Low and Low-Low value
5. If the data is below the Low-Low value
The block also outputs a value depending on what data is seen by the block. This value can be fed to one
of the conditional display items to show the state of the alarm. For the following regions (regions
annotated above):
1. The block outputs a four (4)
2. The block outputs a two (2)
3. The block outputs a zero (0)
4. The block outputs a one (1)
5. The block outputs a three (3)
7-4
While the strategy is running, alarms may be acknowledged by double-clicking on the Alarm Log Event
(ALOG1 HI, etc.). Alarms will be in the color red until acknowledged. For the Event Log dialog box to
appear during Runtime, you must enable it via the View menu.
•
Wiring In: The block accepts input data and logs to the GeniDAQ Event Log File
(\GENIDAQ\GENIDAQ.ELF). Input data can also be displayed and acknowledged during runtime
via the Event Log Viewer.
•
Wiring Out: The block forwards input values to connected block(s).
Alarm System at Runtime
After launching the GeniDAQ runtime, all alarms and events will be shown in Event Log window and
can be printed out.
Figure 7-4: The Alarm System at Runtime
You can double-click on any alarm entry to acknowledge the message. The message’s color will change
from red to black and an acknowledgement message will appear in the window.
The alarm message will be logged into the file genidaq.elf and genidaq.elh which are saved in your
project directory. The genidaq.elf file stores the current messages and genidaq.elh file stores the historical messages. When the alarm messages exceed 100 entries in genidaq.elf, GeniDAQ will copy them
into genidaq.elh during the next run. Both files are ASCII format. You can view them in
NOTEPAD.EXE.
Monitoring Alarm and Event
7-5
Figure 7-5: Viewing the Log File in Windows Notepad
Summary
The Alarm Log Event provides comprehensive logging for your running strategy. In addition to providing real-time information and statistics, log files can be saved to provide a historical record of what
happened during the strategy.
7-6
8
Communicating
Through TCP/IP
Networking
Overview
GeniDAQ is designed to support both stand-alone and small-scale networked applications. All nodes
can share data with each other. For example, you can install individual I/O servers on each node to
avoid I/O server loading and increase overall performance.
GeniDAQ uses TCP/IP to provide connectivity for GeniDAQ nodes. Microsoft’s TCP/IP is available
for Windows NT and Windows 95/98 nodes, and is built into both of these operation systems.
Contents
•
Network Architecture
•
Configuring IP addresses and node names for remote nodes
•
Configuring network input blocks to map remote tags
•
Enabling event log to check network messages
•
TCP/IP Setup in Windows 98/95
•
TCP/IP Setup in Windows NT
•
Troubleshooting
•
Summary
Network Architecture
The GeniDAQ provides a simple client-based architecture for small-scale network configuration. You
only have to specify the remote tags that you wish on the client-site node. You do not need to make any
settings on the server-site node. Then client-site node will request data from the server node automatically. Each node has its own GeniDAQ application or strategy.
The network architecture is shown in the following diagram:
Net Tag
Data Center
Communication
Module
WinSock
Figure 8-1: GeniDAQ Network Architecture
8-2
For configuring TCP/IP in Windows 95/98 and Windows NT, please refer to the sections Setup TCP/IP
in Windows 95/98 and Setup TCP/IP in Windows NT.
Configure IP Addresses and Node Names on Client Site
After you configure the TCP/IP settings for the local node in the Control Panel, you should configure
the IP address of remote nodes to connect them on client site. By pressing the Settings button in the
Networking Setting dialog box under the GeniDAQ’s Setup | Network menu, the Remote Node
Settings dialog box appears. GeniDAQ allows you to map an IP address to a text name for easy
identification. The local node name and remote node names must be mapped to unique IP addresses.
Figure 8-2: Network Settings Configuration Dialog Box
Field Description
•
Local node name: Specifies the local client site name.
•
Node name: Specifies the remote server name.
•
IP address: Specifies the IP address of the remote server name.
•
Add button: After specifying Node name/IP address, press Add button to add a node into Remote
node list.
•
Delete button: Select an item in the Remote node list, then press the Delete button to delete it.
You can press the Advanced button to adjust the parameters for network communication, the Advanced
Option dialog box appears.
CommunicatingThrough TCP/IP Networking
8-3
Figure 8-3: Network’s Advanced Option Dialog Box
Field Description
•
Retry times: After connection, if a network block cannot get any data from a remote node after N
number of retries, the network block shows a timeout in the status bar. A zero (0) entry in the text
box indicates that as many attempts as are necessary will be made for network connection. Any
other integer in the text box will allow for connection attempts to stop after N number of tries.
•
Reconnect interval: Specifies time interval for reconnection in milliseconds.
•
Response timeout: Specifies time out for response in milliseconds.
•
Logging network messages: Enables logging of communication messages in the event window.
Configuring Network Input Blocks to Map Remote Tags
Block Information
NIN
Output 0 (Integer/floating point/string)
Figure 8-4: Network Input Block Information Diagram
8-4
Interface
•
Number of inputs: 0
•
Input type: none
•
Number of outputs: 1
•
Output type: integer, floating point or string
Description
This block has output capability that supplies other blocks with remote data from the network. Network
input block specifies the remote tag and data type.
Dialog Box Configuration
Figure 8-5: Net Tag Block Configuration Dialog Box
Field Description
•
Node name: Specifies the remote server name. It is configured in the Network Settings dialog box.
•
Task name/Tag name/Channels: Specifies the tag on the remote server node.
•
Data type: Specifies the data type of the tag. The option includes floating point, integer and string.
Make sure that the data type matches with that of the remote tag.
•
Default value: Specifies the value when disconnecting.
If the remote server is running, GeniDAQ allows you to configure the tag on-line. Press the Browse
button, a dialog box appears.
CommunicatingThrough TCP/IP Networking
8-5
Figure 8-6: Select Task & Tag Name Configuration Dialog Box
You click the desired task on the Task List field and the desired tag in the Tag List. Then the resulted
tag is shown in the Task Name and Tag Name fields.
Enabling Event Log to Check Network Messages
You can enable the event log to check network communication status by enabling the event log option
in the Runtime Preference under the Setup menu. You can then run it and check the network messages
in the event window as follows:
Figure 8-7: Running Strategy Showing Network Messages
8-6
Setup TCP/IP in Windows 98/95
This section provides supplemental instructions for configuring Microsoft TCP/IP. Follow these steps to
set up this configuration on Windows 95.
Note:
Have the Windows 95 disks or CD-ROM available. You may need them at the end of
this procedure.
1. Access the Windows 95 Control Panel and double-click the Network icon. The Network dialog box
appears as below.
Figure 8-8: Network Configuration Dialog Box for Windows 98/95
2. Verify that the following are installed by checking if they are listed in the installed components list
box
Network adapter driver that matches your installed network adapter hardware
TCP/IP Protocol
If both of the above network components are installed, skip to step 9 of this procedure
3. If a driver for your network adapter is not currently installed, click the Add button and select
Adapter from the network component list box of the Select Network Component Type dialog box.
CommunicatingThrough TCP/IP Networking
8-7
Figure 8-9:Windows Select Network Component Type Configuration Dialog Box
4. Click Add, and the Select Network Adapters dialog box appears.
Figure 8-10: Windows Select Network Adapters Configuration Dialog Box
5. Select the manufacturer of your network adapter from the Manufacturers list box, and then select
your network adapter type from the Network Adapters list box. When finished, click OK to install
the driver for your network adapter.
6. If the TCP/IP Protocol is not installed, click the Add button and select Protocol from the Select
Network Component Type dialog box. The Select Network Protocol dialog box appears.
Figure 8-11: Select Network Component Type Configuration Dialog Box
8-8
7. The Select Protocol dialog box appears. Select Microsoft from the Manufacturers list box, and then
select TCP/IP from the Network Protocols list box. When finished, click OK to install Microsoft
TCP/IP.
Figure 8-12: Windows Select Network Protocol Configuration Dialog Box
8. Select TCP/IP from the installed network components list box and click the Properties button. The
TCP/IP Properties dialog box appears, as shown below.
Figure 8-13: TCP/IP Properties Configuration Dialog for Windows 98/95
9. Select the IP Address tab. Enter your IP address and Subnet Mask into their respective fields. Ask
your network administrator for these values. Once you have entered these values, click OK. Do not
select the Obtain an IP address automatically checkbox.
CommunicatingThrough TCP/IP Networking
8-9
Note:
You can also select the Obtain an IP Address automatically option. If you enable the
option, you can issue a “ping Computer Name” command under a DOS prompt to
get the address.
10. Click OK to save your changes and exit the Network Control panel. Restart the computer. The
computer is now ready to run GeniDAQ over the TCP/IP protocol.
Setup TCP/IP in Windows NT
This section provides supplemental instructions for configuring Microsoft TCP/IP. Follow these steps to
set up this configuration on Windows NT.
Note:
Have the Windows NT disks or CD-ROM available. You may need them at the end
of this procedure
1. Access the Windows NT Control Panel and double-click the Network icon.
2. Verify that the following are installed by checking if they are listed in the installed components list
box
Network adapter driver that matches your installed network adapter hardware
TCP/IP Protocol
If both of the above network components are installed, skip to step 8 of this procedure
3. If a driver for your network adapter is not currently installed, select the Adapters tab and click Add
button from the Network dialog box.
Figure 8-14: Network Adapter Listing Dialog Box
8-10
4. The Select Network Adapter dialog box appears. Select the manufacturer of your network adapter
from the Manufacturers list box, and then select your network adapter type from the Network
Adapter list box. When finished, click OK to install the driver for your network adapter.
Figure 8-15: Select Network Adapter Configuration Dialog Box
5. If the TCP/IP Protocol is not installed, select the Protocol tab and click the Add button.
Figure 8-16: Network Protocols Listing Dialog Box
CommunicatingThrough TCP/IP Networking
8-11
6. The Select Network Protocol dialog box appears. Select TCP/IP Protocol from the Network Protocol
list box. When finished, click OK to install TCP/IP Protocol.
Figure 8-17: Network Protocol Configuration Dialog Box
7. Select TCP/IP Protocol from the Protocol tab and click the Properties button. The TCP/IP Properties
dialog box appears, as shown below.
Figure 8-18: TCP/IP Properties Configuration Dialog Box
8. Select the IP Address tab. Choose the Specify an IP address checkbox and enter your IP address,
Subnet Mask, and Default Gateway into their respective fields. Ask your network administrator for
these values. Once you have entered these values, click OK. You can also select Obtain an IP
address from a DHCP server.
8-12
Note:
If you enable the option, you can issue an “ipconfig” command under a DOS prompt
to get the address.
9. Click OK to save your changes and exit the Network Control panel. Restart the computer. The
computer is now ready to run GeniDAQ over the TCP/IP protocol.
Troubleshooting
If the nodes cannot communicate with each other, you can check the following:
1. To test remote access using Ping:
a. Use ping or ipconfig to get the server’s IP address on the server node
b. Issue ping with the IP address of the server node on the client node. The remote node should
respond immediately.
c. If ping fails, please check your network settings.
2. Note if the nodes communicate with other nodes located on different networks, you should use DNS
(Domain Name System) for name resolution.
3. Network port is 700 by default. You can change it in GeniDAQ.ini file by setting “NetworkPort”
entry under the [System] section in \Windows directory.
[System]
NetworkPort = 700
If the network port is used by another applications, you have to change it to another value.
Note:
Any number of network input blocks can be used at one time, limited only by your
system’s speed and memory. It is suggested that the number of network input
blocks should not exceed 256/per node. In addition, each node should not connect
to more than 16 nodes.
Summary
GeniDAQ’s network supports TCP/IP protocol and the following data types: integer, floating point, and
string. Each GeniDAQ node can be as client or/and server node. In addition, GeniDAQ provides
network message logging and monitoring
CommunicatingThrough TCP/IP Networking
8-13
8-14
9
Runtime and
Security System
Overview
GeniDAQ Runtime (GeniRUN.EXE) takes advantage of the Windows operating system to provide a
real-time, multi-tasking environment that combines the logical flow of a previously defined strategy
with any number of Display objects in the Operator Panel. Runtime executes your strategy in real-time,
based upon data received from I/O devices or by manual operator entry. Through GeniDAQ Runtime,
the process can be monitored and controlled, data can be logged to a disk, replayed, and manipulated.
GeniDAQ Runtime only provides runtime function. However, GeniDAQ builder (GeniDAQ.EXE)
provides editing and runtime environment for developing and testing your strategies.
In order to avoid unintentional or unauthorized operations which may affect system stability, GeniDAQ
security system provides privilege control and password protection. Password protection offers built-in
log-on with up to 255 levels of assignable access, providing extension control for password access and
conditional operations.
Contents
Working with GeniDAQ Runtime
Configuring Runtime properties
Configuring password security
Log-in and Log-off at runtime
Working with display control object at runtime
Working with GeniDAQ Runtime
The GeniDAQ Runtime system behaves in different ways, depending on the choices made by the
designer who created the strategy and corresponding displays. Its overall behavior is determined by the
way Task Designer blocks have been arranged and connected, in conjunction with the Scan Period(s)
set in the Setup/Tasks menu. If the Display has been designed with output capability (i.e., buttons,
numeric displays that can be edited, etc.), the associated parameters can be changed during GeniDAQ
Runtime. During GeniDAQ Runtime, commands and data can be entered using either the keyboard or
the mouse.
Runtime Environment
The GeniDAQ Runtime environment is shown below:
9-2
Figure 9-1: GeniDAQ Runtime Environment
: Start icon to start running the strategy.
: Stop icon to stop the running strategy.
: Pause icon to pause the running strategy.
: Resume icon to resume the paused strategy.
: Lock icon to lock the strategy.
: Refresh icon to refresh the screen.
To display or hide the Status Bar at the bottom of the Runtime screen, highlight the View/Status Bar
command with your mouse. The Status Bar allows you to get quick, concise help on menu commands.
As you highlight a menu item with your mouse, you can view information on the item in the status bar
at the bottom of the runtime window. During runtime, status information is displayed such as any errors
that have occurred, or whether the strategy is running normally. Errors generally include hardware
driver errors or errors due to timing problems. The error codes are listed in the Appendix under
Runtime Error Code Listing.
Starting Runtime
Starting the GeniDAQ Runtime session is performed from the following methods:
1. Enter the Advantech GeniDAQ 4.0 folder, and double-click on the GeniDAQ Runtime icon. Open
the desired strategy file with the suffix “.gni”, and press START on the GeniDAQ Runtime Menu
Bar.
2. Create a new icon with “GeniRUN” <strategy> as the command line in the startup group if you want
Runtime and Security System
9-3
the strategy to be loaded and started upon running when Windows is startup.
3. You can also create a new icon with “GeniRUN <strategy>” as the command line. This will cause
the strategy to be loaded and started upon running.
Exiting Runtime
When you have finished working in Runtime, exiting back to Windows is performed by pressing the
STOP menu item on the Runtime menu bar. After you stop the runtime system, you can either restart by
pressing start, or you can exit the GeniDAQ Runtime system by entering the File menu and pressing
Exit.
Configuring Runtime Properties
Figure 9-2: Runtime Preference Configuration Dialog Box
Runtime Preference...
The Runtime Preference dialog box is used to configure the runtime properties of a strategy. In
GeniDAQ you can specify how many errors will be allowed to occur before runtime will stop because
of excessive errors. A runtime error is an error that usually occurs as a result of improper settings
within GeniDAQ, or because of hardware problems. A list of runtime errors is included in the appendix
of this manual. Acceptable values for No. of errors allowed before stopping are between 0 and 32767.
In addition to the No. of errors allowed before stopping item, you can enable/disable the following
blocks to invoke the related functions during strategy execution.
Log errors to the error file “RUNERR.LOG”
If this item is enabled, runtime errors are logged to the file “RUNERR.LOG”. The “RUNERR.LOG”
file is created in the GeniDAQ directory. The shortcut word is “f” or “F”. You can press “Alt+f” or
“Alt+F” to enable/disable this option.
9-4
Beep when error occurs during the run
If the item is enabled, the GeniDAQ workstation will generate a beep sound when an error occurs
during runtime. The shortcut word is “b” or “B”. You can press “Alt+b” or “Alt+B” to enable/disable
this option.
Enable Event Log
If this item is enabled, GeniDAQ events that occur will be written to the event log files
“GENIDAQ.ELF” (first 100 events) and “GENIDAQ.ELH” (remaining events). Except log files, the
Event Log Viewer/Alarm Acknowledgment Dialog Box can be displayed during runtime to reflect the
event log information. GeniDAQ events consist of:
1. The start and stop time/date of the strategy
2. If in secure mode (password has been enabled by checking “Enable Password Checking”), password
user ID/time of day will be logged when user logs in or out.
3. Alarm information and acknowledgment if Alarm Log Block has been connected.
Figure 9-3: Event Log Viewer/Alarm Acknowledgment dialog box
Event Log Viewer/Alarm Acknowledgment Dialog Box
This item can be invoked by selecting Event Log from the View menu while the strategy is running. If
you want to hide this dialog box, click on the Event Log menu option again and the dialog box will
disappear.
Figure 9-4: Invoke Event Log option
Runtime and Security System
9-5
While the strategy is running, alarms may be acknowledged by double-clicking on the Alarm Log
Event (ALOG1.HI, etc. ). Alarms will be in the color red until acknowledged.
The shortcut word is “l” or “L”. You can press “Alt+l” or “Alt+L” to enable/disable this option.
Print events
After you enable the Event Log option, this Print events option will be activated and you can enable/
disable it. If you enable the Print events option, you can select to print all GeniDAQ events that occur
or alarm events only. This enabled setting will output events immediately to the connected printer. This
provides real-time event printing. The shortcut word is “e” or “E”. You can press “Alt+e” or “Alt+E” to
enable/disable this option.
Enable Operational Security Checking
Before selecting the Enable Operational Security checking option, you are advised to add users and
passwords in GeniDAQ system using the Administration... function. If Enable Password Checking is
selected, GeniDAQ will request you to key in a user ID and password when you start to run a strategy
or unlock a locked strategy while it is in runtime. The shortcut key is “p” or “P”. You can press “Alt+p”
or “Alt+P” to enable/disable this option.
Figure 9-5: Login User ID and Password
Start running with LOCK on
If this option is enabled, GeniDAQ will lock the screen when you start to run a strategy. You have to
key in user ID and password to unlock it if the “Enable Password Checking” option is enabled. If the
“Enable Password Checking” option is disabled, you can press “ESC” to unlock the screen. This option
is used for system security. There is no shortcut for this option.
Frame layout
Frame layout option is used to set up the display layout while it is in runtime. There are three options:
Menu bar, Tool bar and Title bar. You can enable/disable these three items, as you want.
Display refresh period
Display refresh period is used to specify the period to refresh the screen in millisecond.
9-6
Configuring Password Security
To enter a password that gives you access to GeniDAQ Builder’s configuration settings, complete the
following procedure.
Administration
1. Select Setup | Administration from the GeniDAQ main menu. Enter a password in the input box.
When GeniDAQ is started for the first time, the Supervisor Password is blank. Once a Supervisor
Password is entered by using the Setup/Change Password dialog Box, the Supervisor Password stays
in effect unless changed.
Figure 9-6: Password Configuration Dialog Box
Note:
If the Supervisor Password has been inadvertently forgotten, you may start fresh by
deleting the SECURITY.PW file located in the GeniDAQ directory.
Note:
To enable password security for GeniDAQ CE Runtime, you have to download the
SECURITY.PW file located in the GeniDAQ directory to \harddisk\genidaqce
directory on the HMI-640S via the ActiveSync utility. For more inforomation about
using ActiveSync, please refer to chapter 12.
To create a new user account for the GeniDAQ Builder console, do the following:
1. Enter the new User ID and Password in the Users Administration configuration dialog box. The
User ID and password can consist of as little as no characters, for which simply pressing the ESC
key will unlock the strategy. The User ID and Password can contain up to 16 characters or spaces,
with no constraints on format.
2. Specify the Privilege number of each User. The privilege is used to manage security of the system.
You can design your system, display window and control object with privilege constraints to lock
and protect user options. The privilege number is from 1 to 255. The larger number, the higher
one’s level of privilege to access the display window and control objects. The privelege number ‘-1’
is reserved for the supervisor.
3. Click the Add User button.
To delete a user account from the GeniDAQ Builder console:
1. Highlight the User ID that you want to remove in the User List pane and then click the Delete
button.
Runtime and Security System
9-7
Figure 9-7: Users Administration Configuration Dialog Box
Change Password
To change the GeniDAQ Builder password, do the following:
1. Select Setup | Change Password from the main menu.
2. The Change Password configuration dialog box opens. Enter the User ID whose password you want
to change, the Old Password and the New Password.
3. Click the OK button to save your changes.
Figure 9-8: Change Password Configuration Dialog Box
If you want GeniDAQ Runtime to check for a password, you must enable this feature in the Runtime
Preferences configuration dialog box. Select Setup | Runtime Preference to display this dialog box:
9-8
Figure 9-9: Runtime Preference Configuration Dialog Box
Log-in and Log-off at Runtime
If you enable the Starting running with LOCK on option, GeniDAQ will lock the screen when you start
to run a strategy. You have to press “ESC” key to unlock the screen.
If you enable password checking option, GeniDAQ will request you to key in a user ID and password
when you start to run a strategy or unlock a locked strategy while it is in runtime.
Figure 9-10: Login Dialog Box
If your system doesn’t support a keyboard, GeniDAQ provides a software keypad to input user ID and
password.
Note:
GeniDAQ version 4.1 also support software keypad for Numeric Control system for
Windows 98/NT. You can enable it by setting NumericKeypad = 1 in
\Windows\GeniDAQ.ini file
Runtime and Security System
9-9
Figure 9-11: GeniDAQ Screen Keypad
Working With Display Control Object at Runtime
In order to avoid unintentional or unauthorized operations which may affect system stability, GeniDAQ
provides privilege control for display control objects, including binary button, menu button, conditional
button, numeric control, knob and slider control. The privilege level is from 0 to 255, with the larger
number having a higher privilege. For example, if the privilege level of a button is 100, then a user’s
privilege must be larger than or equal to 100 to press this button. Please refer to display control objects
in Chapter 4, Configuring Your Display View with Display Designer.
9-10
10
Advanced
BasicScript
Programming for
Your Specific
Needs
Overview
Script designer is essentially a text editor with smart features for editing script code. The script code will
be compiled into p-code after editing so it will not need to be compiled again at run-time. The syntax of
BasicScript is like as Microsoft VBA (Visual Basic for Application in Excel, Word, Access, etc.) and
Microsoft Visual Basic. BasicScript source code and be compiled and executed in Script designer
without any modifications, provided that only common functions are used. Script designer supports the
cut, copy and paste functions, just like the VBA development environment.
The BasicScript macro editor/debugger provides a complete environment for editing and debugging
macro code. It supports advanced debugging capabilities including the ability to step and trace code, set
break points and debug variables, structures and arrays. You can debug your complicated code in the
editor before run-time.
The Script designer can be used for editing the main script and other task scripts. The main script
controls the operation of the entire system, including staring a task, stopping a task and switching to the
desired startup display. The task script is used to take of actions before and after executing tasks, for
example, initializing and resetting the values. In addition, BasicScript block is used to calculate and
analyze real-time I/O data in each task scan. GeniDAQ provides a variety of commands to process realtime I/O data.
Note:
GeniDAQ CE does not support BasicScript.
Contents
•
Familiar with Script designer
•
Editing your scripts
•
Running your scripts
•
Debugging your scripts
•
Programming with GeniDAQ
•
BasicScript GeniDAQ commands
•
Summary
Script Designer Basics
This section provides general information that will help you work most effectively with Script Designer.
It includes an overview of Script Designer’s application window—the interface you’ll use to edit, run,
and debug your BasicScript scripts—as well as lists of keyboard shortcuts and information on using the
Help system.
Toolbar
The following list briefly explains the purpose of each of the tools on Script Designer’s toolbar. These
tools are discussed in more detail later in the chapter, in the context of the procedures in which they are
used.
10-2
•
Tool: Function
•
Cut: Removes the selected text from the script and places it on the Clipboard.
•
Copy: Copies the selected text, without removing it from the script, and places it on the Clipboard.
•
Paste: Inserts the contents of the Clipboard at the current position of the insertion point.
•
Undo: Reverses the effect of the proceeding editing change(s).
•
Start : Begins execution of a script.
•
Break: Suspends execution of an executing script and places the instruction pointer on the next line
to be executed.
•
End: Stops execution of a script.
•
Toggle: Adds or removes a breakpoint on a line of BasicScript
•
Breakpoint: code.
•
Add Watch: Displays the Add Watch dialog box, in which you can specify the name of a BasicScript
variable. That variable, together with its value (if any), is then displayed in the watch pane of Script
Designer’s application window.
•
Calls: Displays the list of procedures called by the currently executing BasicScript script. Available
only during break mode.
•
Single Step: Executes the next line of a BasicScript script and then suspends execution of the script.
If the script calls another BasicScript procedure, execution will continue into each line of the called
procedure.
•
Procedure Step: Executes the next line of a BasicScript script and then suspends execution of the
script. If the script calls another BasicScript procedure, BasicScript will run the called procedure in
its entirety.
Note:
If you forget the name of a toolbar tool, pass the pointer over the tool to display its
name.
Editing Your Script
This section explains how to use Script Designer to edit BasicScript code. Although, in some respects,
editing code with Script Designer is like editing regular text with a word-processing program, Script
Designer also has certain capabilities specifically designed to help you edit BasicScript code.
You’ll learn how to move around within your script, select and edit text, add comments to your script,
break long BasicScript statements across multiple lines, search for and replace selected text, and
perform a syntax check of your script.
This subsection provides an overview of the editing operations you can perform with Script Designer—
including inserting, selecting, deleting, cutting, copying, and pasting material—and explains how to
undo, or reverse, the most recent editing operations. You may wish to refer to the lists of keyboard
shortcuts in the preceding section, which contain a group of editing shortcuts that can be used to perform
many of the operations discussed here.
Navigating Within a Script
The lists of keyboard shortcuts in the preceding section contain a group of navigating shortcuts, which
you can use to move the insertion point around within your script. When you move the insertion point
with a keyboard shortcut, Script Designer scrolls the new location of the insertion point into view if it is
not already displayed. You can also reposition the insertion point with the mouse and the Goto Line
command, as explained below.
Script Designer differs from most word-processing programs in that it allows you to place the insertion
Advanced BasicScript Programming for Your Specific Needs
10-3
point anywhere within your script, including in “empty spaces.” (Empty spaces are areas within the
script that do not contain text, such as a tab’s expanded space or the area beyond the last character on a
line.)
Here’s how to use the mouse to reposition the insertion point. This approach is especially fast if the area
of the screen to which you want to move the insertion point is currently visible.
To move the insertion point with the mouse:
1. Use the scroll bars at the right and bottom of the display to scroll the target area of the script into
view if it is not already visible.
2. Place the mouse pointer where you want to position the insertion point.
3. Click the left mouse button.
The insertion point is repositioned.
Note:
When you scroll the display with the mouse, the insertion point remains in its
original position until you reposition it with a mouse click. If you attempt to perform
an editing operation when the insertion point is not in view, Script Designer automatically scrolls the insertion point into view before performing the operation.
Here’s how to jump directly to a specified line in your script. This approach is especially fast if the area
of the screen to which you want to move the insertion point is not currently visible but you know the
number of the target line.
To move the insertion point to a specified line in your script:
1. Press F4. Script Designer displays the Goto Line dialog box.
2. Enter the number of the line in your script to which you want to move the insertion point.
3. Click the OK button or press Enter.
The insertion point is positioned at the start of the line you specified. If that line was not already
displayed, Script Designer scrolls it into view.
Note:
The insertion point cannot be moved so far below the end of a script as to scroll the
script entirely off the display. When the last line of your script becomes the first line
on your screen, the script will stop scrolling, and you will be unable to move the
insertion point below the bottom of that screen.
Inserting Text
In Script Designer, inserting text and other characters such as tabs and line breaks works much the same
as it does in a word-processing program: you position the insertion point at the desired location in the
script and start typing. However, as noted in the preceding subsection, Script Designer lets you position
the insertion point in “empty spaces”. This means that you can also insert text into empty spaces—a
feature that comes in handy when you want to insert a comment in the space beyond the end of a line in
your script. Adding comments to your script is discussed later in this section. When you insert characters
beyond the end of a line, the space between the insertion point and the last character on the line is
backfilled with tab characters.
Another way in which Script Designer differs from word-processing programs is that in Script Designer,
text does not wrap. If you keep entering text on a given line, eventually you will reach a point at which
you can enter no more text on that line. Therefore, you control the line breaks by pressing Enter when
you want to insert a new line in your script. The effect of pressing Enter depends on where the insertion
10-4
point is located at the time:
•
If you press Enter with the insertion point at or beyond the end of a line, a new line is inserted after
the current line.
•
If you press Enter with the insertion point at the start of a line, a new line is inserted before the
current line.
•
If you press Enter with the insertion point within a line, the current line is broken into two lines at
that location.
If you press Tab, a tab character is inserted at the location of the insertion point, which causes text after
the tab to be moved to the next tab position. If you insert new text within a tab’s expanded space, the text
that originally appeared on that line is moved to the next tab position each time the new text that you are
entering reaches the start of another tab position.
When you enter certain types of text in Script Designer, the text automatically appears in a distinctive
color. The default colors, which you can change, are as follows:
•
When you type keywords, they appear in blue.
•
When you type identifier text, it appears in black.
•
When you type comments (beginning with either an apostrophe or “REM”), they appear in green.
Selecting Text
You can use either the mouse or the keyboard to select text and other characters in your script. Regardless of which method you use, you should be aware that in Script Designer, you can select either a
portion of one line or a series of whole lines. You cannot select a portion of one line plus one or more
whole lines. When you are selecting multiple lines and start or end your selection partway through a line,
Script Designer automatically extends the selection to include the entire starting and ending lines.
To select text with the mouse:
1. Place the mouse pointer where you want your selection to begin.
2. While pressing the left mouse button, drag the mouse until you reach the end of your selection, and
release the mouse button.
-OrWhile pressing Shift, place the mouse pointer where you want your selection to end and click the left
mouse button. The selected text is highlighted on your display.
Another way to select one or more whole lines with the mouse is to start by placing the mouse pointer in
the left margin beside the first line you want to select. The pointer becomes a reverse arrow, which
points toward the line of text. Click the left mouse button to select a single line; press the left mouse
button and drag up or down to select multiple lines.
Here’s how to use keyboard shortcuts to select text in your script.
To select text with the keyboard:
1. Place the insertion point where you want your selection to begin.
2. While pressing Shift, use one of the navigating keyboard shortcuts to extend the selection to the
desired ending point.
The selected text is highlighted on your display.
Advanced BasicScript Programming for Your Specific Needs
10-5
Note:
When you intend to select an entire single line of text in your script, it is important to
remember to extend your selection far enough to include the hidden end-of-line
character. This character inserts a new line in your script.
Here’s how to use the keyboard to select one or more whole lines in your script.
To select an entire line of text with the keyboard:
1. Place the insertion point at the beginning of the line you want to select.
2. Press Shift + Down arrow. The entire line, including the end-of-line character, is selected.
3. To extend your selection to include additional whole lines of text, repeat step 2.
Once you have selected text within your script, you can perform a variety of other editing operations on
it, including deleting the text, placing it on the Clipboard by either cutting the text or copying it), and
pasting it.
Deleting Text
When you delete material, it is removed from your script without being placed on the Clipboard. This
section explains how to remove one or more characters, selected text or entire lines from your script.
To delete text:
To remove a single character to the left of the insertion point, press BkSp once; to remove a single
character to the right of the insertion point, press Del once. To remove multiple characters, hold down
BkSp or Del.
-OrTo remove text that you have selected, press BkSp or Del.
-OrTo remove an entire line, place the insertion point in that line and press Ctrl+Y.
Here’s how to remove an unwanted line break from your script.
To combine the current line with the following line:
1. Place the insertion point after the last character on the current line.
2. Press Del once to delete the hidden end-of-line character.
The current line and the following line are combined.
Note:
If any spaces were entered at the end of the current line, you may have to press
Del one or more additional times to remove these hidden characters first before you
can delete the end-of-line character. Pressing BkSp with the insertion point at the
start of a line has no effect—that is, it will not combine the current line with the
preceding line.
Cutting and Copying Text
You can place material from your script on the Clipboard by either cutting it or copying it.
To cut a selection:
•
Press Ctrl+X.
The selection is removed from your script and placed on the Clipboard.
10-6
To copy a selection:
•
Press Ctrl+C.
The selection remains in your script, and a copy of it is placed on the Clipboard.
Pasting Text
Once you have cut or copied material to the Clipboard, here’s how to paste it into your script at another
location.
To paste the contents of the Clipboard into your script:
1. Position the insertion point where you want to place the contents of the Clipboard.
2. Press Ctrl+V.
The contents of the Clipboard appear at the location of the insertion point. If you wish to delete a block
of text and insert the contents of the Clipboard in its place, you can combine the two operations by first
selecting the text you want to remove and then pressing Ctrl+V to replace it with the contents of the
Clipboard.
Undoing Editing Operations
You can undo editing operations that produce a change in your script, including:
•
The insertion of a series of characters
•
The insertion of a block of text from the Clipboard
•
The deletion of a series of characters
•
The deletion or cutting of a block of text
You can’t undo operations that don’t produce any change in your script, such as moving the insertion
point, selecting text, and copying material to the Clipboard.
To undo an editing operation:
•
Press Ctrl+Z.
Your script is restored to the way it looked before you performed the editing operation.
Adding Comments to Your Script
You can add comments to your script to remind yourself or others of how your code works. Comments
are ignored when your script is executed. In BasicScript, the apostrophe symbol ( ‘ ) is used to indicate
that the text from the apostrophe to the end of the line is a comment.
Here’s how to designate an entire line as a comment.
To add a full-line comment:
1. Type an apostrophe ( ‘ ) at the start of the line.
2. Type your comment following the apostrophe.
When your script is run, the presence of the apostrophe at the start of the line will cause the entire line to
be ignored.
Here’s how to designate the last part of a line as a comment.
To add a comment at the end of a line of code:
Advanced BasicScript Programming for Your Specific Needs
10-7
1. Position the insertion point in the empty space beyond the end of the code line.
2. Type an apostrophe ( ‘ ).
3. Type your comment following the apostrophe.
Figure 10-1: Adding Comments to Script
When your script is run, the code on the first portion of the line will be executed, but the presence of the
apostrophe at the start of the comment will cause the remainder of the line to be ignored.
Although you can place a comment at the end of a line containing executable code, you cannot place
executable code at the end of a line containing a comment. The presence of the apostrophe at the start of
the comment would cause the balance of the line (including the code) to be ignored.
Breaking a BasicScript Statement across Multiple Lines
By default, in Script Designer, a single BasicScript statement can extend only as far as the right margin,
and each line break represents a new statement. However, you can override this default if you want to
break a long statement across two or more lines.
Here’s how to indicate that two or more lines of BasicScript code should be treated as a single statement
when your script is run.
To break a BasicScript statement across multiple lines:
1. Type the BasicScript statement on multiple lines, exactly the way you want it to appear.
2. Place the insertion point at the end of the first line in the series.
3. Press the spacebar once to insert a single space.
4. Type an underscore ( _ ).
Note:
The underscore is the line-continuation character, which indicates that the BasicScript statement continues on the following line.
5. Repeat steps 2–4 to place a line-continuation character at the end of each line (except the last) in the
series.
10-8
Figure 10-2: Breaking a Statement Across Multiple Lines
When you run your script, the code on this series of lines will be executed as a single BasicScript
statement, just as if you had typed the entire statement on the same line.
Checking the Syntax of a Script
When you try to run or debug a script whose syntax hasn’t been checked, Script Designer first performs
a syntax check automatically.
Here’s how to perform a syntax check manually when you are editing your script, without having to run
it.
Figure 10-3: Checking a Script’s Syntax
Advanced BasicScript Programming for Your Specific Needs
10-9
To perform a syntax check:
1. From the Run menu, choose the Syntax Check command. Script Designer either indicates that no
errors have been found or displays an error message. This message specifies the first line in your
script where an error has been found, and briefly describes the nature of the error.
2. Click the OK button or press Enter. If Script Designer has found a syntax error, the line containing
the error is highlighted on your display.
3. Correct the syntax error.
4. Repeat steps 1–3 until you have found and corrected all syntax errors.
Running Your Scripts
Once you have finished editing your script, you will want to run it to make sure it performs the way you
intended. You can also pause or stop an executing script.
Here’s how to compile your script, if necessary, and then execute it.
To run your script:
•
Click the Start tool on the toolbar.
-OrPress F5.
The script is compiled (if it has not already been compiled), the focus is switched to the parent window,
and the script is executed.
Note:
During script execution, Script Designer’s application window is available only in a
limited manner. Some of the menu commands may be disabled, and the toolbar
tools may be inoperative.
To pause an executing script:
•
Press Ctrl+Break.
Execution of the script is suspended, and the instruction pointer (a gray highlight) appears on the line of
code where the script stopped executing.
Note:
The instruction pointer designates the line of code that will be executed next if you
resume running your script.
To stop an executing script:
•
Click the End tool on the toolbar.
Note:
10-10
Many of the functions of Script Designer’s application window may be unavailable
while you are running a script. If you want to stop your script but find that the toolbar
is currently inoperative, press Ctrl+Break to pause your script, then click the End
tool.
Debugging Your Scripts
This section presents some general information that will help you more effectively use Script Designer’s
debugging capabilities. The section also explains how to trace the execution of your script, how to set
and remove breakpoints, and how to add watch variables and modify their value.
Using the BasicScript Debugger
Figure 10-4: Using the BasicScript Debugger
While debugging, you are actually executing the code in your script line by line. Therefore, to prevent
any modifications to your script while it is being run, the edit pane is read-only during the debugging
process. You are free to move the insertion point throughout the script, select text and copy it to the
Clipboard as necessary. You can also set breakpoints, and add and remove watch variables, but you
cannot make any changes to the script until you stop running it.
To let you follow and control the debugging process, Script Designer displays an instruction pointer on
the line of code that is about to be executed. This line will be executed next if you either proceed with
the debugging process or run your script at full speed. When the instruction pointer is on a line of code,
the text on that line appears in black on a gray background that spans the width of the entire line.
Tracing Script Execution
Script Designer gives you two ways to trace script execution—single step and procedure step—, both of
which involve stepping through your script code line by line. The distinction between the two is that the
single step process traces into calls to user-defined functions and subroutines, whereas the procedure
step process does not trace into these calls (although it does execute them).
Advanced BasicScript Programming for Your Specific Needs
10-11
Figure 10-5: Tracing a Script Statement
Here’s how to trace the execution of your script using the single step or procedure step method.
To step through your script:
1. Click the Single Step or Procedure Step tool on the toolbar.
-OrPress F8 (Single Step) or Shift+F8 (Procedure Step).
Script Designer places the instruction pointer on the Sub Main line of your script.
Note:
When you initiate execution of your script with any of these methods, the script will
first be compiled, if necessary. Therefore, there may be a slight pause before
execution actually begins. If your script contains any compile errors, it will not be
executed. To debug your script, first correct any compile errors, then initiate execution again.
2. To continue tracing the execution of your script line by line, repeat step 1. Each time you repeat step
1, Script Designer executes the line containing the instruction pointer and moves the instruction
pointer to the next line to be executed.
3. When you finish tracing the execution of your script, click the Start tool on the toolbar (or press F5)
to run the balance of the script. Click the End tool to halt execution of the script.
When you are stepping through a subroutine, you may need to determine the procedure calls by which
you arrived at that point in your script.
Here’s how to use the Calls dialog box to obtain this information.
10-12
To display the Calls dialog box:
1. Click the Calls tool on the toolbar. Script Designer displays the Calls dialog box, which lists the
procedure calls made by your script in the course of arriving at the present subroutine.
2. From the Calls dialog box, select the name of the procedure you wish to view.
3. Click the Show button.
Script Designer highlights the currently executing line in the procedure you selected, scrolling that line
into view if necessary (During this process, the instruction pointer remains in its original location in the
subroutine.). When you are stepping through a subroutine, you may want to repeat or skip execution of a
section of code.
Here’s how to use the Set Next Statement command to move the instruction pointer to another line
within that subroutine.
To move the instruction pointer to another line within a subroutine:
1. Place the insertion point in the line where you want to resume stepping through the script.
2. From the Debug menu, choose the Set Next Statement command.
The instruction pointer moves to the line you selected, and you can resume stepping through your script
from there.
Note:
You can only use the Set Next Statement command to move the instruction pointer
within the same subroutine. If you place the insertion point on a line that is not in
the same subroutine, the Set Next Statement command will be disabled in the
Debug menu.
Setting and Removing Breakpoints
If you want to start the debugging process at the first line of your script and then step through your code
line by line, the method described in the preceding subsection works fine. If you only need to debug one
or more portions of a long script, that method can be cumbersome.
Figure 10-6: Setting and Removing Breakpoints
Advanced BasicScript Programming for Your Specific Needs
10-13
An alternate strategy is to set one or more breakpoints at selected lines in your script. Script Designer
suspends execution of your script just before it reaches a line containing a breakpoint, thereby allowing
you to begin or resume stepping through the script from that point.
Setting Breakpoints
You can set breakpoints to begin the debugging process partway through your script, to continue
debugging at a line outside the current subroutine, and to debug only selected portions of your script.
Valid breakpoints can only be set on lines in your script that contain code, including lines in functions
and subroutines. Although you can set a breakpoint anywhere within a script prior to execution, when
you compile and run the script, invalid breakpoints (that is, breakpoints on lines that don’t contain code)
are automatically removed. While you are debugging your script, Script Designer will beep if you try to
set a breakpoint on a line that does not contain code.
Here’s how to begin the debugging process at a selected point in your script.
To start debugging partway through a script:
1. Place the insertion point in the line where you want to start debugging.
2. To set a breakpoint on that line, click the Toggle Breakpoint tool on the toolbar.
-OrPress F9.
The line on which you set the breakpoint now appears in contrasting type.
3. Click the Start tool on the toolbar.
-OrPress F5.
Script Designer runs your script at full speed from the beginning and then pauses prior to executing the
line containing the breakpoint. It places the instruction pointer on that line to designate it as the line that
will be executed next when you proceed with debugging or resume running the script.
If you want to continue debugging at another line in the same subroutine, you can use the Set Next
Statement command in the Debug menu to move the instruction pointer to the desired line.
If you want to continue debugging at a line that isn’t within the same subroutine, here’s how to move the
instruction pointer to that line.
To continue debugging at a line outside the current subroutine:
1. Place the insertion point in the line where you want to continue debugging.
2. To set a breakpoint on that line, press F9.
3. To run your script, click the Start tool on the toolbar or press F5.
The script executes at full speed until it reaches the line containing the breakpoint and then pauses with
the instruction pointer on that line. You can now resume stepping through your script from that point.
If you only need to debug parts of your script, here’s how to facilitate the task by using breakpoints.
To debug selected portions of your script:
1. Place a breakpoint at the start of each portion of your script that you want to debug.
10-14
Note:
Up to 255 lines in your script can contain breakpoints.
2. To run the script, click the Start tool on the toolbar or press F5. The script executes at full speed until
it reaches the line containing the first breakpoint and then pauses with the instruction pointer on that
line.
3. Step through as much of the code as you need to.
4. To resume running your script, click the Start tool on the toolbar or press F5. The script executes at
full speed until it reaches the line containing the second breakpoint and then pauses with the instruction pointer on that line.
5. Repeat steps 3 and 4 until you have finished debugging the selected portions of your script.
Removing Breakpoints
Breakpoints can be removed either manually or automatically. Here’s how to delete breakpoints manually one at a time.
To remove a single breakpoint manually:
1. Place the insertion point on the line containing the breakpoint that you want to remove.
2. Click the Toggle Breakpoint tool on the toolbar.
-OrPress F9.
The breakpoint is removed, and the line no longer appears in contrasting type.
Here’s how to delete all breakpoints manually in a single operation.
To remove all breakpoints manually:
•
Select the Clear All Breakpoints command from the Debug menu.
Script Designer removes all breakpoints from your script.
Breakpoints are removed automatically under the following circumstances: (1) as mentioned earlier,
when your script is compiled and executed, breakpoints are removed from lines that don’t contain code.
(2) When you exit from Script Designer, all breakpoints are cleared.
Adding a Watch Variable
As you debug your script, you can use Script Designer’s watch pane to monitor selected variables. For
each of the variables on this watch variable list, Script Designer displays its context, name, and value.
The values of the variables on the watch list are updated each time you enter break mode.
Here’s how to add a variable to Script Designer’s watch variable list.
To add a watch variable:
1. Click the Add Watch tool on the toolbar.
-OrPress Shift+F9.
Script Designer displays the Add Watch dialog box.
Advanced BasicScript Programming for Your Specific Needs
10-15
Figure 10-7: Add a watch variable
2. In the Variable box, type or select the name of the variable you want to add to the watch variable list.
If you are executing the script, you can click the arrow in the Variable box to display the names of all
variables that are “in scope,” or defined within the current function or subroutine. You can then select
the variable you want from the open list.
3. In the Procedure box, type or select the name of the procedure containing the variable you want to
watch. If the variable you want to watch is a private or public variable, then type or select “(All
Procedures)”.
4. In the Script box, type or select the name of the script containing the variable you want to watch. If
the variable you want to watch is a public variable, then type or select “(All Scripts)”.
5. Click OK to add the variable to the watch variable list.
Script Designer displays the context, name, and value of the variable in a three-column list in the watch
pane. If you have previously added other watch variables, Script Designer will display these as well.
Types of Variables You Can Watch
Script Designer permits you to monitor only variables of fundamental data types, such as Integer, Long,
Variant, and so on; you cannot watch complex variables, such as structures or arrays, or expressions
using arithmetic operators. You can, however, watch individual elements of arrays or structure members
using the following syntax:
[variable [(index,...)] [.member [(index,...)]]...]
where variable is the name of the structure or array variable, index is a literal number, and member is the
name of a structure member.
For example, the following are valid watch expressions:
10-16
•
a(1): Element 1 of array a
•
person.age: Member age of structure person
•
company(10,23).person.age: Member age of structure person that is at element 10,23 within the array
of structures called company
Modifying or Deleting a Watch Variable
In order to modify the value of a variable or remove the variable from the watch pane, you must first
select the desired variable. Here’s how to select a variable on the list.
To select a watch variable:
•
Place the mouse pointer on the variable you want to select and click the left mouse button.
-OrIf one of the variables on the watch list is already selected, use the arrow keys to move the selection
highlight to the desired variable.
-OrIf the insertion point is in the edit pane, press F6 to highlight the most recently selected variable on the
watch list and then use the arrow keys to move the selection highlight to the desired variable.
Note:
Pressing F6 again returns the insertion point to its previous position in the edit
pane.
When the debugger has control, you can modify the value of any of the variables on Script Designer’s
watch variable list. Here’s how to change the value of a selected watch variable.
To modify the value of a variable on the watch variable list:
1. Place the mouse pointer on the name of the variable whose value you want to modify and doubleclick the left mouse button.
-OrSelect the name of the variable whose value you want to modify and press Enter or F2.
Script Designer displays the Modify Variable dialog box.
Note:
The name of the variable you selected on the watch variable list appears in the
Name field. If you want to change another variable, you can enter a different
variable in the Name field. You can also select a different variable from the Variables
list box, which shows variables defined within the current function or subroutine.
When you use the Modify Variable dialog box to change the value of a variable, you
don’t have to specify the context. Script Designer first searches locally for the
definition of that variable, then privately, then publicly.
2. Enter the new value for your variable in the Value field.
3. Click the OK button.
The new value of your variable appears on the watch variable list.
When changing the value of a variable, Script Designer may convert the value you entered to match the
type of the variable. For example, if you change the value of an Integer variable to 1.7, Script Designer
converts this value from a floating-point number to an Integer, assigning the value 2 to the variable.
When modifying a Variant variable, Script Designer needs to determine both the type and value of the
data. Script Designer uses the following logic in performing this assignment (in this order):
The following applies to the following values:
•
Null: The Variant variable is assigned Null (VarType 1).
•
Empty: The Variant variable is assigned Empty (VarType 0).
Advanced BasicScript Programming for Your Specific Needs
10-17
•
True: The Variant variable is assigned True (VarType 11).
•
False: The Variant variable is assigned False (VarType 11).
•
number: The Variant variable is assigned the value of number. The type of the variant is the smallest
data type that fully represents that number. You can force the data type of the variable by using a
type-declaration letter following number, such as %, #, &, !, or @.
•
date: The Variant variable is assigned the value of the new date (VarType 7).
•
Anything else: The Variant variable is assigned a String (VarType 8).
Script Designer will not assign a new value if it cannot be converted to the same type as the specified
variable.
Here’s how to delete a selected variable from Script Designer’s watch variable list.
To delete a watch variable:
1. Select the variable on the watch list.
2. Press Del.
The selected variable is removed from the watch list.
Exiting from Script Designer
Here’s how to get out of Script Designer. What happens when you exit depends on (1) whether you have
made changes to your script and (2) whether your script contains errors.
To exit from Script Designer:
•
Choose the Exit and Return command from the File menu.
If you have made changes to your script, Script Designer displays a dialog box asking whether you want
to save the script. If you either click the No button or click the Yes button and your script contains no
errors, you exit from Script Designer immediately. If you click the Yes button and your script contains
errors, Script Designer highlights the line containing the first error and displays a dialog box asking
whether you want to exit anyway. If you click the Yes button, Script Designer saves your script, errors
and all, and then you exit from Script Designer.
If you haven’t made any changes to your script, you exit from Script Designer immediately, regardless of
whether the script contains errors from a previous editing session.
Programming with GeniDAQ
This powerful Visual Basic for Application (VBA) as a scripting engine is licensed from Summit
Software Inc. BasicScript is the most important component providing programmability in GeniDAQ.
The script engine is a set of DLLs that facilitate the compilation of script programs at build-time and
execution of scripts at runtime. It not only provides the capability to manipulate tasks, but also provides
the interface to interact with DOS, Windows, and other applications through DDE, OLE, ODBC (SQL).
The syntax of BasicScript is very similar to Microsoft VBA (visual basic for application in Excel, Word,
Access, etc.) and MS Visual Basic. Both BasicScript and VBA have functions that are not included in
the other, but over 95% of the functions and procedures are identical. It is possible to take a Visual Basic
source code, then compile and execute it under BasicScript. This can be done without changing a word
if only common functions are used. A dialog box editor is included so that program designers can create
their own dialog box to interact with the operators. The scripting feature is what makes GeniDAQ
suitable for real-life situations where customization is necessary to make the program work smoothly
10-18
with the existing operating procedures in the factory and assembly line.
The script designer is basically a text editor with some convenient features for editing script code. The
same editor is used for editing the main script and scripts inside a task. The main script, if present, takes
control during the entire runtime once it is started. The main script can be used to do things such as
starting a task, stopping a task, etc. Each scan task has a pre-task script and a post-task script. These two
scripts are used to initialize or reset tag values on some conditions. The main script is executed only
once for the entire strategy while the pre-task and post-task scripts are executed once every scan. The
script will be compiled into p-code after editing so it won’t need to be compiled again.
Main Script
Figure 10-8: Main Script Program
The main script, if present, takes control of the entire runtime once it is started. The main script can be
used to do things such as starting a task, stopping a task, etc.
Advanced BasicScript Programming for Your Specific Needs
10-19
Pre-Task and Post-Task script
Figure 10-9: Pre-task Script Editor
Figure 10-10: Post-task Script Editor
Each scan task has a pre-task script and a post-task script. User can use these two scripts to initialize or
reset tag value on some conditions.
10-20
BasicScript
Figure 10-11: BasicScript Block Editor
BasicScript is a task block in Task Designer Toolbox. It is designed to provide total flexibility so you
can employ Visual Basic functions to do comparisons, calculations, etc. BasicScript supports multiple
inputs from all types of blocks. Its output can be routed to any number of blocks. For detailed information, please refer to chapter 5.3.27 BasicScript block.
Note:
“DIM” may be used to declare one variable per line. If you declare two or more
variables in one line, the execution result will be unpredictable.
BasicScript GeniDAQ Commands
Overview
In order to manipulate tasks and runtime I/O data in the BasicScript engine, GeniDAQ adds many
functions into BasicScript and can be programmed using standard Visual Basic functions. The Added
GeniDAQ functions are categorized in the following sets:
System
This set of function calls is used to control system operations. You can use these function calls in the
Pre-Task, Post-Task script and BasicScript block.
•
SystemStop: Stops the execution of GeniDAQ
•
SystemExit: Stops the execution of GeniDAQ and exits the GeniDAQ program
•
GetNodeState: Retrieves the communication status with a remote node
•
OverRunTimerSwh: Enables or disables the timer overrun message for a task that issues the command.
•
UpdateHoldFile: Records current values and restore them at next system start.
Advanced BasicScript Programming for Your Specific Needs
10-21
Scan Task
This set of function calls is used to manipulate scan tasks in GeniDAQ. You can use these function calls
in the Main Script program or in the Pre-Task and Post-Task script programs.
•
ScanTask: Define a ScanTask object
•
GetScanTask: Return the ScanTask object specified
•
Start: Start to run the ScanTask
•
Stop: Stop the ScanTask
•
SingleScan: Do a one time scan of the ScanTask
•
GetStatus: Return the status of specified ScanTask
Tag
This set of function calls is used to access task blocks in the GeniDAQ data center. You can use these
function calls in the Main Script program, Pre-Task and Post-Task script programs and/or BasicScript
blocks.
•
Tag: Define a Tag Object
•
GetTag: Return the Tag object specified
•
Value: Property of the tag, return current value of tag
•
Array: Property of the tag, return current value of tag’s channel data.
•
Lock: Locks the value of the tag to prevent the written by another code.
•
SetLockedValue: Sets the value of the locked tag
•
Unlock: Unlock a locked tag.
Display
This set of function calls is used to manipulate multiple displays in GeniDAQ. You can use these
function calls in the Main Script program or in the Pre-Task and Post-Task script programs.
•
Display: Switch to the display specified
BasicScript Block
This set of function calls is used to manipulate the output of BasicScript blocks in GeniDAQ. These
function calls are used in BasicScript blocks only.
10-22
•
Outputi: Output integer to another block
•
Outputl: Output long integer to another block
•
Outputf: Output single float to another block
•
Outputs: Output string to another block
System
SystemStop (method)
Syntax
SystemStop
Description
Stops the execution of GeniDAQ
Example
Sub SCR1()
dim MyTag as Tag
set MyTag = GetTag(“DISP1”,”BBTN1")
if MyTag.Value = 1 then
SystemStop
end if
End Sub
See Also
SystemExit
SystemExit (method)
Syntax
SystemExit
Description
Stops the execution of GeniDAQ and exits the GeniDAQ program
Example
Sub SCR1()
dim Mytag as Tag
set Mytag = GetTag(“DISP1”,”BBTN1")
if MyTag.Value = 1 then
SystemExit
end if
End Sub
See Also
SystemStop
Advanced BasicScript Programming for Your Specific Needs
10-23
GetNodeState (method)
Syntax
GetNodeState
Description
Retrieves the communication status with a remote node
Example
Sub SCR1()
Dim Conn as Integer
Conn = GetNodeState(“Node1”)
if Conn = 0 then
Outputs “Disconnect with Node1”
else
Outputs “Connect with Node1”
end if
End Sub
OverRunTimerSwh (method)
Syntax
OverRunTimerSwh
Description
Enables or disables the timer overrun message for a task that issues the command.
Comments
You can use the command at input values in a dialog box.
Example
Sub SCR1()
dim MyTag as Tag
set MyTag = GetTag(“DISP1”,”BBTN1")
if MyTag.Value = 1 then
OverRunTimerSwh 1 ‘ enable the timer overrun message
else
OverRunTimerSwh 0 ‘ disable the timer overrun message
10-24
end if
End Sub
UpdateHoldFile (method)
Syntax
UpdateHoldFile
Description
Records current values and restore them at next system start.
Comments
This command is only effective for the blocks that enable the save and restore function, including knob,
numeric control, slider, button, conditional button, digital output, analog output, and log file block.
Example
Sub SCR1()
dim MyTag as Tag
set MyTag = GetTag(“DISP1”,”BBTN1")
if MyTag.Value = 1 then
UpdateHoldFile
end if
End Sub
ScanTask
ScanTask (object type)
Syntax
ScanTask
Description
An object type used to declare a variable which accepts object returned from GetScanTask() function.
Comments
When declaring more than one variable on the same line, the syntax is:
Advanced BasicScript Programming for Your Specific Needs
10-25
dim MyTask1 as ScanTask, MyTask2 as ScanTask.
Example
‘This example start the task MyTask
Sub Main()
dim MyTask as ScanTask
set MyTask = GetScanTask(“TASK1”)
MyTask.Start
End Sub
See Also
GetScanTask(Function), GetStatus(method), Start(method), Stop(method), SingleScan(method)
ScanTaskObject.GetStatus (method)
Syntax
MyTask.GetStatus
Description
A method of the ScanTask object used to get the status of specified task.
Return
An integer value will be returned to represent the current status of specified task.
•
0 means the specified task is idle, that is task is not started or is stopped.
•
2 means the specified task is waiting for delayed time or system time set in task properties.
•
3 means the specified task is running for GeniDAQ scan.
Comments
Applies to ScanTask object. It is suggested that this method be used before start or stop task.
10-26
Example
‘This example scan the task MyTask for 100 times
Sub Main()
dim i as integer
dim Mystatus as integer
dim MyTask as ScanTask
set MyTask = GetScanTask(“TASK1”)
MyStatus = MyTask.GetStatus
if (MyStatus == 0)
then
MyTask.Start
MyTask.Stop
end if
End Sub
See Also
GetScanTask(Function), GetStatus(method), Initialize(method), Start(method), Stop(method)
ScanTaskObject.SingleScan (method)
Syntax
MyTask.SingleScan
Description
A method the ScanTask object uses to do a single scan of a task.
Comments
Applies to ScanTask object. The ScanTask is scanned immediately regardless of the scan period
specified in the ScanTask Setup dialog box. This call does not return until the scan is completed.
Advanced BasicScript Programming for Your Specific Needs
10-27
Example
‘This example scan the task MyTask for 100 times
Sub Main()
dim i as integer
dim MyTask as ScanTask
set MyTask = GetScanTask(“TASK1”)
for i = 1 to 100
MyTask.SingleScan
next i
End Sub
See Also
GetScanTask(Function), GetStatus(method), Start(method), Stop(method)
ScanTaskObject.Start (method)
Syntax
MyTask.Start
Description
A method of the ScanTask object used to start a task.
Comments
Applies to ScanTask object. The ScanTask is started regardless of the starting method specified in the
ScanTask Setup dialog box. This call returns immediately without waiting for the task to complete.
Example
‘This example start the task MyTask
Sub Main()
dim MyTask as ScanTask
set MyTask = GetScanTask(“TASK1”)
MyTask.Start
End Sub
See Also
GetScanTask(Function), GetStatus(method), Stop(method), SingleScan(method)
ScanTaskObject.Stop (method)
Syntax
MyTask.Stop
10-28
Description
A method of the ScanTask object used to stop a task.
Comments
Applies to ScanTask object.
Example
‘This example stop the task MyTask
‘Assume MyTask is running already
Sub Main()
dim MyTask as ScanTask
dim FileLength as Integer
set MyTask = GetScanTask(“TASK1”)
Open “test.dat” For Input As #1
FileLength = Lof(1)
If (FileLength > 32000) Then
MyTask.Stop
End If
End Sub
See Also
GetScanTask(Function), GetStatus(method), Start(method), SingleScan(method)
GetScanTask (function)
Syntax
Set ScanTaskObj = GetScanTask(taskname)
Description
Returns an object of type ScanTask if successful. Returns Null if the taskname specified can not be
found or not valid.
Comments
ScanTaskObj is a variable declared as type ScanTask. taskname is a string expression specifying the
task. The taskname should be in capital letters, for example, “TASK1”.
Advanced BasicScript Programming for Your Specific Needs
10-29
Example
‘This example start the task MyTask
Sub Main()
dim MyTask as ScanTask
set MyTask = GetScanTask(“TASK1”)
MyTask,Initialize
MyTask.Start
End Sub
See Also
ScanTask(object type), Start(method), Stop(method), SingleScan(method),GetStatus(method),
Tag
Tag (object type)
Syntax
Tag
Description
An object type used to declare a variable which accepts objects returned from GetTag() function.
Comments
When declaring more than one variable on the same line, the syntax is:
dim MyTag1 as Tag, MyTag2 as Tag.
Example
‘This example obtain a value from a block
Sub Main()
dim MyTag as Tag
dim voltage as single
set MyTag = GetTag(“TASK2”, “AI1”)
voltage =MyTag.Value
End Sub
See Also
GetTag (function); tagObj.Value (property).
10-30
tagObj.Value (Property)
Syntax
tagObj.Value
Description
Value is a property of Tag object. It is used to reference the value of a input tag.
Example
‘This example obtain a value from a block
Sub Main()
dim MyTag as Tag
dim voltage as single
set MyTag = GetTag(“TASK2”, “AI1”)
voltage =MyTag.Value
End Sub
See Also
GetTag (function); Tag (object type); Array(channel number).
tagObj.Array (Channel number)
Syntax
tagObj.array(channel number)
where Channel number: integer, from 0 to 15
Description
Array is a property of Tag object. It is used to reference the values of tag’s multiple channels.
Example
‘This example obtain a value from the first channel of AI block
Sub Main()
dim MyTag as Tag
dim voltage as single
set MyTag = GetTag(“TASK2”, “AI1”)
voltage =MyTag.Array(0)
End Sub
See Also
GetTag (function); Tag (object type); Value(Property).
Advanced BasicScript Programming for Your Specific Needs
10-31
GetTag (function)
Syntax
Set tagObj = GetTag(tableName$, tagName$)
Description
Returns an object of type Tag.
Comments
The GetTag function takes the following parameters:
•
tableName$: String expression containing the name of the task or display or virtual.
•
tagName$: String expression containing the name of the tag (block). Should be capitals.
Example
Sub Main()
dim MyTag as Tag
dim voltage as single
set MyTag = GetTag(“TASK2”, “AI1”)
voltage = MyTag.Value
End Sub
See Also
Tag (object type); tagObj.Value (property)
tagObj.Lock (method)
Syntax
tagObj.Lock
Description
Locks the value of the tag to prevent the written by another code.
Comments
If you write a tag value in multiple tasks, such as virtual tags, you must lock it before write the value.
Then GeniDAQ will lock the value of the tag to prevent the written by another code in other tasks
simultaneously. After you complete the change, you must unlock it. Note if you just read the value, you
don’t have to lock it. Be careful to use the method.
10-32
Example
Public VR1Cnt As Long
Public key As Long
Sub SCR1()
dim MyTag as Tag
set MyTag = GetTag(“VIRTASK”,”VR1")
key = MyTag.Lock
if key <> 0 then
VR1Cnt = MyTag.Value + 2
MyTag.SetLockedValue key, VR1Cnt
MyTag.Unlock key
key = 0
end if
End Sub
See Also
SetLockedValue, Unlock
tagObj.SetLockedValue (method)
Syntax
tagObj.SetLockedValue
Description
Sets the value of the locked tag.
Comments
If you write a tag value in multiple tasks, such as virtual tags, you must lock it before write the value.
Then GeniDAQ will lock the value of the tag to prevent the written by another code in other tasks
simultaneously. After you complete the change, you must unlock it. Note if you just read the value, you
don’t have to lock it. Be careful to use the method.
Advanced BasicScript Programming for Your Specific Needs
10-33
Example
Public VR1Cnt As Long
Public key As Long
Sub SCR1()
dim MyTag as Tag
set MyTag = GetTag(“VIRTASK”,”VR1")
key = MyTag.Lock
if key <> 0 then
VR1Cnt = MyTag.Value + 2
MyTag.SetLockedValue key, VR1Cnt
MyTag.Unlock key
key = 0
end if
End Sub
See Also
Lock, Unlock
tagObj.Unlock (method)
Syntax
tagObj.Unlock
Description
Unlock a locked tag.
Comments
Be sure to unlock the value that you don’t use.
10-34
Example
Public VR1Cnt As Long
Public key As Long
Sub SCR1()
dim MyTag as Tag
set MyTag = GetTag(“VIRTASK”,”VR1")
key = MyTag.Lock
if key <> 0 then
VR1Cnt = MyTag.Value + 2
MyTag.SetLockedValue key, VR1Cnt
MyTag.Unlock key
key = 0
end if
End Sub
See Also
Lock, SetLockedValue
Display
Display (statement)
Syntax
Display dvalue
Description
Used in the Main Script program or Pre-Task and Post-Task script to control the display order of
multiple displays in a system.
Comments
dvalue is the number of display windows. For example, use Display(1) to show display1 window on
screen.
•
Dvalue: An integer specifying the number of display windows to show on screen.
Advanced BasicScript Programming for Your Specific Needs
10-35
Example
Sub Main()
dim i as integer
dim Mystatus as integer
dim MyTask as ScanTask
set MyTask = GetScanTask(“TASK1”)
MyStatus = MyTask.GetStatus
if (MyStatus == 3)
then Display(1) “ to show Display1
end if
End Sub
BasicScript Block
Outputf (statement)
Syntax
Outputf fvalue
Outputf channel , fvalue
Description
Used in the Basic Script Block to output a single float value to another block.
Comments
If the channel argument is not given, channel 0 is assumed. The Outputf statement takes the following
parameters:
•
Channel: Integer containing the output channel. Valid channel numbers are from 0 to 7.
•
Fvalue: A single float specifying the value to be output.
Example
‘This example outputs a number to channel 0
dim voltage as single
If Voltage > 0.0 Then
Outputf
voltage
else
Outputf
End If
10-36
- Voltage
See Also
Outputi (statement); Outputl (statement); Outputs (statement).
Outputi (statement)
Syntax
Outputi ivalue
Outputi channel , ivalue
Description
Used in the Basic Script Block to output an integer value to another block.
Comments
If the channel argument is not given, channel 0 is assumed. The Outputi statement takes the following
parameters:
•
Channel: Integer containing the output channel. Valid channel numbers are from 0 to 7.
•
Ivalue: Integer specifying the value to be output.
Example
‘This example output a number to channel 0
dim count as integer
If count > 0 Then
Outputi count
Else
Outputi
-1
End If
See Also
Outputl (statement); Outputf (statement); Outputs (statement).
Outputl (statement)
Syntax
Outputl longvalue
Outputl channel , longvalue
Description
Used in the Basic Script Block to output a long integer value to another block.
Advanced BasicScript Programming for Your Specific Needs
10-37
Comments
If the channel argument is not given, channel 0 is assumed. The Outputl statement takes the following
parameters:
•
Channel: Integer containing the output channel. Valid channel numbers are from 0 to 7.
•
Longvalue: long Integer specifying the value to be output.
Example
‘This example output a number to two channels
dim count as long
If count >= 0 Then
Outputl 0, count
Outputl 1, count
End If
See Also
Outputi (statement); Outputf (statement); Outputs (statement).
Outputs (statement)
Syntax
Outputs svalue$
Where Outputs channel , svalue$
Description
Used in the Basic Script Block to output a string to another block.
Comments
If the channel argument is not given, channel 0 is assumed. The Outputs statement takes the following
parameters:
•
Channel: Integer containing the output channel. Valid channel numbers are from 0 to 7.
•
svalue$: string expression specifying the value to be output.
Example
‘This example output a string
dim S1 as string
dim S2 as string
S1 = “Hello,”
S2 = “World!”
Outputs 3, S1 & S2
See Also
Outputi (statement); Outputl (statement); Outputf (statement).
10-38
Notice
1. In the debug environment for the Main Script, Pre/post-task Script or Basic Script block, the
following commands are disabled:
•
ScanTask.start
•
ScanTask.stop
•
ScanTask.SingleScan
•
ScanTask.GetStatus
•
OutputI
•
OutputL
•
OutputF
•
OutputS
•
Display
•
SystemStop
•
SystemExit
However, all commands will function at runtime.
2. When using the Msg command to create modeless dialogs or the Sleep command for waiting, do not
stop GeniDAQ when the modeless dialog is still active or the Sleep command is still working.
3. Be careful when programming the script to avoid an infinite loop.
4. For ScanTask command:
•
To start/stop a task by Script, the task’s starting method must be Inactive in Task Property
•
In Basic Script block or Pre/Post-task Script, it cannot start or stop the task by itself.
•
The possible task names passed into GetScanTask (“task name”) command refer to Chapter
11, Sharing Real Time Data with Data Center.
5. For Tag command,
•
To retrieve/set values of tags in the Data Center via Basic Script. Make sure that the data is
correct Refer to the Data Center for data types of tags. The user can also use Variant type in the
Script to retrieve or set values of tags.
•
If the channel count of the specified tag is greater than 1, the user needs to use the Tag.Array[n]
command to retrieve/set a value for channel n. Make sure n does not exceed the maximum
number of channels. If using the Tag.Value command to retrieve/set a value, it will be the channel
0.
6. For Output command
•
Don’t use these commands in main script or pre/post-task script. It is only for a Basic Script
block.
•
Select the correct command to output the value. For example, if you need to output a string,
select OutputS command and pass a string type parameter.
7. We strongly recommend you to define an error trap routine (OnError) to handle runtime errors.
Otherwise, it may damage BasicScript engine. Please refer to the on-line help for OnError Statement.
Advanced BasicScript Programming for Your Specific Needs
10-39
Limitations
1. Strings are limited in length to 32764 characters.
2. The data area that holds public variables is limited to 16 KB.
3. The size of source code script is limited to 65534 characters.
4. Arrays can have up to 60 dimensions.
5. Variable names are limited to 80 characters.
6. Labels are limited to 80 characters.
7. The number of open DDE channels is not fixed; rather, it is limited only by available memory and
system resources.
8. The number of open files is limited to 512 or the operating system limit.
9. The size of an array cannot exceed 32 KB.
Summary
GeniDAQ’s BasicScript provides a powerful programming tool. You can use it for calculation, linking
other Windows applications, accessing Database, control task/display, performing logic operations, and
processing real time values.
10-40
11
Sharing Real Time
Data with Data
Center
Overview
Data Center provides an open environment for user to access real-time data in GeniDAQ. It supports
the following interfaces for customer application to exchange data with GeniDAQ.
•
DDE interface
•
OLE automation interface
VB,Delphi,VC,
Excel Application
DDE
Interface
GeniDAQ
Builder/Runtime
OLE Automation
Interface
Data Store
Figure 11-1: Data Center Programming Interface
Users can choose their favorite language under their demand.
This module is the central location for all the data in GeniDAQ. All the results of the blocks or the user
data entered on the screen are passed to this centralized module. It is stored in memory for fast update
and retrieval. The tag name is used as a key to find the data item in the data center. A hash table or Btree structure can be used to speed up the update and retrieval. Each data item in the data application,
like drivers and GeniDAQ, would use the tag name to get a block ID from the data center. The block ID
is another key to find the data item in the data center.
Note:
GeniDAQ CE does not support the DDE and OLE Automation programming
interface for Data Center.
Contents
11-2
•
Data Store
•
DDE (Dynamic Data Exchange) Interface
•
OLE (Object Linking and Embedded) Automation Interface
•
Summary
Data Store
Data Store keeps the storage of Tag’s data. It supports three data types: LONG (32 bites), FLOAT (4
bytes) and STRING (128 bytes maximum).
Data Structure
The structure of data center is below:
Tag
TASK
Tag
Tag
DISP
Tag
Tag
VIRTASK
Tag
Figure 11-2: Data Center Data Structure
It consists of two levels. One is task level. There are three types in this level. TASK can be any task in
Task Designer. DISP can be any display in Display Designer. VIRTASK contains all virtual tags. The
other one is tag level. It contains all tags that belong to its parent task.
Available Tags
Not all GeniDAQ’s tags will be created in data center, for example Basic Script block. The following
table lists all available tags created in data center.
Sharing Real Time Data with Data Center
11-3
The Tags Created By GeniDAQ
Block
Analog Input
Analog Output
Digital Input
Digital Output
Temperature
Hardware Counter
Hardware Alarm
RS-232
Input File
Alarm Log
Ramp
Moving Average
Single Calculation
Timer
Time Stamp
Counter
On/Off Control
PID Control
DDE Client
Conditional Sound
Beep
Button Control
Knob Control
Numeric Control
Slider Control
Ameter Display
Bar Display
Indicator Display
Drawing Display
Conditional Button
Conditional Bitmap
Conditional Text
Historical Trend
Virtual Tags
Tag Name
TASK1/AI1
TASK1/AO1
TASK1/DI1
TASK1/DO1
TASK1/TMP1
TASK1/CTFQ1
TASK1/ALM1
TASK1/SER1
TASK1/INF1
TASK1/ALOG1
TASK1/RMP1
TASK1/AVG1
TASK1/SOC1
TASK1/ET1
TASK1/TS1
TASK1/CNT1
TASK1/ONF1
TASK1/PID1
TASK1/DDEC1
TASK1/SOUND1
TASK1/SP1
DISP1/BBTN1
DISP1/KNOB1
DISP1/NCTL1
DISP1/SPIN1
DISP1/METER1
DISP1/BAR1
DISP1/INDI1
DISP1/CELL1
DISP1/CBTN11
DISP1/BMP1
DISP1/CTXT
DISP1/HIST1
VIRTASK/V1
Data Type
Floating point
Floating point
Integer
Long
Floating point
Floating point
Long
String
Floating point
Long
Floating point
Floating point
Floating point
Long
String
Long
Integer
Floating point
String
Long
Long
Long
Floating point
Floating point
Floating point
Floating point
Floating point
Long
Long
Long
Long
String
Floating point
Floating point
Channel Count
32
1
1
1
1
1
1
8
1
1
1
1
1
1
1
1
1
1
1
1
1
1
1
1
1
1
1
1
1
1
1
1
8
1
Figure 11-3: The Tags Created By GeniDAQ
11-4
Note:
(a) TASK1 can change to TASK2 to TASK8 that depends on the tag in which TASK.
The tag name consists of the block type and ordinal number; for example, AI block
with ordinal number 3, then the tag name is AI3.
(b) DISP is the title of the display that is assigned in Display Property Menu.
(c) VIRTASK stores the VIRTAG tags that are added by the Add/Delete Virtual Tags
menu.
(d) The maximum string length for string type tags is 128.
DDE Interface
Dynamic Data Exchange (DDE) is one of several mechanisms of interprocess communication (IPC)
supported under Windows. Another one is OLE that will be discussed soon. DDE is the most popular
and easiest interface for user. Just assign three character strings, application, topic, and item, then two
applications can communicate with each other. Most applications support DDE interface, for examples,
Microsoft Office, Microsoft Visual Basic, and Inprise Delphi. Besides, most hardware and software
vendors of industrial automation also provide DDE drivers or support DDE interface.
GeniDAQ supports DDE with DDE Client Block and DDE Server Block. DDE Client Block requests
data from another application. DDE Server Block sends data to another application. Please refer to
Chapter 3, Configuring Your System Function with Task Designer.
OLE Automation
Three Objects for OLE Automation Interface
Compared to DDE, OLE is more powerful and flexible interprocess communication standard defined
by Microsoft. OLE Automation (another term is ActiveX Automation) allows applications to expose
objects to other applications. OLE Automation makes it possible for objects to not only exchange data
with, and execute commands in other objects. These objects (automation object or automation server)
consist of methods (another term for function calls) and properties (that is, data elements that can be
read from or written to or that can be read-only or write-only). Through the OLE-defined standards for
automation, users can call them from any OLE Automation client, such as a program written in Microsoft VC, Visual Basic, a Microsoft Excel macro, or Inprise Delphi.
GeniDAQ’s Data Center features an Automation Server that can be called from any OLE Automation
client. It exposes three automation objects:
•
GeniDAQ32.OleDB: It is the primary object for accessing the Tag’s data. You can use the following
codes in Visual Basic to create the object.
Dim DBCenter as Object
Set DBCenter = CreateObject (“GeniDAQ32.OleDB)
•
GeniDAQ32.TaskList: It is the object for browsing tasks.
Dim TaskList as Object
Set TaskList = CreateObject (“GeniDAQ32.TaskList”)
•
GeniDAQ32.TagList: It is the object for browsing tags in the specified task.
Sharing Real Time Data with Data Center
11-5
Dim TagList as Object
Set TagList = CreateObject (“GeniDAQ32.TagList”)
After these objects are created, then users can access their methods and properties.
Object Description
GeniDAQ32.OleDB Object
The supported methods of GeniDAQ32.OleDB object are listed below:
•
GetTagDataLong: Return 32-bit integer value of specified tag
Syntax
long GetTagDataLong(BSTR szTaskName, BSTR szTagName, short Index);
Note:
Index represents the channel number for the tag that you wish.
Note:
Make sure the data type of the tag that you access, then choose the corresponding
method to access the tag.
• GetTagDataFloat
Return 4-byte float value of specified tag.
Syntax
float GetTagDataFloat(BSTR szTaskName, BSTR szTagName, short Index);
• GetTagDataSTR
Return character string of specified tag.
Syntax
BSTR GetTagDataSTR(BSTR szTaskName, BSTR szTagName, short Index);
• SetTagDataLong
Set 32-bit integer value of specified tag in data center.
Syntax
boolean SetTagDataLong(BSTR szTaskName, BSTR szTagName, short Index,
long Data);
• SetTagDataFloat
Set 4-byte float value of specified tag in data center.
11-6
Syntax
boolean SetTagDataFloat(BSTR szTaskName, BSTR szTagName, short Index,
float Data);
• SetTagDataSTR
Set character string of specified tag in data center.
Syntax
boolean SetTagDataSTR(BSTR szTaskName, BSTR szTagName, short Index,
BSTR Data);
GeniDAQ32.TaskList and GeniDAQ32.TagList Object
The supported methods of GeniDAQ32.TaskList object and GeniDAQ32.TagList object are listed
below:
•
void GoTop(): Go to the top of task list.
•
void GoBottom(): Check whether it is at the end of task list.
•
BSTR Get(): Go to the bottom of task list.
•
void GoNext(): Go to next tag in task list.
•
boolean EndofList(): Return current task in task list.
Sharing Real Time Data with Data Center
11-7
OLE Automation Interface Example
The following example demonstrates how to browse the available tasks and tags created in a GeniDAQ
project through OLE Automation interface. This example is created in Microsoft Visual Basic 5.0. You
can also use Inprise Delphi to create a similar application. Please refer to the related documentation for
your programming language.
1. Launch Microsoft Visual Basic 5.0 and new a Standard EXE type project.
Figure 11-4: Create a New VB Project
2. Name your project as GoleDB.
Figure 11-5: Name Your Project GoleDB
3. Design your form as follows:
11-8
Figure 11-6: Design Your Form
There are three Edit controls named Text1, Text2 and Text3. There are two List controls named: List1
and List2.
4. Create the codes for these controls as follows:
Dim DBCenter As Object
Dim TagList As Object
Dim TaskList As Object
Private Sub Form_Load()
Set DBCenter = CreateObject(“GeniDAQ32.OleDB”)
Set TagList = CreateObject(“GeniDAQ32.TagList”)
Set TaskList = CreateObject(“GeniDAQ32.TaskList”)
TagList.SelectTask (“ALL”)
While Not TaskList.EndofList()
List1.AddItem TaskList.Get()
TaskList.GoNext
Wend
End Sub
Sharing Real Time Data with Data Center
11-9
Private Sub List1_Click()
Text1.Text = List1.List(List1.ListIndex)
bOK = TagList.SelectTask(Text1.Text)
List2.Clear
While Not TagList.EndofList()
List2.AddItem TagList.GetTagName()
TagList.GoNext
Wend
End Sub
Private Sub List1_KeyDown(KeyCode As Integer, Shift As Integer)
Text1.Text = List1.List(List1.ListIndex)
TagList.SelectTask (Text1.Text)
List2.Clear
While Not TagList.EndofList()
List2.AddItem TagList.GetTagName()
TagList.GoNext
Wend
End Sub
Private Sub List2_Click()
Text2.Text = List2.List(List2.ListIndex)
fBuf = DBCenter.GetTagDataFloat(Text1.Text, Text2.Text, 0)
Text3.Text = Str(fBuf)
End Sub
Private Sub List2_KeyDown(KeyCode As Integer, Shift As Integer)
Text2.Text = List2.List(List2.ListIndex)
fBuf = DBCenter.GetTagDataFloat(Text1.Text, Text2.Text, 0)
Text3.Text = Str(fBuf)
End Sub
5. Launch GeniDAQ builder and run a project, for example demo.gni. Then execute the VB program.
Select Task 1 in the Task list field, it retrieves and shows all available tags under the Task 1 in the
Tag list. Then click AI1 tag, it shows its value in Tag value field.
11-10
Figure 11-7: Running the Example Program
Please refer to \strategy\GoleDB example in the GeniDAQ installation directory for the details.
Type Library Source for OLE Automation Interface
// GniDAQ.odl : type library source for GeniDAQ.exe
// This file will be processed by the MIDL compiler to produce the
// type library (GniDAQ.tlb).
[ uuid(3C5CB3E8-ED68-11D2-BB33-0080C89003B8), version(1.0) ]
library GniDAQ
{
importlib(“stdole32.tlb”);
importlib(“stdole2.tlb”);
//
Primary dispatch interface for CGniDAQDoc
[ uuid(3C5CB3E9-ED68-11D2-BB33-0080C89003B8) ]
dispinterface IGniDAQ
{
properties:
// NOTE - ClassWizard will maintain property information here.
//
Use extreme caution when editing this section.
//{{AFX_ODL_PROP(CGniDAQDoc)
//}}AFX_ODL_PROP
methods:
// NOTE - ClassWizard will maintain method information here.
//
Use extreme caution when editing this section.
//{{AFX_ODL_METHOD(CGniDAQDoc)
Sharing Real Time Data with Data Center
11-11
//}}AFX_ODL_METHOD
};
//
Class information for CGniDAQDoc
[ uuid(3C5CB3E7-ED68-11D2-BB33-0080C89003B8) ]
coclass Document
{
[default] dispinterface IGniDAQ;
};
//
Primary dispatch interface for COleDB
[ uuid(0DBBEB27-2DFE-11D3-900C-002018650916) ]
dispinterface IOleDB
{
properties:
// NOTE - ClassWizard will maintain property information here.
//
Use extreme caution when editing this section.
//{{AFX_ODL_PROP(COleDB)
//}}AFX_ODL_PROP
methods:
// NOTE - ClassWizard will maintain method information here.
//
Use extreme caution when editing this section.
//{{AFX_ODL_METHOD(COleDB)
[id(1)] long GetTagDataLong(BSTR szTaskName, BSTR szTagName, short Index);
[id(2)] float GetTagDataFloat(BSTR szTaskName, BSTR szTagName, short Index);
[id(3)] BSTR GetTagDataSTR(BSTR szTaskName, BSTR szTagName, short Index);
[id(4)] boolean SetTagDataLong(BSTR szTaskName, BSTR szTagName, short Index, long Data);
[id(5)] boolean SetTagDataFloat(BSTR szTaskName, BSTR szTagName, short Index, float Data);
[id(6)] boolean SetTagDataSTR(BSTR szTaskName, BSTR szTagName, short Index, BSTR Data);
[id(7)] long AddTag(BSTR szTaskName, BSTR szTagName, short wType);
[id(8)] long AddTask(BSTR szTaskName);
[id(9)] void DeleteTask(BSTR szTaskName);
[id(10)] void DeleteTag(BSTR szTaskName, BSTR szTagName);
[id(11)] long ChangeTaskName(BSTR szOldTask, BSTR szNewTask);
[id(12)] long ChangeTagName(BSTR szTaskName, BSTR szOldTag, BSTR szNewTag);
//}}AFX_ODL_METHOD
};
//
Class information for COleDB
[ uuid(0DBBEB28-2DFE-11D3-900C-002018650916) ]
coclass OleDB
11-12
{
[default] dispinterface IOleDB;
};
//
Primary dispatch interface for CTaskList
[ uuid(0DBBEB2C-2DFE-11D3-900C-002018650916) ]
dispinterface ITaskList
{
properties:
// NOTE - ClassWizard will maintain property information here.
//
Use extreme caution when editing this section.
//{{AFX_ODL_PROP(CTaskList)
//}}AFX_ODL_PROP
methods:
// NOTE - ClassWizard will maintain method information here.
//
Use extreme caution when editing this section.
//{{AFX_ODL_METHOD(CTaskList)
[id(1)] void GoTop();
[id(2)] void GoBottom();
[id(3)] BSTR Get();
[id(4)] void GoNext();
[id(5)] boolean EndofList();
//}}AFX_ODL_METHOD
};
//
Class information for CTaskList
[ uuid(0DBBEB2D-2DFE-11D3-900C-002018650916) ]
coclass TaskList
{
[default] dispinterface ITaskList;
};
//
Primary dispatch interface for CTagList
[ uuid(0DBBEB2F-2DFE-11D3-900C-002018650916) ]
dispinterface ITagList
{
properties:
// NOTE - ClassWizard will maintain property information here.
//
Use extreme caution when editing this section.
//{{AFX_ODL_PROP(CTagList)
//}}AFX_ODL_PROP
Sharing Real Time Data with Data Center
11-13
methods:
// NOTE - ClassWizard will maintain method information here.
//
Use extreme caution when editing this section.
//{{AFX_ODL_METHOD(CTagList)
[id(1)] boolean SelectTask(BSTR szTaskName);
[id(2)] void GoTop();
[id(3)] boolean EndofList();
[id(4)] void GoBottom();
[id(5)] BSTR GetTaskName();
[id(6)] BSTR GetTagName();
[id(7)] void GoNext();
//}}AFX_ODL_METHOD
};
//
Class information for CTagList
[ uuid(0DBBEB30-2DFE-11D3-900C-002018650916) ]
coclass TagList
{
[default] dispinterface ITagList;
};
//
Primary dispatch interface for CDBCTR32
[ uuid(0DBBEB32-2DFE-11D3-900C-002018650916) ]
dispinterface IDBCTR32
{
properties:
// NOTE - ClassWizard will maintain property information here.
//
Use extreme caution when editing this section.
//{{AFX_ODL_PROP(CDBCTR32)
//}}AFX_ODL_PROP
methods:
// NOTE - ClassWizard will maintain method information here.
//
Use extreme caution when editing this section.
//{{AFX_ODL_METHOD(CDBCTR32)
[id(1)] long AddTaskName(BSTR szTaskName, long pT);
[id(2)] long DeleteTaskName(BSTR szTaskName);
[id(3)] long AddTag(BSTR szTaskName, BSTR szTagName, short wDataType, short wCount);
[id(4)] long DeleteTag(BSTR szTaskName, BSTR szTagName);
[id(5)] boolean SetTagDataLongX(long lpDB, short wDataType, short Index, long Data);
[id(6)] boolean SetTagDataFloatX(long lpDB, short wDataType, short Index, float Data);
[id(7)] boolean SetTagDataSTRX(long lpDB, short wDataType, short Index, BSTR Data);
[id(8)] long GetTagDataLongX(long lpDB, short wDataType, short Index);
[id(9)] float GetTagDataFloatX(long lpDB, short wDataType, short Index);
11-14
[id(10)] BSTR GetTagDataSTRX(long lpDB, short wDataType, short Index);
[id(11)] boolean SetDataExp(long lpDB, long* pParam);
[id(12)] boolean GetDataExp(long lpDB, long* pParam);
[id(13)] long ChangeTaskName(BSTR szOld, BSTR szNew);
[id(14)] long ChangeTagName(BSTR szTaskName, BSTR szOld, BSTR szNew);
[id(15)] long GetTaskRecordPtr(BSTR szTaskName);
[id(16)] long GetTagEntryPtr(BSTR szTaskName, BSTR szTagName);
[id(17)] long GetTagEntryPtrX(long dwTagID);
[id(18)] boolean SetData(BSTR szTaskName, BSTR szTagName, long* pParam);
[id(19)] boolean GetData(BSTR szTaskName, BSTR szTagName, long* pParam);
[id(20)] boolean SetDataX(long dwTagID, long* pParam);
[id(21)] boolean GetDataX(long dwTagID, long* pParam);
[id(22)] long GetTagID(BSTR szTaskName, BSTR szTagName);
[id(23)] boolean GetDataInfo(BSTR szTaskName, BSTR szTagName, long* lpDB);
[id(24)] boolean IsTagExist(BSTR szTaskName, BSTR szTagName);
[id(25)] boolean IsTagEnabled(BSTR szTaskName, BSTR szTagName);
[id(26)] boolean IsTagEnabledX(long dwTagID);
[id(27)] boolean EnableTag(BSTR szTaskName, BSTR szTagName, bool bEnable);
[id(28)] boolean EnableTagX(long dwTagID, bool bEnable);
[id(29)] long LockTag(BSTR szTaskName, BSTR szTagName);
[id(30)] long LockTagX(long dwTagID);
[id(31)] boolean UnlockTag(BSTR szTaskName, BSTR szTagName, long Key);
[id(32)] boolean UnlockTagX(long dwTagID, long Key);
[id(33)] boolean SetLockedData(BSTR szTaskName, BSTR szTagName, long Key, long* pParam);
[id(34)] boolean SetLockedDataX(long dwTagID, long Key, long* pParam);
[id(35)] boolean SetLockedDataExp(long* lpDB, long Key, long* pParam);
[id(36)] void ClearAllLockedTag();
[id(37)] boolean IsTagLocked(BSTR szTaskName, BSTR szTagName);
[id(38)] boolean IsTagLockedX(long dwTagID);
[id(39)] boolean GetRunStatus();
[id(40)] short GetTagType(BSTR szTaskName, BSTR szTagName);
[id(41)] short GetTagTypeX(long dwTagID);
[id(42)] long GetTaskHandle(BSTR szTaskName);
[id(43)] boolean SetLockedTagDataLongX(long lpDB, long Key, short wDataType, short Index, long
Data);
[id(44)] boolean SetLockedTagDataFloatX(long lpDB, long Key, short wDataType, short Index, float
Data);
[id(45)] boolean SetLockedTagDataSTRX(long lpDB, long Key, short wDataType, short Index, BSTR
Data);
//}}AFX_ODL_METHOD
};
//
Class information for CDBCTR32
[ uuid(0DBBEB33-2DFE-11D3-900C-002018650916) ]
coclass DBCTR32
Sharing Real Time Data with Data Center
11-15
{
[default] dispinterface IDBCTR32;
};
//{{AFX_APPEND_ODL}}
//}}AFX_APPEND_ODL}}
};
Summary
GeniDAQ’s data center provides OLE Automation and DDE interface that allow your application to
share real time data with GeniDAQ. Users can choose their favorite language to develop their applications.
11-16
12
Advantech
GeniDAQ WinCE
for HMI-640S
Platform
Overview
Advantech GeniDAQ allows you to build your application on PCs with Windows NT/98/95, and run it on
these platforms or on Advantech HMI-640S model with Windows CE. Advantech HMI-640S is a HMI
platform with 5.7 inch screen size. For the detailed information, please refer to Advantech HMI-640S
hardware manual.
This chapter describes how to run Advantech GeniDAQ on HMI-640S platform, including the installing
Advantech GeniDAQ CE Runtime on HMI-640S, developing GeniDAQ CE strategy, downloading the
strategy, configuring the devices, TCP/IP networking and running the application.
The steps to run your strategy as below:
a. Build your application with Advantech GeniDAQ Builder (V4.10 or higher) on Host PC
b. Download GeniDAQ CE strategy to HMI-640S
c. Launch \Harddisk\GeniDAQCE\AdsDeviceInstall.exe to configure and install devices.
d. Launch \Harddisk\GeniDAQCE\GeniDAQCE.exe program under My Computer icon to start the
Advantech GeniDAQ CE Runtime.
Contents
12-2
•
Installing Advantech GeniDAQ CE on HMI-640S
•
Creating GeniDAQ CE strategy on host PCs
•
Downloading GeniDAQ CE strategy to HMI-640S
•
Configuring I/O devices on HMI-640S
•
Configuring TCP/IP networking on HMI-640S
•
Running Advantech GeniDAQ CE on HMI-640S
•
Summary
Installing Advantech GeniDAQ CE on HMI-640S
Microsoft Windows CE version 2.12 and Advantech GeniDAQ CE Runtime are optional pre-installed in
HMI-640S when shipping. We also provide Advantech GeniDAQ CE Runtime installation CD-ROM disc.
If the program is damaged on HMI-640S, you can re-install it from the CD-ROM disc by following the
steps below:
Installing Advantech GeniDAQ CE Runtime for HMI-640S via Microsoft
ActiveSync
Before you begin:
Install Microsoft ActiveSync by selecting the “Install Advantech GeniDAQ CE Runtime” item.
Set up a partnership between your device and desktop computer using a serial cable, cradle, or infrared
connection. For more information about setting up a partnership, see Microsoft ActiveSync Help.
If your computer is running Windows NT 4.0, you need to install the Remote Access Service (RAS).
If your desktop computer is running Windows 95, you need to install Dial-Up Networking Upgrade
(DUN) 1.3 or later which is available at http://www.microsoft.com/Windows95/downloads/. The following procedures will not work with DUN 1.2. For Windows 98, it is built-in.
Install a NULL modem for your desktop computer and configure it for general use as instructed in
Windows Help or your modem instructions.
For more information, please refer to readras.doc in the Microsoft ActiveSync installation directory.
Connecting a HMI-640S device to host PC
1 On HMI-640S, select Start|Programs|Communication|Remote Networking.
2 Double-click or double-tap the Make New Connection icon.
3 In the Type a name for the connection box, enter a unique name for the connection.
4 Select Direct Connection and then select Next.
5 In the Select the device field, select the COM port that connects to the host PC.
6 Click Configure button, it generates the “Device Properties” dialog box. Click Port Settings tab. We
suggest to use 115200 bps for Baud rate field.
7 Select Finish to close the New Connection settings. The connection that you create appears as an
icon in the Connections window.
8 Select Start|Settings|Control Panel.
9 Double-click the Communication icon. Click the PC Connection tab and change the connection to the
new created connection.
10 Launch \windows\repllog.exe to setup connection.
Advantech GeniDAQ WinCE for HMI-640S Platform
12-3
9-pin NULL Modem Cabling
Remote Host Serial
Port Connector
Calling System Serial
Port Connector
Signal
3
2
Transmit Data
2
3
Receive Data
7
8
Request to Send
8
7
Clear to Send
6, 1
4
Data Set Ready and
Carier Detect
5
5
Signal Ground
4
6, 1
Data Terminal Ready
For more information about setup connection, please refer to Microsoft ActiveSync on-line help.
Copying GeniDAQ CE Runtime files from host PC to HMI-640S
Using Microsoft ActiveSync, you can copy or move information from the desktop to the device and vice
versa.
1. On host PC, in ActiveSync, click Windows Explorer. Then it will open the Mobile Device window for
your device.
2. In Windows Explorer, browse to the GeniDAQ CE Runtime files (for example, C:\Program
Files\Advantech\GeniDAQCE).
3. Right-click the files and click Copy. Place the cursor in the \harddisk\genidaqce folder for your
device, right-click, and click Paste
Installing Advantech GeniDAQ CE Runtime for HMI-640S via TCP/IP Network
1. Insert the Advantech GeniDAQ CD into CD-ROM drive on host PC. The installation program will be
launched automatically.
2. Select “Install Advantech GeniDAQ WinCE Runtime” item and specify the installation directory to
C:\Program Files\Advantech\GeniDAQCE on Host PC to install it.
3. After installing it to host PC, share the installed directory, C:\Program Files\Advantech\GeniDAQCE
directory, with other machines by right-clicking on the GeniDAQCE directory and selecting resource
sharing item in the Windows Explorer.
Note:
The other way, you can transfer the files through a network server by copying all files
under C:\Program Files\Advantech\GeniDAQCE directory to the server.
4. Connect the host PC and HMI-640S to a hub or a network server.
Note:
12-4
If you use a hub for download, you should assign IP addresses for host PC and HMI640S manually.
5. On HMI-640S, click Start->Programs->Command Prompt menu and issue the command
[\] Net View Host_PC_Computer_Name for download via hub, or
Note:
For download via network server, issue the command
[\] Net View Server_Name
It generates Logon to Network Server Dialog box, then inputs the user name,
password and domain for login the server.
6. Then it shows the directory on the host PC or server. Then issue the command
[\] Copy \\Host_PC_Computer _Name\*.* \Harddisk\GeniDAQCE, or
[\] Copy \\Server_Name\…\files
to \Harddisk\GeniDAQCE directory on HMI-640S. After copying all download files, close Command
Prompt Prompt.
Advantech GeniDAQ WinCE for HMI-640S Platform
12-5
Creating GeniDAQ CE Strategy on Host
1. Launch Advantech GeniDAQ Builder, and click on the File/New menu to create a new strategy. A
dialog box is shown. Click the Windows CE option in the Platform field, and specify the desktop size.
Figure 12-1: Select Windows CE and the screen size in the New Strategy Dialog Box
2. It generates a empty strategy for Windows CE platform. Note some icons are disabled for Windows
CE, including BasicScript block, DDE Server and Client blocks, and conditional wavefile block.
3. After developing your application, click on the File/Save menu to save the strategy file. You have to
save it with *.gce extension.
Figure 12-2: Save Your Strategy File with a *.gce File Extension
12-6
Downloading GeniDAQ CE Strategy Files to HMI-640S
After building your GeniDAQ CE strategy, you have to download it to your HMI-640S. Before you
begin, you have to setup a connection between HMI-640S and host PC. Please refer to the “Connecting
a HMI-640S device to host PC” section. After you setup the connection between host PC and HMI-640S,
you can download the strategy by Advantech GeniDAQ builder program or Microsoft ActiveSync.
Download strategy files from host PC to HMI-640S via Advantech
GeniDAQ
1. Launch Microsoft ActiveSync to setup connection between host PC and HMI-640S.
2. In Advantech GeniDAQ builder program, click File|Download menu to download it.
3. When download, you can specify to startup the strategy at booting HMI-640S.
Download strategy files from host PC to HMI-640S via
Microsoft ActiveSync
Using Microsoft ActiveSync, you can copy or move information from the desktop to the device and vice
versa.
1. On host PC, in ActiveSync, click Windows Explorer. Then it will open the Mobile Device window for
your device.
2. In Windows Explorer, browse to the strategy files for download.
3. Right-click the files and click Copy. Place the cursor in the desired folder for your device, right-click,
and click Paste
Advantech GeniDAQ WinCE for HMI-640S Platform
12-7
Configuring I/O Devices on HMI-640S
Advantech GeniDAQ CE supports the following devices, simulation I/O, ADAM-4000, 5000/485, Serial
ModBUS RTU drivers, and serial port devices. These device drivers are built-in HMI-640S. If you want
to connect to the other devices, you have to install the corresponding OPC servers for Windows CE on
HMI-640S.
Connecting Devices Through OPC Interface
Before connecting to the OPC servers, you must install and/or configure your OPC server. Please refer to
your OPC server documentation.
Advantech GeniDAQ CE includes two OPC servers, Advantech ADAM OPC server and Serial ModBUS
RTU OPC server. Follow the steps below to configure it on Host PC.
1. Configure OPC servers by launching the ADAMOPC.EXE program or MODBOPC.EXE program on
host PC, and save the configuration with the file name: ADAMOPC.TDB or MODBOPC.TDB. You
must use the file name.
Note:
The ADAM OPC server name or program ID is Advantech.adam.1. It is
Advantech.ModBus.1 for ModBUS OPC server.
2. Build your strategy with Advantech GeniDAQ on host PC. Enable OPC function in I/O blocks, and
connect to the OPC items.
3. Then download the OPC server configuration files, ADAMOPC.TDB and/or MODBOPC.TDB, and
the strategy file to HMI-640S.
Note:
By default, these OPC server are registered on HMI-640S. If you want to register
them by yourself under some condition, you can register the OPC servers
(ADAMOPC.DLL or MODBOPC.DLL) by entering the following commands under
\harddisk\genidaqce directory in Command prompt:
[\]Regsrvce adamopc.dll (or modbopc.dll)
[\]Regsave
Note:
You can use the following commands to unregister the OPC servers under Command Prompt:
[\] Regsrvce /u adamopc.dll (or modbopc.dll)
[\] Regsave
4. Run the strategy, then it can connect the devices.
Connecting Simulation I/O or Serial Port Devices
After you download your strategy to HMI-640S, you have to configure the I/O devices on HMI-640S.
For simulation I/O or serial port devices, follow the procedure below to configure it.
1. Launch the device installation program (ADSDeviceInstall.exe) under \Harddisk\GeniDAQCE
directory.
2. Install and configure the simulation I/O or serial port. Note that make sure the I/O settings is the same
as that on host PC.
You can also configure these devices on your PC with the device installation program. Then export the
device configuration to a *.reg file, and download it to HMI-640S. Finally, use device installation
program to import the *.reg file on HMI-640S.
12-8
Configuring TCP/IP Networking on HMI-640S
Please follow the procedure described below to set up network connection between HMI-640S and host
PC via Ethernet network.
1. Before connecting to LAN, first make sure you have properly set up your host PC on an Ethernet
LAN running TCP/IP networking protocol. If you have not installed the TCP/IP network protocol on
you host PC, you must install it first before joining the host PC to Ethernet LAN.
2. Make sure the TCP/IP network protocol is enabled on your HMI-640S.
Note:
If you use a CompactFlash drive which is preinstalled with Windows CE, your HMI640S is ready for TCP/IP networking. You don’t have to install other components to
run TCP/IP networking
3.Disconnect any power source from your HMI-640S.
Note:
Be sure to power off the HMI-640S before you connect or disconnect any cable.
4.Use a twisted-pair UTP or STP cable (category 3, 4, 5) to connect the HMI-640S through its RJ-45 port
to a hub (or a switch) within the Ethernet LAN, to which your host PC is also connected to.
5.Assign valid IP addresses for your HMI-640S and host PC. If you are joining an existing Intranet, ask
your network administrator for valid IP addresses. If you are using a DHCP server on the network, you
have just no need to assign IP addresses yourself.
Note:
To assign the IP addresses to your machines, just access Start/Settings/Control
Panel/Network Properties sheet and enter valid IP addresses for your machine.
Note:
If your network are using a DHCP server for dynamic IP address assignment, you
have then no need to assign by yourself since the IP addresses will be assigned to
each networking device once it is connected to the network.
6.Enter the device name for your HMI-640S for network identification.
7.After properly establishing the IP status and the device name of your machine on the network, you
must reboot to make it viable on the network.
8.After rebooting is complete, verify that your HMI-640S is funtionable within the network.
Note:
To verify that your HMI-640S has joined that network and is property connected with
your host PC, just try to access your host PC thourhg the Windows CE Explorer by
typing //host-name_of_host_PC in the adress bar. Press Enter to search for the host
PC. If the connection is successful, you can see the network shares that is available from the host PC. Or you can simply “ping” your HMI-640S from your host PC to
make sure TCP/IP is working. (e.g. c:\ping IP_address_of_your-HMI-640S or
device_name_of_your_HMI-640S)
Advantech GeniDAQ WinCE for HMI-640S Platform
12-9
Running Advantech GeniDAQ CE on HMI-640S
Runtime Environment
The GeniDAQ WinCE Runtime environment is shown below:
Runtime Menus
File
Setup
View
Help
After a strategy file is open, the Runtime menu changes to the following:
File
View
Run
Help
File menu
The File menu includes commands that enable you to open and close existing strategy files.
Setup menu
The Setup menu includes commands that enable you to setup numeric keypad, change password,
administrate users and setup runtime system.
View menu
The View menu includes commands that enable you to display or hide toolbar, status bar and event log
window.
Run menu
The Run menu includes commands that enable you to start, stop, resume, pause, lock, unlock, login and
logout the runtime system.
Toolbar Icons
Start icon starts running the strategy
Stop icon stops the running strategy
Pause icon pauses the running strategy
Resume icon resumes the paused strategy
Lock icon locks running strategy to protect from unintended operation
Unlock icon unlocks running strategy
Login icon is used to log in to the runtime system
Logout icon is used to log out of the runtime system
12-10
Starting Runtime
You can start the GeniDAQ Runtime with the following methods.
1. Launch \Harddisk\genidaqce\genidaqce.exe program. Open the desired strategy file with the suffix
“.gce”, and press START icon.
2. If you want to load and run a strategy upon system boot-up, you must create a startup.ini file as
below:
\GeniDAQ installed path\genidaqce.exe *.gce
For example,
\Harddisk\genidaqce\genidaqce.exe \Harddisk\genidaqce\showce.gce
Put the startup.ini file under the \Harddisk\Startup directory.
Exiting Runtime
When you have finished working in Runtime, getting back to Windows CE is performed by pressing the
STOP icon. Then you can exit the GeniDAQ Runtime system by pressing File|Exit menu from the main
menu.
Differences between the Win32 and WinCE Versions of
Advantech GeniDAQ
Advantech GeniDAQ WinCE doesn’t support the following functions:
•
BasicScript function
•
DDE function
•
OLE Automation interface for data center
•
Conditional wavefile block
In addition, the task blocks and display blocks are limited supported. Check the following tables for the
support listing.
Advantech GeniDAQ WinCE for HMI-640S Platform
12-11
TASK Blocks
12-12
Block
D e scription
Win32
WinCE
[AI]
Analog Input
Yes
Yes
[AO]
Analog O utput
Yes
Yes
[D I]
Digital Input
Yes
Yes
[D O]
Digital O utput
Yes
Yes
[TEM P]
Temperature Measurement
Yes
Yes
[COUNT]
Hardware Counter
Yes
Yes
[ALM ]
Hardware Alarm
Yes
Yes
[R S232]
RS-232 Port
Yes
Yes
[PID]
PID Control
Yes
Yes
[ON/OFF]
O n/Off Control
Yes
Yes
[SOC]
Single O perator Calculation
Yes
Yes
[AVG]
Average
Yes
Yes
[EV]
Event Counter
Yes
Yes
[BS]
Basic Script
Yes
No
[TM ]
Timer(need modify)
Yes
Yes
[TM S]
Time Stamp
Yes
Yes
[LOG]
Log File
Yes
Yes
[IN P]
Input File
Yes
Yes
[D DEC]
DDE Client
Yes
No
[D DES]
DDE Server
Yes
No
[N ETIN ]
N etwork Input
Yes
Yes
[SALM ]
Software Alarm
Yes
Yes
[BEEP]
Beep
Yes
Yes
[WAVE]
Conditional Wave File
Yes
No
[SYS]
System Control
Yes
Yes
DISPLAY Blocks
Block
Description
Win32
WinCE
[BBTN]
Binary Button
Yes
Yes
[CBTN]
Conditional Button
Yes
Yes
[MBTN]
Menu Button(need modify)
Yes
Yes
[NUMC]
Numerical Control
Yes
Yes
[KNOB]
Knob Control
Yes
Yes
[SLD]
Slider Control
Yes
Yes
[IND]
Indicator Display
Yes
Yes
[NUM]
Numerical Display
Yes
Yes
[CTXT]
Conditional Display
Yes
Yes
[BAR]
Bar Graph Display
Yes
Yes
[MET]
Anameter Display
Yes
Yes
[TRN]
Trend Graph Display
Yes
Yes
[HIST]
Historical Trend Display
Yes
No
[XY]
XY Graph Display
Yes
Yes
[CBMP]
Conditional Bitmap Display
Yes
Yes
[RECT]
Rectangle Drawing Display
Yes
Yes
[ROUND]
Rounded Rectangle Drawing
Display
Yes
Yes
[OVAL]
Oval Drawing Display
Yes
Yes
[POLY]
Polygon Drawing Display
Yes
Yes
[LINE]
Line Drawing Display
Yes
Yes
[TXT]
Text String Display
Yes
Yes
[GROUP]
Group Box Display
Yes
Yes
[EVLOG]
Event Log Display
Yes
Yes
Advantech GeniDAQ WinCE for HMI-640S Platform
12-13
Summary
Applications for Advantech’s HMI-640S model running Windows CE can be developed on computers
running Windows NT/98/95. The application must then be downloaded or copied on the HMI-640S. By
enabling TCP/IP networking between the HMI-640S and a host PC, you will establish real-time data
acquisition. While most of the functions available in the Win32 version of GeniDAQ are also available
for the WinCE version, BasicScript, DDE and OLE automation are not supported. Some task are display
blocks, when used on WinCE, only support a subset of the functions supported for the Win32 version of
GeniDAQ.
12-14
A
Runtime Error
Code Listing
Errors and Warnings
The following is a list of possible errors and warnings that you may encounter during GeniDAQ
Runtime. These error messages can aid tremendously in troubleshooting various hardware problems
when running GeniDAQ.
Runtime Error/Warning Codes are as follows:
“Open communication port failed on %d”
Where %d is the serial communications port. This message flags a fatal error during Runtime initialization. The configured I/O device is capable of serial communications, but for some reason, the chosen
communications port is not responding.
Possible causes:
1. The configuration of the driver is invalid. You may have configured the I/O device to be connected
to a certain communications port that does not exist in your machine.
2. The port itself is invalid. The port may not exist in your machine. The port may be used already,
such as with a mouse or other serial device.
3. The RS-232 communications port hardware is bad.
“Transmit failed on %d”
Where %d is the I/O device, such as RS-485 based ADAM module addressing.
This problem is possibly caused by bad RS-232 transmitter section hardware.
“Receive failed on %d”
Where %d is the I/O device, such as RS-485 based ADAM module addressing.
Possible causes:
1. Bad RS-232 or RS-485 bus wiring.
2. Bad remote hardware, such as a bad ADAM module or remote power supply.
3. Bad RS-232 receiver section hardware.
4. Scan rate (sample rate) is set much too fast.
“Invalid data received on %d”
Where %d is the I/O device, such as with RS-485 based ADAM modules.
1. Bad remote hardware, such as a bad ADAM module or remote power supply.
2. Bad RS-232 or RS-485 bus wiring.
“Initialize failed on %d”
Where %d is the I/O device. This error usually occurs when there is a driver software problem, such as
a configuration error. However, this error can also point to the I/O hardware, such as a data acquisition
card that requires programmable gain setting, etc. and checking is done by the driver to see if on-board
registers have been initialized properly.
A-2
“Device reset failure on %d”
Where %d is the I/O device. The device resetting routine cannot execute properly. This error usually
occurs when there is a driver software problem, such as a configuration error. However, this error can
also point to the I/O hardware, such as a data acquisition card that requires programmable gain setting,
etc. during board reset. Checking is done by the driver to see if on-board registers have been reset
properly.
“Analog input initialization failure on %d”
Where %d is the I/O device. The Analog Input section cannot initialize properly. Usually a driver
software problem, but can also point to the I/O device hardware Analog Input section, if I/O card
register checking is done by the driver.
“Analog output initialization failure on %d”
Where %d is the I/O device. The Analog Output section cannot initialize properly. Usually a driver
software problem, but can also point to the I/O device hardware Analog Output section, if I/O card
register checking is done by the driver.
“Digital output initialization failure on %d”
Where %d is the I/O device. The Digital Output section cannot initialize properly. Usually a driver
software problem, but can also point to the I/O device hardware Digital Output section, if I/O card
register checking is done by the driver.
“Digital input initialization failure on %d”
Where %d is the I/O device. The Digital Input section cannot initialize properly. Usually a driver
software problem, but can also point to the I/O device hardware Digital Input section, if I/O card
register checking is done by the driver.
“Temperature initialization failure on %d”
Where %d is the I/O device. The Temperature section cannot initialize properly. Usually a driver
software problem.Can also point to the I/O device hardware Analog Input section, if I/O card register
checking is done by the driver.
“Analog input section failure on %d”
Where %d is the I/O device. Cannot receive analog input data from the I/O device. Can be a problem
with the driver software. Also could be a problem in the I/O device hardware Analog Input section.
However, this error can also occur if the I/O card base address set on the I/O device does not match that
of the software configuration setting.
“Analog output section failure on %d”
Where %d is the I/O device. Can be a problem with the driver software. Also could be a problem in the
I/O device hardware Analog Output section. However, this error can also occur if the I/O card base
address set on the I/O device does not match that of the software configuration setting.
Runtime Error Code Listing
A-3
“Digital output section failure on %d”
Where %d is the I/O device. Can be a problem with the driver software. Also could be a problem in the
I/O device hardware Digital Output section. However, this error can also occur if the I/O card base
address set on the I/O device does not match that of the software configuration setting.
“Digital input section failure on %d”
Where %d is the I/O device. Can be a problem with the driver software. Also could be a problem in the
I/O device hardware Digital Input section. However, this error can also occur if the I/O card base
address set on the I/O device does not match that of the software configuration setting.
“Temperature section failure on %d”
Where %d is the I/O device. Cannot receive analog input (temperature) data from the I/O device. Can
be a problem with the driver software. Also could be a problem in the I/O device hardware Analog
Input section. However, this error can also occur if the I/O card base address set on the I/O device does
not match that of the software configuration setting.
“Device not found”
I/O device is not properly installed. Either the Strategy Editor I/O Icon Block (AI, AO, DI, DO, or
Temperature block) is not properly configured, or the I/O Device does not exist. Configure the block
and save the strategy, or enter the Advantech Device Installation Utility and configure the device.
“No XXX function supported on %d”
Where %d is the I/O device and XXX is one of the I/O functions. Either the driver or GeniDAQ does
not support an I/O device’s function, or the I/O device does not support a function that the driver or
GeniDAQ is trying to access during Runtime. ALWAYS a software problem, since the driver knows all
supported functions, and GeniDAQ queries the driver for the supported device features.
“Timer Overrun, slow down the sampling rate”
The computer cannot process one complete scan of the strategy in the time allowed in the Scan Task
setup. Allow more time for your scan task.
“Not enough memory”
Memory allocation error. Try to free up memory by doing less multi-tasking, install more memory, use
a good memory manager program, etc.
“File not found”
Occurs when trying to access a file, such as a log file, data file, or strategy file.
“Configuration data lost”
Occurs when there is a corrupted or missing device configuration in the Windows registry. It contains
specific configuration information for all of your installed I/O devices. If it is bad or missing, you must
re-create it again.
A-4
B
Glossary
Glossary
Actuator
E device that activates process control equipment by using pneumatic, hydraulic, or electronic signals.
For example, a valve actuator is used to control fluid rate for opening and closing valves.
A/D Converter
Analog-to-digital converter. A circuit or device used for producing a set of digital output signals
representing the magnitude of a voltage applied to its input. The resolution of the device is proportional
to the number of its digital output bits. For instance, a 16-bit A/D converter is higher in resolution than
a 12-bit A/D.
Add
To add a device means to increase the number of I/O devices of the same type as the installed device
driver. When a device is added to the system, only one driver is installed (using the device DRIVERS
utility provided in the Control Panel, Main Window). Configuration information is then added by using
the Advantech Device Installation program. You may have more than one I/O device of the same type
installed in a system at one time. To add an I/O card, for instance, you would press the ADD button in
the Advantech Device Installation Program and then configure the base address, and possibly other
parameters.
Analog
In electrical quantities having the property of varying in a continuous, rather than incremental or
discrete-step manner.
C, Centigrade, Celsius
Zero degrees = Freezing and 100 degrees = Boiling point of water at sea level.
CJC, Cold Junction Compensation
If two wires of different metals are connected end to end, there are two junctions formed. Current will
flow in the resulting circuit if one junction is at a different temperature than the other (Seebeck
Coefficient). This effect is the same for either junction except for polarity. Call one of the junctions
the measuring junction. Separate the other junction and connect the two leads to a current meter.
When making temperature measurements, if the current produced by this other junction (cold
junction) is ignored, an unknown error is created. If the temperature of the cold junction is noted at
the same time as a measurement is made, then the error from the cold junction can be added or
subtracted from the reading to give a correct answer.
Automatic cold junction compensation is accomplished by sensing the terminal temperature (cold
junction) with an RTD. The RTD is in a circuit that produces a current equal and opposite to that
produced by the cold junction. Thus the current change from the cold junction plus that from the
compensation circuit cancel one another. Once this is accomplished, it can then be assumed that the
current meter reading represents the current produced by the measuring junction only.
B-2
Comp Loop
An extra pair of wires going to the tip of an RTD but not connected to the element, a novel way of lead
wire resistance compensation.
Configure
To configure an I/O device is to set the parameters for use with the software the same as those set on the
actual I/O device. The values set in the device-specific dialog box should reflect those of the switches
and jumpers you have set on the I/O device, board, or card. When an instance of a device is added, it
must be configured before it can be used with the software.
Controller, Temperature
A device or software program capable of receiving a signal from a temperature sensing probe within a
process and regulating an input to that process in order to maintain a selected temperature (control
point).
Conversion Rate
The number of analog-to-digital (A/D) conversions (samples) performed per second.
Counts
The number of events, or events counted by the event counter. The event counter increments or
decrements whenever a rising edge of a digital signal is sensed at the counter input.
D/A Converter
A device that converts digital information from the computer into a corresponding analog voltage or
current. This allows the computer to control real world events. Analog outputs may directly control
equipment in a process that is then measured by an analog input. It is possible to perform closed loop or
PID control with the D/A function. Analog outputs can also generate waveforms (function generator).
The resolution of the device is proportional to the number of its digital input bits. For instance, a 16-bit
D/A converter is higher in resolution than a 12-bit D/A.
Deadband (Hysteresis)
In a digital (on/off) controller, there may be one switching point at which the signal increases and
another switching point at which the signal decreases. The difference between the two switching points
is called hysteresis or deadband.
Differential Input
A signal-input circuit where SIG LO and SIG HI are electrically floating with respect to analog ground
(I/O device analog ground, which is normally tied to digital ground). This allows the measurement of
the voltage difference between two signals tied to the same ground and provides superior commonmode noise rejection.
Glossary
B-3
F (Fahrenheit)
32 degrees = Freezing and 212 degrees = Boiling point of water at sea level.
Hold
An external input which is used to stop the process (event counter, ramp, A/D, etc.) temporarily,
freezing the device’s output at the current value.
Hz
Frequency in cycles per second pulses per second, events per second, etc.
Impedance
Resistance to electrical flow in an AC circuit. It is designated by the symbol Z and is expressed in
ohms.
I/O Device
An I/O device is a hardware device capable of data input and output. Generally, this would encompass
Analog to digital Conversion (A/D), Digital to Analog conversion (D/A), and Digital Input and Output.
The devices capable of such I/O can be in the form of plug-in I/O cards and/or remote devices. The I/O
device’s hardware should be configured (if necessary) first, and then the software can be configured to
match the hardware’s settings. Some I/O devices can be configured directly through the software’s
settings. Check your hardware manufacturer’s manual for how to configure the hardware. After any
hardware configuration is done, the software configuration can be set up by use of the Advantech
Device Installation Program. The device driver should have been previously installed using the DRIVERS program in the CONTROL PANEL (Main Window).
Input Resistance
Resistance measured across the input terminals with the signal leads disconnected.
Install
To install a device means to:
1. Install its device driver in WINDOWS, using the device DRIVERS installation utility provided in
the Control Panel, Main window.
2. Once the driver is installed, devices of the driver’s type (instances) may be installed (set up or
configured), and added by using the Advantech Device Installation Program.
Instance
An instance of an I/O device is a device that has been added and configured uniquely. For instance,
there may be three Advantech PCL-818 multi-I/O cards installed in a system. Each PCL-818, installed
at separate base addresses and having different parameters configured for each, is an “instance” of the
PCL-818 driver (DLL) that was installed in WINDOWS.
B-4
K (Kelvin)
The basic temperature unit of the thermodynamic scale, symbol K. Zero degrees K = zero degrees C 273.16.
Measuring Junction
That junction of a thermocouple subjected to the temperature to be measured.
Multiplex
A technique which allows different input (or output) signals to use the same lines at different times,
controlled by an external signal. Multiplexing is used to save on wiring and I/O ports.
Overshoot
The ratio of the over-travel of the output of a controller beyond a new steady state to the change in
steady state when a new constant value of the measured quantity is suddenly applied (step input).
Range
The span of values over which a device will function without entering an overload condition.
Reference Junction
The other junction (usually at ice point) to which the measuring junction thermocouple junction is
compared. The output voltage of a thermocouple is approximately proportional to the temperature
difference between the measuring (hot) junction and the reference (cold) junction.
Remove
To remove a device means:
•
Once the driver is installed, devices of the driver’s type (instances) may be removed, by highlighting the listing in the dialog box of the Advantech Device Installation Program and pressing the
remove button.
To remove the driver means:
•
Remove the device’s driver from WINDOWS, using the device DRIVERS utility provided in the
Control Panel, Main window.
Resolution
The degree to which nearly equal values of a quantity can be discriminated. In analog devices, the
difference between the values represented by two adjacent divisions. In digital values, the value
represented by a one-digit change in the least-significant digit.
Response Time
The time necessary for a device (sensor, A/D, D/A) to reach 63.2% of a step change in measured
quantity (temperature, voltage, etc.)
Glossary
B-5
RTD
Resistance Temperature Detector — sensor, bulb, transducer; precision winding of copper, nickel, balco
(nickel-iron), platinum (industry standard), or tungsten element used for temperature measurement.
Connected via 2, 3, or 4 wire hook-ups.
Secondary Junction
An unwanted connection between a pair of thermocouple wires tending to produce a signal representative of the secondary junction temperature rather than the measuring junction temperature.
Settling Time
The time taken for the display to settle within one digit final value when a step is applied to the A/D
input.
Setup
To set up an I/O device is to set the parameters for use with the software the same as the settings of the
actual I/O device. The values set in the device-specific dialog box should reflect those of the switches
and jumpers you have set on the I/O device, board, or card. Alternatively, if you are using a software
programmable device, the device can be configured directly through the device-specific dialog box (in
most cases).
Signal Conditioner
A circuit module that offsets, attenuates, linearizes, or filters the signal for input to the A/D converter.
The typical output span of a signal conditioner is +/- 5VDC.
Single Ended Input
Amplifier with one input referenced to ground.
Temperature Limit
The full capability of the system from the lowest point to the highest point: limited by the sensor.
Temperature Span
Those two points anywhere within the temperature limit to which the signal conditioner/amplifier can
be calibrated. FORMULA: Maximum temperature - minimum temperature = span.
Temperature Stability/Instability
The unwanted change (error) of an instrument, sensor, amplifier, etc. caused by changes in the temperature surrounding it. Usually expressed as the total change between two temperature limits, or % error/
degree C or F.
B-6
Thermocouple
Two dissimilar metals with a voltage output proportional to temperature. ANSI types:
Type
Composition
Max Degrees F
J
Iron-Constantan
2192
K
Chromel-Alumel
2501
T
Copper-Constantan
752
E
Chromel-Constantan
1832
R
Platinum-Plat.13%Rhodium
3214
S
Platinum-Plat.10%Rhodium
3214
B
Plat.6%Rhod.-Plat.30%Rhod.
3308
C
Tu 5%Rhenium-26%Rhenium
5000
Thermocouple Break Protection
A safety feature to indicate when a thermocouple has failed in an open circuit condition. Its purpose is
to eliminate the possibility of an ambiguous reading. In the case of a temperature controller, it eliminates the dangerous condition of thermal runaway.
Transducer
A device which converts temperature, pressure, level, length, position, etc. into a voltage, current,
frequency, or pulses, etc.
Wheatstone Bridge
A full resistance two (2) wire bridge with RTD, power source, zero and sensitivity adjustments balanced at some reference temperature. Heating or cooling causes a resistance change and discrete circuit
unbalance, which indicates the temperature. Various RTD bridge network connections use 2, 3, or 4
wire hook-up arrangements, depending on the accuracy required in the temperature measurement.
These are designed to balance out lead wire resistance between the sensor and the bridge. Accuracy
obtained is usually:
2 wire +/- >=0.5% (0.5-50 degrees C)
3 wire +/- >=0.25-0.5% (0.25-0.5 degrees C)
4 wire +/- >=0.15-0.25% (0.1-0.25 degrees C)
Glossary
B-7
B-8
C
ADAM OPC Server
Introduction
The Advantech ADAM OPC Server is a driver for both the OPC Client test function and a real working
ADAM-4000, ADAM-5000/485 data acquisition and control module OPC Server. This ADAM OPC
server was implemented using advanced programming concepts from the most current version of the
OPC specification for use in developing next generation industrial software applications.
Key Features of the ADAM OPC Server
•
Advanced OPC data quality and data conversion to client’s request
•
Supports multi-drop ADAM-4000, ADAM-5000/485 I/O devices
•
Uses the concept of groups for easy configuration and manageability
•
Support all popular PLC data types, such as WORD, LONG, FLOAT, INT
•
Internally simulated for configuration and testing
•
Tag multiplier lets you create hundreds of tags in seconds
•
OPC sample client for rapid testing of your OPC data connections
•
GUI interface for viewing devices, tags, groups, and realtime signals
•
Full online help and documentation
•
Online configuration of devices, groups and tags
•
Flexible raw and engineering units and signal scaling
System Configuration and Installation
System Requirements for Windows 95/NT
•
IBM PC compatible with Pentium 133 or higher
•
32 MB RAM
•
10 MB disk space
•
Microsoft Windows 95 with DCOM, Microsoft Windows 98 or NT4.0.
Hardware Support
This OPC Server driver supports ADAM-4000 and ADAM-5000/485 series data acquisition modules.
A cable and wires must be present to connect the user’s computer to ADAM-4000 and ADAM-5000/
485 series data acquisition modules.
Supported ADAM-5000/485 series data acquisition modules are: ADAM-5013, ADAM-5017, ADAM5017H, ADAM-5018, ADAM-5024, ADAM-5050, ADAM-5051, ADAM-5052, ADAM-5056,
ADAM-5060, ADAM-5068, ADAM-5080, ADAM-5000E.
Supported ADAM-4000 series data acquisition modules are: ADAM-4011, ADAM-4011D, ADAM4012, ADAM-4013, ADAM-4014D, ADAM-4016, ADAM-4017, ADAM-4018, ADAM-4018M,
ADAM-4021, ADAM-4050, ADAM-4052, ADAM-4053, ADAM-4060, ADAM-4080, ADAM-4080D.
C-2
Installing the ADAM OPC Server Under Windows 98/95/NT
GeniDAQ version 4.1 and higher includes the OPC server. It is installed and registered on the system
when GeniDAQ is installed. You can skip the installation and registration steps below.
1. Insert the Advantech ADAM OPC disk #1 in the 3.5-inch disk drive.
2. Click Start, and choose Run in the Windows NT or 98/95 environment.
3. In the Run dialog box, type the following (replacing “A” with the actual location of the 3.5-inch
disk drive):
A:\Setup
4. Follow the instructions in the setup program. The setup program will ask you for the folder where
most of the program files will be copied.
5. The setup program will also ask you for the program folder.
6. At the end of the installation, click OK to view the readme file and launch the OPC client application.
Registering the OPC Server
If the ADAM OPC Server is not registered in the Windows environment, you have to register it
manually. The steps to register the ADAM OPC Server are listed below:
1. Open a DOS command prompt window.
2. Type in the “ADAMOPC /regserver” command at the DOS prompt to execute it.
The ADAM OPC Server will be registered into the Windows system. If you want to unregister the
ADAM OPC Server, type in “ADAMOPC /unregserver” command in DOS prompt window..
Note:
As explained in the installation section of this manual, Windows NT 4.0 or Windows
98/95 with DCOM is required to run the ADAM OPC server.
Install ADAM OPC Server at Windows CE
1. Insert the Advantech ADAM OPC disk #1 into the 3.5-inch disk drive.
2. Copy ADAM OPC Server DLL file and TDB file (configuration file) to the application software
directory. (It is recommended that you create a dedicated sub-directory in the application software
directory to store DLL and GDB files).
3. Use a text editor to view the readme.txt file.
Note:
The file name for ADAM OPC Server configuration file at Windows CE device must
be “ADAMOPC.TDB”.
Registering OPC Server Service
If the ADAM OPC Server is not registered in the Window CE environment, you have to register it
manually. The steps to register the ADAM OPC Server are listed below:
1. Invoke the Command prompt window. (You can press Ctrl + Esc to invoke the command execution
dialog).
2. Type in the “Regsvrce ADAMOPC” command in command prompt mode and execute it.
ADAM OPC Server
C-3
The ADAM OPC Server will be registered into the Window CE system. If you want to unregister the
ADAM OPC Server, type in the “ Regsvrce ADAMOPC /u” command in the command prompt
window.
Quick Start
You can retrieve channel data from any ADAM module listed above by using the following three step
configuration:
•
Step 1: Add New Device
•
Step 2: Add New Group
•
Step 3: Add New Tag
Suppose you want to retrieve the analog input from an ADAM 4011 that uses address 5, and you use
COM1 to connect your computer to the device. Under these conditions, you can perform the following
procedure:
Step 1: Add New Device
1. To add a new device, select Add | New Device from the main menu or push the corresponding
button on the toolbar:
Figure C-1: Creating a New Device from the Main Menu
Figure C-2: Creating a New Device from the New Device Toolbar Icon
2. Then the Device Properties dialog appears:
C-4
Figure C-3: Device Properties Configuration Dialog Box
Type the name of the new device, for example ‘ADAM4011’. Select the represented device module
from the Device Type combo box, choose ‘ADAM – 40011’. Specify the COM port of the PC node
where the newly-added device is connected, for example, ‘COM1:’, and set the device address in this
COM port. After doing this, click OK.
Step 2: Add New Group
After adding the new device (ADAM4011), you should add a new Group for the device . The Group is
used as a container of I/O tags. To add a new Group, select Add | New Group from the main menu or
click the New Group icon on the toolbar. When the Group dialog appears, type in the group name (for
example, “Analog Input”) and click the OK button.
Figure C-4: Type the Group Name in the Group Dialog Box
Step 3: Add a New Tag
Select the added group on the left side of the dialog window and right-click the mouse. Select New Tag
from the pop-up context menu to add a new tag.
ADAM OPC Server
C-5
Figure C-5: New Tag Pop-Up Context Menu
The Tag Properties dialog box will be displayed as below:
Figure C-6: Tag Properties Configuration Dialog Box
Input the tag name and description for the added tag. Select the specified tag type from the Tag Type
combo box. For example, choose Analog Data In for the ADAM-4011 device that you added. The Data
Type will change automatically based on the selected tag type. It is not recommended to change the data
type. After that, specify the channel number of the modules in the system if you use the ADAM-5000/
485 distributed data acquisition and control system. If the added device is an ADAM-4000 device, the
Channel field would be dedicated to “Ch. 0” (channel 0) only.
C-6
After configuring the “Device”, “Group” and “Tag” of the new device, choose View | Monitor from
the main menu of the ADAM OPC Server. The real-time value of the analog input channel of the
ADAM 4011 is displayed in the tag view (on the right side of the OPC Server dialog window) dynamically.
Figure C-7: Real-time Value of the Analog Input Channel
OPC Server Configuration
OPC Server Tool
The ADAM OPC Server tool is your main configuration utility for setting up and maintaining the
ADAM I/O driver. It provides fields for specifying the properties of devices, groups and tags.
Features
•
Key features of the ADAM OPC Server:
•
Advanced OPC data quality and data conversion to client request
•
OPC server utilizes advanced free-threading capabilities.
•
Supports Multiple Groups for easy configuration and manageability
•
Read/write functionality
•
Tag multiplier lets you create hundreds of tags in seconds
•
GUI interface for viewing tags, groups, and real time signals
•
Full online help
•
Change device, group and tag properties online
•
Flexible engineering units and signal ranges
Access Methods
From the Windows Start menu:
•
Select Programs from the Start menu.
•
Select Advantech ADAM OPC Server from the Programs group
•
Select the ADAMOPC execution file from the Programs submenu.
ADAM OPC Server
C-7
Using the Tool’s Browser
The Tree Browser displays a hierarchical list of the I/O driver and its devices, groups and tags. The I/O
driver appears at the top of the tree.
Tool Tree Browser
Figure C-8: ADAM OPC Server Tool Tree Browser
When you select an item in the Tree Browser, its properties display in the Properties Viewer. You can
choose to view the item’s configuration or statistics properties by clicking buttons on the Run-time
toolbar.
Changing Items in the Tree Browser
When you add or modify devices, groups or tags in the OPC Server Tool, changes are made immediately to the I/O Server. Changes you make to the driver configuration while working with the OPC Server
Tool automatically display in the Tree Browser.
Refreshing the Tree Browser
To view changes made from another client application (such as another OPC Server Tool accessing the
server or a custom client application accessing the server), you must refresh the Tree Browser display
by selecting an item in the Tree Browser.
Collapsing and Expanding the Tree Browser
You can collapse or expand the tree under an item by double-clicking it.
C-8
Navigating in the Tree Browser
Navigating through the Tree Browser can be done by selecting items with a mouse or by using the
keyboard. Use the up or left arrow keys to move up in the Tree Browser. Similarly, use the down or
right arrow keys to move down in the Tree Browser. You can also press a letter key to jump to the
nearest item that begins with that letter.
Additional Tree Browser Features
Connection lines show the relationship between devices, groups and tags by displaying which devices
are on a channel and which tags belong to a device. The plus and minus buttons indicate whether items
are fully expanded or collapsed. The plus button shows the item is collapsed and the minus buttons
indicates that the item is expanded. For example, a device with a plus sign next to it means that there
are groups and possibly tags configured on that device.
The Menu Bar
The Tool menu bar includes a title bar, a Minimize button, a Maximize button, a Control-menu box,
and the menus you can use to configure the driver. The menu bar is initially displayed at the top of the
screen but you can resize it and drag it to another location.
The Power Tool has the following menus:
•
File
•
Add
•
Edit
•
View
•
Help
You can customize the Tool’s appearance by dragging the toolbars or the Tree Browser to the location
you want. You can also make the toolbars or the Tree Browser float above the Tool by dragging them
to the center or the screen. Later, you can dock them or resize them, as needed.
Using Shortcut Keys
The following is a list of shortcut keys for working with the I/O Driver Power Tool:
•
<Ctrl>-<N>: Opens a new I/O driver configuration file
•
<Ctrl>-<O>: Allows you to open an existing file
•
<Ctrl>-<S>: Saves the current file
•
<Ctrl>-<D>: Add a new device
•
<Ctrl>-<G>: Add a new group
•
<Ctrl>-<T>: Add a new tag
•
<Ctrl>-<M>: Add multiple new tags
•
<Ctrl>-<X>: Cut
•
<Ctrl>-<C>: Copy
•
<Ctrl>-<V>: Paste
•
Del: Delete
•
<Ctrl>-<P>: Properties
ADAM OPC Server
C-9
Using the File Menu
The following commands appear on the File menu.
Figure C-9: ADAM OPC Server’s File Menu
New
Lets you make a new server configuration file. Keyboard shortcut: <Ctrl>-<N>.
Open
Lets you open an existing server configuration file. You can select TDB file types. Keyboard shortcut:
<Ctrl>-<O>.
Save
Saves the current server configuration file to the default path for configuration files with the name you
specify. The default path for configuration files is the same path where you installed the server. You
can change the default path by entering a new location in the Default Path tab of the Tool’s Setting
Defaults for I/O Driver Configuration File Name and Path.
If you save a new server configuration file, the Save As dialog box prompts you to enter a name for
your server configuration file. Keyboard shortcut: <Ctrl>-<S>.
Save As
Lets you enter a new name and file type for the current server configuration.
C-10
Save As Dialog Box Options
•
Save In Field: Lets you select the directory that you want to store the file in.
•
File Name Field: Lets you save a file with a new name, or in a different location, by entering a new
file name in the File Name field or by selecting a new directory in the Save In list. To save a file
with an existing file name, select the name in the list or enter the current name.
•
Save as Type Field: Lets you specify the type of file you want to save the configuration as:
Import CSV...
Lets you import CSV type file to be current server configuration.
Reimport CSV...
Lets you re-import a CSV type file to update the current server configuration.
Export CSV...
Lets you export current server configuration to a CSV type file.
Reexport CSV...
Lets you re-export current server configuration to update the CSV type file.
Exit
Exits the OPC Server Tool.
Using the Add Menu
The commands that appear in the Add menu are for creating and modifying server configuration files.
These commands correspond with the buttons on the Tool’s Configuration toolbar.
Figure C-10: ADAM OPC Server’s Add Menu
New Device...
Lets you add a new device configuration.
New Group...
Lets you add a new group configuration to group-related tags in one device.
New Tag...
Lets you add a new tag configuration in one device.
ADAM OPC Server
C-11
Multiply...
The tag multiplier provides an easy and fast method for creating many tags without having to individually enter all of them.
Using the Edit Menu
The commands that appear in the Edit menu are for cutting, copying, pasting, deleting and modifying
configuration data. You also can configure COM port in this menu.
Figure C-11: ADAM OPC Server Edit Menu
Cut
Lets you cut selected tag.
Copy
Lets you copy the selected tag.
Paste
Lets you paste cut tags to the device.
Delete
Lets you delete the selected tag.
Ports...
Lets you define the configuration of selected COM port.
Properties...
Lets you define the configuration of selected devices, groups and tags.
C-12
Using the Help Menu
The commands that appear in the Help menu are for displaying the ADAM OPC Server online help and
version number.
Figure C-12: ADAM OPC Server Help Menu
About ADAM...
Displays version and program information about ADAM modules.
Help Contents
Displays online help assistance for the ADAM OPC Server.
Configuring the I/O Driver with the Tool
To configure the ADAM OPC Server with the Tool:
1. Click the New button in the File menu to create a new configuration file
2. Click the New Device button in the Add menu to add a new device to the Tree Browser.
3. Click the New Group button in the Add menu to add a new group for the selected device.
4. Click the New Tag button in the Add menu to add a new tag for the selected group.
5. Modify the fields in the Properties Viewer as needed.
To modify the fields in the Properties Viewer:
1. Select a device, group or tag from the Tree Browser and click the Properties button in the Edit
menu. The fields for the selected item appear in the Properties Viewer.
2. Edit the fields you want to change.
Adding and Modifying Devices
To add a new device to your server configuration:
1. Click the Add Device button on the Add menu of the configuration toolbar. The new device appears
in the Tree Browser and the fields for entering device properties appear in the Device Properties
dialog.
2. Enter the properties for the new device. Edits to a field do not take effect until you remove the focus
(or cursor) from the field and press the OK button.
To modify an existing device:
1. Select the device you want to modify from the Tree Browser.
2. Select specified device and click on the Properties button in the Edit menu bar. The Device
Properties dialog will be displayed for device modification.
3. Edit the device’s fields as needed.
ADAM OPC Server
C-13
Figure C-13: Device Properties Configuration Window
Device Name
Specifies the name of the added or modified device. Valid Entries: Up to 12 alphanumeric characters
Device Type
Specifies the hardware type of the selected device. This property is used to indicate which kind of
device is used. Valid entries are ADAM – 4011, ADAM - 4011D, ADAM – 4012, ADAM - 4013,
ADAM - 4014D, ADAM - 4016, ADAM - 4017, ADAM - 4018, ADAM - 4018M, ADAM - 4021,
ADAM - 4050, ADAM - 4052, ADAM - 4053, ADAM - 4060, ADAM - 4080, ADAM - 4080D,
ADAM - 5013, ADAM - 5017, ADAM - 5017H, ADAM - 5018, ADAM - 5024, ADAM - 5050,
ADAM - 5051, ADAM - 5052, ADAM - 5056, ADAM - 5060, ADAM - 5068, ADAM – 5080.
COMM Port
Specifies which physical COM port to use for the selected channel. You can specify as many channels
as necessary for communication with your hardware.
Valid Entries
•
COM1 to COM2 (if available): Computer ports
•
COM3 to COM8: Expansion ports
•
Any valid COM port name: Expansion ports
Important: Verify that the COM port you select is not used by another channel or application.
Assigning two channels to the same port results in a communication failure on one
of the channels. Assigning a channel to a COM port used by another application
(such as an alarm printer) can produce problems with driver communication.
C-14
Timeout
Specifies how long the I/O driver waits for a response from the selected device. The base of the timeout
field is milliseconds. For example, if you specify 1000 in this field, the server will wait for a response
about 1000 milliseconds (equal to 1 second). Valid entries are 1 ~ 65535.
Slot
Specifies the primary slot number of the selected device in ADAM-5000/485 system. Valid entries are
0 to 3 and NONE.
Address
Specifies the address number of the selected device in the RS-485 communication line. Valid entries are
0 to 255 and NONE.
Simulation I/O
Specifies the device to be a virtual device. It does not connect to any physical devices. But it does
provide a simulation signal to the server. Valid entries are Enabled and Disabled.
To delete an existing device
1. Select the device you want to delete from the Tree Browser.
2. Click on the Delete button in the Edit menu.
Adding and Modifying Tag Groups
To add a new group into the selected device:
1. Select the device to which you want to add a tag group from the Tree Browser.
2. Click the New Group button on the Add menu of the configuration toolbar. The new group appears
in the Tree Browser and the fields for entering the group properties appear in the Group Properties
dialog window.
3. Enter the group name for the new tag group. Edits to a field do not take effect until you remove the
focus (or cursor) from the field and press the OK button.
Figure C-14: Ground Name Configuration Dialog Box
To modify an existing group:
1. Select the group you want to modify from the Tree Browser.
2. Select the Properties button from Edit menu. The Group Properties dialog window will be
displayed for modification.
ADAM OPC Server
C-15
To delete an existing group:
1. Select the group you want to delete from the Tree Browser.
2. Click on the Delete button in the Edit menu.
Adding and Modifying Tags
To add a new tag into selected device
1. Select the group and device to which you want to add a tag from the Tree Browser.
2. Click the New Tag button on the Add menu of the configuration toolbar. The new tag appears in
the workspace on the left of the window. The fields for entering tag properties appears in the Tag
Properties dialog window.
3. Enter the tag name for the new tag. Edits to a field do not take effect until you remove the focus (or
cursor) from the field and press the OK button.
Figure C-15: Tag Properties Configuration Dialog Box
To modify an existing tag
1. Select the tag you want to modify from the Tree Browser.
2. Click on the Properties button from the Edit menu. The Tag Properties dialog box will be displayed for tag modification.
3. Edit the tag’s fields as needed:
C-16
Tag Name
Specifies the name of the added or modified I/O tag. Valid entries are up to 12 alphanumeric characters.
Tag Description
Contains text about the selected tag. Entries in this field can be very helpful when you look forward to
the connection of I/O tag and physical I/O points. The more detailed and specific the information you
enter in this field, the easier it will be to identify the I/O at a later date. Valid entries are up to 40
alphanumeric characters and symbols.
Tag Type
This property indicates what kind of data that the tag represents. Valid entries are Analog Data In,
Analog Data Out, Digit Data, Digit Data In, Digit Data Out, CJC Channel Data, Event Count Data,
Digital & Alarm Status, Alarm Status, High Alarm Limit, Low Alarm Limit, Alarm Mode Setting, High
Alarm Mode Setting, Low Alarm Mode Setting, High Alarm Enable Setting, Low Alarm Enable
Setting, Disable Alarm Setting, Counter Data, Counter Max. Count, Counter Initial Count, Counter
Start Control, Counter Overflow Flag, Counter Alarm Limit, Counter Alarm Enable Setting, Counter 0
Alarm Status, Counter 0 Hi Alarm Limit, Counter 0 HiHi Alarm Limit, Counter 0 Alarm Enable
Setting, Counter 0 Alarm Mode.
Mode
Specifies the method of communication for the selected channel.
Note:
Please notice that this field is not enabled at this OPC Server.
Data Type
Specifies the tag’s default data type. The driver uses this data type for the tag if you do not specify a
database block hardware option. Valid entries include Int, Long, Float, String, Bit, Unsigned Long.
ADAM OPC Server
C-17
Channel
This property indicates which data channel the data block represents. Valid entries are Ch. 0, Ch. 1, Ch.
2, Ch. 3, Ch. 4, Ch. 5, Ch. 6, Ch. 7.
Scaling & Simulation
This group is used for I/O simulation. It will generate I/O signals automatically without connecting
hardware. If you define the device to be a simulation I/O, the tag belonging to the device would be
defined as a simulation signal.
•
Enabled: The range of the input value from the simulation signal would be re-scaled to be the
setting range. The Setting button will be active while this field is enabled. Click on the Setting
button. A Tag Process Setting dialog box will be displayed for input scaling values. You can select
the conversion type to be Linear or Square Root.
•
Simulation Type: There are three simulation signals offered. These simulation signals are Sine,
Ramp, and Random.
Figure C-16: Tag Process Settings Configuration Dialog Box
Configuring the I/O Driver for Windows CE
The ADAM OPC Server Windows CE version is an in-process server. If you use the ADAM OPC
server Windows CE version, you should first create and configure this server in the Windows NT
environment. After configuration, download MODBUS RTU OPC Server Window CE DLL file and the
configuration file (TDB file) to the Window CE target platform.
Note:
C-18
The file name for ADAM OPC Server configuration file at Windows CE device must
be “ADAMOPC.TDB”.
Using OPC Client
An OPC Client application, provided with the ADAM OPC Server, has several methods for rapidly
connecting your servers. The OPC Client is able to browse the registry of a PC and display a complete
list of all installed OPC Servers. It also provides real live data feedback and OPC Server browsing
capabilities.
The OPC Client is also helpful for connecting and testing other 3rd party OPC applications connected
to same server.
Figure C-17: OPC Client
Features
•
Setup dialog box for defining the default name and default setting for configuration files.
•
Tree Browser for an overall view of your system setup.
•
Moveable Tree Browser and toolbars.
Connecting the OPC Server
When OPC servers are installed to the system, they are registered so that clients can find them and users
can view them in a list. To make a client/server connection, the user must first choose a server. The
server name selected (for example, Advantech.ADAM) is used to get a class ID which, in turn, is used
to create a COM object. If the user selects a server that is not currently running, the system starts the
ADAM OPC Server
C-19
server and then creates the object in that server on behalf of the client.
Once the COM object is created, the client application has an IOPCServer interface, as defined in the
OPC specification. This is the main interface to the OPC server and this document refers to this as a
Server interface. (The other interface is Group.) This OPC client always creates a group and registers a
device interface with it to get asynchronous data notification.
When an item is added, the dialog displays either a hierarchy or a flat list of names, depending on the
server. The names are queried from the Server object using the filter string and requested data type.
When the user either types or selects a name, an item by that name is added to the Group object. This
item is also read immediately to get an initial value.
Items in a group are scanned by the server; when their values change, the device interface in the client
is notified. A data structure containing the data for each item whose value or quality has changed (and
only those items) is passed to the client device interface. The client unpacks and uses the data.
Server Status and Group Parameters
The Server Status dialog box periodically queries the server object for status and displays the results.
The Group Parameters dialog queries the group state and displays the results. The OK or Apply
buttons in the Group Parameters dialog box writes the parameters from the dialog to the Group object
and reads the parameters back. This primarily controls the scanning and update of data. When a group
is inactive, it does not send data notifications to the client and, typically there is no reason to scan the
items when the group is inactive. The Update Rate in the Group Parameters dialog box specifies the
rate at which data notifications should be sent back to the client, assuming that data has changed. This is
also the rate at which items are scanned on behalf of this client.
To write a value to an item, select the item in the OPC Client windows and choose Write Value to
Item from the OPC menu, The client writes the value typed in the Write Item Value dialog box to the
correct item in the Group object. The method of writing data is determined by the synchronous check
box. When data is written synchronously, the call to the server blocks until the operation has completed,
which may take a long time. When data is written asynchronously, the call to the server returns quickly
and the operation is carried out on another thread. When the write has finished, the client devise
interface is notified with the results.
The user can disconnect from the selected server by choosing Disconnect from the OPC menu, The
Disconnect command unregisters the device interface, releases the Group object, and then releases the
Server object. Releasing an object means that the client is no longer interested in the object, so the
system can delete the object in the server.
Configuring the OPC Client
The OPC Client is used as a test case to debug an OPC Compliant Server and access some of the OPC
variables and parameter configuration.
1. Start the OPC Client.
C-20
Figure C-18: Starting the OPC Client
2. Select Advantech OPC Items Monitor on the bottom left of the OPC Browser and right-click the
mouse. You can add and connect the OPC Server to this browser.
Figure C-19: Adding an OPC Server
3. Select Advantech ADAM OPC Server and click OK. This connects the OPC Client to the ADAM
OPC server.
ADAM OPC Server
C-21
Figure C-20: Connecting the OPC Client to the ADAM OPC Server
4. Select Advantech ADAM OPC server and right-click the mouse. You can add Group for the connected OPC Server to the OPC Client. The Add Group dialog box appears, as shown below:
Figure C-21: Adding a Group for the OPC Server Connected to the OPC Client
5. After adding the group, you can add items for each OPC group. Select the dedicated OPC group and
right-click the mouse. You can add an Item for the connected OPC Server to the OPC Client. The
C-22
Add Item dialog box appears, as shown below:
Figure C-22: Add Item Dialog Box
6. The Add Item dialog box displays the devices, groups, and tags defined in the current server
configuration. You can select an item name of connected OPC server and OPC client’s Item ID will
be generated automatically.
ADAM OPC Server
C-23
Figure C-23: Add Item Configuration Dialog Window
In the Browse Items list, select the device, group, and tag. The full name appears in the Item Name field.
For example, “ADAM5017.ADAM5017a”. To add more tags, just repeat the previous steps.
Accessing the OPC Server
After connecting the OPC server and configuring the linkage, OPC server data will be displayed in the
Item window (at the right side of OPC client window) immediately. The OPC server data value is
automatically updated in the OPC Client Item window. Beside that, you can also read or write data
values to the OPC server manually.
The steps to read or write data value to OPC server manually are:
1. Select the specific OPC item.
2. Right-click the mouse to invoke the OPC item’s function menu.
3. Select the Read/Write menu option.
C-24
Figure C-24: Selecting the Read/Write Menu Item
4. Click the Read button in the Read/Write Item Value Dialog window and you will get the current
value of the specific OPC item in the next field.
Figure C-25: Read/Write Item Value Dialog Box
5. If you want to write data values to a specific OPC item, key in the output value in the blank field
near the Write button and click the Write button. This output value will be sent to the OPC server
directly.
ADAM OPC Server
C-25
Figure C-26: Read/Write Item Value Dialog Box
6. If you want to exit the Read/Write operation, click the Done button and you will return to the OPC
client window.
Summary
The Advantech ADAM OPC Server is a driver for both the OPC Client test function and a real working
ADAM-4000, ADAM-5000/485 data acquisition and control module OPC Server. This OPC Server
driver supports ADAM-4000 and ADAM-5000/485 series data acquisition modules which are connected to a user's computer via a cable and wires.
The ADAM OPC Server tool is your main configuration utility for setting up and maintaining the
ADAM I/O driver. It provides fields for specifying the properties of devices, groups and tags.
C-26
D
Serial ModBUS
OPC Server
Introduction
The Advantech Modbus RTU OPC Server was implemented using advanced programming concepts of
the most current version of the OPC specification (Version 2.0) for use in developing next generation
industrial software applications.
The Advantech Modbus RTU OPC Server shows how to easily communicate with OPC clients and
control devices. This Modbus RTU OPC server contains a popular Modbus protocol and can be
connected to real world Modbus compatible I/O hardware.
Key Features of the MODBUS RTU OPC Server
•
Advanced OPC data quality and data conversion to the client’s request
•
OPC server utilizes advanced free-threading capability of the Modbus server
•
Supports multiple multidrop I/O devices
•
Support several device types (384, 484, 584, 884, 984, Micro84, Modbus and Modcell devices)
•
Uses the concept of “groups” for easy configuration and manageability
•
Supports RTU and ASCII device protocols
•
Support all popular PLC data types, such as WORD, LONG, FLOAT, INT
•
Internally simulated for configuration and testing
•
Tag multiplier lets you create hundreds of tags in seconds
•
OPC sample client for rapid testing of your OPC data connections
•
GUI interface for viewing devices, tags, groups, and realtime signals
•
Full online help and documentation
•
Online configuration of devices, groups and tags
•
Flexible raw and engineering units and signal scaling
System Configuration and Installation
System Requirements for Windows 95/NT
•
IBM PC compatible with Intel Pentium processor at 133 MHz or faster
•
32 MB RAM memory
•
10 MB disk space
•
Microsoft Windows 95 with DCOM or Microsoft Windows 98 or NT4.0.
Hardware Support
This OPC Server driver supports Modbus compatible I/O hardware. A cable and wires must be present
to connect the user’s computer to Modbus compatible I/O hardware.
D-2
Installing MODBUS RTU OPC Server on Windows 95/NT
GeniDAQ version 4.1 or higher includes the OPC server. It is installed and registered on the system
when GeniDAQ is installed. You can skip the installation and registration steps below.
1. Insert the Advantech Modbus RTU OPC Server disk #1 into a 3.5-inch disk drive.
2. Select Run from the Windows Start menu and type the following in the Run dialog box (replacing
“A” with the actual letter of the 3.5-inch disk drive):
A:\Setup
3. Follow the instructions of the setup program. The setup program will ask you to select a folder
where most of the files will be copied.
4. When the installation program finishes, click the OK button to view the readme file and launch the
OPC client application.
Note:
As explained in the installation section of this manual, Windows NT 4.0 or Windows
95 with DCOM is required to run the Modbus RTU OPC server.
Note:
Internet Explorer 4.0 installs DCOM automatically. However, if using Internet
Explorer 3.0, DCOM is not provided and can be downloaded from Microsoft’s web
site at www.microsoft.com.
Registering the OPC Server
If the MODBUS RTU OPC Server is not registered in the Windows environment, you have to register it
manually. The steps to register MODBUS RTU OPC Server are listed as below:
1. Invoke the DOS prompt window.
2. Type in “MODBOPC/regserver” command in DOS prompt mode and execute it.
MODBUS RTU OPC Server will be registered to Windows. If you want to unregister the MODBUS
RTU OPC Server, type in the “MODBOPC/unregserver” command in a DOS prompt window.
Note:
As explained in the installation section of this manual, Windows NT 4.0 or Windows
95 with DCOM is required to run the MODBUS RTU OPC server.
Install MODBUS RTU OPC Server in Windows CE
1. Insert the Advantech MODBUS RTU OPC disk #1 into the 3.5-inch disk drive.
2. Copy the MODBUS RTU OPC Server DLL file and TDB file (configuration file) to the application
software directory. (You are recommended to create a dedicated sub-directory in the application
software directory to store DLL and GDB files)
3. Use a text editor such as Notepad.exe to view the readme.txt file.
Note:
The file name for the MODBUS RTU OPC Server configuration file in the Windows
CE device must be “MODBOPC.TDB”.
Serial ModBUS OPC Server
D-3
Registering the OPC Server
If the MODBUS RTU OPC Server is not registered in the Window CE environment, you have to
register it manually. The steps to manually register the MODBUS RTU OPC Server are shown below:
1. Invoke a Command prompt window. (you can press Ctrl + Esc to invoke the command execution
dialog box).
2. Type “Regsvrce MODBOPC” command in command prompt mode and execute it.
MODBUS RTU OPC Server will be registered to the Windows CE system. If you want to unregister the
MODBUS RTU OPC Server, type the “Regsvrce MODBOPC /u” command in the command prompt
window.
Quick Start
You can retrieve channel data from any MODBUS RTU module listed above by using the following
four-step configuration:
•
Step 1: Set COM port parameters
•
Step 2: Add a new device
•
Step 3: Add a new group
•
Step 4: Add a new tag
Suppose you want to retrieve the analog input from the MODBUS RTU 4011 that has address 5, and
you use COM1 to connect your computer to the device. Do the following:
Step 1: Add a New Device
Advantech ModBUS RTU OPC Server connects the control device through the COM port. You have to
define correct parameters for the COM port connected to the control device. Select Edit | Ports from
the main menu and the following dialog box is displayed. Configure the parameters as follows:
Figure D-1: Port Properties Configuration Dialog Box
D-4
Step 2: Add New Device
To add a new device, choose Add | New Device from the main menu or push the corresponding button
on the toolbar:
Figure D-2: Select Add | New Device From the Main Menu
Figure D-3: Click the New Device Icon on the Toolbar
The Device Properties dialog box appears:
Figure D-4: Device Properties Configuration Dialog Box
Type in the name of the new device, for example ‘MODBUS4011’. Select the represented device
module from the Device Type combo box and choose ‘MODBUS’. Specify the COM port of the PC
node of the newly-added connected device, for example, ‘COM2’, and set the device address to this
COM port. After doing this, click OK.
Serial ModBUS OPC Server
D-5
Step 3: Add a New Group
After adding the new device (MODBUS RTU4011), you should add a new Group for the device . The
Group is used as a container of I/O tags. To add a new Group, select Add | New Group from the main
menu or click the New Group icon on the toolbar. When the Group dialog appears, key in the group
name (for example, “Analog Input”) and click the OK button.
Figure D-5: Group Dialog Box Configuration Window
Step 4: Add a New Tag
Select the added group on the left side of the dialog window and click the right button of the mouse.
Click New Tag from the pop-up context menu to add a new tag. The Tag Properties dialog will be
displayed as shown below:
Figure D-6: Tag Properties Configuration Dialog Box
Input the tag Name and Description for the added tag. Select the specified tag type from the Location
combo box. For example, choose the Input Register type and set the location to be 1 for the added AI1
tag. The offset address of the tag will be generated automatically. We do not suggest that you change
the offset address. After that, specify the data type of this tag, for example WORD, for the analog input
data.
After completing the settings of the Device, Group and Tag of the new device, select View | Monitor
from the main menu of the MODBUS RTU OPC Server. The real-time value of the analog input
channel of MODBUS4011 is displayed in the tag view (on the right side of the OPC Server dialog
window) dynamically.
D-6
Figure D-7: OPC Server Dialog Window
OPC Server Configuration
OPC Server Tool
The MODBUS RTU OPC Server tool is your main configuration utility for setting up and maintaining
the MODBUS RTU I/O driver. It provides fields for specifying the properties of devices, groups and
tags.
Features
The OPC Server is extremely flexible, and can be utilized and used with DCOM for intranet and
internet applications.
Key Features of the MODBUS RTU OPC Server
•
Advanced OPC data Quality and data conversion to client request
•
OPC server utilizes advanced free-threading capabilities.
•
Supports Multiple Groups for easy configuration and manageability
•
Read/Write functionality
•
Tag Multiplier let you create hundreds of tags in seconds
•
GUI interface for viewing tags, groups, and real time Signals
•
Full online help
•
Change Device, Group and Tag properties online
•
Flexible engineering units and signal ranges
Serial ModBUS OPC Server
D-7
Access Methods
From the Windows Start menu:
1. Select Programs from the Windows Start menu.
2. Select Advantech MODBUS RTU OPC Server from the Programs group.
3. Select the OPCMODBUS RTU program file from the Programs submenu.
Using the Tool’s Browser
The Tree Browser displays a hierarchical list of the I/O driver and its devices, groups and tags. The I/O
driver appears at the top of the tree.
Figure D-8: Tool Tree Browser Window
When you select an item in the Tree Browser, its properties display in the Properties Viewer. You can
choose to view the item’s configuration or statistics properties by clicking buttons on the Run-time
toolbar.
Changing Items in the Tree Browser
When you add or modify devices, groups or tags in the OPC Server Tool, changes are made immediately to the I/O Server. Changes you make to the driver configuration while working with the OPC Server
Tool automatically display in the Tree Browser.
Refreshing the Tree Browser
To view changes made from another client application (such as another OPC Server Tool accessing the
server or a custom client application accessing the server), you must refresh the Tree Browser display
by selecting an item in the Tree Browser.
Collapsing and Expanding the Tree Browser
You can collapse or expand the tree under an item by double-clicking it.
Navigating the Tree Browser
Navigating through the Tree Browser can be done by selecting items with a mouse or by using the
keyboard. Use the up or left arrow keys to move up in the Tree Browser. Similarly, use the down or
right arrow keys to move down in the Tree Browser. You can also press a letter key to jump to the
nearest item that begins with that letter.
D-8
Additional Tree Browser Features
Connection lines show the relationship between devices, groups and tags by displaying which devices
are on a channel and which tags belong to a device. The plus and minus buttons indicate whether items
are fully expanded or collapsed. The plus button shows that the item is collapsed and the minus buttons
indicate that the item is expanded. For example, a device with a plus sign next to it means that there are
groups and possibly tags configured on that device.
The Menu Bar
The Tool menu bar includes a title bar, a Minimize button, a Maximize button, a Control-menu box
and the menus you can use to configure the driver. The menu bar is initially displayed at the top of the
screen but you can resize it and drag it to another location.
The Tool has the following menus:
•
File
•
Add
•
Edit
•
View
•
Help
You can customize the Tool’s appearance by dragging the toolbars or the Tree Browser to the location
you want. You can also make the toolbars or the Tree Browser float above the Tool by dragging them
to the center or the screen. Later, you can dock them or resize them, as needed.
Using Shortcut Keys
The following is a list of shortcut keys for working with the I/O Driver Tool:
•
<Ctrl>-<N>: Opens a new I/O driver configuration file.
•
<Ctrl>-<O>: Allows you to open an existing file.
•
<Ctrl>-<S>: Saves the current file.
•
<Ctrl>-<D>: Add a new device
•
<Ctrl>-<G>: Add a new group
•
<Ctrl>-<T>: Add a new tag
•
<Ctrl>-<M>: Add multiple new tags
•
<Ctrl>-<X>: Cut
•
<Ctrl>-<C>: Copy
•
<Ctrl>-<V>: Paste
•
Del: Delete
•
<Ctrl>-<P>: Properties
Using the File Menu
The following commands appear on the File menu.
Serial ModBUS OPC Server
D-9
Figure D-9: File Menu Items
New
Lets you create a new server configuration file. Keyboard shortcut: <Ctrl>-<N>.
Open
Lets you open an existing server configuration file. You can select TDB file types. Keyboard shortcut:
<Ctrl>-<O>.
Save
Saves the current server configuration file to the default path for configuration files with the name you
specify. The default path for configuration files is the same path where you installed the server. You
can change the default path by entering a new location in the Default Path tab of the Tool’s Setting
Defaults for I/O Driver Configuration File Name and Path.
If you save a new server configuration file, the Save As dialog box prompts you to enter a name for
your server configuration file. Keyboard shortcut: <Ctrl>-<S>.
Save As
Lets you enter a new name and file type for the current server configuration.
Save As Dialog Box Options
•
Save In Field: Lets you select the directory where you want to store the file.
•
File Name Field: Lets you save a file with a new name, or in a different location, by entering a new
file name in the File Name field or by selecting a new directory in the Save In list. To save a file
with an existing file name, select the name in the list or enter the current name.
•
Save as Type Field: Lets you specify the type of file you want to save the configuration as:
Import CSV...
Lets you import a CSV type file to be the current server configuration.
Reimport CSV...
Lets you re-import CSV type file to update the current server configuration.
D-10
Export CSV...
Lets you export current server configuration to the CSV type file.
Reexport CSV...
Lets you re-export the current server configuration to update the CSV type file.
Exit
Exits the OPC Server Tool.
Using the Add Menu
The commands that appear in the Add menu are for creating and modifying server configuration files.
These commands correspond with the buttons on the Tool’s Configuration toolbar.
Figure D-10: The Add Menu
New Device...
Let’s you add a new device configuration.
New Group...
Let’s you add a new group configuration to group-related tags in one device.
New Tag...
Let’s you add a new tag configuration in one device.
Multiply...
The tag Multiplier provides an easy and fast method for creating many tags without having to individually enter all of them.
Using the Edit Menu
The commands that appear in the Edit menu are for cutting, copying, pasting, deleting and modifying
configuration data. You also can configure the COM port in this menu.
Serial ModBUS OPC Server
D-11
Figure D-11: The Edit Menu
Cut
Let’s you cut the selected tag.
Copy
Let’s you copy the selected tag.
Paste
Let’s you paste cut tags to the device.
Delete
Let’s you delete the selected tag.
Ports...
Let’s you define the configuration of the selected COM port.
Properties...
Let’s you define the configuration of selected devices, groups and tags.
Using the Help Menu
The commands that appear in the Help menu are for displaying the MODBUS RTU OPC Server online
help and version number.
Figure D-12: The Help Menu
D-12
About MODBUS RTU...
Displays related information of MODBUS RTU modules.
Help Contents
Displays online help information of MODBUS RTU OPC Server.
Configuring the I/O Driver with the Tool
To configure the MODBUS RTU OPC Server with the tool:
1. Click the New button in the File menu to create a new configuration file.
2. Click the New Device button in the Add menu to add a new device to the Tree Browser.
3. Click the New Group button in the Add menu to add a new group for selected device.
4. Click the New Tag button in the Add menu to add a new tag for selected group.
5. Modify the fields in the Properties Viewer as needed.
To modify the fields in the Properties Viewer:
1. Select a device, group or tag from the Tree Browser and click the Properties button in the Edit
menu. The fields for the selected item appear in the Properties Viewer.
2. Edit the fields you want to change.
Adding and Modifying Devices
To add a new device to your server configuration:
1. Click the Add Device button on the Add menu of the Configuration toolbar. The new device
appears in the Tree Browser and the fields for entering device properties appear in the Device
Properties dialog.
2. Enter the properties for the new device. Edits to a field do not take effect until you remove the focus
(or cursor) from the field and click the OK button.
To modify an existing device:
1. Select the device you want to modify from the Tree Browser.
2. Select the specified device and click on the Properties button in the Edit menu bar. The Device
Properties dialog will be displayed for device modification.
3. Edit the device’s fields as needed.
Serial ModBUS OPC Server
D-13
Figure D-13: Device Properties Configuration Window
Device Name
Specifies the name of the added or modified device.
•
Valid Entries: Up to 12 alphanumeric characters
Device Type
Specifies the hardware type of the selected device. This property is used to indicate which kind of
device used. For this ModBUS RTU OPC Server, the default value is “ModBus”.
COMM Port
Specifies which physical COM port to use for the selected channel. You can specify as many channels
as necessary for communication with your hardware.
•
Valid Entries: COM1 to COM2 (if available) computer ports
•
COM3 to COM8: Expansion Ports
•
Any valid COM port name: Expansion Ports
IMPORTANT
Verify that the COM port you select is not used by another channel or
application. Assigning two channels to the same port results in a communication
failure on one of the channels. Assigning a channel to a COM port used by another
application (such as an alarm printer) can produce problems with driver communication.
Timeout
Specifies how long the I/O driver waits for a response from the selected device. The base of the timeout
field is mini second. For example, if you specify 1000 in this field, the server will wait for a response
about 1000 milliseconds (equal to 1 second).
•
D-14
Valid Entries: 1 ~ 65535
Address
Specifies the address number of the selected device in RS-485 communication line.
•
Valid Entries: 0 to 255, and NONE
Simulation I/O
Specifies the device to be a virtual device. It does not connect to any physical devices. But it would
provide a simulation signal to the server.
•
Valid Entries: Enabled and Disabled
To delete an existing device
1. Select the device you want to delete from the Tree Browser.
2. Click on the Delete button in the Edit menu bar.
Adding and Modifying Tag Groups
To add a new group into the selected device:
1. Select the device to which you want to add a tag group from the Tree Browser.
2. Click the New Group button on the Add menu of the Configuration toolbar. The new group
appears in the Tree Browser and the fields for entering group properties appear in the Group
Properties dialog.
3. Enter the group name for the new tag group. Edits to a field do not take effect until you remove the
focus (or cursor) from the field and press the OK button.
Figure D-14: Group Configuration Dialog Box
To modify an existing group:
1. Select the group you want to modify from the Tree Browser.
2. Select the Properties button from the Edit menu bar. The Group properties dialog will pop up for
modification.
To delete an existing group:
1. Select the group you want to delete from the Tree Browser.
2. Click on the Delete button in the Edit menu bar.
Serial ModBUS OPC Server
D-15
Adding and Modifying Tags
To add a new tag to the selected device:
1. Select the group and device to which you want to add a tag from the Tree Browser.
2. Click the New Tag button on the Add menu of the Configuration toolbar. The new tag appears in
the workspace at the left of the window. The fields for entering tag properties appear in the Tag
Properties dialog.
3. Enter the tag name for the new tag. Edits to a field do not take effect until you remove the focus (or
cursor) from the field and press OK button.
Figure D-15: Tag Properties Configuration Dialog Box
To modify an existing tag:
1. Select the tag you want to modify from the Tree Browser.
2. Click on the Properties button in the Edit menu bar. The Tag Properties dialog will be displayed
for tag modification.
3. Edit the tag’s fields as needed.
Tag Name
Specifies the name of the added or modified I/O tag.
•
Valid Entries: Up to 12 alphanumeric characters
Tag Description
Contains text about the selected tag. Entries in this field can be very helpful when you look for the
connection of I/O tag and physical I/O points. The more detailed and specific the information you enter
in this field, the easier it will be to identify the I/O at a later date.
•
D-16
Valid Entries: Up to 40 alphanumeric characters and symbols.
Location
This property indicates the register address that the tag represents. The location is comprised of two
parts. One is the offset address and the other one is the base address. The first part of the Location field
is the offset value. You can input the decimal value for it, for example 1. The second part of the
Location field is the type of I/O tag. Each type of I/O tag is featured with different base address for the
register. The base address for each I/O tag is listed as below:
Type of I/O Tags
Base Address
Input Coil
000000
Output Coil
010000
Input Register
030000
Output Register
040000
Figure D-16: Type of I/O Tags and Base Address
For example, if you define the I/O tag to be “Output Coil” and its location is 6, the location address of
this I/O tag would be 010006. (You can find this location address at Tag Browser area).
Data Type
Specifies the tag’s default data type. The driver uses this data type for the tag if you do not specify a
database block hardware option.
Valid Entries
Data Type
INT
LONG
FLOAT
STRING
BIT
WORD
Description
Signed 16-bit integer.
Signed 32-bit integer.
32-bit float point (IEEE)
ASCII character set.
An individual bit from a register
Unsigned 32-bit integer.
Figure D-17: Data Types and Their Description
Scaling & Simulation
This group is used for I/O simulation. It will generate I/O signals automatically without connecting
hardware. If you define the device to be a simulation I/O, the tag belonging to the device that would be
defined as a simulation signal.
•
Enabled: The range of input values from the simulation signal would be re-scaled to be the setting
range. The Setting button will be active while this field is enabled. Click on the Setting button and a
Tag Process Setting dialog will be displayed for input scaling values. You can select the conversion
type to be Linear or Square Root.
Serial ModBUS OPC Server
D-17
Figure D-18: Tag Process Settings
•
Simulation Type: There are three simulation signals offered. These simulation signals are Sine,
Ramp, and Random.
Configuring the I/O Driver for Window CE
MODBUS RTU OPC Server Windows CE version is an in-process server. If you use MODBUS RTU
OPC server Windows CE version, you should first create and configure this server in the Windows NT
environment. After configuration, download MODBUS RTU OPC Server Window CE DLL file and the
configuration file (TDB file) to the Windows CE target platform.
Note:
The file name for MODBUS RTU OPC Server configuration file at Windows CE
device must be “MODBOPC.TDB”.
Using OPC Client
An OPC Client application, provided with the MODBUS RTU OPC Server, has multiple methods for
quickly connecting to your servers. The OPC Client is able to browse the registry of a PC and display a
complete list of all installed OPC Servers. It also provides real-time live data feedback and OPC Server
browsing capabilities.
The OPC Client is also helpful for connecting and testing other 3rd party OPC applications connected
to same server.
D-18
Figure D-19: OPC Client Browser Window
Features
•
Setup dialog box for defining the default name and default setting for configuration files.
•
Tree Browser for an overall view of your system setup.
•
Moveable Tree Browser and toolbars.
Connecting OPC Server
When OPC servers are installed on the system, they are registered so that clients can find them and
users can view them in a list. To make a client/server connection, the user must first choose a server.
The server name selected (for example, Advantech.Modbus) is used to get a class ID which, in turn, is
used to create a COM object. If the user selects a server that is not currently running, the system starts
the server and then creates the object in that server on behalf of the client.
Once the COM object is created, the client application has an IOPCServer interface, as defined in the
OPC specification. This is the main interface to the OPC server and this document refers to this as a
Server interface. The other interface is Group. This OPC client always creates a group and registers an
device interface with it to get asynchronous data notification.
When an item is added, the dialog displays either a hierarchy or a flat list of names, depending on the
server. The names are queried from the Server object using the filter string and requested data type.
When the user either types or selects a name, an item by that name is added to the Group object. This
item is also read immediately to get an initial value.
Items in a group are scanned by the server; when their values change, the device interface in the client
is notified. A data structure containing the data for each item whose value or quality has changed (and
only those items) is passed to the client deviee interface. The client unpacks and uses the data.
Serial ModBUS OPC Server
D-19
Server Status and Group Parameters
The Server Status dialog periodically queries the Server object for the status and displays the results.
The Group Parameters dialog box queries the group state and displays the results. The OK or Apply
buttons in the Group Parameters dialog box write the parameters from the dialog to the Group object
and read the parameters back. This primarily controls the scanning and updating of data. When a group
is inactive, it does not send data notifications to the client and typically there is no reason to scan the
items when the group is inactive. The Update Rate in the Group Parameters dialog box specifies the
rate at which data notifications should be sent back to the client, assuming that data has changed. This is
also the rate at which items are scanned on behalf of this client.
To write a value to an item, select the item in the OPC Client windows and choose Write Value to
Item from the OPC menu. The client writes the value typed in the Write Item Value dialog box to the
correct item in the Group object. The method of writing data is determined by the synchronous checkbox. When data is written synchronously, the call to the server is blocked until the operation has
completed, which may take a long time. When data is written asynchronously, the call to the server
returns quickly and the operation is carried out on another thread. When writing has finished, the client
device interface is notified of the results.
The user can disconnect from the selected server by choosing Disconnect from the OPC menu, The
Disconnect command unregisters the device interface, releases the Group object, and then releases the
Server object. Releasing an object means that the client is no longer interested in the object, so the
system can delete the object in the server.
Configuring the OPC Client
The OPC Client is used as a test case to debug an OPC Compliant Server and access some of the OPC
variables and parameter configuration.
1. Start the OPC Client by clicking its shortcut icon.
Figure D-20: Advantech OPC Client Icon
2. Select the Advantech OPC Items Monitor on the bottom-left of the OPC Browser and right-click the
mouse. You can add and connect the OPC Server to this browser.
D-20
Figure D-21: OPC Server Browser Window
3. Select Advantech MODBUS RTU OPC and click OK. This connects the OPC Client to the MODBUS RTU OPC server.
Figure D-22: Add Server Dialog Box
4. Select Advantech ModBUS RTU OPC server and right-click the mouse. You can add a Group for
the connected OPC Server to the OPC Client. The Add Group dialog box appears, as shown below:
Serial ModBUS OPC Server
D-21
Figure D-23: Adding a Group in the Advantech OPC Browser Window
5. After adding a group, you can add items for each OPC group. Select a dedicated OPC group and
right-click the mouse. You can add an Item for the connected OPC Server to the OPC Client. The
Add Item dialog box appears, as shown below:
Figure D-24: Adding an Item in the Advantech OPC Browser Window
6. The Add Item dialog box displays the devices, groups, and tags defined in the current server
configuration. You can select an item name of the connected OPC server and the OPC client’s Item
ID will be generated automatically.
D-22
Figure D-25: Add Item Dialog Box
In the Browse Items list, select the device, group, and tag. The full name appears in the Item Name field.
For example, “Modbus.DWORD.Tag1”.
To add more tags, just repeat previous steps.
Accessing the OPC Server
After connecting the OPC server and configuring the linkage, OPC server data will be displayed in the
Item window (on the right side of the OPC client window) immediately. The OPC server data value is
automatically updated at OPC client Item window. Beside that, you also can read or write data value to
OPC server manually.
The steps to read or write data values manually to an OPC server are:
1. Select the specific OPC item.
2. Click the right button of the mouse to invoke OPC item’s function menu.
3. Select Read/Write menu option.
Serial ModBUS OPC Server
D-23
Figure D-26: Selecting Read/Write from the OPC Browser Window
4. Click the Read button within the Read/Write Item Value Dialog window. You will get the current
value of the specific OPC item in the next field.
Figure D-27: Read/Write Item Value Dialog Window
5. If you want to write data values to a specific OPC item, key in the output value in the blank field
near the Write button and press the Write button. This output value will be output to the OPC
server directly.
Figure D-28: Read/Write Item Value Dialog Window
6. If you want to exit the “Read/Write” operation, press the Done button and you will be returned back
to OPC Client window.
D-24
Summary
The Advantech Modbus RTU OPC Server facilitates communication with OPC clients and control
devices. It supports a popular Modbus protocol and can be connected to real world Modbus compatible
I/O hardware.
The MODBUS RTU OPC Server tool is your main configuration utility for setting up and maintaining
the MODBUS RTU I/O driver. It provides fields for specifying the properties of devices, groups and
tags.
An OPC Client application, provided with the MODBUS RTU OPC Server, has multiple methods for
quickly connecting to your servers. The OPC Client is able to browse the registry of a PC and display a
complete list of all installed OPC Servers. It also provides real-time live data feedback and OPC Server
browsing capabilities. There is a Setup dialog box for defining the default name and default setting for
configuration files, a Tree Browser for an overall view of your system setup and a Moveable Tree
Browser and toolbars.
Serial ModBUS OPC Server
D-25
D-26