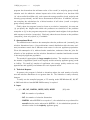
1
CAIQS program v. 1
6.000
6
28/02/03
2.000
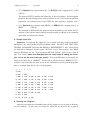
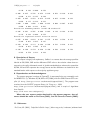
Effect sizes (i.e., standardized difference between the
minority and the majority group) of the predictors
-1.000 -0.090 -0.090 -0.200
Effect sizes (i.e., standardized difference between the
minority and the majority group) of the criteria
-0.450
0.000
Correlation matrix of the predictors (first 4 rows and columns)
and the criteria (final 2 rows and columns)
Row
1
1.000
0.170
0.000
0.100
0.290
0.160
Row
2
0.170
1.000
0.120
0.160
0.300
0.260
Row
3
0.000
0.120
1.000
0.470
0.120
0.200
Row
4
0.100
0.160
0.470
1.000
0.240
0.250
Row
5
0.290
0.300
0.120
0.240
1.000
0.170
Row
6
0.160
0.260
0.200
0.250
0.170
1.000
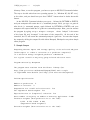
Correlation between weighted predictor and weighted
criterion combinations:
Squared correlation:
0.487
0.237
Effect size predictor composite -0.643
Effect size criterion composite -0.407
Minimum overall selection ratio without AI 4/5th rule is
0.846
with selection ratio majority and minority group equal
to
0.881
0.705 , respectively
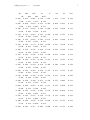
For each overall selection ratio (SR): the majority group SR (SRA)
the minority group SR (SRI), the adverse impact (AI), the overall
average quality of the selected individuals (with respect to
the majority group distribution: wrtmgd) (M), the average quality
of the majority group selected {wrtmgd) (MA) and the minority
group selected (again wrtmgd) (MI), and the
difference between
MA and MI.
On the second line: the globally standardized (gs) overall average
quality of the selected individuals (SM), the (gs) average quality of the
majority selected individuals (SMA), the (gs) average quality of the
minority selected (SMI) and the difference between SMA and SMI (SDIF)