1
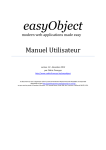
LIAM2 User Guide, Release 0.10.2
scatter plots
New in version 0.8.
scatter can be used to draw scatter plots. It uses matplotlib.pyplot.scatter and inherits all of its keyword arguments.
It should be used like this:
scatter(x_expr, y_expr, ...)
Where both x_expr and y_expr are (expressions returning) one-dimensional arrays (for example an entity field or
a groupby expression with only one dimension).
Optional keyword arguments include (among others, see above link):
• c: to set the color of each circle. A color will be assigned for each different value of this argument.
• s: to set the surface of each circle (mutually exclusive with the r argument).
• r: to set the radius of each circle (r=expr is equivalent to s=pi * expr ** 2). It is mutually exclusive with
the s argument. The r argument is specific to liam2.
Examples:
-
salary: 10000 + uniform() * 50000
area: 3.1415 * (4 + 1.5 * children.count()) ** 2
scatter(age, salary, c=eduach, s=area, alpha=0.5s, grid=True)
scatter(normal(), normal(), c=age, r=2 ** eduach)
70000
2
3
4
60000
50000
40000
30000
20000
10000
0
20
5.7. Output
0
20
40
60
80
100
53