1
4.
5.
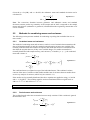
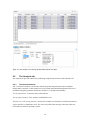
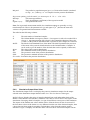
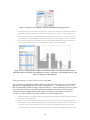
Press Run to start the simulation from the posterior distribution. After successful simulation,
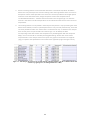
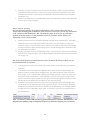
result statistics (derived from the median of the marginal posterior distributions of the mean
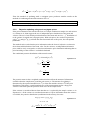
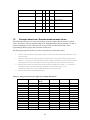
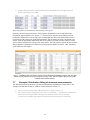
and variance) are shown in the Analysis view table (the result should look similar to the first
row of Figur 7-5).
Save the computed row to the Nine Bats data sheet. In the Result tab, select the Nine Bats data
sheet in the list and press Export.
Semi-Conjugate updating
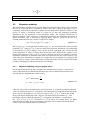
In semi-conjugate updating, the population distribution (derived from eight of the bats) is
interpreted as defining prior probabilities of the mean but is not used to provide any information
of the variation within Daubenton‟s Bat. The following steps describe how to perform the
updating using the statistics for the population of bats as prior data and the statistics for
Daubenton‟s bat as “observed data”.
1.
2.
3.
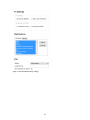
Follow the same steps as for Conjugate updating, but select Semi-conjugate prior. Select Noninformative prior as the value of the Variance estimation. This will consider the variance as
uncertain and use a non-informative prior to estimate it its posterior distribution. Estimating it
as a point estimate is highly unreliable since there is only two data points for Daubenton’s Bat.
Run the posterior simulation.
Save the computed row to the Nine Bats data sheet. In the Result tab, select the Nine Bats data
sheet in the list and press Export. The resulting computed row should look similar to the second
row in Figur 7-5).
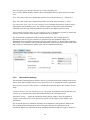
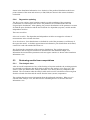
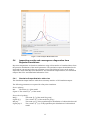
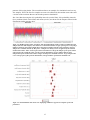
The observed and posterior predicted statistics can be plotted in the Analysis Chart view (as
normal distributions on log scale).
1.
2.
3.
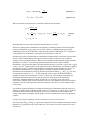
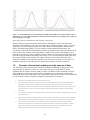
In the Analysis Chart view control panel, select “Data used in computed rows” and “Selected
rows only”.
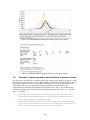
In the Analysis table showing the Nine Bat data sheet, select the row corresponding to the
posterior from the updating of the conjugate prior. The result should look similar to the left
chart of Figur 7-6. It is seen that the conjugate prior updating results in a posterior that is very
close to the combined distribution of the eight bats. This is because only the number of data
points is used to distinguish between the prior (the combined eight species based on 117 data
points) and the data (Daubenton’s bat based on only two data points).
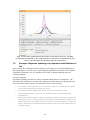
Select the row corresponding to the posterior from the updating of the semi-conjugate prior.
The resulting chart should look similar to the right chart of Figur 7-6. The posterior predicted
distribution of Daubeton’s bat is closer to the data for the Daubenton’s bat although updated
to adapt to the prior information of the mean. The posterior variance is increased to account
for updated mean.
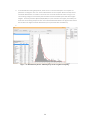
Figur 7-5. Posterior predicted GM and GSD of population distribution combined with Daubenton’s bat
using Bayesian updating using a Conjugate prior (first row) and Semi-conjugate prior (second row).
51