1
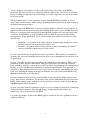
User guide to the
spreadsheet version of the
Regional Ecosystem Model
for biodiversity
in the Tasmanian Midlands,
version 1.0
R.I. Knight
2010
A report of the Caring for Our
Country project ‘Using landscape
ecology to prioritise property
management actions in Tasmania’
Suggested citation:
Knight, R.I. (2010). User guide to the spreadsheet version of the Regional
Ecosystem Model for biodiversity in the Tasmanian midlands, version 1.0.
A report of the Caring for Our Country Project ‘Using landscape ecology to
prioritise property management actions in Tasmania. Natural Resource
Planning, Hobart, Tasmania.
Published by:
Natural Resource Planning Pty Ltd
ACN: 130 109 250
PO Box 4530 Bathurst Street
Hobart, TASMANIA, 7000.
Australia.
www.naturalresourceplanning.com.au
© Natural Resource Planning Pty Ltd 2010
This work is protected under Australian copyright law.
The report may be freely circulated and reproduced without modification,
provided the authors are acknowledged.
Commercial use of the contents of this report and the intellectual property
herein is defined in the contract between Natural Resource Planning and the
Australian Government, and may be granted by either party.
Natural Resource Planning is an ethically based company specialising in the
science and practice of natural resource management. NRP encourages
understanding, uptake and use of its products. Potential users should
contact the company for further information.
CONTENTS
i How to use this document
iv Acknowledgements
1 1.
Introduction
5 2.
5 2.1
6 2.2
Key design and layout features
Spreadsheet contents
Data entry and shared features
8
8
9
9
10
11
11
12
13
13
14
15
15
17
17
3.
3.1
3.2
3.3
Main data entry and reporting worksheets
Biodiversity Management Priority
Biological Significance Index
Native Vegetation Significance
Priority Species - Threatened and Other Significant Species
Priority Species - Hollow Dwelling Species
Priority Species - Full Priority Species Index
Biological Significance Index
Landscape Function Index
Clearing Bias
Connectivity
Remnant Vegetation
Riparian Vegetation
Biophysical Naturalness
Landscape Function Index
19 4.
Using the lookup worksheets
21 5.
21 5.1
22
22
22
23
23 5.2
23
24
25
Testing management scenarios and REM specifications
Testing management scenarios
Scenario 1 - Fence remnant
Scenario 2 - Scenario 1 plus consolidate nearby patch
Scenario 3 - Scenario 2 plus increase riparian vegetation
Level of Concern - Potential
Testing and modifying REM specifications
Example 1 - Changes to a prioritisation matrix
Example 2 - Changes to classes in an input
More complex changes
Figures
3 Figure 1.
4 Figure 2
5 Figure 3
Classification of NRM Assets Classes, Assets and Issues
Assets and Issues in the Biodiversity Asset Class
Input worksheets and lookup tables in the REM spreadsheet
i
How to use this document
This document is one of several stand-alone products (documents, data products and tools)
produced by Natural Resource Planning’s project ‘Using landscape ecology to prioritise
property management actions in Tasmania’. The project was funded under the Australian
Government’s Caring for Our Country Open Grants program.
The figure below shows the components of the project, with the main outputs from the project
highlighted in green.
Strategic Review
- List of Asset Classes &
Issues
- Issues relevant to
Management Plans
Regional
spatial data
- Available
- Not available
Regional
Ecosystem Model
Spatial layers of:
- Assets and Issues
- NRM priority &
significance
Management
planning standards
Map at
property
scale
Property report
- Review information
- Remap where
required
Property-specific
mapping & info.
- Paddocks, etc;
Property
Management
Plans
Issue-Property
matrix
- Landowner prioritised
management actions
State of Knowledge
database
- Analytical database for
REM
- Regional and
subcatchment reporting
- Property level
reporting and mapping
(input to management
planning)
Checklist of property NRM
issues & priorities
Decision support
- Property level decision classes
- Rating of issues on property
This document - a guide to the spreadsheet version of the Regional Ecosystem Model (REM)
- is designed to support application of the project’s Regional Ecosystem Model as a standalone application that can assist either property management or strategic planning. It has two
main uses:
1.
2.
To provide an easy assessment of any or all of the components of the REM in a
range of situations, including where existing mapping is not available or is wrong.
To allow scenarios to be tested to determine changes in priorities that result from
changes in management, particularly those elements that impact on landscape
ecological function.
ii
The REM is a heirarchically structured classification of the main factors affecting
Biodiversity in the Tasmanian Midlands, and is expressed through a series of spatial data
layers for use in a Geographic Information System. The specifications for the REM are
presented in a separate document1. TheREM specifications include information on spatial
data coverage and details of the matrices used to determine Level of Concern.
The REM derives its list of Issues, Assets and Asset Classes, and the relationships between
them, from the projects ‘Strategy Review’. The review provides a systematic classification of
Natural Resource Management (NRM) Assets and Issues within the project region, for use as
input to the REM, for practical elaboration in the User Tools component of the project, and to
form a reference list of Issues to be addressed in the demonstration Property Management
Plans. A separate report of the Review is available2.
The material in this document assumes some familiarity with the project through the
aforementioned two documents.
Use of the REM spreadsheet also requires a moderate degree of capability in the use of
Microsoft Excel spreadsheets.
1
Available for download from:
www.naturalresourceplanning.com.au
2
Knight, R.I. & Cullen, P.J. (2009). A review of strategies for planning and management of the natural
resources of biodiversity, freshwater, land and soils in the Tasmanian midlands. A report of the Caring for Our
Country project ‘Using landscape ecology to prioritise property management actions in Tasmania. Natural
Resource Planning, Hobart, Tasmania. www.naturalresourceplanning.com.au
iii
Acknowledgements
The members of the project Steering Committee are thanked for their input to the
development of the Regional Ecosystem Model, their insightful perspectives on the
complexities of natural resources science and management, and reviews of draft reports from
the project.
The Steering Committee comprised:
Dr Nan Bray – Landowner and farmer, former CSIRO Chief of Marine Science;
Dr Michael Brown – Ecological consultant, former Forestry Tasmania Head of
Research;
Dr Steven Cork – Director, EcoInsights, former CSIRO Sustainable Ecosystems
Principal Research Officer;
Nikki den Exter (to August 2009) and Jarrah Vercoe – NRM South;
Michael Foley – Partnerships Manager, Conservation Volunteers Australia (Tasmania);
George Rance – Director, National Strategic Services, former Tasmanian Farmers and
Graziers Association CEO; and
Rae Young – Landowner and farmer, former DPIWE Botanist.
The project was conducted with funding from the Australian Government’s Caring for Our
Country Open Grants Program. The authors and Natural Resource Planning gratefully
acknowledge the support of the Program. This is an important piece of work that was
unlikely to be have been undertaken without financial assistance.
The author also extends thanks to other members of the project team - Philip Cullen, Janine
Berechree and Craig Woodfield - for background research, input to various stages of
preparation, and tireless work on the GIS datasets that underpin the investigation and
assessment of natural resource processes in the project region.
iv
1.
Introduction
Natural Resource Planning (NRP) was funded under the Australian Government’s Caring for
Our Country Open Grants program for a project ‘Using landscape ecology to prioritise
property management actions in Tasmania’.
The project included five main outputs:
1. A Review of existing Commonwealth, State and other policies, strategies and plans
that are relevant to ecologically responsible farm management in the project region the Northern Midlands and South East bioregions of Tasmania. The Review
provides a systematic classification of NRM Assets Classes, Assets and Issues for the
project region. Its use is to enable farm management actions to be cross referenced
with the range of relevant strategies in a structured way that also reflects current
thinking on NRM science. Figure 1 shows the Issues which the Strategy Review
identified.
2. A Regional Ecosystem Model (REM) for the Northern Midlands and South East
bioregions3 that includes biodiversity4, land and soils, and freshwater ecosystems.
The REM comprises a series of spatial layers that collate and organise the outputs
from the Strategy Review (Activity 3.2). The REM also assesses potential
management priorities - expressed as Level of Concern - for individual Issues and as
integrated indices for groups of Issues, for each Asset and for the Asset Class as a
whole.
3. A ‘State of Knowledge’ database to generate property reports and to assist in
strategic (i.e. non property-specific) priority setting. (Activity 3.3).
4. A set of User Tools to help prioritise management actions to address biodiversity,
land soils and freshwater ecosystems, both for both specific properties and at broader
scales. (Activity 3.4)
5. Demonstration Property Management Plans addressing natural resource management
issues for 8 properties (~27,000ha) in the project region (Activity 4.2). These
demonstrate the methods used and the application and implications of the
consideration of landscape factors in the prioritisation of property management
actions to deliver NRM objectives. The management plans only address natural
resource management. Other aspects of property planning (e.g. financial planning,
succession planning, etc) are beyond the scope of the project
This document is a component of the fourth of these activities – Activity 3.4 User Tools.
3
Bioregion (or ecoregion): an ecologically and geographically defined area. Bioregions cover relatively large
areas of land or water, and contain characteristic, geographically distinct, assemblages of natural communities
and species. The biodiversity (see below) of the flora, fauna and ecosystems that characterize a bioregion tend to
be distinct from that of other bioregions.
4
Biodiversity: the number and relative abundance of lifeforms, the genes they contain and the ecosystems they
form.
1
A Uuser Guide to a spreadsheet version of the biodiversity Asset Class of the REM is
presented. The Assets and Issues considered under the biodversity Asset Class are shown in
Figure 2, which also illustrates the relationships and relative importance of each Issue within
its relevant group.
The spreadsheet allows a user to produce outputs from the REM for a number of sites or
areas, and to test the impacts which changes in management may have on the relative priority
for further management action.
A key concept in the REM that is reflected in the spreadsheet is that of Level of Concern. It
equates broadly with the idea of management priority in the narrow sense of NRM objectives.
However it recognises that actual property management priorities will vary with factors that
are outside of the REM (e.g. farm economics) and also with the perspective from which
management is being approached. Level of Concern has been defined in two way to reflect
these factors:
• Immediate – an estimate of the relative priority for immediate management action
to address current risk to the natural resource; and
• Potential – an estimate of the relative priority to protect and manage the natural
resource from risks which may arise in the future.
Section 2 describs the key design features of the spreadsheet. This includes its conceptual
structure and style and formatting characteristics that are used throughout to assist the user in
its application.
Section 3 describes the three main worksheets into which data can be entered. There is one
worksheet each for property information, biological significance and landscape function.
Each worksheet, however, reports the Level of Concern for overall Biodiversity Management
Priority as well as for Biological Significance and Landscape Function. The approach is
designed to allow the characteristics of one Asset Class to be altered while holding the other
fixed, thus allowing the impact of changes on both the Asset Class and overall Biodiversity
Management Priority to be understood.
Section 4 summarises the extensive set of worksheets that contain the lookup data for each
Issue. Each of these worksheets also provides more detailed information on each Issue in the
REM. Understanding of the worksheets can be assisted by reference to the Strategy Review
and REM Specifications documents.
Section 5 describes how the spreadsheet can be used to test changes in indicators of landscape
ecological function that may arise through changes in management that address the
biodiversity issues incorporated in the REM.
Use of the spreadsheet version of the REM requires a moderate level of capability in the use
of Microsoft Excel.
2
Figure 1. Classification of NRM Asset Classes, Assets and Issues from the Strategy Review
Note: Not all Issues identified in the Strategy Review are included in the REM. See the REM specifications for details.
3
Figure 2. Assets and Issues in the Biodiversity Asset Class
Biodiversity Management Priority
(Immediate & Potential)
Biological Significance Index
(Importance = 1)
Priority Species Significance
(Importance = 1)
Landscape Function Index
(Importance = 1)
Vegetation Conservation Status
(Importance = 1)
Clearing bias
(Importance = 1)
Threatened species
(Importance = 1)
Threatened communities
(Importance = 1)
Connectivity#
(Importance = 2)
Other priority species
(Importance = 2)
Relative reservation
(Importance = 2)
Remnant vegetation#
(Importance = 2)
Hollow dwelling habitat
(Importance = 2)
Relative rarity
(Importance = 3)
Riparian vegetation#
(Importance = 2)
Old growth Forest
(Importance = 1)
Vegetation condition
(Importance = 3)
Eucalypt forest structure
(Importance = 2)
Other vegetation
(Importance = 3)
4
# Issues derived as a sub-matrix for input to the
full matrix for Landscape Function.
Importance is a guide to the weighting given to an
Issue in the associated integration matrices.
2.
Key design and layout features
2.1
Spreadsheet contents
The REM spreadsheet contains design and layout features designed to
ensure consistency in its use and to return appropriate data matched to
the input classes. The spreadsheet contains a series of worksheets that
reflect the structure of the REM as shown in Figure 3 below.
All other worksheets contain lookup data needed to generate the indices
used in the REM, which are described in more detail in the
specifications report. The lookup tables provide more detailed
information on some of the indicators, and also allow the REM matrices
to be viewed and modified.
Data entry to the spreadsheet is contained within the three worksheets
highlighted in bold. These worksheets access data in the lookup tables
and return the combined indicators incorporated in the REM.
Figure 3. Input worksheets and lookup tables in the REM spreadsheet
Biodiversity
Management Priority
Biodiversity Management
Priority lookup
Biological Significance
Index
Landscape Function
Index
Biological Significance
lookup
Landscape Function
lookup
Priority Species
Index
Native Vegetation
Index
Threatened & Other
Significant species lookup
Clearing Bias lookup
Connectivity lookup
Native Vegetation
lookup
Species data lookup (info
table only)
Hollow Dwelling
species lookup
5
Remnant Vegetation
lookup
Riparian Vegetation
lookup
Biophysical
Naturalness lookup
2.2
Data entry and shared features
Data entry to the spreadsheet is restricted to three of the worksheets:
Each of these three main worksheets also shows data from the other
main REM elements.
• Biodiversity Management Priority ;
• Biological Significance; and
• Landscape Function.
The Biodiversity Managment Priority worksheet provides an overall
summary, based on the input matrices for Biological Significance and
Landscape Function.
The Landscape Function and Biological Significance worksheets allow
inputs of the Issues they address, while holding the other constant and
showing overall Biodiversity Management Priority. This feature is
designed to allow the relative contribution of various Issues and
integrated indices to be more easily understood.
Data which can be entered to the spreadsheet is highlighted in mauve,
as indicated in the examples on the following page. Data can be
entered to these fields through the use of drop-down lists incorporated
in the design.
No data should be entered to any fields other than those highlighted in
highlighted in mauve.
The three raw worksheets for data entry and summaries are shown on
the following page.
Entry of property and zone identifiers need only be undertaken once, on
the Biodiversity Management Priority worksheet. This data is looked
up automatically in all other worksheets and should not be overwritten.
Further information on individual worksheets is presented in the
following sections.
Indicators of Level of Concern through the spreadsheet are returned by
accessing lookup data. These are shown using a consistent style
throughout the spreadsheet:
• Bold-Yellow indicates the integrated index value for the REM
component each of the three worksheet addresses, along with
the rank order in the lookup table; and
• Light Blue indicates the Level of Concern for an indicator which
is an input to an integrated indicator or is directly returned on
the worksheet.
6
Biodiversity Management Priority worksheet
Biological Significance worksheet (not shown in full, Landscape Function and Biodiversity Management Priority appear to right)
Landscape Function index (not shown in full, Biodiversity Management Priority appears to right)
7
3.
Main data entry and reporting worksheets
3.1
Biodiversity Management Priority
The only data entered on the Biodiversity Management Priority
worksheet are identifiers for the property, zones and any notes to assist
in interpretation. The data to be entered is not constrained by predefined classes, though a the combination of Property and Zone Id
should define a unique site or area.
The Biodiversity Management Priority worksheet initially contains no
data on its overall indicator or the Biological Significance Index and
Landscape Function Index. A summary of Biodiversity Managment
Priority will appear in the worksheet as these other worksheets are
populated with data.
A zone should be an area in which all its environmental characteristics
are largely the same. Notional averaging to conceptualise zones can be
applied where variation is minimal, though use separate zones if in
doubt. It is not necessary to map zones for the spreadsheet to work
properly, as it can be used to help delineate zones for management.
The figures below show examples of the worksheet populated with
property and zone information, and then with the full Biodiversity
Management Priority.
Biodiversity Management Priority worksheet, intially populated with Property and Zone information
8
Biodiversity Management Priority worksheet, after Biological Significance and Landscape Function worksheets have been populated
3.2
Biological Significance Index
The Biological Significance worksheet generates the REM’s Biological
Significance Input based on input data on:
•
•
•
•
•
Native Vegetation Significance
The figure below shows the Property and Zone ids and the drop down
list for vegetation communities.
Vegetation community;
Bioregion;
Classes of threatened and other priority species;
Old growth forest; and
Structural characteristics of eucalypt forests (indicator of
mature trees).
The worksheet inherits the Property and Zone identifiers from the
Biodiversity Management Priority worksheet and should not be
reentered here.
All other data for entry to the worksheet is via drop down lists that have
been pre-populated with valid entries needed to make the REM return
correct values.
9
When a vegetation community is selected from the drop-down list, the
column ‘Assessment community’ is automatically populated from a
lookup table. In the example above, the community FAG (Cleared
agricultural land) has no conservation status and its Assessment
Community is a null value (ZZZ).
Some vegetation communities are combined with others for assessment
purposes. This ensures consistency in terms of policy, legislation or
regulation and addresses communities which are not systematically or
completely mapped. For example, all Tasveg freshwater wetlands
(AHF, AHL, AHS, ASF and AWU) are treated as AWU Undifferentiated freshwater wetlands -as the various wetland
communities are not mapped comprehensively (in which case AWU
would disappear) and AWU collectively is listed as a threatened
vegetation community.
The columns ‘Species Lookup’ and ‘Species Status’ are provided to
help choose the appropriate ‘Species Category’. ‘Species Lookup’
contains a drop down list of all species of conservation significance
considered in the REM. Selecting a species in ‘Species Lookup’ will
return information on the species in ‘Species Status’, as shown below.
A similar drop down list for the column ‘Bioregion’ will select one of
the nine Tasmanian bioregions.
The combination of the Assessment Community and the Bioregion
provide the basis for a lookup of the Level of Concern categories for
native vegetation. These lookup data are contained in the worksheet
‘BS-NativeVeg_LU’.
Priority Species - Threatened and Other Significant Species
Data on listed threatened species and other significant species requires a
‘Species Category’ to be selected, as shown in the drop down list
below. The first category in the list which applies to the species for the
Zone being assessed is selected, which will report the Level of Concern
classes for species in the relevant category in the columns ‘Species LCI’ and ‘Species LC-P’.
10
Some species are important only in some of the bioregions in which
they occur. These are species which are not threatened or poorly
reserved on a Statewide basis, but may be poorly reserved in some
bioregions. Species in this category need to be checked against the
report on Tasmanian plant reservation status of Lawrence et al. (20085)
to determine if the bioregion is one of concern.
Note:’ Species Lookup’ and ‘Species Status’ are provided for
information only and do not affect returned classes of Level of
Concern, which must be entered by the user in the ‘Species category’
column.
The full lookup data for Threatened and other significant species is
contained in the worksheet ‘BS-Species_LU’.
Priority Species - Hollow Dwelling Species
Priority Species - Full Priority Species Index
Determining the relative importance of native vegetation for hollow
dwelling species uses a combination information about old growth
forest and the age structure of eucalypt forests.
The full priority species index integrates Threatened and Other
Significant species with Hollow Dwelling species. The index is
generated as a lookup in the worksheet ‘BS-SppIndex_LU’ and is
returned in the columns ‘Full Spp LC-I’ and ‘Full Spp LC-P’, as shown
above.
Drop down lists in the columns ‘Old Growth’ and ‘Eucalypt Structure’
provide the data entry options to generate Level of Concern in the
columns ‘Hollows LC-I’ and ‘Hollows LC-P’, as shown in the table
below.
Lookup data for hollow dwelling species in contained in the worksheet
‘BS-HollowSpp_LU’.
5
Lawrence, N., Storey, D. & Whinam, J. (2008). Reservation status of Tasmanian
native higher plants. February 2008, Biodiversity Conservation Branch, Department
of Primary Industies & Water, Hobart.
http://www.dpiw.tas.gov.au/inter.nsf/WebPages/LJEM-7CW3RX?open
11
Biological Significance Index
An example of the differentiation on rank can be seen in rows 7 and 8
below. Both Zones return the same classes for Level of Concern but
have different combinations of Native Vegetation and Priority Species
indices. Both Zones have a High value for the Priority Species Index.
The Zone in row 7 has a Low value on the Native Vegetation Index
while row 8 has a Medium Value.
The full Biological Species Index for the Zone is generated through a
matrix that integrates the Native Vegetation Index and the Priority
Species Index. The lookup matrix is contained in the worksheet ‘BSBiolSig_LU’ and is returned in the columns ‘Biol Sig LC-I’ and ‘Biol
Sig LC-P’, as shown below.
The value of the Biological Signifance Index is also returned as a rank
in the columns ‘LC-I rank’ and ‘LC-P rank’. These are also generated
from the lookup table which returns both the Low-Very High categories
and also the rank order of every combination of the Native Vegetation
and Priority Species indices.
Both combinations are considered to be of High value on the Biological
Significance Index but that with the Native Vegetation of lesser
importance is ranked lower. (Note that the highest rank is 1 and the
lowest 16).
The ranked values are intended to provide finer differentation among
the various combinations which make up the Biological Significance
Index.
In common with all three main worksheets, the values of the Landscape
Function Index and overall Biodiversity Management Priority for the
Zone are also shown (see columns W - Z).
12
3.3
Landscape Function Index
The Landscape Function worksheet generates the REM’s measures of
Level of Concern for landscape ecological function, based on input data
on:
•
•
•
•
•
Clearing Bias
Clearing bias addresses the disproportionate impact that preferential
clearing of certain types of land in a region can have on biodiversity.
Clearing bias is calculated for each land component in each land system
as the percentage of the component that has been cleared.
Clearing Bias - the extent to which each land component
has been cleared;
Connectivity - the distances over which both native
vegetation and cleared land are separated from native
vegetation;
Remnant Vegetation - the size of patches of native
vegetation;
Riparian Vegetation - the percentage of riparian zones
under native vegetation; and
Biophysical Naturalness - within-site vegetation condition.
Clearing bias is entered in one of two ways through a drop down list in
the column ‘Land Component or Clearing Bias’, as shown below.
The worksheet inherits the Property and Zone identifiers from the
Biodiversity Management Priority worksheet and should not be
reentered here. The worksheet also dispalys both the Biological
Significance Index and Biodiversity Management Priority from other
parts of the spreadsheet.
The worksheet also inherits the vegetation community for the zone
from the Biological Significance worksheet, which is used for the
elements of Landscape Function which differ between cleared land and
native vegetation.
All other data for entry to the worksheet is via drop down lists that have
been pre-populated with valid entries needed to make the REM return
correct values.
Where the identity of a land component is known, the individual
component can be selected from the drop-down list (e.g. 164131A).
This will find the land component in the worksheet ‘LF13
Clearingbias_lu’, find the measured percentage of its total extent that
has been cleared, and return the Level of Concern in the columns ‘Cl.
Bias LC-I’ and ‘Cl. Bias LC-P’.
Data can also be entered using generic categories of clearing bias in the
top rows of the drop down list. This would be used in instances where
the identity of the land component is not known but a reasonable
estimate can be made of the extent to which the type of land has been
cleared.
Further information on land components is found in the worksheet ‘LFClearingbas_lu’, including their land system names, component name,
potential land use hazards and clearing bias. Note that the list of land
components includes only those completed for the project
.
Where the vegetation is cleared land, the category ‘Cleared land’ is
selected in the ‘Distance to non-remnant (>200ha)’ column. One of the
distance classes in the drop down list is then selected in the column
‘Distance to native veg.’
Connectivity
Connectivity is the degree to which patches of native vegetation are
inter-connected and of the permeability of the landscape to species
movements.
Where the vegetation is native, the category ‘Native veg’ is selected in
the column ‘Distance to native veg.’. The column ‘Distance to nonremnant (>200ha)’ is then populated in one of two ways:
Connectivity is measured in the REM in two ways. For remnant
vegetation patches (<200ha), the distance to the nearest non-remnant
patch is measured. For cleared land, the measure is the distance to the
nearest patch of native vegetation. Measuring connectivity in cleared
land provides an indicator of how easily species may move across
cleared areas and can help identify areas where vegetation reestablishment may be important.
•
•
Populating both the columns ‘Distance to non-remnant (>200ha)’ and
‘Distance to native veg.’ is needed for the REM to return correct values
for connectivity. Both columns contain the same drop down list, as
shown below.
If the vegetation patch size is >200ha, select the option
‘<50m (also if >200ha)’; or
If <=200ha, select one of the four classes that reflects the
distance to the nearest patch of native vegetation >200ha.
Lookup data on Connectivity is contained in the worksheet ‘LFConnectivity_lu’.
14
Where the vegetation is not native (e.g. cleared land, water) the ‘Nonnative’ option is selected.
Remnant Vegetation
Remnant vegetation is defined as islands of native vegetation, below a
specified size, that are surrounded by cleared land.
Lookup data on Remnant Vegetation is contained in the worksheet ‘LFRemnantVeg-lu’.
Remnant Vegetation is measured by determining the contiguous extent
of each patch of native vegetation and stratifying these to identify
remnants and non-remnants. Remnants in the REM are defined as
patches of native vegetation <=200ha, with those over 200ha
considered to have substantially reduced impacts from the factors
which can lead to remnant degradation over time.
Riparian Vegetation
Riparian Vegetation is the vegetation that adjoins freshwater features
(e.g. rivers, wetlands) and has ecological characteristics which are
influenced by the freshwater environment. Riparain zones have been
found to have influences on biodiversity that extend beyond the
immediate riparian area.
Level of Concern classes for Remnant Vegetation are returned by
populating the column ‘Veg. patch size’ with the appropriate size range
from the drop down list, as shown below.
Riparian Vegetation is measured in the REM as the percentage of the
riparian zone of rivers, wetlands or waterbodies that is under native
vegetation. The extent of the riparian zone is defined from the
Conservation of Freshwater Ecosystems Values project (DPIW, 20086)
as within 50m of rivers and 100m of wetlands and waterbodies. Predefined classes of Riparian Vegetation are also derived from the CFEV
project.
Data on Riparian Vegetation are entered to the Landscape Function
worksheet via a drop down list on the column ‘Rip. Veg. %’, as shown
below.
6
Department of Primary Industries & Water (2008). Conservation of Freshwater
Ecosystems Values (CFEV) project technical report. CFEV program, Department of
Primary Industries & Water, Hobart.
15
Riparian Vegetation has ecosystem effects which extend beyond the
immediate riparian zone, making it an important factor in ecosystem
function. The REM defines the area of effect of Riparian Vegetation as
the immediate catchment of the freshwater feature. In the case of
rivers, this is the catchment of the individual river section, i.e. the area
which drains exclusively into the river section.
The figure below show an example of Riparian Vegetation and its
associated river section catchment. In this example, native vegetation
occupies 10% of the riparian zone so the river section catchment is
treated as having 10% Riparian Vegetation.
Lookup data on Riparian Vegetation is contained in the worksheet ‘LURipVeg-lu’.
16
Biophysical Naturalness
Lookup data for Biophysical Naturalness is contained in the worksheet
‘LF-Bionat-lu’.
Biophysical Naturalness is an indicator of the ability of vegetation to
maintain and sustain its ‘natural’ biodiversity. The concept is broadly
consistent with vegetation condition but is distinguished in the REM by
assessing only within-site naturalness rather than including off-site
factors.
The worksheet also contains some general descriptions of the
characteristics of vegetation in the various classes. Assessing
Biophysical Naturalness on a qualitative basis is relatively subjective.
Users of this feature are encouraged to examine the supporting reports
(Strategy Review and REM Specifications) for further information, and
to familiarise themselves with both the Biophysical Naturalness and
other assessment methods.
Biophysical Naturalness is measured in the REM on a scale of 1 (most
highly modified) to 5 (unmodified) for native vegetation and 0 for
cleared land. Waterbodies and non-vegetated areas (e.g. rock and sand)
are excluded from the Biophysical Naturalness assessment (BN = -1).
A separate report providing details of a site-based quantiative survey
method for Biophysical Naturalness is available on request. The
method uses a pro-forma of data entry and has a separate spreadsheet
with which to enter data and generate outputs.
Biophysical Naturalness classes are entered tothe Landscape Function
worksheet via a drop down list as shown below.
Landscape Function Index
The Landscape Function Index integrates Clearing Bias, Connectivity,
Remnant Vegetation, Riparian Vegetation and Biophysical Naturalness
classes to produce Level of Concern for Landscape Function.
Landscape Function is generated through a three way matrix which
integrates:
•
•
•
Clearing Bias;
a sub-matrix that combines Connectivity, Remnant
Vegetation and Riparian Vegetation; and
Biophysical Naturalenss.
Data entered in the previous sections will return Landscape Function in
two ways:
17
•
•
Lookup data for Landscape Function is contained in the worksheet ‘LFLscp_fn-lu’.
As the categories Low, Medium, High and Very High, as
used throughout the REM; and
With the three way matrix ranked on Level of Concern from
1 (Highest) to 64 (Lowest).
The classes of Biological Significance and overall Biodiversity
Management Priority for the zone are also shown on the right of the
worksheet.
The ranked form of the Landscape Function Index is designed to
provide an expanded scale to assist understanding of the impacts of the
various input variables on the overall Index.
18
4.
Using the lookup worksheets and data
Columns C an D contain the vegetation type (Cleared or Native) and
relevant distance classes that were entered on the worksheet ‘Landscape
Function’. The values that were entered come from the drop down list
defined in column H.
In addition to the three main worksheets described above, the REM
contains a number of worksheets which contain the lookup data for
each of the variables in the REM. The worksheets have a consistent
style and can be accessed to help understand the way in which the REM
is constructed and the way in which its variables interact.
Column I contains the lookup data that corresponds to the entries in the
drop down list and are used, through a cell formula, to generate the
concatenation string in column G.
Note: No data should be inputted directly to the lookup worksheets. All
data entry is through the Biodiversity Management Priority, Biological
Significance and Landscape Function worksheets.
Column J contains each possible combination of values that can be
generated through the concatenation string. The classes of Level of
Concern and their corresponding ranks are shown in columns K - N.
The contents of each lookup worksheet are colour-coded as follows:
Columns E and F contain the looked up classes for Level of Concern
for the Zone.
Data inherited from another worksheet - can be data either entered or
looked up on the source worksheet
Level of Concern categories and ranks looked up on the worksheet
being looked at
Concatenation strings - values from the inherited data concatenated to
form the combination of characteristics looked up on the worksheet
Lookup tables - contain all combinations of data for the Issue along
with their Level of Concern category and rank
Drop down lists - lists of acceptable values for each characteristic that
are entered on the relevant main worksheets
The second figure below shows the lookup worksheet for Bioidversity
Management Priority, which is constructed in the same way. There is
no column of drop down values on this lookup worksheet as there are
no drop down options available on the worksheet ‘Biodiversity
Managment Priority’ which it services.
In this example, Level of Concern classes for both Landscape Function
and Biological Significance are inherited from the two main worksheets
(columns C - F). Their classes are combined into concatenation strings
(columns K - L). The corresponding Biodiversity Management Priority
classes and ranks are lookup up in columns M-Q and returned for the
zone in columns G - J.
The figure below shows a worked example of a lookup table, in this
case the Connectivity component of Landscape Function.
Columns A and B are data on the property name and zone Id entered
from the workshheet ‘Biodiversity management priority’.
19
Lookup worksheet for Connectivity
Lookup worksheet for Biodiversity Management Priority
20
5.
Testing management scenarios & REM specifications
5.1
Testing management scenarios
In addition to returning management priorities for property zones based
on their Level of Concern, the REM workbook can also be used to test
the impacts of changes in management on priorities. Changes can be
based on management actions that improve the overall condition of the
natural resources or that reflect the decline that may occur if
management intervention does not occur.
•
•
The main way in which management scenarios can be tested is through
considering the impact of identified actions on landscape function. The
approach assumes that the sorts of management action usually seen as
positive for resource condition are those that will affect landscape
function. An example where landscape function is both improved and
declines through lack of intervention is shown below.
•
•
Elements of biological significance are less likely to change over the
short term but may be important over the longer term. Equally,
neglecting landscape function may lead to loss of biodiversity values
even in the short term. For example,not addressing biophysical
naturalness in areas of tree delcine may lead to loss of habitat for
hollow dwelling species.
•
•
Testing management scenarios involves creating a two or more rows for
a zone in which different values are entered to test the impacts of
management. The first row contains the existing data for the zone, with
any extra rows containing data that reflects the changes in management
that are being considered.
Clearing Bias of 30-70%. This is unlikely to be altered by
management actions on the property, as the overall clearing bias
for the land component would need to be changed through
revegetation of measureable proportions of the entire land
component extent.
Connectivity of 250-1,000m. This has a High Level of Concern
as the patch is relatively isolated from the nearest non-remnant,
i.e. a patch >200ha.
Remnant patch size of 2-20ha. This has a Very High Level of
Concern as this is the patch size most likely to decline over the
long term.
Riparian Vegetation of 1-20%. This is a High Level of Concern
and indicates that the river section catchment in which the patch
is located has relatively little riparian vegetation. Note that the
patch may not contain riparian vegetation but is influence by
riparian vegetation (or lack thereof) in the vicinity.
Biophysical Naturalness of 2. This is a High Level of Concern
indicating there are significant issues with the condition of this
patch of vegetation.
The overall Level of Concern for Landscape Function is High,
and is ranked 24 on a scale of 1-64 (1 is the highest Level of
Concern).
The figure shows three scenarios of altered management:
•
fencing to improve condition;
•
above, plus consolidation of nearby patches to create a larger
patch; and
•
above two, plus planting of a nearby riparian corridor.
The example below shows a set of management scenarios for a piece of
bush with a High Level of Concern (Immediate) for its overall
Landscape Function. The current characteristics of the patch are shown
in row 5 and can be summarised as follows:
21
Scenario testing for improving Landscape Function
Note: Clearing Bias is not shown as this is constant in all scenarios.
change would be to increase the size of the total remnant to within the
20-200ha range.
Scenario 1 - Fence remnant (row 6)
In this scenario, fencing or some other change in management aimed at
improving the biophysical naturalness within the vegetation patch is
undertaken. Under the scenario biophysical naturalness increases from
2 to 3.
The action results in a drop in the Level of Concern - Immediate from
High to Medium and a further reduction in the rank order, indicating an
increase in the resource condition and also an improved landscape
function.
The action does not result in any change to the Level of Concern Immediate, but there is a reduction in its ranked order that indicates an
improvement in the resource condition.
Scenario 3 - Scenario 2 plus increase riparian vegetation (row 8)
In this scenario, riparian vegetation is established along a stream in the
river section catchment in which the remnant occurs. The effect of the
change increases the percentage of the riparian zone which is under
native vegetation from 1-20% to 20-80%.
Scenario 2 - Scenario 1 plus consolidate nearby patch (row 7)
This scenario could arise by fencing an area that incorporates both the
remnant being assessed and another nearby, with natural regeneration
or replanting occurring in the area in between. The effect of this
22
The action results in no change to the Level of Concern - Immediate but
does have an associated further drop in the ranked level of concern.
This is consistent with a further improvement in the landscape function
of both the patch (zone) and the contextual environment in which it
occurs.
increase in the ranked order that arises from the improvement in
biophysical naturalness.
This reflects the way in which different components of the REM are
weighted. Level of Concern - Potential is a measure of the importance
of keeping the values which are extant in the landscape. In this case the
Clearing Bias (Medium) is the most significant factor, with other
remnants on land with higher levels of Clearing Bias generally more
important for retention.
Level of Concern - Potential
The classes of Level of Concern - Potential show no change from the
current High value under any of the scenarios, though there is an
_________________________________________________________________________________________________________________________
5.2
Testing and modifying REM specifications
The specifications used to develop the REM represent just one way of
looking at the landscape ecology and biological significance of a
region.
Example 1 - Changes to a prioritisation matrix
The example in the previous section used the vegetation community
Eucalyptus amgydalina on dolerite in the South East bioregion, which
has the following characteristics:
The matrices that are used in the REM comprise a large number of
environmental variables, each of which can result in a number of
classes being assigned to the Issue for which they are an indicator. As a
result, the potential number of combinations of classes which make up
the REM increase exponentially as the level in the hierarchy increases.
A prioritisation matrix for an Issue may be relatively simple but
becomes conceptually more complex as Issues are combined to form
Assets and the overall Biodiversity Asset Classes.
•
•
•
The REM specifications can be modified by altering the lookup
matrices in the various worksheets. Changes can be made in a number
of ways. Some examples are outlined below, though users should
consult the REM Strategy Review and REM specifications to ensure a
thorough understanding of the basis for the current specifications and
the ecological bases for any changes.
The vegetation community is not threatened;
Its bioregional extent is 84,677ha;
Conservation reserves for the community are 31.6% of its
Statewide extent (168,009ha) and 24% of its extent in the South
East bioregion.
Three classes are used as inputs to the prioritisiation matrix for native
vegetation:
•
•
23
The community is not threatened;
Its extent class is >55,000ha; and
•
A change to the cell in the prioritisation matrix of the lookup table will
automatically be activated in all other parts of the workbook where the
value is used.
Its reservation level (the minimum of the Statewide and
bioregional) is 10-30%.
In making changes such as these, it is important to ensure that logical
consistency in the resulting classification is maintained. In this case, all
other combinations of non-threatened vegetation with 10-30%
reservation would need to be at least Medium, as the example used is
the largest of the extent classes, hence all communities with lesser
extent will be at least the same Level of Concern or higher.
This combination of classes gives the community in this bioregion a
Level of Concern ranking of Low for both Immediate and Potential, as
shown below from the lookup table’BS-NativeVeg_lu’:
Example 2 - Change to classes in an input
In some cases it may be desired to change the parameters of the REM to
reflect a different opinion of where thresholds should be placed and to
test the sensitivity to such thresholds.
All inputs to the REM can be made by use of drop-down lists, as this
ensures only classes on which the model is built are used. The lookup
tables contain drop-down lists stored in a standard colour coded format,
as shown below.
It might be decided that all vegetation communities with less than 30%
reservation at State or bioregional level have a residual reservation
need. A user might increase the Level of Concern (Immediate) to
Medium, to reflect the residual need, but retain the Level of Concern
(Potential) as Low to reflect that there are many options for addressing
that need.
24
facilitated by making a copy of the workbook and comparing results
between the two.
In this example it might be considered appropriate the change the
threshold classes for remnant vegetation. Remnants might be
reclassified as 5-200ha, with the threshold between smaller and larger
remnants being set at 50ha.
More complex changes
The change can be effected by typing in the update values in the drop
down list cells on the lookup table. The change in input classes for the
variable will be automatically updated in the drop down list on the data
entry worksheet (Landscape Function in this case).
More complex changes to the REM can be made if desired. Most of the
shorter drop down lists in the workbook have been defined with extra
cells which are currently not populated. Hence extra classes can be
added if desired. However, altering input classes will also require that
the prioritisation matrix be modified to reflect the additional them, and
that any other matrices that use the result as an input reflect the updated
range of options.
The current version of the workbook does not result in an automatic
update to data that has been entered from the drop-down list prior to
being altered. So this data will also need to be reentered. Making
comparisons between different formulations of the REM can be
25