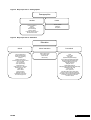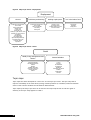
1
LONGITUDINAL SURVEYS
OF AUSTRALIAN YOUTH
T E C H N I C A L R e p ort 5 4
2003 cohort
user guide
Longitudinal Surveys of
Australian Youth (LSAY)
2003 cohort user guide
National Centre for Vocational Education Research
LONGITUDINAL SURVEYS OF
AUSTRALIAN YOUTH
TECHNICAL REPORT 54
Date created: January 2010
Last updated: December 2012
Version: 4.0
The views and opinions expressed in this document are those of NCVER
and do not necessarily reflect the views of the Australian Government
or state and territory governments.
Publisher’s note
Additional information relating to this publication is available from NCVER’s website
<http://www.lsay.edu.au/publications/
/publications/2225.html>.
© Commonwealth of Australia, 2012
With the exception of the Commonwealth Coat of Arms, the Department’s logo, any material protected
by a trade
de mark and where otherwise noted all material presented in this document is provided under a
Creative Commons Attribution 3.0 Australia <http://creativecommons.org/licenses/by/3.0/au> licence.
The details of the relevant licence conditions are available on the Creative Commons website
(accessible using the links provided) as is the full legal code for the CC BY 3.0 AU licence
<http://creativecommons.org/licenses/by/3.0/legalcode>.
The Creative Commons licence conditions do not apply to all logos, graphic design, artwork and
photographs. Requests and enquiries concerning other reproduction and rights should be directed to the
National Centre for Vocational Education Research (NCVER).
This document should be attributed as NCVER 2012, Longitudinal Surveys of Australian Youth (LSAY)
2003 cohort user guide,, NCVER, Adelaide.
This work has been produced by NCVER through the Longitudinal Surveys of Australian Youth (LSAY)
Program, on behalf of the Australian Government and state and territory governments, with funding
provided through the Australian Department of Education, Employment
Employment and Workplace Relations.
The views and opinions expressed in this document are those of NCVER and do not necessarily reflect
the views of the Australian Government or state and territory governments.
TD/TNC 98.10
Published by NCVER
ABN 87 007 967 311
Level 11, 33 King William Street, Adelaide, SA 5000
PO Box 8288 Station Arcade, Adelaide SA 5000, Australia
P +61 8 8230 8400 F +61 8 8212 3436 E [email protected] W <http://www.lsay.edu.au>
User guide updates
Date
Version
December 2012
4.0
Update
Updated for latest data release (wave 9, 2011).
Amended background information.
Updated information about derived variable documentation.
December 2011
3.0
Updated for latest data release (wave 8, 2010).
Added reference to newly released weighting technical paper .
Added additional reference to PISA 2003 technical reports.
Updated information relating to data archive; data now available from the
Australian Data Archive (ADA) rather than the Australian Social Science
Data Archive (ASSDA).
Added information about population weights to table about variable naming
conventions.
March 2011
2.1
Updated ‘Appendix A: Updates to the Y03 dataset’.
Modified derived variable labels in table 8.
Additional information added to section ‘Sample and survey design’.
December 2010
2.0
Updated for latest data release (wave 7, 2009).
Added information on LSAY website registration.
Modified derived variable labels .
Modified information in section ‘Sources of error’ to account for change to
weighting methodology.
Added ‘Appendix A: Updates to the Y03 dataset’.
January 2010
NCVER
1.0
Original version of User guide.
3
Contents
Tables and figures
6
Tables
6
Figures
6
Background
7
Using this guide
8
Registration
8
The Y03 cohort
9
Questionnaires and codebooks
9
Cohort reports
10
Other technical papers
11
Accessing the data
12
Specific data requests
12
LSAY data releases
12
Data restrictions
13
Overview of the questionnaires
15
Programme for International Student Assessment (PISA)
15
Plausible values
15
How do I use plausible values?
16
The LSAY questionnaires
16
The LSAY data
18
Topic areas
18
Topic maps
20
Data elements
21
Variable listing/metadata workbook
22
Variable selection
22
Variable naming conventions
24
PISA variables
24
LSAY standard variables
25
LSAY non-standard variables
26
Derived variables
28
Sample and survey design
29
Response rates
29
Sources of error
30
Non-sampling error
30
Non-response
30
Weights
31
Sampling error
32
Standard errors
4
33
LSAY 2003 cohort user guide
Confidence intervals
33
Relative standard errors
33
Examples
33
Classifications and code frames
35
Education
35
Occupation
36
Industry
36
Institution
36
Country
36
Language
37
Topic maps
38
Topic map 1: Demographics – Student
40
Topic map 2: Demographics – Parent
42
Topic map 3: Education – School
45
Topic map 4: Education - School transition
62
Topic map 5: Education - Post-school
65
Topic map 6: Employment – Current
79
Topic map 7: Employment - Job history and training
85
Topic map 8: Employment - Seeking employment
88
Topic map 9: Employment - Not in the labour force
91
Topic map 10: Social - Health, living arrangements and finance
92
Topic map 11: Social - General attitudes
98
Appendix A: Updates to the Y03 data file
NCVER
104
5
Tables and figures
Tables
1
Technical papers – questionnaires and frequency tables
10
2
Old cohort reports
11
3
PISA technical documents
16
4
Topic maps
21
5
User guide data element documents
22
6
Summary of PISA variable naming conventions
25
7
Summary of LSAY non-standard variable naming conventions
26
8
Derived variables
28
9
Sample sizes: PISA and LSAY
29
10
Sample sizes and response rates
30
11
Weight variables
32
12
Estimates, standard errors, RSEs and confidence limits for highest school level
completed, Y03 cohort in 2008 for a large sample (all respondents)
13
33
Estimates, standard errors, RSEs and confidence limits for highest school level
completed, Y03 cohort in 2008 for a small sample (remote respondents)
34
14
Summary of classifications and code frames used in the LSAY Y03 dataset
35
15
Summary of changes made to the Y03 data file
104
Figures
1
Cohort reports
11
2
LSAY hierarchical levels
18
3
Major topic area 1 – Demographics
19
4
Major topic area 2 – Education
19
5
Major topic area 3 – Employment
20
6
Major topic area 4 – Social
20
7
Identifying related topic areas
23
8
PISA variable naming convention
24
9
LSAY standard variable naming convention
26
6
LSAY 2003 cohort user guide
Background
The Longitudinal Surveys of Australian Youth (LSAY) is a research program that tracks young people as
they move from school into further study, work and other destinations. It uses large, nationally
representative samples of young people to collect information about education and training, work,
and social development.
It includes surveys conducted from the mid-1970s through to the mid-1990s: the Youth in Transition
(YIT) program; the Australian Longitudinal Survey (ALS); the Australian Youth Survey (AYS); and the
current LSAY collection, which began in 1995.
Survey participants in the current LSAY collection (collectively known as a ‘cohort’) enter the study at
age 15 years, or as was the case in earlier studies, when they were in Year 9. Individuals are
contacted once a year for up to 12 years. Studies began in 1995 (Y95 cohort), 1998 (Y98 cohort), 2003
(Y03 cohort), 2006 (Y06 cohort) and more recently in 2009 (Y09 cohort). Over 10 000 students start
out in each cohort.
Since 2003, the initial survey wave has been integrated with the Organisation for Economic Cooperation and Development (OECD) Programme for International Student Assessment (PISA).
Respondents from the PISA-based cohorts (Y03, Y06 and Y09) could miss a survey wave and still
remain in the survey. Respondents could also miss more than one survey wave, as long as these survey
waves were not consecutive. If respondents from the earlier cohorts (Y95 and Y98) missed a survey
wave, they were excluded from future surveys.
The LSAY research program provides a rich source of information to enable a better understanding of
young people and their transitions from school to post-school destinations; it also explores their social
outcomes, such as wellbeing.
Information collected as part of the LSAY program covers a wide range of school and post-school
topics, including: student achievement, student aspirations, school retention, social background,
attitudes to school, work experiences and what students are doing when they leave school.
LSAY is managed and funded by the Australian Government Department of Education, Employment
and Workplace Relations (DEEWR), with support from state and territory governments. On 1 July 2007,
the National Centre for Vocational Education Research (NCVER) was contracted to provide LSAY
analytical and reporting services. NCVER is undertaking this service for the department in
collaboration with the Australian National University’s Social Policy Evaluation, Analysis and Research
Centre (SPEAR).
Between 1995 and 2007 the LSAY analytical and reporting services were previously provided by the
Australian Council for Educational Research (ACER) jointly with the Department of Education, Science
and Training1 (DEST).
More information can be obtained from the LSAY website, or by contacting NCVER:
Toll free: 1800 825 233
Email: <[email protected]>
Telephone: +61 8 8230 8400
Website: <www.lsay.edu.au>
Facsimile: +61 8 8212 3436
1
Replaced in December 2007 by the Department of Education, Employment and Workplace Relations.
NCVER
7
Using this guide
This User guide has been developed for users of the LSAY data. The guide endeavours to consolidate
existing technical documentation and other relevant information into a single document, thereby
improving data accessibility and promoting wider use of the LSAY data.
To promote effective use of the data, the guide aims to address all aspects of LSAY data, including
information about: how to access the data, data restrictions, variable naming conventions, the
structure of the data (using topic areas, topic maps and data elements), classifications and code
frames used, weights and derived variables.
A series of additional documents (Data elements A to D) complement this User guide. Data elements
represent variables that are common within and between waves. These documents contain
information about the data elements, including the variables they cover, the valid values (or response
options) for each variable and additional notes (where applicable). Information about the data
elements documentation is contained in section The LSAY data: data elements.
Users may also find the metadata workbook useful. The workbook provides a listing of all variables in
the Y03 dataset, as well as basic information about each variable. Data can be filtered and inspected
by wave/year, questionnaire section, topic area(s) and/or data element. See the section ‘The LSAY
data: Variable listing/metadata workbook’ for further information. The metadata workbook can be
accessed at: <www.lsay.edu.au/publications/2225.html> under the ‘supporting documents’ tab.
If you have any feedback or issues finding the information you need contained in this guide, please do
not hesitate to contact the LSAY branch at NCVER:
Toll free:
1800 825 233
Telephone: +61 8 8230 8400
Facsimile:
+61 8 8212 3436
Email:
<[email protected]>
Website:
<www.lsay.edu.au>
Registration
You need to register for the LSAY website to access LSAY resources and materials. Registration is free
and gives you:
web access to LSAY cohort reports, technical documents and questionnaires
web access to the full text of LSAY research reports and briefing papers
email alerts to keep you informed about the latest research and data releases from LSAY.
The following link can be used to register for the LSAY website:
<http://www.lsay.edu.au/subscribe.html>.
Further information about registering for the LSAY website can be found here:
<http://www.lsay.edu.au/newsevents/subscribe.html>.
8
LSAY 2003 cohort user guide
The Y03 cohort
In 2003, a nationally representative sample of approximately 12 500 students aged 15 years was
selected to participate in the Programme for International Student Assessment (PISA), conducted by
the Organisation for Economic Co-operation and Development (OECD). More than 10 000 of these young
people became the third cohort of the LSAY program. This is referred to as the LSAY Y03 cohort.
The PISA sample was constructed by randomly selecting 50 students aged 15 years from a sample of
schools designed to represent all states and sectors. Assessments in mathematical literacy, reading
literacy, scientific literacy and problem-solving were administered in their schools to provide
information on school achievement for use in later analyses of educational and labour market
participation. Students also completed a background questionnaire about their families, educational
and vocational plans, and attitudes to school. In a follow-up telephone interview, students provided
further school and work information.
In 2004, members of the Y03 cohort were contacted for their annual LSAY telephone interview, and
have been contacted annually to 2011. The questionnaire for their 2004 interview included questions
on school, transitions from school, post-school education and training, work, job history, job search
history, non-labour force activities, health, living arrangements and finance, and general attitudes.
Subsequent surveys (conducted by the Wallis Consulting Group) asked similar questions but with the
emphasis changing from school to post-school education, training and work, depending on the young
person’s circumstances.
Due to both population shifts over time and survey attrition, care needs to be taken when comparing
individual waves of the cohort with other samples drawn from different populations. For example, it
can be misleading to compare the LSAY Y03 wave 3 (2005) information with information about 18year-olds from other surveys in the same year.
Prior to the development of this User guide, a range of documents contained information about the
Y03 cohort. These documents were categorised as codebooks (including the questionnaire, frequency
tables and data dictionary), cohort reports, technical papers and research reports. Information from
these documents has been consolidated in this User guide to provide a single source for Y03 technical
information. These documents are discussed below.
Questionnaires and codebooks
The following four questionnaire instruments were used in PISA 2003:
the School Questionnaire
the Student Questionnaire
the Educational Careers Questionnaire
the Information Communication Technology Questionnaire.
The Educational Careers and Information Communication Technology questionnaires were offered as
international options.
The 2003 PISA questionnaires and codebooks are available from the OECD website:
<http://pisa2003.acer.edu.au/downloads.php>.
NCVER
9
The LSAY technical reports/papers include the questionnaire for that survey year, a series of
frequency tables for each variable, as well as a data dictionary or codebook (for some waves). The
data dictionaries contain the variable names, formats and base populations for the Y03 dataset.
The LSAY Y03 technical papers can be accessed at <www.lsay.edu.au/data/31272.html>. Table 1
provides a summary of the available technical papers.
Table 1
Technical papers – questionnaires and frequency tables
Wave/year
Technical paper/report
Wave 1 / 2003
Technical report no. 342 3
Wave 2 / 2004
Technical report no. 35
Wave 3 / 2005
Technical report no. 38
Wave 4 / 2006
Technical report no. 41
Wave 5 / 2007
Technical report no. 45
Wave 6 / 2008
Technical report no. 51
Wave 7 / 2009
Technical report no. 57
Wave 8 / 2010
Technical report no. 62
Wave 9 / 2011
Technical report no. 76
Cohort reports
The Y03 cohort reports provide a longitudinal snapshot of the activities of the Y03 cohort from 2003
to the current wave of interviewing. They are updated on an annual basis as new waves of data
become available.
The content of the cohort reports focuses on the areas of educational attainment, employment,
measures of engagement in study and work, and social outcomes. The cohort reports present a
series of tables for each of the indicators. Each series of tables is able to be filtered by a range of
demographic variables and can be downloaded into Excel.
The Y03 cohort reports can be accessed at: <www.lsay.edu.au/cohort/introduction.html>, and are
particularly useful for cross-validation for data users. See figure 1 for an illustration of the cohort
reports.
Previous cohort reports focused on describing the education, employment and social participation
of young people during the year, and the experiences and attainment in these domains up to a point
in time.
These previous reports are available in PDF format and can be accessed at:
<www.lsay.edu.au/cohort/other_search.html>.
Table 2 provides a summary of the earlier cohort reports.
2
3
LSAY Technical report no. 34 contains information for all variables contained in the LSAY Y03 dataset, i.e. it includes
information for both PISA and LSAY variables.
The PISA 2003 questionnaires are available from the OECD website: <http://pisa2003.acer.edu.au/downloads.php>.
10
LSAY 2003 cohort user guide
Figure 1 Cohort reports
Table 2
Old cohort reports
Wave/year
Technical report/paper
Wave 1/2003
The 2003 LSAY cohort of 15-year-olds: 15-year-olds in 2003
Wave 2/2004
The 2003 LSAY cohort of 15-year-olds: 16-year-olds in 2004
Wave 3/2005
The 2003 LSAY cohort of 15-year-olds: 17-year-olds in 2005
Other technical papers
Other technical papers that may be useful include sampling and weighting methodology and the PISA
technical reports and data analysis manuals.
Technical paper number 61, Weighting the LSAY PISA cohorts, can be accessed at:
<http://www.lsay.edu.au/publications/2429.html>.
Technical paper number 43, Sampling and weighting the 2003 LSAY cohort, can be accessed at:
<http://www.lsay.edu.au/publications/1962.html>.
The PISA 2003 technical report, data analysis manuals and country report provides all the information
required to understand the PISA 2003 data (contained in the first wave of the Y03 cohort) and to
perform analyses in accordance with the complex methodologies used to collect and process the data.
The PISA 2003 technical report is available from:
<http://www.oecd.org/dataoecd/49/60/35188570.pdf>.
The PISA 2003 data analysis manual (for both SAS and SPSS users) is available from:
<http://www.oecd.org/document/18/0,3343,en_32252351_32236173_35016146_1_1_1_1,00.html>.
The PISA 2003 country report (Australia): Facing the future — A focus on mathematical literacy among
Australian 15-year-old students in PISA 2003 is available from:
<http://www.oecd.org/dataoecd/59/36/34624327.pdf>.
NCVER
11
Accessing the data
LSAY datasets are deposited annually with the Australian Data Archive (ADA) at the Australian
National University in Canberra. Permission to use the data and access requirements are managed by
the Australian Data Archive. Data access requires authorisation from the Data Archive Manager.
The data can be accessed by:
•
completing the ‘Application to access LSAY’ restricted data form and the LSAY ‘User
undertaking’ form, available from the ADA LSAY information page:
<http://www.ada.edu.au/longitudinal/lsay>
•
returning the completed forms via email to the Australian Data Archive at <[email protected]>.
Part of NCVER’s role is to promote and encourage the use of the LSAY data. If you have any feedback
or queries about the data and how to access it you should contact:
NCVER
Email:
<[email protected]>
LSAY hotline: 1800 825 233
Australian Data Archive
Email:
<[email protected]>
Telephone:
02 6125 2200
Facsimile:
02 6125 0627
Specific data requests
A specific data request allows you to ask for specific tables and/or data analysis to be undertaken by
NCVER without the need for you to obtain full sets of the data.
A specific data request can be made to <[email protected]>.
There are fees and charges applicable for all data requests that require more than one hour to
complete. Please refer to NCVER’s policy on charging:
<http://www.ncver.edu.au/statistic/21075.html#protocols>.
LSAY data releases
Information about the latest LSAY data releases is available from the LSAY website:
<www.lsay.edu.au/data/latest.html>.
You may also request to be notified of recent LSAY releases, which include publications and data
releases. You can subscribe to NCVER’s LSAY alert page at:
<http://www.lsay.edu.au/subscribe.html>.
12
LSAY 2003 cohort user guide
Data restrictions
Data use is restricted to research; data are not to be used for commercial or financial gain. In
addition, LSAY data users must agree to refrain from reporting student achievement information by
school sector. This reflects permission requirements agreed at the time the data were collected.
Further conditions of use are outlined in the LSAY ‘User undertaking’ form which is available from the
ADA LSAY information page: http://www.ada.edu.au/longitudinal/lsay. The conditions of use are as
follows:
1.
Use of the material is restricted for statistical purposes. This means the user can only use the
material to produce information of a statistical nature. Examples of such uses are:
a.
the manipulation of data to produce means, correlations or other descriptive
summary measures
b. the estimation of population characteristics from sample data
c.
the use of data as input to mathematical models and for other types of analyses (for
example, factor analysis)
d. the provision of graphical and pictorial representation of characteristics of the
population or sub-sets of the population.
2.
The material is not to be used for any non-statistical purposes, or for commercial or financial
gain without the express written permission of the Australian Data Archive National Manager.
Examples of non-statistical purposes include (but are not limited to):
a.
transmitting or allowing access to the data in part or whole to any other person,
department, or organisation not a party to this undertaking; and
b. attempting to match unit record data in whole or in part with any other information
for the purposes of attempting to identify individuals.
3.
Statistical tables, graphs etc. obtained from analysis of these data may be further
disseminated provided that the user:
a.
identify the primary investigators, data series and version number, and data
distributors by including the bibliographic reference for the data file;
b. acknowledges another archive where the data file is made available through the
Australian Data Archive by another archive; and
c.
declares that those who carried out the original analysis and collection of the data
bear no responsibility for the further analysis or interpretation of them.
4.
Use of the material is solely at the user’s risk and the user must indemnify the Australian
Data Archive (ADA) and the ADA consortium members (the Australian National University, the
University of Melbourne, the University of Queensland, the University of Technology, Sydney
and the University of Western Australia), the National Centre for Vocational Education
Research (NCVER) and the Commonwealth of Australia against any liability, loss or expense
incurred by the ANU, ADA, NCVER or Commonwealth arising from any action taken against
them resulting from unauthorised use or duplication of material, or any other breach of
conditions set out in this undertaking.
NCVER
13
5.
The Australian National University, the Australian Data Archive, the National Centre for
Vocational Education Research and the Commonwealth of Australia shall not be held
responsible for the accuracy and completeness of the material supplied.
6.
Where applicable:
a.
the user must draw the terms and conditions of the undertaking to the attention of
persons within the department/organisation who shall make use of the material; and
b. the Australian Data Archive (ADA) and the ADA consortium members (the Australian
National University, the University of Melbourne, the University of Queensland, the
University of Technology, Sydney and the University of Western Australia), the
National Centre for Vocational Education Research (NCVER) and the Commonwealth
of Australia shall not be held liable for any breach of this undertaking.
7.
LSAY student achievement information cannot be reported at the school sector aggregate for
the LSAY 2003 and 2006 cohorts.
8.
Where research findings based on LSAY are published, or otherwise placed in the public
arena, the user must agree to provide the Australian Data Archive and the National Centre for
Vocational Education Research with the bibliographic details and, where available, online
links to any published work (including journal articles, books or book chapters, conference
presentations, theses or any other publications or outputs) based wholly or in part on the
material.
14
LSAY 2003 cohort user guide
Overview of the questionnaires
Programme for International Student Assessment (PISA)
In 2003, the initial survey wave (wave 1) was integrated with the OECD’s Programme for International
Student Assessment. Assessments in mathematical literacy, reading literacy, scientific literacy and
problem-solving were administered in their various schools to provide information on school
achievement. Students also completed a background questionnaire about their families, educational
and vocational plans, and attitudes to school.
PISA 2003 covered four domains: reading literacy, mathematical literacy, scientific literacy and
problem-solving. For each PISA data collection, one of these domains is chosen as a major domain,
while the others are considered minor domains. A major domain is tested more thoroughly in the year
of collection. The major domain for PISA 2003 was mathematical literacy.
The PISA 2003 assessments consisted of a self-completion written test. Literacy in PISA was assessed
through units consisting of a stimulus (for example, text, table, chart, figure etc.), followed by a
number of tasks associated with this common stimulus. This is an important feature, allowing
questions to go into greater depth than if each question introduced an entirely new context. It also
allows time for the student to assimilate material, which can then be used to assess multiple aspects
of performance.
Examples of items from the PISA 2003 assessment are available in The PISA 2003 Assessment
Framework — Mathematics, Reading, Science and Problem Solving Knowledge and Skills available at:
<http://www.oecd.org/document/29/0,3343,en_32252351_32236173_33694301_1_1_1_1,00.html>.
This publication presents the guiding principles of the PISA 2003 assessment, which are described in
terms of the content that students need to acquire, the processes that need to be performed, and the
context in which knowledge and skills are applied. It also illustrates the assessment domains with a
range of simple tasks.
Plausible values
In PISA student assessment is undertaken using a different number of questionnaire booklets. Students
from individual schools received different sets of questions. In order to counteract any biases
resulting from the use of different questionnaires, the OECD calculates plausible values. Plausible
values allow for the fact that there is measurement error at the individual level (through differing
questionnaires), and the determination of these plausible values takes this error into account.
For each student, five plausible values have been calculated for each of the four domains (reading,
mathematics, science and problem-solving), and for the mathematics sub-domains (space and shape,
change and relationship, uncertainty and quantity).
Data users are encouraged to read the documents outlined in table 3 to better understand the
construction and use of plausible values in LSAY.
NCVER
15
Table 3
PISA technical documents
Technical report/paper
Web address
PISA 2003 Data analysis manual
<http://www.oecd.org/document/18/0,3343,en_32252351_322361
73_35016146_1_1_1_1,00.html>
PISA 2003 Technical report
<http://www.oecd.org/dataoecd/49/60/35188570.pdf>
PISA 2003 Australian country report: Facing the
future – A focus on mathematical literacy among
Australian 15-year-old students in PISA 2003
<http://www.oecd.org/dataoecd/59/36/34624327.pdf>
The role of plausible values in large-scale surveys
<https://mypisa.acer.edu.au/images/mypisadoc/plausiblevaluesins
ee.pdf>.
How do I use plausible values?
There are five plausible values for each achievement domain and sub-domain in the LSAY dataset.
Unbiased estimates of achievement will only be obtained if plausible values are incorporated
appropriately. The following are some key points:
Averaging plausible values over individuals will lead to biased estimates and incorrect standard
errors.
Analysis should be repeated for each plausible value (five times), and any subsequent estimate
(for example, coefficients, standard errors) combined in an appropriate way to obtain population
estimates.
Plausible values are correlated within a domain, and, as such, an analysis may be undertaken using
only a single plausible value, but being aware that standard errors may be incorrect.
Users are reminded that plausible values are not equivalent to the achievement scores in the Y95 and
Y98 LSAY cohorts.
The LSAY questionnaires
In 2003, follow-up telephone interviews were conducted which collected further information on
respondents’ schools and on part-time work.
The longitudinal nature of the LSAY data collections means that new surveys are closely linked to, are
comparable with, and build on, the previous surveys.
From 2004 (wave 2), students have been contacted annually by telephone and asked a range of
questions across the following sections:
Section A: School
Section B: Transition from school
Section C: Post-school study
Section D: Work
Section E: Job history
Section F: Job search activity
Section G: Not in the labour force
Section H: Living arrangements, finance and health
Section J: General attitudes
16
LSAY 2003 cohort user guide
The Y03 questionnaires are contained within the series of Y03 technical papers and can be accessed
at: <www.lsay.edu.au/data/31272.html>. Table 1 provides a summary of the available technical
papers for each wave. The section ‘The Y03 cohort: Other technical papers’ describes other non-wave
specific technical papers.
NCVER
17
The LSAY data
The LSAY datasets are large and particularly complex. About 700 variables are collected (on average)
across each wave, culminating in more than 4000 variables across the entire dataset. To improve
accessibility of the LSAY datasets, data have been grouped into common themes called ‘topic areas’.
Topic areas
The topic areas comprise four hierarchical levels:
Major topic areas are the broadest topic area. There are four major topic areas.
Sub-major topic areas are subdivisions of the major topic areas. There are 11 sub-major topic
areas.
Minor topic areas are subdivisions of the sub-major topic areas. There are about 180 sub-major
topic areas.
Data elements are subdivisions of the minor topic areas. There are more than 2000 data elements.
Figure 2 LSAY hierarchical levels
Major topic area
Sub-major topic area (1)
Sub-major topic area (2)
Minor topic area (1)
Minor topic area (2)
Minor topic area (3)
...
Minor topic area (1)
Minor topic area (2)
Minor topic area (3)
...
Data
Data
Data
Data
Data
element
element
element
element
element
...
(1)
(2)
(3)
(4)
(5)
The four major topic areas are Demographics, Education, Employment and Social. The divisions of these
major topic areas into sub-major topic areas and minor topic areas are illustrated in figures 3 to 6.
18
LSAY 2003 cohort user guide
Figure 3 Major topic area 1 – Demographics
Demographics
Student
Parent
Country of birth
Education
Occupation
Place of residence
Gender
Indigenous
Date of birth/age
Country of birth
Language spoken at home
Socioeconomic status
Figure 4 Major topic area 2 – Education
Education
School
School characteristics
Student characteristics
Reasons for attending
Activities
Student achievement
Perceptions about self and school
Views on maths
Use of computers
Time spent learning
Subjects/courses
Subjects/courses: TAFE/VET
Subjects/courses: VET
Study plans
Careers advice
Work experience
Workplace learning
Qualifications and results
Government payments
NCVER
School transition
Plan to leave school
Post-school plans
School leavers
Main activity
Post-school
Study
Current study
Past study
Apprenticeships/traineeships
Current apprenticeships/traineeships
Past apprenticeships/traineeships
Deferred/withdrew from study
Changed institutions
Changed course
Changed/left employer
Changed/stopped apprenticeship/traineeship
Satisfaction with study
Careers advice
Work experience
Perceptions about post-school study
Studying science/engineering/maths/IT
Not studying science/engineering/maths/IT
Government payments and income
Economic climate
19
Figure 5 Major topic area 3 – Employment
Employment
Current
Job history and training
Employment characteristics
Time worked
Wages and benefits
Starting work
Leaving work
Looking for work
Working in a job while at school
Working in a job post-school
Job training
Job satisfaction
Perceptions about
apprenticeship/traineeship
Perceptions about work
Economic climate
Aspirations
Employment characteristics
Time worked
Wages and benefits
Job training
Leaving work
Seeking employment
Looking for work
Job search activity
Problems looking for work
Economic climate
Not in the labour force
Main activity
Education
Employment
Figure 6 Major topic area 4 – Social
Social
Health, living arrangements and
finance
Living arrangements
Household possessions
Children
Marriage
Disability and health
Government payments
Housing payments
Finance
General attitudes
Leisure
Interests
Life satisfaction
Job aspirations
Aspirations
Community perceptions
Problems
Relationships
Volunteer
Topic maps
Topic maps have been developed for each of the 11 sub-major topic areas. The topic maps aim to
improve accessibility of the LSAY data by linking common questions (or variables) within and between
waves. These common variables are identified as data elements.
Topic maps by sub-major topic area can be found in the Topic maps section of this User guide. A
summary of the topic maps appears in table 4.
20
LSAY 2003 cohort user guide
Table 4
Topic maps
Major topic area
Demographics
Education
Employment
Social
Topic map
Sub-major topic area
1
Student
2
Parent
3
School
4
School transition
5
Post-school
6
Current
7
Job history and training
8
Seeking employment
9
Not in the labour force
10
Health, living arrangements and finance
11
General attitudes
Data elements
Data elements represent variables that are common within and between waves. In some instances, a
data element may represent a single variable (when not collected across multiple waves). Information
about each data element is contained in the supplementary sections (Data elements A to D) of this
User guide. They can be accessed at: <www.lsay.edu.au/publications/2225.html>.
This series of data element documents are identified by their major and sub-major topic area. An
overview of these data element documents is given in table 5.
For each data element, the following information is provided (where applicable):
Data element—the data element name
Purpose—what information is provided by the data element
Variables—the variable names which correspond to this data element
Variable type—whether the variable is in numeric or character format
Variable label—the variable label; this includes the question number (where applicable) and a
short description of the variable
Question—the question wording for the associated variable
Values—the possible values each variable can take and corresponding formats
Base population—the syntax for the number of respondents eligible to answer the corresponding
question
Notes—other information.
NCVER
21
Table 5
User guide data element documents
User guide
Major topic area
Sub-major topic area(s)
Part A
Demographics
Student
Parent
Part B1
Education
School
School transition
Part B2
Education
Post-school
Part C
Employment
Current
Job history and training
Seeking employment
Not in the labour force
Part D
Social
Health, living arrangements and finance
General attitudes
Variable listing/metadata workbook
To further assist in the use of the LSAY data, an Excel metadata workbook has been developed by
NCVER. It provides a complete listing of all the variables in the Y03 dataset, as well as information
about each variable. Data can be filtered and inspected by wave/year, questionnaire section, topic
area(s) and/or data element.
The metadata workbook can be accessed at: <www.lsay.edu.au/publications/2225.html> under the
‘supporting documents’ tab.
The information contained in this workbook is similar to that contained in the topic maps and data
elements documents, but can be manipulated using filters to search for and group variables.
There are two worksheets included in the metadata workbook: Variables and Values. Both worksheets
list each variable in the order it appears in the dataset. Major, sub-major and minor topic areas as
well as data elements are provided for each variable. The wave/year, questionnaire section and
variable label are also included (where applicable).
The first worksheet, Variables, includes the variable type, variable label, question (wording) and base
population. The second worksheet, Values, lists each variable and the values that variable can take
(where applicable).
Note that, while all variables are included in the listing, variables provided in the datasets (available
from the Australian Social Science Data Archive) are limited by existing data restrictions. See section
‘Accessing the data: Data restrictions’.
Variable selection
Not all variables assigned to a data element are directly comparable. Additional attributes such as
question wording, values, classifications used and base populations must be considered when selecting
variables and analysing the data.
Data elements have been created to assist in grouping and thereby simplifying variable selection.
They are unique within a minor topic area but may not be unique across topic areas.
For example, the data element, Study type, exists under the major and sub-major topic area
Education: Post-school. This data element appears under two different minor topic areas: Study and
Current study. The Study minor topic area may include both past and current study (depending on the
22
LSAY 2003 cohort user guide
questionnaire sequencing). When identifying a data element and/or variable for use, it is therefore
important to consider other related data elements that may be located in a different topic area. This
is illustrated in figure 7 using an excerpt from the metadata workbook.
Figure 7 Identifying related topic areas
To identify variables for analysis and support accurate variable selection, refer to the topic maps
contained in ‘Topic maps’. Here relevant data elements can be identified by:
navigating to a major topic area of interest (for example, Education)
identifying a sub-major topic area of interest (for example, Post-school [education])
identifying a minor topic area of interest (for example, Current study)
inspecting the data elements available within that minor topic area (for example, Month
started study)
The number of times that data element appears within a wave is shown in the column corresponding
to the particular wave.
Before using and/or analysing the variables/data elements selected, it is important to consider:
variable attributes such as question wording, variable values, classifications used and base
populations
data elements which appear more than once within a wave
data elements which appear more than once across waves (for longitudinal analysis)
data elements of the same name across other topic areas (if applicable)
other data elements that may be closely linked within a topic area or across other topic areas.
NCVER
23
Variable naming conventions
PISA variables
PISA variables only exist in wave 1 of the Y03 cohort and have a separate variable naming convention.
Naming conventions for different types of PISA variables are summarised in table 5.
The questionnaire instruments for PISA are comprised of the following three components:
the Student Questionnaire (ST)
the Educational Careers Questionnaire (EC)
the Information Communication Technology Questionnaire (IC).
Most PISA variables are named using the following convention: questionnaire component, question
number, and question part (where applicable). For example, the variable:
ST16Q01 is question number 16 from the student questionnaire
EC06Q01 is question number 6 from the educational careers questionnaire
ST34Q03 is question number 34 (part c) from the student questionnaire
IC01Q01 is question number 1 from the ICT questionnaire.
Figure 8 PISA variable naming convention
PISA student
questionnaire
ST34Q03
Part 3 (c)
Question 34
Countries are also able to introduce country-specific questions in the PISA questionnaires, referred to
as ‘national options’ questions. These are denoted on the variable name by the last character ‘N’. For
example, the variable ST34Q15N is question number 34 from the student questionnaire, with part 15 a
national options question, denoted by the ‘N’ at the end of the variable name.
Plausible values are used to report student achievement in PISA. There are five plausible values for
each of the domains and sub-domains4 and the PISA student achievement variables take this
information into account in the variable name. For example, the variable:
PV1MATH points to the first plausible value in the maths domain.
PV4SCIE points to the fourth plausible value in the science domain.
PV1MATH1 points to the first plausible value in the first maths sub-domain: Mathematics — Space
and Shape
PV5MATH2 points to the fifth plausible value in the second maths sub-domain: Mathematics —
Change and Relationships domain.
4
The PISA 2003 major assessment domains are reading, mathematics, science and problem-solving. The PISA 2003
mathematics sub-domains are space and shape, change and relationship, uncertainty and quantity.
24
LSAY 2003 cohort user guide
Replicate weights have been used to estimate sampling variances for population estimates derived
from a complex sample design. The weights are simply named chronologically from W_FSTR1 to
W_FSTR80. The variable W_FSTUWT is the final student weight.
Detailed information about plausible values and replicate weights is available from the OECD PISA
2003 data analysis manuals located at:
<http://www.oecd.org/document/18/0,3343,en_32252351_32236173_35016146_1_1_1_1,00.html> .
Two types of indices are provided in the PISA dataset: simple indices and scale indices. Several
student- and school-level indices combine several answers provided by students or principals to build
a broader, not directly observable concept. These indices appear towards the end of the PISA data
and tend to be descriptive rather than having adopted a variable naming convention. For example:
AGE is a simple index.
CULTPOSS is a student-level scale index derived from cultural possessions (for example, classic
literature, books of poetry).
Table 6
Summary of PISA variable naming conventions
PISA variable
Examples of PISA
variable names
Description
Standard variables
ST16Q01
IC05Q01
EC01Q01
ST34Q03
The first two characters indicate the questionnaire instrument.
The PISA questionnaire instruments are the Student
Questionnaire (ST), the Educational Careers Questionnaire (EC)
and the Information Communication Technology Questionnaire
(ICT).
The following two digits indicate the question number (e.g. ST16
is question 16 from the student questionnaire).
The final three characters are the question part or sub-section.
So ST34Q03 is part 3 of question 16 from the student
questionnaire.
National options
ST34Q15N
The character ‘N’ at the end of the variable indicates that the
question is a national options question (i.e. a national, not
international question).
Student achievement/
plausible values
PV1MATH
PV1MATH1
PV4PROB
The first two characters ‘PV’ indicate the variable is a plausible
value. The next character indicates whether it is the first
plausible value up to the fifth plausible value.
The next four characters indicate the domain or sub-domain.
PV1MATH indicates that the variable is from the mathematics
domain, while PV1MATH1 indicates that the variable is from the
first maths sub-domain (Space and Shape).
For further information on plausible values, see section
‘Overview of the questionnaires: Plausible values’.
Replicate weights
W_FSTR1
W_FSTR80
Replicate weights are identified using the characters "W_FSTR"
followed by a chronological number.
For further information on replicate weights, see the PISA 2003
Data analysis manual.
Indices
AGE
HISCED
CULTPOSS
Student and school-level simple and scaled indices tend to be
descriptive rather than adopting a naming convention.
LSAY standard variables
Most variable names are constructed using four pieces of information: the questionnaire instrument,
the survey wave, the questionnaire section and the question number.
The character ‘L’ is used to identify the survey instrument, where L represents the LSAY survey
instrument (as opposed to the PISA survey instrument). A wave identifier is used to identify the survey
wave. The first survey (or wave) is allocated an A, the second survey a B up until wave 11, which is
NCVER
25
allocated a K. The section identifier is used to identify the section of the questionnaire. The question
identifier is used to identify the question number.
For example, the variable LBA009 refers to:
the LSAY survey instrument, denoted by the first character ‘L’
wave 2, denoted by the second character B
section A, denoted by the third character A
question 9, denoted by the last three characters 009.
Figure 9 LSAY standard variable naming convention
LSAY
questionnaire
LBA009
Question 9
Wave 2
Section A
LSAY non-standard variables
There are a series of other variables that do not take the standard variable naming convention
mentioned above. These variables are summarised in the table below.
Table 7
Summary of LSAY non-standard variable naming conventions
Non-standard
variable
Examples of nonDescription
standard variable names
Demographics
SEX
INDIG
Demographic variables, such as gender and Indigenous status,
tend to be descriptive rather than adopting a naming convention.
School characteristics
STATEID
SECTOR
School characteristics, such as state of the school and school
sector, tend to be descriptive rather than adopting a naming
convention.
Derived variables
XLFS2004
XCEL2005
Derived variables have been constructed across all waves to
summarise key information such as labour force status and
current education level.
For further information about derived variables see the section
on ‘Derived variables’.
IN flag
IN2003
IN2006
IN flags have been created for each survey year to indicate
whether a respondent participated in the survey in that year. If
the value of the IN flag is equal to 1, this indicates that the
respondent participated in the survey for that year.
IN flag variables are denoted by the two characters ‘IN’ followed
by four digits for the survey year.
Interview dates
DINT00
MINT00
YINT00
INTDAT00
INTSAS00
Day of interview, month of interview, and year of interview are
collected each survey year and consolidated into an interview
date variable.
Interview date variables are denoted by DINT for day of
interview, MINT for month of interview, YINT for year of
interview, and INTDAT for the consolidated interview date (in
both character and SAS® date format) followed by two digits for
the survey year.
26
LSAY 2003 cohort user guide
Non-standard
variable
Examples of nonDescription
standard variable names
Sample and derived
items
LBWSAMP1
LDWDV01
LEWSAM07
Sample and derived items look at information from previous
years surveys. They have been created to enable more efficient
and effective direction of questions. For example, the variable
LEWSAM07 looks at whether the respondent had a job at the
previous interview. Questions about whether respondents have
the same job as reported at their last interview would only be
asked of those who were recorded as being employed at the
previous interview.
Sample items are denoted by:
• the first character ‘L’ (to indicate the LSAY survey instrument
was used)
• followed by the wave identifier (A to F)
• followed by the character ‘W’
• followed by the characters ‘SAMP’ (up to wave 4, 2006),
‘SAM’ (from wave 5, 2007), or ‘DV’ for items derived by the
field contractor
• followed by one digit (up to wave 4, 2006) or two digits (from
wave 5, 2007) denoting the sample item.
Weights
WT06GEN
ACH06WT
WT2006
WT06GEN_P
ACH06WT_P
WT2006_P
Weight variables are denoted by the two characters ‘WT’ either
at the beginning or end of the variable name.
Population weights (weights that sum to the population rather
than the sample size) are denoted by an _P at the end of the
variable name.
For further information about weights see section, ‘Sample and
survey design – Weights’.
NCVER
27
Derived variables
A series of derived variables has been developed to simplify use of the LSAY data and provide useful
measures/indicators for analysis. The derived variables focus on the areas of educational attainment,
employment, measures of engagement in study and work, and social indicators.
The following table summarises the series of additional derived variables available on the Y03 dataset.
Derived variables are denoted by the character X, followed by several characters uniquely identifying
the derived variable; this is then followed by four digits for the survey year.
Detailed technical documentation outlining how the variables are derived as well as their properties
can be accessed at: <www.lsay.edu.au/publications/2487.html>.
Table 8
Derived variables
Indicators
Derived variable
Variable name
Education
Current school level
XCSLYYYY
Employment
Study and work
Social indicators
28
Current qualification level
XCELYYYY
Study status in VET
XVETYYYY
Study status in bachelor degree or higher
XBACYYYY
Full-time or part-time study status
XFTSYYYY
Highest school level completed
XHSLYYYY
Completed Year 12 or certificate II or higher
X122YYYY
Completed Year 12 or certificate III or higher
X123YYYY
Highest qualification level completed
XHELYYYY
Labour force status
XLFSYYYY
Full-time or part-time employment status
XFTPYYYY
Permanent or casual employment
XEMPYYYY
Status in apprentice/traineeship
XATRYYYY
Job mobility during last year
XMOBYYYY
Occupation (1 digit ANZSCO First Edition)
XOCCYYYY
Average weekly pay
XWKPYYYY
Average hourly pay
XHRPYYYY
Average weekly hours worked
XHRSYYYY
In full-time employment or full-time education
XFTEYYYY
Any spell of unemployment during the year
XUNEYYYY
Marital status
XMARYYYY
Living with parent(s)
XATHYYYY
Living in own home
XOWNYYYY
Number of dependent children
XCHIYYYY
LSAY 2003 cohort user guide
Sample and survey design
In 2003, a nationally representative sample of approximately 12 500 15-year-old students was selected
to participate in PISA conducted by the OECD.
The sampling process undertaken was a two-stage sampling scheme. The first stage of the sample is
that schools were selected with a probability proportional to the enrolment size of 15 year-olds. At
the second stage, a list of each school’s 15 year-old students was prepared and from each list, 50
students were randomly selected with equal probability. In schools with fewer than 50 students, all
15-year-olds were selected.
The 2003 PISA sample comprised 355 schools from all states and territories. This sample was designed
to be representative of students across Australia, using state/territory, school sector and region
(metropolitan or non-metropolitan) as strata. Smaller jurisdictions and Indigenous students were
oversampled to ensure that reliable results could be produced by state and Indigenous status. The
final 2003 PISA sample size was 12 551 individuals.
Of these, 10 370 were successfully contacted to undertake a follow-up telephone interview in 2003.
This interview collected further information on the respondent’s school experience, school and
post-school intentions, and part-time work. This group of young people became the third cohort of
LSAY. These respondents have since been contacted annually using computer-assisted telephone
interviews (CATI).
Further information on the survey design for the Y03 cohort can be found in LSAY technical paper no.
43, Sampling and weighting of the 2003 LSAY cohort, which can be accessed at:
<www.lsay.edu.au/publications/1962.html>.
Further information about the survey design for PISA 2003 can be found from the:
PISA 2003 Technical report which can be accessed at:
<http://www.oecd.org/dataoecd/49/60/35188570.pdf>
PISA 2003 Australian country report: Facing the future — A focus on mathematical literacy among
Australian 15-year-old students in PISA 2003 which can be accessed at:
<http://www.oecd.org/dataoecd/59/36/34624327.pdf>.
Response rates
Table 9 shows the final sample size for the PISA assessment, and the subsequent sample size for the
first wave of the LSAY Y03 cohort. Table 10 shows the sample sizes and response rates for each wave
of the LSAY Y03 cohort from 2003.
Table 9
Sample sizes: PISA and LSAY
PISA
LSAY
Age at 30 June
15.7
15.7
Sample size (n)
12 551
10 370
100
82.6
% of PISA
NCVER
29
Table 10 Sample sizes and response rates
Wave/year
1/2003
2/2004
3/2005
4/2006
5/2007
6/2008
7/2009
8/2010
9/2011
Age at 30 June
15.7
16.7
17.7
18.7
19.7
20.7
21.7
22.7
23.7
Sample size (n)
10 370
9 378
8 691
7 721
6 658
6 074
5 475
4 903
4 429
100
90.4
83.8
74.5
64.2
58.6
52.8
47.2
42.7
na
90.4
92.7
88.8
86.2
91.2
90.1
89.6
90.3
% of wave 1
% of previous wave
Sources of error
Estimates based on sample surveys have two major sources of error: non-sampling and sampling error.
A brief description of the two types and an outline of what can be done to overcome the effects of
these errors are given below.
Non-sampling error
Non-sampling error arises from inaccuracies in collecting, recording and processing the data.
Some common examples of non-sampling error include: non-response, incorrect responses, missing
responses, interviewer and processing error. Non-sampling error can be accounted for, in part, by
using weighted estimates to adjust for non-response. However, there are no statistical measures to
accurately adjust for other types of non-sampling error. Nevertheless, other types of non-sampling
error can be minimised through questionnaire design, training and monitoring of interviewers, the use
of computer-assisted interviews (CATI) and effective data-checking and processing procedures.
Non-response
All surveys suffer from error related to non-response. Non-response is a form of non-sampling error
that can be accounted for in the analysis of survey data. There are typically two forms of survey nonresponse:
Item non-response occurs when a respondent does not answer all the questions in the survey.
Unit non-response occurs when not all respondents answer the survey due to, for example, refusal
to participate, or inaccurate contact details.
Item non-response can be minimised with the use of CATI, which can forward-feed information from
previous interviews. Item non-response is generally treated using imputations. There are currently no
imputed data for missing values in LSAY. However, data users can apply a number of techniques to
help make the data more complete. The use of statistical modelling techniques, such as Multiple
Imputation (MI), allows data users to estimate item non-response, along with their respective
standard errors.
Unit non-response (also called attrition) can lead to biased population estimates and incorrect
standard errors, particularly if certain groups of the sample drop out at differing rates. Survey
attrition is counteracted by trying to maximise the year-on-year response rate, appropriate statistical
modelling techniques, and/or the application of appropriate survey weights.
30
LSAY 2003 cohort user guide
Weights
In order for the LSAY sample to more accurately represent the population of Australian 15-year-olds at
school in 2003, the collected sample must be weighted to account for differences from the original
population distribution that may have arisen during the sampling process.
In 2010, NCVER reviewed the weighting methodology used for the Y03 cohort. As a result of this
review, a logistic regression approach to weighting has been adopted. This methodology is consistent
with the approach taken to calculate the Y06 weights. These weights are provided in the latest Y03
dataset deposited with the ADA, alongside the previous version of the weights (denoted by an ‘_X’ at
the end of the weight variable name).
Further detailed information regarding the current weighting methodology used is available from
technical paper number 61, Weighting the LSAY PISA cohorts which can be accessed at:
<http://www.lsay.edu.au/publications/2429.html>5.
There are two weighting procedures applied to the LSAY data:
1. Sample weights reflect the original sample design, and ensure that the sample matches the
population distribution from which the original sample was drawn. In the Y03 cohort, two sampling
weights have been created. The first weights sum to the sample size for that given wave. For
example, the sample weights add to 10 371 in wave 1, 9378 in wave 2 etc. In the second set of
weights, the sum of the weights equals the original population from which the sample was drawn
(235 591). The distribution of stratum levels (state/territory, school sector and region) matches
that of the original population. Students from states and territories with smaller numbers of 15year-olds are over-sampled and students from states with larger numbers of 15-year-olds are
under-sampled. In order for the sample to more accurately represent the population of Australian
15-year-olds, the sample is weighted so that sample sizes within strata are proportional to the
population sizes of the strata.
2. Attrition weights are used to address unit non-response by ensuring that the distribution of the
sample matches the distribution of the sample population. Attrition weights used in LSAY account
for attrition from the PISA sample to the LSAY sample in the first wave (2003) and wave-on-wave
attrition from the first wave.
In calculating attrition weights, a non-response analysis was undertaken to determine the factors that
contributed to attrition. These factors are used to calculate attrition weights for both the attrition
from PISA to LSAY, and wave-on-wave attrition. The use of attrition weights ensures that distributions
in each wave (and from wave 1 to PISA) match those obtained in PISA (for the factors identified as
contributing to attrition). Logistic regressions have been used to calculate attrition weights. The
response variable of whether or not a respondent replied to the survey in a given year was regressed
against a series of factors that may contribute to non-response. The inverse of the predicted
probability of responding forms the attrition weights.
The final LSAY weights for each wave combine both the sample and attrition weights. Two sets of
final weights are produced. The first reproduces the sample sizes in each wave, and the second
5
Information regarding the original methodology used to create the weights for the Y03 cohort can be found in LSAY
technical paper no. 43, Sampling and weighting of the 2003 LSAY cohort, which can be accessed at:
<www.lsay.edu.au/publications/1962.html>.
NCVER
31
reproduces the population size (235 591) at each wave. In both cases, the distributions in each wave
match those obtained in the original population.
Users must be aware that bias resulting from survey attrition may not be fully accounted for in the
weighting strategies used. To allow users to determine the effectiveness of the attrition weights, data
in the cohort report demographic tables are presented both weighted and unweighted. The Y03
cohort reports can be accessed at: <www.lsay.edu.au/cohort/2003/101.html>. Researchers are
encouraged to determine their own weighting or analysis methodology to counteract attrition; this
may include using methods of multiple imputations for missing values.
Table 11 shows the three different types of available weights and the variable naming convention for
each, where YY and YYYY denote the survey year. Weights that sum to the population size are
denoted by ‘_P’ at the end of the weight variable name.
Table 11 Weight variables
Weight
Variables
Sum
Sample weight
WTYYGEN
Sample size in YY
Sample weight (N)
WTYYGEN_P
Population size (235 591)
Attrition weight
ACHYYWT
Sample size in YY
Attrition weight (N)
ACHYYWT_P
Population size (235 591)
Final weight
WTYYYY
Sample size in YYYY
Final weight (N)
WTYYYY_P
Population size (235 591)
Sampling error
Users of the LSAY data must consider the size of the sampling error when deriving or interpreting
estimates obtained from LSAY. Sampling error arises because estimates are obtained from the use of a
sample rather than from measuring the entire population. It is possible to select many different
individual samples from a single population; each of these would provide a different population
estimate. So an estimate obtained from a sample is subject to sample-to-sample variation (sampling
error). In random (probability) sampling, the size of the sampling error (for a given sample) is
measured using the standard error of the estimate.
It is important that users take into consideration the reliability of estimates obtained from survey
data. Standard errors, confidence intervals and relative standard errors (RSEs) can be calculated to
determine the reliability of the estimate(s).
The greatest contributor to standard error is the sample size. Small sample sizes generally result in
higher standard errors and wider confidence intervals. The RSE enables a comparison of the accuracy
between two different estimates. An estimate with a high RSE or wide confidence interval should be
used with caution, and users are advised against relying on estimates obtained from sample sizes of
fewer than five or estimates that have an RSE of greater than 25%.
In the LSAY cohort reports, estimates obtained from sample sizes of fewer than five respondents have
been highlighted using double asterisks. Estimates which have a relative standard error greater than
25% are highlighted using a single asterisk. The Y03 cohort reports can be accessed at:
<www.lsay.edu.au/cohort/introduction.html>.
32
LSAY 2003 cohort user guide
Standard errors
The standard error of an estimate indicates the accuracy to which that estimate approximates the
true population parameter. There are multiple methods for calculating the standard errors in complex
surveys. One method commonly used is the Taylor series expansion.6 This technique has been applied
to obtain estimates of standard errors for the LSAY cohort reports. These standard errors can then be
used to calculate confidence intervals and relative standard errors.
Confidence intervals
The confidence interval is an interval estimate of the population parameter. Sample estimates which
have high standard errors will have wide confidence intervals.
The mathematical derivation of a 95% confidence interval for a proportion is:
pˆ ± 2 × se( pˆ )
p̂
where
is the estimate obtained from the sample, and
se( pˆ ) is the standard error of the estimate
(typically obtained from a statistical analysis package).
Relative standard errors
The relative standard error (RSE) is a standardised measure that enables the comparison between
different estimates in terms of their reliability. The RSE is derived by dividing the standard error of
the estimate by the estimate itself, expressed as a percentage:
RSE ( pˆ ) =
se( pˆ )
× 100
pˆ
Examples
Consider the following estimates of highest school level completed (XHSL2008) to 2008 taken from the
Y03 cohort reports. In this example, estimates obtained from a large sample are compared with
estimates obtained from a small sample. Table 12 presents the highest school level for all respondents
(large sample), while Table 13 presents the highest school level obtained for those from remote areas
(small sample).
Table 12 Estimates, standard errors, RSEs and confidence limits for highest school level completed,
Y03 cohort in 2008 for a large sample (all respondents)
Level
Frequency
RSE (%)
95% confidence interval
Lower limit
Upper limit
Year 12
5189
82.57
0.70
0.85
81.17
83.96
Year 11
510
8.97
0.51
5.63
7.96
9.98
Year 10
357
7.81
0.49
6.30
6.83
8.80
0.65*
0.27
41.22
0.11
1.19
Year 9 or below
Total
Note:
6
Standard
error of %
%
18
6074
100
* Estimate has a relative standard error greater than 25%.
For further information on this technique, users should consult William Cochran, Sampling techniques, 3rd edn, John
Wiley and Sons, New York, 1977, sections 11.18, 11.91 and 11.20.
NCVER
33
Table 13 Estimates, standard errors, RSEs and confidence limits for highest school level completed,
Y03 cohort in 2008 for a small sample (remote respondents)
Level
Frequency
%
Standard
error of %
RSE (%)
95% confidence interval
Lower limit
Upper limit
Year 12
87
76.06
6.53
8.58
63.00
89.12
Year 11
12
18.34*
6.29
34.26
5.77
30.92
Year 10
8
4.85*
2.43
50.04
0.00
9.70
Year 9 or below
1
0.75**
0.75
100.84
-0.76
2.25
Total
108
100
Notes: * Estimate has a relative standard error greater than 25%.
∗∗ Estimate has a sample size of fewer than five.
Using this example, we see the estimate for all respondents who finished Year 12 is 82.57%, with a
RSE of 0.85%. The estimate for remote respondents who finished Year 12 is 76.06%, with a RSE of
8.58%. Both estimates have an RSE of less than 25%, so are considered reliable; however, the estimate
for remote respondents is much less reliable than the estimate for all respondents, given that the RSE
for remote respondents (8.58%) is considerably higher than the RSE of all respondents (0.85%).
In addition, we would not recommend using estimates obtained from respondents who have only
completed Year 9 or below (for both all and rural respondents), as the RSEs are higher than 25%.
Similarly, we would not recommend using any of the estimates obtained for remote respondents who
have completed Year 9 or below, Year 10 or 11, as RSEs of these estimates are also higher than 25%.
The interpretation of the confidence intervals (consider Year 12 for remote respondents in Table 12)
is: we are 95% confident that the true population estimate of Year 12 completion lies between 63.00
and 89.12%.
34
LSAY 2003 cohort user guide
Classifications and code frames
There are a number of variables contained in the LSAY datasets that are coded using standard
classifications. The information for these variables is collected using open-ended questions and
verbatim responses are recorded. These responses are then coded using standard classifications.
The details of these classifications are not provided in the data elements documents because they are
very lengthy and can be summarised in various ways. This section provides a summary of the
classifications and code frames used for each survey wave and references the relevant classifications
and code frames.
Table 14 Summary of classifications and code frames used in the LSAY Y03 dataset
Wave/year Education
Occupation
Industry
Institution
Country
Language
1/2003
ISCED 97
ISCO 88/
ASCO 2nd Edition
Not applicable
Not applicable
ISO country
code
ISO language
code
2/2004
ASCED
ASCO 2nd Edition
ANZSIC 1993
Institution code frame 1
Not applicable
Not applicable
3/2005
ASCED
ASCO 2nd Edition
ANZSIC 1993
Institution code frame 2
Not applicable
Not applicable
4/2006
ASCED
ANZSCO 1st Edition
ANZSIC 2006
Institution code frame 2
Not applicable
Not applicable
5/2007
ASCED
ANZSCO 1st Edition
ANZSIC 2006
Institution code frame 2
Not applicable
Not applicable
6/2008
ASCED
ANZSCO 1st Edition
ANZSIC 2006
Institution code frame 2
Not applicable
Not applicable
7/2009
ASCED
ANZSCO 1st Edition
ANZSIC 2006
Institution code frame 2
Not applicable
Not applicable
8/2010
ASCED
ANZSCO 1st Edition
ANZSIC 2006
Institution code frame 2
Not applicable
Not applicable
9/2011
ASCED
ANZSCO 1st Edition
ANZSIC 2006
Institution code frame 2
Not applicable
Not applicable
Notes: ISCED
ASCED
ISCO
ASCO
ANZSCO
ANZSIC
ISO
International Standard Classification of Education
Australian Standard Classification of Education
International Standard Classification of Occupations
Australian Standard Classification of Occupations
Australian and New Zealand Standard Classification of Occupations
Australian and New Zealand Standard Industrial Classification
International Organization for Standardization
Education
The International Standard Classification of Education (ISCED 1997) is used to code parental education
levels and expected student educational levels. These are collected in the first wave of the 2003
cohort as part of PISA.
The ISCED has the following categories:
None
ISCED 1 (primary education)
ISCED 2 (lower secondary)
ISCED 3B or 3C (vocational/pre-vocational upper secondary)
ISCED 3A (upper secondary) and/or ISCED 4 (non-tertiary post-secondary)
ISCED 5B (vocational tertiary)
ISCED 5A or 6 (theoretically oriented tertiary and post-graduate).
NCVER
35
Further information about ISCED is available at:
<http://www.uis.unesco.org/ev.php?ID=3813_201&ID2=DO_TOPIC>.
The Australian Standard Classification of Education7 (ASCED) is used to code the area of study from
wave 2 (2004).
Occupation
The International Standard Classification of Occupations (ISCO 88) is used to code parental occupation
and expected student occupation in the first wave of the 2003 cohort as part of PISA.
Further information about ISCO is available at:
<http://www.ilo.org/public/english/bureau/stat/isco/isco88/index.htm>
The Australian Standard Classification of Occupations8 (ASCO) 2nd Edition is used to code (the
remaining) occupational data from waves 1 to 3 (2003 to 2005). From wave 4 (2006), the Australian
and New Zealand Standard Classification of Occupations9 (ANZSCO) 1st Edition is used.
Industry
The Australian and New Zealand Standard Industrial Classification10 (ANZSIC) 1993 is used to code
industries for waves 2 and 3 (2004 to 2005). From wave 4 (2006), ANZSIC 2006 is used.
Institution
Non-standard institution code frames have been developed specifically for LSAY to enable consistent
coding of education institutions. These code frames are also used across other LSAY cohorts (for
example Y95, Y98 etc.).
The first code frame uses four digits to code institutions for wave 2 (2004).
The code frame was revised to incorporate information about the institution campus and uses six
digits to code institutions (including campus) from wave 3 (2005).
The institution code frames can be accessed at: <www.lsay.edu.au/publications/2225.html> under
the ‘supporting documents’ tab.
Country
The country codes used in PISA are the ISO 3166 country codes. The code frame uses eight digits to
code countries (for variables ISO_S, ISO_F and ISO_M) at wave 1 (2003) only.
The country codes can be accessed at: <www.lsay.edu.au/publications/2225.html> under the
‘supporting documents’ tab.
7
8
9
10
ABS 2001, Australian
ABS 1997, Australian
ABS 2006, Australian
ABS 1993, Australian
36
Standard Classification of Education (ASCED), cat.no.1272.0, ABS, Canberra.
Standard Classification of Occupations, 2nd edn, cat.no.1220.0, ABS, Canberra.
and New Zealand Standard Classification of Occupations, 1st edn, cat.no.1220.0, ABS, Canberra.
and New Zealand Standard Industrial Classification, cat.no.1292.0, ABS, Canberra.
LSAY 2003 cohort user guide
The ISO country codes provided have been sourced from the 2003 PISA Australian database and can be
accessed at: <http://www.acer.edu.au/ozpisa/au_db.html>.
Language
The language codes used in PISA are the ISO 639 language codes. The code frame uses six digits to
code languages (for variable LANG) at wave 1 (2003) only.
The language codes can be accessed at: <www.lsay.edu.au/publications/2225.html> under the
‘supporting documents’ tab.
The ISO language codes provided have been sourced from the 2003 PISA Australian database and can
be accessed at: <http://www.acer.edu.au/ozpisa/au_db.html>.
NCVER
37
Topic maps
The following series of topic maps list the data elements for each sub-major topic area by minor
topic area.
The digits within the tables indicate the:
survey waves in which this data element exists
number of times the data element appears within a wave. This is equivalent to the number of
variables that correspond to the data element in a single wave.
‘Topic map 1: Demographics — Student’ contains demographic information relating to respondents’
place of residence, gender, Indigenous status, date of birth and age, country of birth, language
spoken at home, and socioeconomic status.
‘Topic map 2: Demographics — Parent’ contains demographic information relating to a respondent’s
mother and father’s country of birth, occupation and education levels.
‘Topic map 3: Education — School’ contains school education information relating to respondents’
school characteristics, student characteristics, reasons for attending their school, extracurricular
activities, student achievement, perceptions about self and school, views on maths, use of computers,
time spent learning, study plans, careers advice, work experience, workplace learning, subjects and
courses undertaken, qualifications and results, and receipt of government payments.
‘Topic map 4: Education — School transition’ contains school transition information about intentions
and reasons for leaving school, post-school plans, and school leavers’ main activity since leaving
school.
‘Topic map 5: Education — Post-school’ contains post-school education information relating to study
(including current and past study, apprenticeships and traineeships), qualifications obtained, reasons
for withdrawing/deferring from study, changes in study status and/or details (including changes to
course, institution, employer, and apprentice or traineeship), satisfaction with study, careers advice,
perceptions about post-school study, views on maths/science/engineering/IT post-school study, and
government payments and income.
It is worth noting that within the following minor topic areas:
Study may refer to past and/or current study as well as apprenticeships and traineeships (for some
waves).
Current study may refer to apprenticeships and traineeships (for some waves).
Past study may refer to apprenticeships and traineeships (for some waves).
Apprenticeship/traineeships may refer to past and/or current apprenticeships (for some waves).
‘Topic map 6: Employment — Current’ contains the respondents’ current employment including:
employment characteristics, time worked, wages and benefits, when started and left work, reasons
for leaving work, employment while at school, post-school employment, job training, job satisfaction,
perceptions about their apprenticeship/traineeship, and perceptions about work.
38
LSAY 2003 cohort user guide
‘Topic map 7: Employment — Job history and training’ contains respondents’ job history and
training information (including any other employment currently undertaken by the respondent)
relating to employment characteristics, time worked, wages and benefits, job training undertaken,
reasons for leaving work, and perceptions about work.
‘Topic map 8: Employment — Seeking employment’ contains information about respondents’ jobseeking behaviour, including whether they were looking for work, job search activity details and
problems in looking for work.
‘Topic map 9: Employment — Not in the labour force’ contains respondents’ main activity while not
in the labour force and their prospects for seeking employment or commencing study.
‘Topic map 10: Social — Health, living arrangements and finance’ contains respondents’ information
about their living arrangements, household possessions, children, marriage, disability and health
(including associated funding), government payments, housing payments and financial circumstances.
‘Topic map 11: Social — General attitudes contains respondents’ information about what they do in
their leisure time, their interests, life satisfaction, job and life aspirations, community perceptions,
social problems encountered, relationships, and any volunteer work undertaken.
NCVER
39
Topic map 1: Demographics – Student
Wave/Year
Minor topic area
Data element
Place of residence
State
Postcode
1/2003
1
2/2004
3/2005
4/2006
5/2007
6/2008
7/2009
8/2010
9/2011
1
1
1
1
1
1
1
1
1
1
1
1
1
1
1
1
______________________________________________________________________________________________________________________________________________________________________________________________________________________________________________________________________________
Gender
Gender
2
______________________________________________________________________________________________________________________________________________________________________________________________________________________________________________________________________________
Indigenous
ATSI
1
______________________________________________________________________________________________________________________________________________________________________________________________________________________________________________________________________________
Date of birth/ age
Age
1
Date of birth: Month
1
Date of birth: Year
1
Date of birth
1
Date of birth: SAS date
1
______________________________________________________________________________________________________________________________________________________________________________________________________________________________________________________________________________
Country of birth
Country of birth: All
1
Country of birth: Major groups
1
Country of birth: ISO
1
Age of arrival in Australia
1
Immigration status
1
______________________________________________________________________________________________________________________________________________________________________________________________________________________________________________________________________________
Language spoken at home
40
Language spoken at home: All
1
LSAY 2003 cohort: user guide
Wave/Year
Minor topic area
Data element
1/2003
Language spoken at home: English/other
1
Language spoken at home: Major groups
1
Language spoken at home: ISO
1
2/2004
3/2005
4/2006
5/2007
6/2008
7/2009
8/2010
9/2011
______________________________________________________________________________________________________________________________________________________________________________________________________________________________________________________________________________
Socioeconomic status
Expected educational level (ISCED)
1
Expected occupation (ISEI)
1
Occupation: White/blue collar classification
1
Economic social cultural status
1
______________________________________________________________________________________________________________________________________________________________________________________________________________________________________________________________________________
NCVER
41
Topic map 2: Demographics – Parent
Wave/Year
Minor topic area
Data element
1/2003
Country of birth
Mother's country of birth: All
1
Mother's country of birth: Major groups
1
Mother's country of birth: ISO
1
Father's country of birth: All
1
Father's country of birth: Major groups
1
Father's country of birth: ISO
1
2/2004
3/2005
4/2006
5/2007
6/2008
7/2009
8/2010
9/2011
______________________________________________________________________________________________________________________________________________________________________________________________________________________________________________________________________________
Occupation
Mother's main activity
1
1
1
Mother works in job/business
1
1
Mother works full/part-time
1
1
Mother's occupation (ISCO)
1
Mother's occupation (ISEI)
1
Mother's occupation: White/blue collar
classification
1
Mother's occupation (ASCO)
Father's main activity
42
1
1
1
1
Father works in job/business
1
1
Father works full/part-time
1
1
Father's occupation (ISCO)
1
Father's occupation (ISEI)
1
Father's occupation: White/blue collar classification
1
LSAY 2003 cohort: user guide
Wave/Year
Minor topic area
Data element
1/2003
Father's occupation (ASCO)
Parents' occupation (ISEI)
Parents' occupation: White/blue collar
classification
2/2004
3/2005
4/2006
5/2007
6/2008
7/2009
8/2010
9/2011
1
1
1
______________________________________________________________________________________________________________________________________________________________________________________________________________________________________________________________________________
Education
Mother's schooling: Upper secondary
Mother's schooling: Vocational/pre-vocational
upper secondary
1
1
Mother's schooling: Lower secondary
1
Mother's schooling: Primary school
1
Mother's schooling: None
1
Mother's qualifications: University
1
Mother's qualifications: Post-secondary training
qualification
Mother's qualifications: Post-secondary training
certificate
1
1
Mother's qualifications: Post-secondary
1
qualification
Mother's highest education level
1
Father's schooling: Upper secondary
1
Father's schooling: Vocational/pre-vocational
upper secondary
NCVER
1
1
Father's schooling: Lower secondary
1
Father's schooling: Primary school
1
Father's schooling: None
1
43
Wave/Year
Minor topic area
Data element
Father's qualifications: University
Father's qualifications: Post-secondary training
qualification
Father's qualifications: Post-secondary training
certificate
1/2003
2/2004
3/2005
4/2006
5/2007
6/2008
7/2009
8/2010
9/2011
1
1
1
Father's qualifications: Post-secondary
1
qualification
Father's highest education level
1
Highest parental education level
1
1
______________________________________________________________________________________________________________________________________________________________________________________________________________________________________________________________________________
44
LSAY 2003 cohort: user guide
Topic map 3: Education – School
Wave/Year
Minor topic area
Data element
1/2003
2/2004
3/2005
4/2006
5/2007
School characteristics
Geographic location
1
School identifier
3
School state
1
1
2
2
1
School sector
1
1
1
1
1
1
1
School offers IB
Number of students in maths class
6/2008
7/2009
8/2010
9/2011
1
______________________________________________________________________________________________________________________________________________________________________________________________________________________________________________________________________________
Student characteristics
Student identifier
1
At school
1
2
2
2
2
1
1
1
1
1
1
1
1
1
1
1
1
At school (at last interview)
Year level
3
Study program
1
ISCED level
1
ISCED program
1
ISCED orientation
1
Studying for IB
1
Attended kindergarten/pre-school
1
Age commenced primary school
1
Changed primary school
1
Changed lower secondary school
1
Changed schools/same school
NCVER
1
1
45
Wave/Year
Minor topic area
Data element
1/2003
3/2005
4/2006
Changed schools: Month
1
1
Changed schools: Year
1
1
1
1
Missed primary school
1
Missed lower secondary school
1
Repeated year: Primary
1
Repeated year: Lower secondary
1
Repeated year: Year 11/12
1
Current school level (derived variable)
1
2/2004
1
5/2007
6/2008
7/2009
8/2010
9/2011
1
1
1
1
1
______________________________________________________________________________________________________________________________________________________________________________________________________________________________________________________________________________
Reasons for attending
Local
1
Better school
1
Study program
1
Religious philosophy
1
Family members
1
Other
1
______________________________________________________________________________________________________________________________________________________________________________________________________________________________________________________________________________
Activities
Sport
1
Music
1
Debating
1
Drama
1
School/peer support
1
Volunteer
1
______________________________________________________________________________________________________________________________________________________________________________________________________________________________________________________________________________
46
LSAY 2003 cohort: user guide
Wave/Year
Minor topic area
Data element
Student achievement
Maths pass mark
1
Plausible value in maths
5
Plausible value in maths: Space and shape
5
Plausible value in maths: Change and
relationships
1/2003
2/2004
3/2005
4/2006
5/2007
6/2008
7/2009
8/2010
9/2011
5
Plausible value in maths: Uncertainty
5
Plausible value in maths: Quantity
5
Plausible value in reading
5
Plausible value in science
5
Plausible value in problem-solving
5
______________________________________________________________________________________________________________________________________________________________________________________________________________________________________________________________________________
Perceptions about self and
Subject: English
1
school
Subject: Maths
1
Subjects: Overall
1
Classes: Students eager
1
Classes: Students' progress
1
Classes: Students worked hard
1
Classes: Students well behaved
1
Life at school: Preparation for adulthood
1
Life at school: Waste of time
1
Life at school: Give confidence
1
Life at school: Useful for job
1
Life at school: Outsider
1
NCVER
1
47
Wave/Year
Minor topic area
48
Data element
1/2003
Life at school: Make friends
1
Life at school: Belonging
1
Life at school: Awkward
1
Life at school: I'm liked
1
Life at school: Feel lonely
1
Life at school: Learn important things
1
Life at school: Feel happy
1
Life at school: Preparation for future
1
Life at school: Like learning
1
Life at school: Useful skills
1
Life at school: Enjoy being there
1
Life at school: Help in adult life
1
Life at school: I like to go to school
1
Life at school: Interesting work
1
Life at school: Learning is fun
1
Life at school: Worthwhile learning
1
Life at school: Feel safe and secure
1
Teachers: Get along with students
1
Teachers: Interested in students' well-being
1
Teachers: Listen
1
Teachers: Provide extra help
1
Teachers: Treat me fairly
1
Teachers: Know subject matter
1
2/2004
3/2005
4/2006
5/2007
6/2008
7/2009
8/2010
9/2011
1
1
1
LSAY 2003 cohort: user guide
Wave/Year
Minor topic area
Data element
1/2003
3/2005
4/2006
Teachers: Talk privately about schoolwork
1
1
Teachers: Talk privately about personal matters
1
1
Teachers: Explain things clearly
1
Teachers: Well prepared/organised
1
Teachers: Communicate well
1
Teachers: Maintain student interest
1
Teachers: Manage student discipline
1
Punctuality
1
Attitudes towards school
1
Student teacher relations
1
Belonging
1
2/2004
Friendships
1
Sport
1
Students treat me fairly
1
Feel part of community
1
5/2007
6/2008
7/2009
8/2010
9/2011
______________________________________________________________________________________________________________________________________________________________________________________________________________________________________________________________________________
Views on maths
NCVER
Attitudes: Enjoy reading
1
Attitudes: Make effort
1
Attitudes: Look forward
1
Attitudes: Enjoy maths
1
Attitudes: Improve career
1
Attitudes: Interested
1
Attitudes: Further study
1
49
Wave/Year
Minor topic area
50
Data element
1/2003
Attitudes: Help get job
1
Confidence: Timetable
1
Confidence: Discount
1
Confidence: Area
1
Confidence: Graphs
1
Confidence: Linear equations
1
Confidence: Distances
1
Confidence: Quadratic equations
1
Confidence: Rates
1
Feelings: Worry
1
Feelings: Not good
1
Feelings: Tense
1
Feelings: Good marks
1
Feelings: Nervous
1
Feelings: Learn quickly
1
Feelings: Best subject
1
Feelings: Feel helpless
1
Feelings: Understand difficult work
1
Feelings: Poor marks
1
Studying: Important parts
1
Studying: New ways
1
Studying: Check myself
1
Studying: Concepts
1
2/2004
3/2005
4/2006
5/2007
6/2008
7/2009
8/2010
9/2011
LSAY 2003 cohort: user guide
Wave/Year
Minor topic area
NCVER
Data element
1/2003
Studying: Everyday life
1
Studying: Solve in sleep
1
Studying: By heart
1
Studying: Relate to what already known
1
Studying: Examples
1
Studying: Clarify problem
1
Studying: Applied
1
Studying: What I need to learn
1
Studying: Procedure
1
Studying: Relate to other subjects
1
Studying: Understand reasons
1
Studying: Teacher explain
1
Classes: Be the best
1
Classes: Group work
1
Classes: Exams
1
Classes: Project work
1
Classes: Effort
1
Classes: Work with others
1
Classes: Do better
1
Classes: Enjoy helping
1
Classes: Learn most with other students
1
Classes: Best work
1
Frequency: Teacher interested
1
2/2004
3/2005
4/2006
5/2007
6/2008
7/2009
8/2010
9/2011
51
Wave/Year
Minor topic area
Data element
1/2003
Frequency: Students don't listen
1
Frequency: Teacher gives extra help
1
Frequency: Books
1
Frequency: Teacher helps
1
Frequency: Noise
1
Frequency: Teaches until understood
1
Frequency: Quieten down
1
Frequency: Can't work well
1
Frequency: Express opinions
1
Frequency: Late start
1
Interest
1
Motivation
1
Self-efficacy
1
Anxiety
1
Self-concept
1
Memorisation strategies
1
Elaboration strategies
1
Control strategies
1
Competitive learning
1
Cooperative learning
1
Teacher support
1
Disciplinary climate
1
2/2004
3/2005
4/2006
5/2007
6/2008
7/2009
8/2010
9/2011
______________________________________________________________________________________________________________________________________________________________________________________________________________________________________________________________________________
52
LSAY 2003 cohort: user guide
Wave/Year
Minor topic area
Data element
Use of computers
Available at home
2
Available at school
1
Available at other places
1
Used computer
1
How long used computers
1
Use computer at home
1
Use computer at school
1
Use computer other places
1
Frequency: Internet
1
Frequency: Play games
1
Frequency: Write documents
1
Frequency: Collaborate on Internet
1
Frequency: Use spreadsheets
1
Frequency: Download software
1
Frequency: Graphics programs
1
Frequency: Educational software
1
Frequency: School material
1
Frequency: Download music
1
Frequency: Write programs
1
Frequency: Email or chat rooms
1
How well: Start game
1
How well: Antivirus
1
How well: Open file
1
NCVER
1/2003
2/2004
3/2005
4/2006
5/2007
6/2008
7/2009
8/2010
9/2011
53
Wave/Year
Minor topic area
54
Data element
1/2003
How well: Create/edit document
1
How well: Scroll
1
How well: Database
1
How well: Copy
1
How well: Save
1
How well: Print
1
How well: Delete
1
How well: Move files
1
How well: Internet
1
How well: Download
1
How well: Attachments
1
How well: Create program
1
How well: Use spreadsheet
1
How well: Presentation
1
How well: Computer games
1
How well: Download music
1
How well: Multimedia
1
How well: Draw pictures
1
How well: Send emails
1
How well: Web page
1
Experience: Important
1
Experience: Fun
1
Experience: Interested
1
2/2004
3/2005
4/2006
5/2007
6/2008
7/2009
8/2010
9/2011
LSAY 2003 cohort: user guide
Wave/Year
Minor topic area
Data element
1/2003
Experience: Lose track of time
1
Taught about using computers
1
Taught about using the internet
1
Internet/entertainment use
1
Programs/software use
1
How well: Routine tasks
1
How well: Internet tasks
1
How well: High-level tasks
1
Attitudes
1
2/2004
3/2005
4/2006
5/2007
6/2008
7/2009
8/2010
9/2011
______________________________________________________________________________________________________________________________________________________________________________________________________________________________________________________________________________
Time spent learning
NCVER
Homework/other
1
Remedial classes
1
Enrichment classes
1
Tutor
1
Out-of-school classes
1
Other
1
Maths: Homework/other
1
Maths: Remedial classes
1
Maths: Enrichment classes
1
Maths: Tutor
1
Maths: Out-of-school classes
1
Maths: Other
1
Number of maths classes (week)
1
55
Wave/Year
Minor topic area
Data element
1/2003
Number of classes (week)
1
Maths homework ratio
1
Minutes of maths classes (week)
1
Minutes of classes (week)
1
Maths ratio
1
2/2004
3/2005
4/2006
5/2007
6/2008
7/2009
8/2010
9/2011
______________________________________________________________________________________________________________________________________________________________________________________________________________________________________________________________________________
Subjects/ courses
Maths class
1
Maths/science (at last interview[s])
1
School subject information
56
1
1
1
English
1
1
1
1
English subject
2
4
4
4
LOTE
1
1
1
1
LOTE subject
1
4
4
4
Maths
1
1
1
1
Maths subject
3
4
4
4
Science
1
1
1
1
Science subject
4
4
4
4
Business/computing
1
Business/computing subject
4
Business
1
1
1
Business subject
4
4
4
Computing
1
1
1
Computing subject
4
4
4
LSAY 2003 cohort: user guide
Wave/Year
Minor topic area
Data element
1/2003
2/2004
3/2005
4/2006
Humanities/SOSE
1
1
1
Humanities/SOSE subject
4
4
4
SOSE
1
SOSE subject
4
Creative/performing arts
1
1
1
1
Creative/performing arts subject
3
4
4
4
Health/PE
1
1
1
1
Health/PE subject
3
4
4
4
Home economics
1
1
1
1
Home economics subject
3
4
4
4
Design/technology
1
Design/technology subject
4
Technology
1
1
1
Technology subject
4
4
4
Other
1
1
1
1
Other subject
4
4
4
4
Subject level
159
5/2007
6/2008
7/2009
8/2010
9/2011
______________________________________________________________________________________________________________________________________________________________________________________________________________________________________________________________________________
Subjects/ courses: TAFE/ VET TAFE subjects
1
1
TAFE subjects part of apprenticeship/traineeship
1
1
Non-TAFE VET subjects
1
1
1
1
Non-TAFE VET subjects part of
apprenticeship/traineeship
NCVER
57
Wave/Year
Minor topic area
Data element
1/2003
2/2004
3/2005
4/2006
5/2007
6/2008
7/2009
8/2010
9/2011
______________________________________________________________________________________________________________________________________________________________________________________________________________________________________________________________________________
Subjects/ courses: VET
Number of VET subjects
1
1
1
VET subjects
1
1
VET subjects at school
1
1
VET subjects at TAFE
1
1
VET subjects at other training organisation
1
1
VET subjects part of apprenticeship/traineeship
1
1
English subject is VET
4
4
4
LOTE subject is VET
4
4
4
Maths subject is VET
4
4
4
Science subject is VET
4
4
4
Business subject is VET
4
4
4
Humanities/SOSE subject is VET
4
4
4
Creative/performing arts subject is VET
4
4
4
Health/PE subject is VET
4
4
4
Computing subject is VET
4
4
4
Home economics subject is VET
4
4
4
Technology subject is VET
4
4
4
Other subject is VET
4
4
4
______________________________________________________________________________________________________________________________________________________________________________________________________________________________________________________________________________
Study plans
58
Complete Year 10
1
Complete Year 10/11/other training
1
Complete Year 12
2
1
1
1
LSAY 2003 cohort: user guide
Wave/Year
Minor topic area
Data element
1/2003
Complete post-secondary certificate
1
Complete post-secondary qualification
1
Complete university
1
2/2004
3/2005
4/2006
5/2007
6/2008
7/2009
8/2010
9/2011
______________________________________________________________________________________________________________________________________________________________________________________________________________________________________________________________________________
Careers advice
Talk from career advisor
1
1
1
1
1
Written material
1
1
1
1
1
Group discussion
1
1
1
1
1
Discuss with career advisor
1
1
1
1
1
Online guidance
1
1
1
1
1
Talk from employer representative
1
1
1
1
1
Talk from TAFE or university representative
1
1
1
1
1
Usefulness: Talk from career advisor
1
1
1
1
1
Usefulness: Written material
1
1
1
1
1
Usefulness: Group discussion
1
1
1
1
1
Usefulness: Discuss with career advisor
1
1
1
1
1
Usefulness: Online guidance
1
1
1
1
1
Usefulness: Talk from employer representative
1
1
1
1
1
Usefulness: Talk from TAFE or Uni representative
1
1
1
1
1
______________________________________________________________________________________________________________________________________________________________________________________________________________________________________________________________________________
Work experience
Work experience
1
Number of days (actual)
1
Number of days (planned)
1
Number of days (total)
NCVER
1
1
59
Wave/Year
Minor topic area
Data element
1/2003
Work experience (undertaken)
2/2004
3/2005
4/2006
5/2007
6/2008
7/2009
8/2010
9/2011
1
Teaches what work is really like
1
1
Teaches about people
1
1
Teaches about instructions
1
1
Teaches about think for self
1
1
Teaches about confidence
1
1
Teaches about job skills
1
1
Teaches about work conditions
1
1
Teaches about your future career
1
1
______________________________________________________________________________________________________________________________________________________________________________________________________________________________________________________________________________
Workplace learning
60
Workplace learning
2
2
1
1
Number of days (actual)
1
Number of days (planned)
1
Number of days (total)
1
1
1
Workplace learning (undertaken)
1
1
1
Teaches what work is really like
1
1
1
1
Teaches about people
1
1
1
1
Teaches about instructions
1
1
1
1
Teaches about think for self
1
1
1
1
Teaches about confidence
1
1
1
1
Teaches about job skills
1
1
1
1
Teaches about work conditions
1
1
1
1
Teaches about your future career
1
1
1
1
LSAY 2003 cohort: user guide
Wave/Year
Minor topic area
Data element
1/2003
2/2004
3/2005
4/2006
5/2007
6/2008
7/2009
8/2010
9/2011
______________________________________________________________________________________________________________________________________________________________________________________________________________________________________________________________________________
Qualifications and results
Awarded certificate
1
1
1
1
Received any other certificate
1
1
1
1
Certificate name
2
2
2
1
Received (state specific) score
1
1
1
1
Result known
1
Result
Highest school level completed (derived variable)
Completed Year 12 or certificate II or higher
(derived variable)
Completed Year 12 or certificate III or higher
(derived variable)
1
1
1
1
1
1
1
1
1
1
1
1
1
1
1
1
1
1
1
1
1
1
1
1
1
1
1
1
1
1
1
______________________________________________________________________________________________________________________________________________________________________________________________________________________________________________________________________________
Government payments
Receiving YA/ABSTUDY
1
1
1
Amount received per fortnight (YA/ABSTUDY)
1
1
1
Stay on at school without YA/ABSTUDY
1
1
1
______________________________________________________________________________________________________________________________________________________________________________________________________________________________________________________________________________
NCVER
61
Topic map 4: Education - School transition
Wave/Year
Minor topic area
Data element
1/2003
2/2004
Plan to leave school
Reason: Have job/apprenticeship
1
1
Reason: Want job/apprenticeship
1
1
Reason: Not doing very well at school
1
1
Reason: Study/training not available at school
1
1
Reason: Don't like school
1
1
Reason: Financially difficult
1
1
Reason: Teachers
1
1
Reason: Earn own money
1
1
Reason: Parents
1
1
Reason: Subjects/courses not available at school
1
1
Reason: Year 12 wouldn't help get a job
1
1
1
1
1
1
Reason: Year 12 wouldn't help with further
study/training
Reason: Main reason
3/2005
4/2006
5/2007
6/2008
7/2009
8/2010
9/2011
______________________________________________________________________________________________________________________________________________________________________________________________________________________________________________________________________________
Post-school plans
Student plans
1
1
1
1
Parents' plans
1
Friends' plans
1
Study plans
1
1
1
1
Study plans: Type
1
1
1
1
______________________________________________________________________________________________________________________________________________________________________________________________________________________________________________________________________________
62
LSAY 2003 cohort: user guide
Wave/Year
Minor topic area
Data element
School leavers
2/2004
3/2005
4/2006
5/2007
Left school before completing Year 12
1
2
1
1
Month left school
1
1
1
1
1
Year left school
1
2
2
2
2
Year level left school
1
2
2
3
3
Feelings about having left school
2
1
1
1
1
Main activity
1
1
1
1
1
Reason: Have job/apprenticeship
1
1
1
1
1
Reason: To get job/apprenticeship
1
1
1
1
1
Reason: Not good at school
1
1
1
1
1
Reason: Study/training not available
1
1
1
1
1
Reason: Didn't like school
1
1
1
1
1
Reason: Financially difficult
1
1
1
1
1
Reason: Teachers
1
1
1
1
1
Reason: Earn own money
1
1
1
1
1
Reason: Parents
1
1
1
1
1
Reason: Subjects/courses not available at school
1
1
1
1
1
Reason: Year 12 wouldn't help get a job
1
1
1
1
1
1
1
1
1
1
1
1
1
1
1
1
1
1
1
Reason: Year 12 wouldn't help with further
study/training
Reason: Main reason
Main reason returned to school
1/2003
6/2008
7/2009
8/2010
9/2011
1
1
______________________________________________________________________________________________________________________________________________________________________________________________________________________________________________________________________________
NCVER
63
Wave/Year
Minor topic area
Data element
Main activity
Main activity
1/2003
2/2004
3/2005
4/2006
5/2007
6/2008
7/2009
8/2010
9/2011
1
1
1
1
1
1
1
______________________________________________________________________________________________________________________________________________________________________________________________________________________________________________________________________________
64
LSAY 2003 cohort: user guide
Topic map 5: Education - Post-school
Wave/Year
Minor topic area
Data element
Study
Study status (at last interview)
3/2005
4/2006
5/2007
6/2008
7/2009
8/2010
9/2011
1
1
1
1
1
1
1
6
6
6
6
5
5
5
Confirmation of study
1
1
1
1
1
1
1
Confirmation of deferred study
1
1
1
1
1
1
1
Resumption of deferred study
1
1
1
1
1
1
1
Still studying
1/2003
2/2004
4
Commenced study
1
1
1
1
1
1
1
1
Study type
1
1
1
1
1
1
1
1
Qualification
2
2
2
2
2
2
2
2
1
1
1
1
1
1
Qualification (at last interview)
Main area of study
1
2
2
2
2
2
2
2
Institution
1
2
2
2
2
2
2
4
Month started study
1
1
1
1
1
1
1
1
Year started study
1
1
1
1
1
1
1
1
Applied for university place
1
1
1
1
Intend to apply for university place
1
1
Intend to reapply for university place
2
2
First preference: Institution
1
1
1
1
First preference: Offered place
1
1
1
1
First preference: Reason did not take up place
1
1
2
First preference: Reason did not take up place
(taking break/holiday/travel)
NCVER
1
1
65
Wave/Year
Minor topic area
Data element
1/2003
2/2004
3/2005
4/2006
First preference: Reason did not take up place
First preference: Reason did not take up place
First preference: Reason did not take up place
First preference: Reason did not take up place
First preference: Reason did not take up place
1
(financial)
First preference: Reason did not take up place
1
(prefer to work)
First preference: Reason did not take up place
1
(prefer to study at TAFE)
First preference: Reason did not take up place
1
(other)
First preference: Reason did not take up place
(main reason)
1
1
University: Offered place
1
1
1
1
University: Institution
1
1
1
1
2
2
Accepted place (University)
University: Reason did not take up place (required
leaving home)
9/2011
1
(course costs)
break/holiday/travel)
8/2010
1
(considering options)
University: Reason did not take up place (taking
7/2009
1
(need YA)
University: Reason did not take up place
6/2008
1
(required leaving home)
66
5/2007
1
1
2
1
1
LSAY 2003 cohort: user guide
Wave/Year
Minor topic area
Data element
1/2003
2/2004
3/2005
4/2006
University: Reason did not take up place (need
University: Reason did not take up place
University: Reason did not take up place (course
University: Reason did not take up place (financial)
1
work)
University: Reason did not take up place (prefer to
1
study at TAFE)
University: Reason did not take up place (other)
1
University: Reason did not take up place (main
reason)
Study status in VET (derived variable)
9/2011
1
University: Reason did not take up place (prefer to
variable)
8/2010
1
costs)
Study status in bachelor degree or higher (derived
7/2009
1
(considering options)
(derived variable)
6/2008
1
YA)
In full-time employment or full-time education
5/2007
1
1
1
1
1
1
1
1
1
1
1
1
1
1
1
1
1
1
1
1
1
1
1
1
1
1
1
1
1
______________________________________________________________________________________________________________________________________________________________________________________________________________________________________________________________________________
Current study
NCVER
Study type
1
1
1
1
1
1
1
1
Qualification
1
1
1
1
1
1
1
1
Main area of study
1
2
2
2
2
2
2
2
Institution
3
5
5
5
5
5
5
10
Full-time or part-time study
3
3
4
4
4
4
4
4
Month started study
1
2
2
2
2
2
2
2
67
Wave/Year
Minor topic area
Data element
2/2004
3/2005
4/2006
5/2007
6/2008
7/2009
8/2010
9/2011
Year started study
1
2
2
2
2
2
2
2
Month expect to complete study
1
1
1
1
1
1
1
1
Year expect to complete study
1
1
1
1
1
1
1
1
1
1
1
1
1
1
1
1
1
1
1
1
1
1
1
1
1
1
Current qualification level (derived variable)
Full-time or part-time study status (derived
variable)
1/2003
______________________________________________________________________________________________________________________________________________________________________________________________________________________________________________________________________________
Past study
Study completed/withdrawn/deferred/changed
2
Main area of study
1
Institution
3
2
2
2
Full-time or part-time study
3
3
3
3
First preference
1
1
1
1
Month stopped study
3
3
3
Year stopped study
3
3
1
1
Highest qualification level completed (derived
variable)
1
2
2
2
2
2
2
2
2
2
2
2
2
2
4
3
3
3
3
3
3
3
3
3
3
3
3
3
3
3
1
1
1
1
1
1
______________________________________________________________________________________________________________________________________________________________________________________________________________________________________________________________________________
Apprenticeships/ traineeships
Still studying
1
Confirmation of apprenticeship/traineeship
68
1
1
1
2
2
2
2
1
1
1
1
1
1
1
Qualification
1
1
1
1
1
1
1
1
Main area of study
1
1
1
1
1
1
1
1
Employer type
1
1
1
1
1
1
1
1
Month started study
1
1
1
1
1
1
1
1
Year started study
1
1
1
1
1
1
1
1
LSAY 2003 cohort: user guide
Wave/Year
Minor topic area
Data element
2/2004
3/2005
4/2006
5/2007
6/2008
7/2009
8/2010
9/2011
Classes off-the-job training at TAFE
1
1
1
1
1
1
1
1
Provider of off-the-job training
1
1
1
1
1
1
1
1
1
1
1
1
1
1
1
1
Status in apprenticeship/traineeship (derived
variable)
1/2003
1
______________________________________________________________________________________________________________________________________________________________________________________________________________________________________________________________________________
Current apprenticeships/
Employer type
2
2
2
2
2
2
2
2
traineeships
Classes off-the-job training at TAFE
1
1
1
1
1
1
1
1
Provider of off-the-job training
1
1
1
1
1
1
1
1
2
2
2
2
2
2
Full-time or part-time study
Month expect to complete study
1
1
1
1
1
1
1
1
Year expect to complete study
1
1
1
1
1
1
1
1
______________________________________________________________________________________________________________________________________________________________________________________________________________________________________________________________________________
Past apprenticeships/
Study completed/withdrawn/deferred/changed
1
1
1
1
1
1
1
1
traineeships
Employer type
1
1
1
1
1
1
1
1
Month stopped study
1
1
1
1
1
1
1
1
Year stopped study
1
1
1
1
1
1
1
1
______________________________________________________________________________________________________________________________________________________________________________________________________________________________________________________________________________
Deferred/ withdrew from study
NCVER
Reason: Problems juggling study and work
1
1
1
1
1
1
1
1
Reason: Wanted job/apprenticeship/traineeship
1
1
1
1
1
1
1
1
Reason: Financially difficult
1
1
1
1
1
1
1
1
Reason: Lost interest
1
1
1
1
1
1
1
1
Reason: Never wanted to study
1
1
1
1
1
1
1
1
Reason: Course was not what you wanted
1
1
1
1
1
1
1
1
commitments
69
Wave/Year
Minor topic area
Data element
1/2003
2/2004
3/2005
4/2006
5/2007
6/2008
7/2009
8/2010
9/2011
Reason: Wouldn't have led to good job/career
1
1
1
1
1
1
1
1
Reason: Poor results
1
1
1
1
1
1
1
1
Reason: Study load
1
1
1
1
1
1
1
1
Reason: Never intended to complete the course
1
1
1
1
1
1
1
1
Reason: Access/transport
1
1
1
1
1
1
1
1
Reason: Health/personal reasons
1
1
1
1
1
1
1
1
Reason: Main reason
1
1
1
1
1
1
1
1
______________________________________________________________________________________________________________________________________________________________________________________________________________________________________________________________________________
Changed institutions
Same institution
5
7
7
7
7
7
7
7
5
7
7
7
7
7
7
7
Reason: Moved to get better quality education
5
7
7
7
7
7
7
7
Reason: You had been getting poor results
5
7
7
7
7
7
7
7
5
7
7
7
7
7
7
7
5
7
7
7
7
7
7
7
5
7
7
7
7
7
7
7
Reason: Because of health or personal reasons
5
7
7
7
7
7
7
7
Reason: Main reason
5
7
7
7
7
7
7
7
Reason: The place you moved from wasn't your
first choice
Reason: The course wasn't exactly what you
wanted
Reason: Desired course wasn't available at first
institution
Reason: Because of easier access or better
transport
______________________________________________________________________________________________________________________________________________________________________________________________________________________________________________________________________________
Changed course
Same course
Reason: Course costs were too high in the first
course
70
1
2
2
2
2
2
2
2
2
2
2
2
2
2
2
LSAY 2003 cohort: user guide
Wave/Year
Minor topic area
Data element
2/2004
3/2005
4/2006
5/2007
6/2008
7/2009
8/2010
9/2011
1
2
2
2
2
2
2
2
Reason: You didn't like the first course
1
2
2
2
2
2
2
2
Reason: Turned out to be not what you wanted
1
2
2
2
2
2
2
2
Reason: Better career prospects
1
2
2
2
2
2
2
2
Reason: You had been getting poor results
1
2
2
2
2
2
2
2
Reason: The study load was too heavy
1
2
2
2
2
2
2
2
1
2
2
2
2
2
2
2
Reason: Because of health or personal reasons
1
2
2
2
2
2
2
2
Reason: Main reason
1
2
2
2
2
2
2
2
Reason: The first course was a pre-requisite for
the second course
Reason: Would really have preferred to do the
second course
1/2003
______________________________________________________________________________________________________________________________________________________________________________________________________________________________________________________________________________
Changed/ left employer
Same employer
2
2
2
2
2
2
2
2
Circumstances of changing employer
3
3
3
3
3
3
3
3
Reason: Someone offered you a better job
2
2
2
2
2
2
2
2
2
2
2
2
2
2
2
2
2
2
2
2
2
2
2
2
2
2
2
2
2
2
2
2
Reason: Because of health or personal reasons
2
2
2
2
2
2
2
2
Reason: Main reason
2
2
2
2
2
2
2
2
2
2
2
2
2
2
2
2
Reason: You didn't get on with your boss/other
people at work
Reason: You weren't happy with the on-the-job
training
Reason: Because of problems with travelling or
transport
Way in which next job was better
Month changed employer
NCVER
2
2
2
2
71
Wave/Year
Minor topic area
Data element
Year changed employer
1/2003
2/2004
3/2005
4/2006
5/2007
6/2008
7/2009
8/2010
9/2011
2
2
2
2
2
2
2
2
______________________________________________________________________________________________________________________________________________________________________________________________________________________________________________________________________________
Changed/ stopped
Reason: Someone offered you a better job
1
1
1
1
1
1
1
1
apprenticeship/ traineeship
Reason: The pay was too low
1
1
1
1
1
1
1
1
Reason: You weren't happy with the job prospects
1
1
1
1
1
1
1
1
Reason: You basically didn't like the type of work
1
1
1
1
1
1
1
1
1
1
1
1
1
1
1
1
1
1
1
1
1
1
1
1
1
1
1
1
1
1
1
1
1
1
1
1
1
1
1
1
1
1
1
1
1
1
1
1
Reason: Because of health or personal reasons
1
1
1
1
1
1
1
1
Reason: Main reason
1
1
1
1
1
1
1
1
Reason: You didn't get on with your boss/other
people at work
Reason: You weren't happy with the on-the-job
training
Reason: You weren't happy with the off-the-job
training
Reason: You found the study or training too
difficult
Reason: Because of problems with travelling or
transport
______________________________________________________________________________________________________________________________________________________________________________________________________________________________________________________________________________
Satisfaction with study
72
Problem-solving skills
1
1
1
1
1
1
1
1
Analytic skills
1
1
1
1
1
1
1
1
Ability to work as a team member
1
1
1
1
1
1
1
1
Confidence in tackling unfamiliar problems
1
1
1
1
1
1
1
1
Communication skills
1
1
1
1
1
1
1
1
Work planning
1
1
1
1
1
1
1
1
LSAY 2003 cohort: user guide
Wave/Year
Minor topic area
Data element
1/2003
2/2004
3/2005
4/2006
5/2007
6/2008
7/2009
8/2010
9/2011
Overall satisfaction
1
1
1
1
1
1
1
1
Improved career prospects
1
1
1
1
1
1
1
1
1
1
1
1
1
1
Helped make contacts
Student life: Like being a tertiary student
1
1
1
1
1
1
Student life: Think student life suits you
1
1
1
1
1
1
Student life: Like campus atmosphere
1
1
1
1
1
1
Student life: Student life meets expectations
1
1
1
1
1
1
Student life: Made close friends
1
1
1
1
1
1
Problems: Paying fees
1
1
1
1
1
1
Problems: Juggling study/work
1
1
1
1
1
1
Problems: Course difficulty
1
1
1
1
1
1
Problems: Family/study commitments
1
1
1
1
1
1
1
1
1
1
1
1
Problems: Balancing personal relationships
1
1
1
1
1
1
Problems: Fitting in/making friends
1
1
1
1
1
1
Problems: Other commitments
1
1
1
1
1
1
Problems: Other
1
1
1
1
1
1
Problems: None of the above
1
1
1
1
1
1
Problems: Main problem
1
1
1
1
1
1
Problems: Caring for children/other family
members
______________________________________________________________________________________________________________________________________________________________________________________________________________________________________________________________________________
Careers advice
NCVER
Careers guidance officer
1
1
1
1
1
1
1
Questionnaire
1
1
1
1
1
1
1
73
Wave/Year
Minor topic area
Data element
1/2003
2/2004
3/2005
4/2006
5/2007
6/2008
7/2009
8/2010
Employer program
1
1
1
Job application assistance
1
1
1
1
1
1
1
Information about further study
1
1
1
1
1
1
1
1
1
Online career website or career planning tool
Usefulness: Careers guidance officer
1
1
1
Usefulness: Questionnaire
1
1
1
Usefulness: Employer program
1
1
1
Usefulness: Job application assistance
1
1
1
Usefulness: Information about further study
1
1
1
Usefulness
1
1
1
1
Source: Educational institution
1
1
1
1
Source: Government agency
1
1
1
1
Source: Employer program
1
1
1
1
Source: Private provider (you paid)
1
1
1
1
Source: Internet
1
1
1
1
Source: Family/friends
1
1
Source: Current employer
1
1
Source: Other
1
1
1
1
Source: Unknown
1
1
Reason for not accessing careers advice
1
1
1
1
9/2011
______________________________________________________________________________________________________________________________________________________________________________________________________________________________________________________________________________
Work experience
74
Influence post-school plans
1
Influence future plans
1
LSAY 2003 cohort: user guide
Wave/Year
Minor topic area
Data element
1/2003
2/2004
3/2005
4/2006
5/2007
6/2008
7/2009
8/2010
9/2011
______________________________________________________________________________________________________________________________________________________________________________________________________________________________________________________________________________
Perceptions about post-school
Fellow students are also close friends
1
study
Feel part of community
1
Lecturers treat me fairly
1
Students treat me fairly
1
______________________________________________________________________________________________________________________________________________________________________________________________________________________________________________________________________________
Studying science/ engineering/ Main area of study: Science/engineering/maths/IT
1
maths/ IT
Influence: Ability
1
Influence: Career
1
Influence: Careers advice
1
Influence: Teachers
1
Influence: Parents
1
Influence: School science
1
Influence: Employer
1
Influence: Employment
1
Influence: Parents'/relatives' career
1
Influence: None
1
Influence: Interest/enjoyment/ambitions
1
Influence: Pay
1
Influence: Pre-requisite for further study
1
Influence: Friends
1
Influence: Other
1
______________________________________________________________________________________________________________________________________________________________________________________________________________________________________________________________________________
NCVER
75
Wave/Year
Minor topic area
Data element
1/2003
2/2004
3/2005
4/2006
5/2007
Not studying science/
Influence: No desire
1
engineering/ maths/ IT
Influence: Poor pay
1
Influence: Careers advisor/teachers' advice
1
Influence: Parents
1
Influence: Teachers
1
Influence: Friends
1
Influence: Negative image
1
Negative image: Reason
1
Influence: None
1
Influence: Interest
1
Influence: Prefer other subjects
1
Influence: Ability
1
Influence: Other
1
Change decision: Nothing
1
Change decision: Ability
1
Change decision: Prefer other subjects
1
Change decision: More information
1
Change decision: Financial
1
Change decision: More exciting/creative
1
Change decision: Teaching
1
6/2008
7/2009
8/2010
9/2011
______________________________________________________________________________________________________________________________________________________________________________________________________________________________________________________________________________
Government payments and
76
Sources of income: YA/ABSTUDY
1
1
1
1
1
1
1
1
LSAY 2003 cohort: user guide
Wave/Year
Minor topic area
Data element
income
Youth Allowance/ABSTUDY
1/2003
2/2004
3/2005
4/2006
5/2007
6/2008
(independent/dependent)
NCVER
7/2009
8/2010
9/2011
1
1
1
Amount of YA/ABSTUDY
1
1
1
1
1
1
1
1
Sources of income: Paid work
1
1
1
1
1
1
1
1
Sources of income: Parents or family
1
1
1
1
1
1
1
1
Sources of income: Scholarship or cadetship
1
1
1
1
Sources of income: Scholarship
1
1
1
1
Sources of income: Cadetship
1
1
Sources of income: Other government allowance
1
1
1
1
1
1
1
1
Sources of income: Other
1
1
1
1
1
1
1
1
Sources of income: None
1
1
1
1
1
1
1
1
Course fees: None
1
1
1
1
1
1
1
1
Course fees: Respondent
1
1
1
1
1
1
1
1
Course fees: Parents/family
1
1
1
1
1
1
1
1
Course fees: Employer
1
1
1
1
1
1
1
1
Course fees: Government
1
1
1
1
1
1
1
1
Course fees: Other
1
1
1
1
1
1
1
1
Commonwealth supported (HECS)/full-fee paying
1
1
1
1
1
1
Commonwealth supported (HECS)
1
1
1
1
1
1
Full-fee paying
1
1
1
1
1
Full-fee paying: FEE-HELP
1
Full-fee paying: up-front
1
Full-fee paying: payment scheme
1
77
Wave/Year
Minor topic area
Data element
1/2003
2/2004
3/2005
4/2006
5/2007
6/2008
7/2009
8/2010
9/2011
Full-fee paying: employer
1
Full-fee paying: scholarship
1
______________________________________________________________________________________________________________________________________________________________________________________________________________________________________________________________________________
Economic climate
Study undertaken
1
1
Subjects/courses
1
1
Study plans
1
1
______________________________________________________________________________________________________________________________________________________________________________________________________________________________________________________________________________
78
LSAY 2003 cohort: user guide
Topic map 6: Employment – Current
Wave/Year
Minor topic area
Data element
Employment characteristics
Work in job/business/farm
1/2003
2/2004
3/2005
4/2006
5/2007
6/2008
7/2009
8/2010
9/2011
1
1
1
1
1
1
1
1
1
1
1
1
1
1
1
1
1
1
1
1
1
1
1
1
1
1
Still have job (reported at last interview)
Away from job
School holiday job
1
1
1
1
1
1
More than one job
1
1
1
1
1
1
1
1
1
Wages/salary/self-employed
1
1
1
1
1
1
1
1
1
Kind of work (ASCO)
1
1
1
1
1
1
1
1
1
Kind of work (ANZSCO)
Employer's main kind of business (ANZSIC)
1
1
1
1
1
1
1
1
Number of other jobs had
1
1
1
1
1
1
1
1
Change of work conditions: Pay
1
1
1
1
1
1
1
Change of work conditions: Skills
1
1
1
1
1
1
1
Change of work conditions: Responsibility
1
1
1
1
1
1
1
Change of work conditions: Promotion
1
1
1
1
1
1
1
Labour force status (derived variable)
Permanent or casual employment (derived
variable)
Occupation (1 digit ANZSCO First Edition) (derived
variable)
Job mobility during last year (derived variable)
NCVER
1
1
1
1
1
1
1
1
1
1
1
1
1
1
1
1
1
1
1
1
1
1
1
1
1
1
1
1
1
1
1
1
1
1
1
1
79
Wave/Year
Minor topic area
Data element
Any spell of unemployment during the year
(derived variable)
1/2003
2/2004
3/2005
4/2006
5/2007
6/2008
7/2009
8/2010
9/2011
1
1
1
1
1
1
1
1
1
______________________________________________________________________________________________________________________________________________________________________________________________________________________________________________________________________________
Time worked
Hours worked per week (present job)
1
1
1
1
1
1
1
1
1
1
1
1
1
1
1
1
1
1
1
1
1
1
1
1
1
1
1
1
1
1
1
1
1
Months worked (full-time)
18
19
19
19
19
19
Months worked (part-time)
18
19
19
19
19
19
No full-time work since last interview
1
1
1
1
1
1
No part-time work since last interview
1
1
1
1
1
1
Hours worked per week (main job if more than
one)
Hours worked per week (all jobs if more than one)
Hours worked per week (job reported at last
interview)
Months worked
14
Number of weeks worked
Full-time or part-time employment status (derived
variable)
Average weekly hours worked (derived variable)
18
1
1
1
1
1
1
1
1
1
1
1
1
1
1
1
1
1
1
1
1
______________________________________________________________________________________________________________________________________________________________________________________________________________________________________________________________________________
Wages and benefits
Frequency of pay
1
1
1
1
1
1
1
1
1
Gross pay
1
1
1
1
1
1
1
1
Hourly rate
1
1
1
1
1
1
1
1
1
1
1
1
1
1
1
1
1
1
1
1
Annual salary
Average weekly earnings
80
1
1
LSAY 2003 cohort: user guide
Wave/Year
Minor topic area
Data element
1/2003
2/2004
3/2005
4/2006
5/2007
6/2008
7/2009
8/2010
9/2011
Take-home pay
1
1
1
1
1
1
1
1
1
1
1
1
1
1
1
1
1
Annual/sick leave
Average weekly pay (derived variable)
1
1
1
1
1
1
1
1
1
Average hourly pay (derived variable)
1
1
1
1
1
1
1
1
1
______________________________________________________________________________________________________________________________________________________________________________________________________________________________________________________________________________
Starting work
Month began job
1
1
1
1
1
1
1
1
Year began job
1
1
1
1
1
1
1
1
How found job
1
1
1
1
1
1
1
1
______________________________________________________________________________________________________________________________________________________________________________________________________________________________________________________________________________
Leaving work
Main reason left job
2
2
2
2
2
2
2
Month left/finished job
2
2
2
2
2
2
2
Year left/finished job
2
2
2
2
2
2
2
______________________________________________________________________________________________________________________________________________________________________________________________________________________________________________________________________________
Looking for work
Prefer full-time or part-time work
1
1
1
1
1
1
1
1
Looking for full-time work
1
1
1
1
1
1
1
1
Looking for work
1
1
1
1
1
1
1
1
Looking for work (additional or to change jobs)
1
1
1
1
1
1
1
1
______________________________________________________________________________________________________________________________________________________________________________________________________________________________________________________________________________
Working in a job while at
Kind of work want as career
1
school
Enjoy work
1
Family needs money
1
Independence
1
Help get job
1
NCVER
81
Wave/Year
Minor topic area
Data element
1/2003
Own money
1
Spare time
1
Get behind in school work
1
Parents happy
1
Better marks
1
Post-school plans
1
Homework
1
Balancing work/school demands
1
Time studying
1
2/2004
3/2005
4/2006
5/2007
6/2008
7/2009
8/2010
9/2011
______________________________________________________________________________________________________________________________________________________________________________________________________________________________________________________________________________
Working in a job post-school
Full-time job since leaving school
1
1
1
1
1
Full-time job since leaving full-time study
1
1
1
1
1
Time taken to find full-time job
1
1
1
1
1
Still have job
1
1
1
1
1
______________________________________________________________________________________________________________________________________________________________________________________________________________________________________________________________________________
Job training
82
Classroom-based training
1
1
1
1
1
Hours of classroom-based training
1
1
1
1
1
Training outside workplace
1
1
1
1
1
Hours of training outside workplace
1
1
1
1
1
On-the-job training
1
1
1
1
1
Training helped get promotion or pay rise
1
1
1
1
1
Training could help to get promotion or pay rise
1
1
1
1
1
Training could help to get more responsibility
1
1
1
1
1
LSAY 2003 cohort: user guide
Wave/Year
Minor topic area
Data element
1/2003
2/2004
3/2005
4/2006
5/2007
6/2008
Training could help to get different type of job
1
1
1
1
1
Use of training
1
1
1
1
1
Suitable amount of training received
1
1
1
1
1
7/2009
8/2010
9/2011
______________________________________________________________________________________________________________________________________________________________________________________________________________________________________________________________________________
Job satisfaction
Like job as career
1
1
1
1
1
1
1
1
Job satisfaction: Kind of work
1
1
1
1
1
1
1
1
1
1
1
Job satisfaction: Use skills and experience
Job satisfaction: Immediate boss/supervisor
1
1
1
1
1
1
1
1
Job satisfaction: Other people
1
1
1
1
1
1
1
1
Job satisfaction: Pay
1
1
1
1
1
1
1
1
Job satisfaction: Opportunities for training
1
1
1
1
1
1
1
1
Job satisfaction: Tasks assigned
1
1
1
1
1
1
1
1
Job satisfaction: Recognition
1
1
1
1
1
1
1
1
Job satisfaction: Opportunities for promotion
1
1
1
1
1
1
1
1
______________________________________________________________________________________________________________________________________________________________________________________________________________________________________________________________________________
Perceptions about
Fellow workmates are also good friends
1
apprenticeship/ traineeship
Feel part of a team
1
Boss treats me fairly
1
Workmates treat me fairly
1
______________________________________________________________________________________________________________________________________________________________________________________________________________________________________________________________________________
Perceptions about work
NCVER
Fellow workmates are also good friends
1
Feel part of a team
1
Boss treats me fairly
1
83
Wave/Year
Minor topic area
Data element
8/2010
9/2011
Teaches what work is really like
1
1
Teaches about people
1
1
Teaches about instructions
1
1
Teaches about think for self
1
1
Teaches about confidence
1
1
Teaches about work conditions
1
1
Teaches about career you would like
1
1
Workmates treat me fairly
1/2003
2/2004
3/2005
4/2006
5/2007
6/2008
7/2009
1
______________________________________________________________________________________________________________________________________________________________________________________________________________________________________________________________________________
Economic climate
Hours worked
1
1
Type of work
1
1
Changing of jobs
1
1
Study undertaken
1
1
Study plans
1
1
______________________________________________________________________________________________________________________________________________________________________________________________________________________________________________________________________________
Aspirations
Wages
1
Frequency of pay
1
Would move to improve job opportunities
1
Main reason would not move for job opportunities
1
______________________________________________________________________________________________________________________________________________________________________________________________________________________________________________________________________________
84
LSAY 2003 cohort: user guide
Topic map 7: Employment - Job history and training
Wave/Year
Minor topic area
Data element
Employment characteristics
Work in job/business/farm (at last interview)
1/2003
2/2004
3/2005
4/2006
5/2007
6/2008
7/2009
8/2010
9/2011
1
1
1
1
1
1
1
1
1
1
1
1
1
1
1
1
1
1
1
1
1
1
1
1
1
1
1
1
Re-definition of second job as main job
Kind of work (ASCO)
1
1
Kind of work (ANZSCO)
Kind of work: Other/second job (ASCO)
1
1
Kind of work: Other/second job (ANZSCO)
Kind of work: Other/third job (ASCO)
1
1
Kind of work: Other/third job (ANZSCO)
Employer's main kind of business (ANZSIC)
1
1
1
1
1
1
1
1
1
1
1
1
1
1
1
1
1
1
1
1
1
Wages/salary/self-employed: Other/second job
1
1
1
1
1
1
1
1
Wages/salary/self-employed: Other/third job
1
1
1
1
1
1
1
1
Employer's main kind of business: Other/second
job (ANZSIC)
Employer's main kind of business: Other/third job
(ANZSIC)
______________________________________________________________________________________________________________________________________________________________________________________________________________________________________________________________________________
Time worked
Hours worked per week: Other/second job
1
1
1
1
1
1
1
1
Hours worked per week: Other/third job
1
1
1
1
1
1
1
1
______________________________________________________________________________________________________________________________________________________________________________________________________________________________________________________________________________
Wages and benefits
NCVER
Gross weekly pay: Other/second job
1
1
1
1
1
1
1
1
Gross weekly pay: Other/third job
1
1
1
1
1
1
1
1
Average weekly earnings: Other/second job
1
1
1
1
1
1
1
1
85
Wave/Year
Minor topic area
Data element
1/2003
2/2004
3/2005
4/2006
5/2007
6/2008
7/2009
8/2010
9/2011
Average weekly earnings: Other/third job
1
1
1
1
1
1
1
1
Hourly rate: Other/second job
1
1
1
1
1
1
1
1
Hourly rate: Other/third job
1
1
1
1
1
1
1
1
Annual salary: Other/second job
1
1
1
1
1
1
Annual salary: Other/third job
1
1
1
1
1
1
______________________________________________________________________________________________________________________________________________________________________________________________________________________________________________________________________________
Job training
86
Classroom-based training
1
1
1
1
1
Hours of classroom-based training
1
1
1
1
1
Training outside workplace
1
1
1
1
1
Hours of training outside workplace
1
1
1
1
1
On-the-job training
1
1
1
1
1
Training: Helped get promotion or pay rise
1
1
1
1
1
Training: More responsibility
1
1
1
1
1
Training: Different type of job
1
1
1
1
1
Suitable amount of training received
1
1
1
1
1
Importance of job skills: Communication
1
Importance of job skills: Teamwork
1
Importance of job skills: Problem-solving
1
Importance of job skills: Initiative and creativity
1
Importance of job skills: Planning and organisation
1
Importance of job skills: Self-management
1
Importance of job skills: Learning skills
1
Importance of job skills: Using technology
1
LSAY 2003 cohort: user guide
Wave/Year
Minor topic area
Data element
1/2003
2/2004
3/2005
4/2006
5/2007
6/2008
7/2009
Needs met by university studies: Communication
1
Needs met by university studies: Teamwork
1
Needs met by university studies: Problem solving
1
Needs met by university studies: Initiative and
8/2010
9/2011
1
creativity
Needs met by university studies: Planning and
1
organising
Needs met by university studies: Self-management
1
Needs met by university studies: Learning
1
Needs met by university studies: Using technology
1
______________________________________________________________________________________________________________________________________________________________________________________________________________________________________________________________________________
Leaving work
Main reason left job
Way in which next job was better
1
1
1
1
1
1
1
1
______________________________________________________________________________________________________________________________________________________________________________________________________________________________________________________________________________
NCVER
87
Topic map 8: Employment - Seeking employment
Wave/Year
Minor topic area
Data element
Looking for work
1/2003
2/2004
3/2005
4/2006
5/2007
6/2008
7/2009
8/2010
9/2011
Looking for work (in the last 4 weeks)
1
1
1
1
1
1
1
1
Looking for full-time or part-time work
1
1
1
1
1
1
1
1
Prefer full-time work
1
1
1
1
1
1
1
1
Available for work last week
1
1
1
1
1
1
1
1
______________________________________________________________________________________________________________________________________________________________________________________________________________________________________________________________________________
Job search activity
Looked for work
1
1
1
1
1
1
1
Number of weeks looking for work
1
1
1
1
1
1
1
Months looking for work
14
18
18
19
19
19
19
19
Registered with Centrelink
1
1
1
1
1
1
1
1
Checked Centrelink touchscreens
1
1
1
1
1
1
1
1
Checked/registered with Job Network member
1
1
1
1
1
1
1
1
Checked with another employment agency
1
1
1
1
1
1
1
1
1
1
1
1
1
1
1
1
1
1
1
1
1
1
1
1
1
1
1
1
1
1
1
Looked at advertisements in newspaper/on the
internet
Answered advertisements in newspapers/on the
internet
Contacted friends or relatives
Contacted friends
1
Contacted relatives
1
Written/phoned/approached an employer about a
job
Checked factory/workplace noticeboards
88
1
1
1
1
1
1
1
1
1
1
1
1
1
1
1
1
1
LSAY 2003 cohort: user guide
Wave/Year
Minor topic area
Data element
Posted resume on the internet/checked for replies
1/2003
2/2004
3/2005
4/2006
5/2007
1
1
1
1
Advertised/tendered for work (including on the
internet)
6/2008
7/2009
8/2010
9/2011
1
1
1
1
Asked school or another organisation for advice
1
1
1
1
1
1
1
1
Any other Job search activity
1
1
1
1
1
1
1
1
______________________________________________________________________________________________________________________________________________________________________________________________________________________________________________________________________________
Problems looking for work
NCVER
Health problems or some disability
1
1
1
1
1
1
1
1
Age discrimination
1
1
1
1
1
1
1
1
Problems with childcare
1
1
1
1
1
1
1
1
Don't have suitable transport
1
1
1
1
1
1
1
1
Not enough of the right kind of education
1
1
1
1
1
1
1
1
Don't have enough work experience
1
1
1
1
1
1
1
1
Not enough jobs available
1
1
1
1
1
1
1
1
Gender discrimination
1
1
1
1
1
1
1
1
Racial/ethnic background discrimination
1
1
1
1
1
1
1
1
Need better reading and writing skills
1
1
1
1
1
1
1
1
Don't have good interview skills
1
1
1
1
1
1
1
1
Lack of skills in writing job applications
1
1
1
1
1
1
1
1
Lack confidence
1
1
1
1
1
1
1
1
Not good with numbers
1
1
1
1
1
1
1
1
Poor language or communication skills
1
1
Age, gender or other discrimination
1
1
Other discrimination
1
1
89
Wave/Year
Minor topic area
Data element
1/2003
2/2004
3/2005
4/2006
5/2007
6/2008
7/2009
8/2010
9/2011
______________________________________________________________________________________________________________________________________________________________________________________________________________________________________________________________________________
Economic climate
Job prospects
1
1
Study plans
1
1
______________________________________________________________________________________________________________________________________________________________________________________________________________________________________________________________________________
90
LSAY 2003 cohort: user guide
Topic map 9: Employment - Not in the labour force
Wave/Year
Minor topic area
Data element
Main activity
Main activity
1/2003
2/2004
3/2005
4/2006
5/2007
6/2008
7/2009
8/2010
9/2011
1
1
1
1
1
1
1
1
______________________________________________________________________________________________________________________________________________________________________________________________________________________________________________________________________________
Education
Likelihood of beginning full-time study
1
1
1
1
1
1
1
1
Timeframe for beginning study
1
1
1
1
1
1
1
1
______________________________________________________________________________________________________________________________________________________________________________________________________________________________________________________________________________
Employment
Likelihood of seeking employment
1
1
1
1
1
1
1
1
Timeframe for seeking employment
1
1
1
1
1
1
1
1
______________________________________________________________________________________________________________________________________________________________________________________________________________________________________________________________________________
NCVER
91
Topic map 10: Social - Health, living arrangements and finance
Wave/Year
Minor topic area
Data element
Living arrangements
Type of accommodation
1/2003
Live with parents
3/2005
4/2006
5/2007
6/2008
7/2009
8/2010
9/2011
1
1
1
1
1
1
1
1
1
1
1
1
1
1
1
1
1
1
1
1
1
1
1
1
1
1
1
1
1
1
1
1
1
1
1
1
1
1
Brother/step-brother
1
1
1
1
1
1
1
1
Sister/step-sister
1
1
1
1
1
1
1
1
Husband/wife/de facto
1
1
1
1
1
1
1
1
Partner
1
1
1
1
1
1
1
1
Boyfriend/girlfriend
1
1
1
1
1
1
1
1
Father-in-law/partner's father
1
1
1
1
1
1
1
Mother-in-law/partner's mother
1
1
1
1
1
1
1
1
1
1
1
1
1
1
1
Own children
1
1
1
1
1
1
1
1
Non-relatives
1
1
1
1
1
1
1
1
Family structure
1
Number of (other) people in household
Number of older siblings
1
Number of younger siblings
1
Number of same-age siblings
1
Father/step-father
1
Male guardian
1
Mother/step-mother
1
Female guardian
1
Other relatives
92
2/2004
1
LSAY 2003 cohort: user guide
Wave/Year
Minor topic area
Data element
1/2003
2/2004
4/2006
5/2007
6/2008
7/2009
8/2010
9/2011
Husband/wife/partner currently working
1
1
1
1
1
1
Husband/wife/partner other activity
1
1
1
1
1
1
Husband/wife/partner works full-time or part-time
1
1
1
1
1
1
1
1
1
1
1
1
Grandparent(s)
3/2005
1
Husband/wife/partner current occupation
(ANZSCO)
Living with parent(s) (derived variable)
1
1
1
1
1
1
1
1
1
Living in own home (derived variable)
1
1
1
1
1
1
1
1
1
Number of dependent children (derived variable)
1
1
1
1
1
1
1
1
1
______________________________________________________________________________________________________________________________________________________________________________________________________________________________________________________________________________
Household possessions
NCVER
Desk
1
Own room
1
Quiet study place
1
Computer
1
Educational software
1
Internet
1
Calculator
1
Classic literature
1
Poetry books
1
Art
1
Textbooks
1
Dictionary
1
Dishwasher
1
93
Wave/Year
Minor topic area
Data element
1/2003
Number of books
1
Educational resources
1
Cultural possessions
1
2/2004
3/2005
4/2006
5/2007
6/2008
7/2009
8/2010
9/2011
______________________________________________________________________________________________________________________________________________________________________________________________________________________________________________________________________________
Children
Number of children
1
1
1
1
1
1
Age of child 1
1
1
1
1
1
1
Age of child 2
1
1
1
1
1
1
Age of child 3
1
1
1
1
Age of child 4
1
1
1
1
Age of child 5
1
Child(ren) are step-child(ren)/fostered
1
1
1
1
1
1
1
______________________________________________________________________________________________________________________________________________________________________________________________________________________________________________________________________________
Marriage
Marital status (at last interview)
1
1
1
1
1
Marital status
1
1
1
1
1
1
Month married
1
1
1
1
1
1
Year married
1
1
1
1
1
1
Lived together before marriage
1
1
1
1
1
1
Month started to live together
1
1
1
1
1
1
Year started to live together
1
1
1
1
1
1
1
1
1
1
1
1
Marital status (derived variable)
1
1
1
______________________________________________________________________________________________________________________________________________________________________________________________________________________________________________________________________________
Disability and health
94
General health
1
Height (units)
1
1
LSAY 2003 cohort: user guide
Wave/Year
Minor topic area
Data element
2/2004
3/2005
Height (cms)
1
Weight (units)
1
Weight (kg)
1
Disability/health problem limits amount or type of
work
Disability/health problem(s)
1
4/2006
5/2007
6/2008
7/2009
Disability/health problem(s): Seeing
1
Disability/health problem(s): Hearing
1
Disability/health problem(s): Skin/allergies
1
Disability/health problem(s): Heart/blood pressure
Disability/health problem(s):
Stomach/liver/kidney/digestive problem(s)
Disability/health problem(s): Diabetes
Disability/health problem(s): Depression/bad
nerves
Disability/health problem(s): Epilepsy
Disability/health problem(s): Dyslexia/other
learning problem(s)
Disability/health problem(s): Chronic fatigue/postviral syndromes
Disability/health problem(s): Other problem(s) or
disabilities
9/2011
4
1
Breathing/asthma/bronchitis
8/2010
1
Disability/health problem(s): Arms/legs/hands
Disability/health problem(s):
NCVER
1/2003
1
1
1
1
1
1
1
1
1
95
Wave/Year
Minor topic area
Data element
1/2003
2/2004
3/2005
4/2006
5/2007
6/2008
7/2009
8/2010
You felt nervous
1
You felt hopeless
1
You felt restless or fidgety
1
You felt that everything was an effort
1
You felt so sad that nothing would cheer you up
1
You felt worthless
1
9/2011
______________________________________________________________________________________________________________________________________________________________________________________________________________________________________________________________________________
Government payments
Youth Allowance/Newstart Allowance
1
1
1
1
1
1
1
1
Parenting Payment
1
1
1
1
1
1
1
1
Sickness Allowance
1
1
1
1
1
1
1
1
Disability Support Pension
1
1
1
1
1
1
1
1
Family Tax Benefit
1
1
1
1
1
1
1
1
Other
1
1
1
1
1
1
1
1
None of these
1
1
1
1
1
1
1
1
1
1
1
1
1
1
1
1
1
1
1
Amount per fortnight received in government
payments
Amount per year received in government
payments
______________________________________________________________________________________________________________________________________________________________________________________________________________________________________________________________________________
Housing payments
Frequency of housing payments
1
1
1
1
1
1
Amount of housing payments
1
1
1
1
1
1
______________________________________________________________________________________________________________________________________________________________________________________________________________________________________________________________________________
Finance
96
Use of credit card
1
1
1
1
Frequency of clearing debt on credit card(s)
1
1
1
1
LSAY 2003 cohort: user guide
Wave/Year
Minor topic area
Data element
6/2008
7/2009
8/2010
9/2011
Able to save money
1
1
1
1
Frequency of saving money
1
1
1
1
Managing financially
1
1
1
1
1
1
1
1
1
1
1
1
1
1
1
1
1
1
1
1
1
1
1
1
1
1
1
1
1
1
1
1
1
1
1
1
1
1
1
1
1
1
1
1
Shortage of money: Sold something because you
needed money
Shortage of money: Went without meals
Shortage of money: Had to ask family or friends for
money
Shortage of money: Had to borrow money
Shortage of money: Didn't get medicines or go to a
doctor
Shortage of money: Couldn't buy text books or
other study materials
Shortage of money: Couldn't buy other things you
needed
Shortage of money: Couldn't pay electricity, gas or
telephone bills
Shortage of money: Couldn't pay mortgage/rent on
time
Shortage of money: Couldn't afford to heat your
home
1/2003
2/2004
3/2005
4/2006
5/2007
______________________________________________________________________________________________________________________________________________________________________________________________________________________________________________________________________________
NCVER
97
Topic map 11: Social - General attitudes
Wave/Year
Minor topic area
Data element
1/2003
2/2004
3/2005
4/2006
5/2007
6/2008
Leisure
Hours spent watching TV
1
Hours spent listening to music
1
Hours spent playing sport
1
Hours spent reading for pleasure
1
Hours spent doing unpaid/volunteer work
1
Go to the library
1
1
1
1
1
1
Read books
1
1
1
1
1
1
Read newspapers or magazines
1
1
1
1
1
1
Use the internet
1
1
1
1
1
1
Play sport or do exercise
1
1
1
1
1
1
1
1
1
1
1
1
1
1
1
1
Go to church/place of worship
1
1
1
1
1
Volunteer
1
1
1
1
Play computer/video games
Community activities
1
7/2009
8/2010
9/2011
______________________________________________________________________________________________________________________________________________________________________________________________________________________________________________________________________________
Interests
98
Museum
1
Talking with friends
1
Writing stories/poems/plays
1
Building things
1
Solving problems/puzzles
1
Painting/drawing
1
LSAY 2003 cohort: user guide
Wave/Year
Minor topic area
Data element
1/2003
2/2004
Helping people
1
Making video/films
1
Cater for party
1
Reading scientific books/magazines
1
Thinking through problems
1
Driving trucks
1
Repairing things
1
Shopping
1
Performing
1
Machines and tools
1
3/2005
4/2006
5/2007
6/2008
Learning new things
1
Why the world's in the state it is
1
Why things happen the way they do
1
Things that you don't understand
1
New ideas
1
Finding out how something works
1
Improving skills after started work
1
Learning new skills after started work
1
7/2009
8/2010
9/2011
______________________________________________________________________________________________________________________________________________________________________________________________________________________________________________________________________________
Life satisfaction
NCVER
The work you do
1
1
1
1
1
1
1
1
What you do in your spare time
1
1
1
1
1
1
1
1
How you get on with people
1
1
1
1
1
1
1
1
The money you get each week
1
1
1
1
1
1
1
1
99
Wave/Year
Minor topic area
Data element
1/2003
2/2004
3/2005
4/2006
5/2007
6/2008
7/2009
8/2010
9/2011
Your social life
1
1
1
1
1
1
1
1
Your independence
1
1
1
1
1
1
1
1
Your career prospects
1
1
1
1
1
1
1
1
Your future
1
1
1
1
1
1
1
1
Your life at home
1
1
1
1
1
1
1
1
Your standard of living
1
1
1
1
1
1
1
1
The way the country is run
1
1
1
1
1
1
The state of the economy
1
1
1
1
1
1
Where you live
1
1
1
1
1
1
1
1
Your life as a whole
1
1
1
1
1
1
1
1
______________________________________________________________________________________________________________________________________________________________________________________________________________________________________________________________________________
Job aspirations
Type of job expect at age 30
1
Importance: Job security
1
Importance: Work/life balance
1
Importance: Enjoy work
1
Importance: Working hours
1
Importance: Money
1
Importance: Help others
1
Importance: High status
1
Importance: Team work
1
______________________________________________________________________________________________________________________________________________________________________________________________________________________________________________________________________________
Aspirations
Likelihood of achieving life goals
Influence of family
100
1
1
LSAY 2003 cohort: user guide
Wave/Year
Minor topic area
Data element
1/2003
Influence of friends
1
Influence of teachers
1
Influence of media
1
Influence of career advisor
1
Influence of work experience
1
2/2004
3/2005
4/2006
Personal goal
5/2007
6/2008
7/2009
8/2010
9/2011
1
1
______________________________________________________________________________________________________________________________________________________________________________________________________________________________________________________________________________
Community perceptions
Feel safe
1
Trusting
1
Opinions
1
Police
1
Trustworthy
1
______________________________________________________________________________________________________________________________________________________________________________________________________________________________________________________________________________
Problems
Self-esteem
1
Treated unfairly by police
1
Treated unfairly by teachers
1
Treated unfairly at work
1
Peer pressure
1
Vandalism
1
Conflict
1
______________________________________________________________________________________________________________________________________________________________________________________________________________________________________________________________________________
Relationships
NCVER
Importance: Close friends
1
1
Importance: Family members
1
1
101
Wave/Year
Minor topic area
Data element
1/2003
2/2004
3/2005
Importance: Household
4/2006
1
1
Importance: Neighbours
1
1
Importance: Friends' parents
1
1
Importance: Parents' friends/work mates
1
1
Frequency: Hang with friends
1
1
Frequency: Look after people
1
Frequency: Mother's relatives
1
1
Frequency: Father's relatives
1
1
Frequency: Visit friends' homes
1
1
Frequency: Have friends visit home
1
1
Frequency: Meals with friends/family
1
1
Frequency: Conversation with parents
1
1
1
1
with job
6/2008
7/2009
8/2010
9/2011
1
Importance: Relatives
Likelihood family friends/work contacts will help
5/2007
Number of close friends
1
Friendship group
1
Conflict
1
Friends: Employed/studying
1
Friends: Unemployed
1
Friends: Not in the labour force
1
______________________________________________________________________________________________________________________________________________________________________________________________________________________________________________________________________________
Volunteer
102
Canvassing/campaigning/fundraising
1
1
LSAY 2003 cohort: user guide
Wave/Year
Minor topic area
Data element
1/2003
2/2004
3/2005
4/2006
5/2007
6/2008
7/2009
Unpaid member of board or committee
1
1
Provide information
1
1
Help organise activities
1
1
Coaching/teaching
1
1
Collect, serve or deliver food
1
1
Provide health care/support/counselling
1
1
Other
1
1
Outcomes: Job-related skills
1
1
Outcomes: Helped get a job
1
1
8/2010
9/2011
______________________________________________________________________________________________________________________________________________________________________________________________________________________________________________________________________________
NCVER
103
Appendix A: Updates to the Y03 data file
The following table tracks updates made to the Y03 data files deposited with the Australian Data Archive. Users are encouraged to download the most recent version
of the data to ensure all updates are included.
Note that the version numbering convention adopted by the Australian Data Archive and reflected in the table below has been in place from the time the 2008 data
files were deposited.
Table 15 Summary of changes made to the Y03 data file
Wave/year
Version
Date published
Waves 1 to 9
(2003 to 2011)
5
December 2012
Variable
Variable
name
Number of
observations
affected
Description
-
Wave 9 (2011) variables added to data file
Corrections and modifications to some derived variables
Highest school level
completed
XHSL2006
Incorrect variable used in derivation and some respondents who had not
obtained a secondary school qualification were recorded as having completed
Year 12. Some respondents who had obtained a secondary school
qualification were not recorded as having completed Year 12.
136
XHSL2007
Incorrect values used in derivation and some respondents who had not
obtained a secondary school qualification were recorded as having completed
Year 12.
116
Changes to 'Highest school level completed' due to correction made to
'Highest school level completed' in previous year.
XHSL2008 to
XHSL2010
Changes to 'Highest school level completed' due to correction made to
'Highest school level completed' in previous year.
XHSL2008
104
XHSL2009
97
XHSL2010
Current qualification level
XCEL2004
90
Some respondents who were undertaking an apprenticeship/traineeship at an
unknown qualification level were incorrectly recorded as not studying for a
qualification. These respondents have now been recorded as undertaking a
certificate at an unknown qualification level.
Some respondents who were undertaking an apprenticeship/traineeship at an
104
LSAY 2003 cohort user guide
37
Wave/year
Version
Date published
Variable
Variable
name
Description
Number of
observations
affected
unknown qualification level were incorrectly recorded as not studying for a
qualification. These respondents have now been recorded as undertaking a
qualification at an unknown qualification level.
Respondents who were undertaking an apprentice/traineeship and whose
qualification type was a short course or recreational course, a single
module/subject only, unknown, or some other qualification than those listed,
were previously recorded as not studying for a qualification. The derivation
has been modified and these respondents are now recorded as undertaking a
certificate at an unknown qualification level.
XCEL2005 to
XCEL2010
Changes to 'Current qualification level ' due to correction made to 'Current
qualification level' in previous year.
Respondents who were undertaking an apprentice/traineeship and whose
qualification type was a short course or recreational course, a single
module/subject only, unknown, or some other qualification than those listed,
were previously recorded as not studying for a qualification. The derivation
has been modified and these respondents are now recorded as undertaking a
qualification at an unknown qualification level.
Highest qualification level
completed
XCEL2005
29
XCEL2006
32
XCEL2007
24
XCEL2008
13
XCEL2009
11
XCEL2010
4
XHEL2006
Changes to 'Highest qualification level completed' due to correction made to
'Current qualification level'.
1
XHEL2007
Changes to 'Highest qualification level completed' due to correction made to
'Current qualification level'.
3
Some respondents who had previously commenced and completed study but
had missed their last interview were incorrectly recorded as having not
completed a qualification. These respondents are now recorded as having
completed a qualification.
XHEL2008 to
XHEL2010
Changes to 'Highest qualification level completed' due to correction made to
'Current qualification level'.
Some respondents who had previously commenced and completed study but
had missed their last interview were incorrectly recorded as having not
completed a qualification. These respondents are now recorded as having
completed a qualification.
NCVER
105
Wave/year
Version
Date published
Variable
Variable
name
Number of
observations
affected
Description
Changes to 'Highest qualification level completed' due to correction made to
'Highest qualification level completed' in previous year.
Full-time or part-time study
status
XHEL2008
21
XHEL2009
32
XHEL2010
44
XFTS2004 to
XFTS2007
Changes to 'Full-time or part-time study status' due to correction made to
'Current qualification level'.
XFTS2004
37
XFTS2005
29
XFTS2006
32
XFTS2007
XFTS2008
24
Changes to 'Full-time or part-time study status' due to correction made to
'Current qualification level'.
53
Some respondents who were continuing study from a previous interview but
had missed their last interview were recorded as having an unknown full-time
or part-time study status. These records have been modified so that their fulltime or part-time study status from their previous interview is recorded.
Some respondents who were continuing study in a bachelor degree or higher
from a previous interview were recorded as not studying. These records have
been corrected so that their full-time or part-time study status from their
previous interview is recorded.
XFTS2009 to
XFTS2010
Status in bachelor degree or
higher
106
Changes to 'Full-time or part-time study status' due to correction made to
'Current qualification level'.
XFTS2009
11
XFTS2010
4
XBAC2005
One respondent who previously commenced and did not complete study in a
bachelor degree or higher level qualification was incorrectly recorded as
having never commenced a bachelor degree. This respondent has now been
recorded as having commenced but not completed a bachelor degree or
higher level qualification.
1
XBAC2006
Some respondents previously commenced and did not complete study in a
bachelor degree or higher level qualification were incorrectly recorded as
having never commenced a bachelor degree. These respondents have now
been recorded as having commenced but not completed a bachelor degree or
higher level qualification.
55
LSAY 2003 cohort user guide
Wave/year
Version
Date published
Variable
Variable
name
Description
Number of
observations
affected
Changes to 'Status in study in bachelor degree or higher' due to correction
made to 'Status in bachelor degree or higher' from previous year.
XBAC2007
200
Some respondents who previously commenced and did not complete study in
a bachelor degree or higher level qualification were incorrectly recorded as
having never commenced a bachelor degree. These respondents have now
been recorded as having commenced but not completed a bachelor degree or
higher level qualification.
Changes to 'Status in study in bachelor degree or higher' due to correction
made to 'Status in bachelor degree or higher' from previous year.
Changes to 'Status in study in bachelor degree or higher' due to corrections
made to 'Highest qualification level completed'. Some respondents who
previously commenced and completed study in a bachelor degree or higher
level qualification but had missed their last interview were incorrectly recorded
as having never commenced study in a bachelor degree or higher level
qualification. These respondents are now recorded as having completed a
bachelor degree or higher level qualification or completed and currently
undertaking a bachelor degree or higher level qualification.
XBAC2008
313
Some respondents who previously commenced and did not complete study in
a bachelor degree or higher level qualification were incorrectly recorded as
having never commenced a bachelor degree. These respondents have now
been recorded as having commenced but not completed a bachelor degree or
higher level qualification.
Changes to 'Status in study in bachelor degree or higher' due to correction
made to 'Status in bachelor degree or higher' from previous year.
Changes to 'Status in study in bachelor degree or higher' due to corrections
made to 'Highest qualification level completed'. Some respondents who had
previously commenced and completed study in a bachelor degree or higher
level qualification but had missed their last interview were incorrectly recorded
as having never commenced study in a bachelor degree. These respondents
are now recorded as having completed a bachelor degree or higher level
qualification or completed and currently undertaking a bachelor degree or
higher level qualification.
Some respondents who had previously commenced and did not complete
study in a bachelor degree or higher level qualification but had missed their
last interview were incorrectly recorded as having never commenced study in
a bachelor degree. These respondents are now recorded as having
commenced but not completed study in a bachelor degree or higher level
qualification.
XBAC2009 to
NCVER
Changes to 'Status in study in bachelor degree or higher' due to correction
107
Wave/year
Version
Date published
Variable
Variable
name
XBAC2010
Number of
observations
affected
Description
made to 'Status in bachelor degree or higher' from previous year.
Changes to 'Status in study in bachelor degree or higher' due to corrections
made to 'Highest qualification level completed'. Some respondents who had
previously commenced and completed study in a bachelor degree or higher
level qualification but had missed their last interview were incorrectly recorded
as having never commenced study in a bachelor degree or higher level
qualification. These respondents are now recorded as having completed a
bachelor degree or higher level qualification or completed and currently
undertaking a bachelor degree or higher level qualification.
Some respondents who had previously commenced but did not complete
study in a bachelor degree or higher level qualification but had missed their
last interview were incorrectly recorded as having never commenced study in
a bachelor degree or higher level qualification. These respondents are now
recorded as having commenced but not completed study in a bachelor degree
or higher level qualification.
Some respondents who had indicated in a previous interview that they had
commenced study in a bachelor degree or higher level qualification but did not
confirm that course of study in the current interview were recorded as having
commenced but not completed study in a bachelor degree. The derivation has
been modified and these respondents are now recorded as having never
commenced a bachelor degree.
Study status in VET
XBAC2009
269
XBAC2010
225
XVET2004
Not all available categories were used in the derivation and some respondents
undertaking an apprentice/traineeship at an unknown qualification level were
incorrectly recorded as having never commenced VET study. These
categories have now been added and these respondents are now recorded as
either currently undertaking or having commenced but not completed VET
study.
Changes to 'Study status in VET due to corrections made to 'Current
qualification level'.
XVET2005 to
XVET2006
Some respondents who had returned to school and had indicated in a
previous interview that they had commenced VET study were not able to
provide the outcome for that VET study but were recorded as having
commenced but not completed that VET study. The derivation has been
modified and these respondents are now recorded as having never
commenced VET study.
Changes to 'Study status in VET' due to corrections made to 'Current
qualification level'.
108
LSAY 2003 cohort user guide
38
Wave/year
Version
Date published
Variable
Variable
name
Description
Number of
observations
affected
Changes to 'Study status in VET' due to corrections made to 'Study status in
VET' from previous year.
Some respondents who had indicated in a previous interview that they had
commenced VET study but did not confirm that course of study in the current
interview were recorded as having commenced but not completed study in
VET. The derivation has been modified and these respondents are now
recorded as having never commenced VET study.
XVET2005
40
XVET2006
45
XVET2007
52
Some respondents who had returned to school and had indicated in a
previous interview that they had commenced VET study were not able to
provide the outcome for that VET study but were recorded as having
commenced but not completed that VET study. The derivation has been
modified and these respondents are now recorded as having never
commenced VET study.
Changes to 'Study status in VET' due to corrections made to 'Current
qualification level'.
Changes to 'Study status in VET' due to corrections made to 'Study status in
VET' from previous year.
Some respondents who had indicated in a previous interview that they had
commenced VET study but did not confirm that course of study in the current
interview were recorded as having commenced but not completed study in
VET. The derivation has been modified and these respondents are now
recorded as having never commenced VET study.
Some respondents who had completed or commenced VET study in a
previous interview but had missed their last interview were incorrectly
recorded as having never commenced VET study. These respondents are
now recorded as having completed VET study or commenced but did not
complete VET study.
Some respondents who had completed a bachelor degree or higher level
qualification and had also completed VET study were incorrectly recorded as
having never commenced VET study. These respondents are now recorded
as having completed VET study.
XVET2008
63
Changes to 'Study status in VET' due to corrections made to 'Current
qualification level'.
Changes to 'Study status in VET' due to corrections made to 'Study status in
VET' from previous year.
NCVER
109
Wave/year
Version
Date published
Variable
Variable
name
Number of
observations
affected
Description
Some respondents who had indicated in a previous interview that they had
commenced VET study but did not confirm that course of study in the current
interview were recorded as having commenced but not completed study in
VET. The derivation has been modified and these respondents are now
recorded as having never commenced VET study.
Some respondents who had completed or commenced VET study in a
previous interview but had missed their last interview were incorrectly
recorded as having never commenced VET study. These respondents are
now recorded as having completed VET study or commenced but did not
complete VET study.
Some respondents who had completed a bachelor degree or higher level
qualification and had also completed VET study were incorrectly recorded as
having never commenced VET study. These respondents are now recorded
as having completed VET study.
XVET2009
Changes to 'Study status in VET' due to corrections made to 'Current
qualification level'.
92
Changes to 'Study status in VET' due to corrections made to 'Study status in
VET' from previous year.
Some respondents who had indicated in a previous interview that they had
commenced VET study but did not confirm that course of study in the current
interview were recorded as having commenced but not completed VET study.
The derivation has been modified and these respondents are now recorded as
having never commenced VET study.
Some respondents who had completed or commenced VET study in a
previous interview but had missed their last interview were incorrectly
recorded as having never commenced VET study. These respondents are
now recorded as having completed VET study or having commenced but did
not complete VET study.
Some respondents who had completed a bachelor degree or higher level
qualification and had also completed VET study were incorrectly recorded as
having never commenced VET study. These respondents are now recorded
as having completed VET study.
Changes to 'Study status in VET' due to corrections made to 'Highest
qualification level completed'.
XVET2010
Changes to 'Study status in in VET due to corrections made to 'Current
qualification level'.
Changes to 'Study status in VET' due to corrections made to 'Study status in
VET' from previous year.
110
LSAY 2003 cohort user guide
146
Wave/year
Version
Date published
Variable
Variable
name
Description
Number of
observations
affected
Some respondents who had indicated in a previous interview that they had
commenced VET study but did not confirm that course of study in the current
interview were recorded as having commenced but not completed VET study.
The derivation has been modified and respondents are now recorded as
having never commenced VET study.
Some respondents who had completed or commenced VET study in a
previous interview but had missed their last interview were incorrectly
recorded as having never commenced VET study. These records have been
corrected so that they are now recorded as having completed VET study or
commenced but did not complete VET study.
Some respondents who had completed a bachelor degree or higher level
qualification and had also completed VET study were incorrectly recorded as
having never commenced VET study. These respondents are now recorded
as having completed VET study.
Changes to 'Study status in VET' due to corrections made to 'Highest
qualification level completed'.
One respondent who had completed a bachelor degree or higher level
qualification, had also completed VET study and was undertaking VET study
was recorded as undertaking VET study. The derivation has been modified
and this respondent is now recorded as having completed VET study.
Completed Year 12 or
certificate II or higher
X1222006 to
X1222008
Changes to 'Completed Year 12 or certificate II or higher' due to correction
made to 'Highest school level completed'.
X1222006
127
X1222007
99
X1222008
83
X1222009 to
X1222010
Changes to 'Completed Year 12 or certificate II or higher' due to correction
made to 'Highest school level completed'.
Changes to 'Completed Year 12 or certificate II or higher' due to correction
made to 'Highest qualification level completed'.
Incorrect value used in derivation and some respondents who had completed
a qualification at an unknown qualification level were incorrectly assigned as
having completed Year 12 or certificate II or higher level qualification. These
respondents have now been recorded as not having completed Year 12 or a
certificate II or higher level qualification.
X1222009
93
X1222010
Completed Year 12 or
NCVER
X1232004
82
15
Not all available categories were used in derivation and some respondents
111
Wave/year
Version
Date published
Variable
Variable
name
certificate III or higher
Number of
observations
affected
Description
were incorrectly recorded as not having completed Year 12 or certificate II or
higher level qualification. This category has been added and these
respondents are now recorded as having completed Year 12 or a certificate II
or higher level qualification.
X1232006 to
X1232008
Changes to 'Completed Year 12 or certificate II or higher' due to correction
made to 'Highest school level completed'.
X1232006
130
X1232007
103
X1232008
X1232009 to
X1232010
88
Changes to 'Completed Year 12 or certificate II or higher' due to correction
made to 'Highest school level completed'.
Changes to 'Completed Year 12 or certificate II or higher' due to correction
made to 'Highest qualification level completed'.
Incorrect value used in derivation and some respondents who had completed
a qualification at an unknown qualification level were incorrectly assigned as
having completed Year 12 or certificate II or higher level qualification. These
respondents are now recorded as not having completed Year 12 or a
certificate III or higher level qualification.
Status in
apprenticeship/traineeship
X1232009
96
X1232010
84
XATR2007
One respondent who had previously commenced but not completed an
apprentice/traineeship but had missed their last interview was incorrectly
recorded as having never commenced an apprentice/traineeship. This
respondent is now recorded as having commenced but not completed an
apprentice/traineeship.
XATR2008 to
XATR2010
Changes to 'Status in apprenticeship/traineeship' due to correction made to
'Status in apprenticeship/traineeship' in previous year.
1
Respondents who had previously completed or commenced but not completed
an apprentice/traineeship but had missed their last interview were incorrectly
recorded as having never commenced an apprentice/traineeship. These
respondents are now recorded as having completed or commenced but not
completed an apprentice/traineeship.
XATR2008
3
XATR2009
5
XATR2010
Any spell of unemployment
112
XUNE2004 to
9
Some respondents who were unemployed were incorrectly recorded as not
LSAY 2003 cohort user guide
Wave/year
Version
Date published
Variable
Variable
name
Description
during the year
XUNE2005
having a spell of unemployment during the year. These respondents are now
recorded as having a spell of unemployment during the year.
Number of
observations
affected
XUNE2004
149
XUNE2005
In full-time employment or fulltime education
Waves 1 to 8
(2003 to 2010)
4
7
XUNE2007
Variable missing from derivation and some respondents who were
unemployed were incorrectly recorded as not having a spell of unemployment
during the year. These respondents are now recorded as having a spell of
unemployment during the year.
XFTE2004 to
XFTE2009
Changes to 'In full-time employment or full-time education' due to correction
made to 'Full-time or part-time study status'.
4
XFTE2004
5
XFTE2005
1
XFTE2006
2
XFTE2007
1
XFTE2008
36
XFTE2009
2
December 2011
Wave 8 (2010) variables added to dataset
-
Minor corrections made to some derived variables
Current qualification level
XCEL2009
Some respondents who had ceased their apprenticeship/ traineeship from the
previous year were incorrectly assigned as continuing their
apprenticeship/traineeship from the previous year.
Study status in VET
XVET2009
Changes to ‘Study status in VET’ due to correction made to XCEL2009.
Study status in bachelor degree XBAC2004
or higher
XBAC2005
234
24
1
Changes to ‘Study status in bachelor degree or higher’. Respondents who had
commenced a university diploma or advanced diploma were incorrectly
assigned as having commenced a bachelor degree.
1
XBAC2007
1
XBAC2009
Full-time or part-time study
status
Average weekly pay
XWKP2004
4
Changes to ‘Full-time or part-time study status’ due to correction made to
XCEL2009.
216
Changes to ‘Weekly pay’ in 2004 and 2005 due to typographical error in
calculation. Some respondents with valid records for weekly pay were
incorrectly assigned as missing.
414
XWKP2005
NCVER
196
113
Wave/year
Version
Date published
Number of
observations
affected
Variable
Variable
name
Description
In full-time employment or fulltime education
XFTE2009
Changes to ‘In full-time employment or full-time education’ due to correction
made to XCEL2009.
Average weekly pay
XWKP2003
33
Minor modifications made to some derived variables
Average hourly pay
Added ‘not applicable’ category for those who are not employed or not in the
labour force
5118
XWKP2004
3939
XWKP2005
3066
XWKP2006
1411
XWKP2007
956
XWKP2008
905
XHRP2003
5118
XHRP2004
3939
XHRP2005
3066
XHRP2006
1411
XHRP2007
956
XHRP2008
905
XHRS2003
5118
XHRS2004
3939
XHRS2005
3066
XHRS2006
1411
XHRS2007
956
XHRS2008
905
XHRS2009
Waves 1 to 7
(2003 to 2009)
3.1
22 March 2011
842
Minor changes made to derived variable labels and formats
Current school level
XCSLYYYY
Current qualification level
XCELYYYY
Study status in VET
XVETYYYY
Study status in bachelor degree XBACYYYY
or higher
114
LSAY 2003 cohort user guide
Wave/year
Version
Date published
Variable
Variable
name
Full-time or part-time study
status
XFTSYYYY
Highest school level completed
XHSLYYYY
Completed Year 12 or
certificate II or higher
X122YYYY
Completed Year 12 or
certificate III or higher
X123YYYY
Highest qualification level
completed
XHELYYYY
Labour force status
XLFSYYYY
Full-time or part-time
employment status
XFTPYYYY
Permanent or casual
employment
XEMPYYYY
Status in
apprenticeship/traineeship
XATRYYYY
Job mobility during last year
XMOBYYYY
Occupation (1 digit ANZSCO
First Edition)
XOCCYYYY
Average weekly pay
XWKPYYYY
Average hourly pay
XHRPYYYY
Average weekly hours worked
XHRSYYYY
In full-time employment or fulltime education
XFTEYYYY
Any spell of unemployment
during the year
XUNEYYYY
Marital status
XMARYYYY
Living with parent(s)
XATHYYYY
Living in own home
XOWNYYYY
Number of dependent children
XCHIYYYY
Description
Number of
observations
affected
Revision to calculation of weights – removed location variable from regression
analysis
Final weight 2003
NCVER
WT2003
10370
115
Wave/year
116
Version
Date published
Number of
observations
affected
Variable
Variable
name
Attrition weight 2003
ACH03WT
10370
Final weight 2003 (PISA
population)
WT2003_P
10370
Attrition weight 2003 (PISA
population)
ACH03WT_P
10370
Description
Final weight 2004
WT2004
9378
Attrition weight 2004
ACH04WT
9378
Final weight 2004 (PISA
population)
WT2004_P
9378
Attrition weight 2004 (PISA
population)
ACH04WT_P
9378
Final weight 2005
WT2005
8691
Attrition weight 2005
ACH05WT
8691
Final weight 2005 (PISA
population)
WT2005_P
8691
Attrition weight 2005 (PISA
population)
ACH05WT_P
8691
Final weight 2006
WT2006
7721
Attrition weight 2006
ACH06WT
7721
Final weight 2006 (PISA
population)
WT2006_P
7721
Attrition weight 2006 (PISA
population)
ACH06WT_P
7721
Final weight 2007
WT2007
6658
Attrition weight 2007
ACH07WT
6658
Final weight 2007 (PISA
population)
WT2007_P
6658
Attrition weight 2007 (PISA
population)
ACH07WT_P
6658
Final weight 2008
WT2008
6074
Attrition weight 2008
ACH08WT
6074
Final weight 2008 (PISA
population)
WT2008_P
6074
LSAY 2003 cohort user guide
Wave/year
Version
Date published
Variable
Variable
name
Attrition weight 2008 (PISA
population)
ACH08WT_P
6074
Final weight 2009
WT2009
5475
Attrition weight 2009
ACH09WT
5475
Final weight 2009 (PISA
population)
WT2009_P
5475
Attrition weight 2009 (PISA
population)
ACH09WT_P
5475
Study status in bachelor
degree or higher
XBAC2007
2
XBAC2008
10
Full-time or part-time study
status
XFTS2009
216
Labour force status
XLFS2003
5118
Permanent or casual
employment
XEMP2003
5118
XEMP2004
258
XEMP2005
161
XEMP2006
122
XEMP2007
69
XEMP2008
28
Description
Number of
observations
affected
Minor modifications made to some derived variables
Job mobility during last year
NCVER
XEMP2009
28
XMOB2003
5118
XMOB2004
1587
XMOB2006
1
XMOB2009
1855
Occupation (1 digit ANZSCO
First Edition)
XOCC2004
87
XOCC2005
77
Average weekly pay
XWKP2003
5694
XWKP2004
4873
XWKP2005
3781
XWKP2006
1958
117
Wave/year
Waves 1 to 7
(2003 to 2009)
Version
3
Date published
Variable
Variable
name
Number of
observations
affected
Description
XWKP2007
1439
XWKP2008
1361
XWKP2009
1246
Average hourly pay
XHRP2009
852
In full-time employment or fulltime education
XFTE2009
33
Number of dependent children
XCHI2009
1
Wave 7 (2009) variables added to dataset
28 September
2010
-
School ID
SCHOOLID
School identifier added to support school level analysis
All
Student ID (PISA)
STIDSTD
PISA student and school identifier variables added
All
School ID (PISA)
SCHOOLID_P
All
Revisions to weights due to change in weighting methodology
118
Sample weight 2003
WT03GEN
10370
Attrition weight 2003
ACH03WT
10370
Final weight 2003
WT2003
10370
Sample weight 2004
WT04GEN
9378
Attrition weight 2004
ACH04WT
9378
Final weight 2004
WT2004
9378
Sample weight 2005
WT05GEN
8691
Attrition weight 2005
ACH05WT
8691
Final weight 2005
WT2005
8691
Sample weight 2006
WT06GEN
7721
Attrition weight 2006
ACH06WT
7721
Final weight 2006
WT2006
7721
Sample weight 2007
WT07GEN
6658
Attrition weight 2007
ACH07WT
6658
Final weight 2007
WT2007
6658
Sample weight 2008
WT08GEN
6074
LSAY 2003 cohort user guide
Wave/year
Version
Date published
Variable
Variable
name
Attrition weight 2008
ACH08WT
6074
Final weight 2008
WT2008
6074
Description
Number of
observations
affected
Original weights overwritten by revised weights; original weights retained
and renamed (denoted by an _X)
Weight 2003
WT2003_X
10370
Sample weight 2004
WT04GEN_X
9378
Final attrition weight 2004
WT2004_X
9378
Weight for sample 2005
WT05GEN_X
8691
Final attrition weight 2005
WT2005_X
8691
Sample weight 2006
WT06GEN_X
7721
Final attrition weight 2006
WT2006_X
7721
Weight for sample 2007
WT07GEN_X
6658
Attrition weight 2007
ACH07WT_X
6658
Final attrition weight 2007
WT2007_X
6658
Sample weight 2008
WT08GEN_X
6074
Attrition weight for 2008
ACH08WT_X
6074
Final attrition weight 2008
WT2008_X
6074
PISA weights added to dataset
NCVER
Sample weight 2003 (PISA
population)
WT03GEN_P
10370
Attrition weight 2003 (PISA
population)
ACH03WT_P
10370
Final weight 2003 (PISA
population)
WT2003_P
10370
Sample weight 2004 (PISA
population)
WT04GEN_P
9378
Attrition weight 2004 (PISA
population)
ACH04WT_P
9378
Final weight 2004 (PISA
population)
WT2004_P
9378
Sample weight 2005 (PISA
population)
WT05GEN_P
8691
119
Wave/year
Version
Date published
Number of
observations
affected
Variable
Variable
name
Attrition weight 2005 (PISA
population)
ACH05WT_P
8691
Final weight 2005 (PISA
population)
WT2005_P
8691
Sample weight 2006 (PISA
population)
WT06GEN_P
7721
Attrition weight 2006 (PISA
population)
ACH06WT_P
7721
Final weight 2006 (PISA
population)
WT2006_P
7721
Sample weight 2007 (PISA
population)
WT07GEN_P
6658
Attrition weight 2007 (PISA
population)
ACH07WT_P
6658
Final weight 2007 (PISA
population)
WT2007_P
6658
Sample weight 2008 (PISA
population)
WT08GEN_P
6074
Attrition weight 2008 (PISA
population)
ACH08WT_P
6074
Final weight 2008 (PISA
population)
WT2008_P
6074
Current qualification level
XCEL2004
2
XCEL2005
16
XCEL2006
43
XCEL2007
42
XCEL2008
45
XVET2004
8
Description
Minor modifications made to some derived variables
Study status in VET
120
XVET2005
126
XVET2006
321
XVET2007
350
XVET2008
461
LSAY 2003 cohort user guide
Wave/year
Version
Date published
Variable
Variable
name
Description
Number of
observations
affected
Study status in bachelor degree XBAC2006
or higher
XBAC2005
48
XBAC2006
48
XBAC2007
59
XBAC2008
61
XFTS2008
165
XFTE2008
124
X1222005
28
X1222006
45
X1222007
45
X1222008
39
X1232005
13
X1232006
24
X1232007
28
X1232008
23
XHEL2005
100
XHEL2006
284
XHEL2007
310
Full-time or part-time study
status
16
XHEL2008
272
XLFS2003
5118
XEMP2003
5118
XMOB2003
5118
XMOB2004
1587
Minor modifications to formats
Birth month
NCVER
ST02Q02
Birth year
ST02Q03
Lives with
ST04Q01ST04Q05
Mother’s schooling
ST11Q01ST11Q05
121
Wave/year
122
Version
Date published
Variable
Variable
name
Father’s schooling
ST13Q01ST13Q05
Possessions
ST17Q01ST17Q13
Relative time spent on maths
homework
RMHMWK
Minutes of maths per week
MMINS
Total minutes of instructional
time p/w
TMINS
Ratio of maths
PCMATH
Computer facilities at home
COMPHOME
Home educational resources
HEDRES
Cultural possessions of the
family
CULTPOSS
Economic social cultural status
ESCS
Attitudes towards school
ATSCHL
Student-teacher relations at
school
STUREL
Sense of belonging to school
BELONG
Interest in mathematics
INTMAT
Instrumental motivation in
mathematics
INSTMOT
Mathematics self-efficacy
MATHEFF
Mathematics anxiety
ANXMAT
Mathematics self-concept
SCMAT
Memorisation strategies
MEMOR
Elaboration strategies
ELAB
Control strategies
CSTRAT
Competitive learning
COMPLRN
Co-operative learning
COOPLRN
Teacher support in maths
lessons
TEACHSUP
Description
Number of
observations
affected
LSAY 2003 cohort user guide
Wave/year
Version
Date published
Variable
Variable
name
Disciplinary climate in maths
lessons
DISCLIM
ICT: Internet/entertainment
use
INTUSE
ICT: Programs/software use
PRGUSE
ICT: Confidence in routine
tasks
ROUTCONF
ICT: Confidence in internet
tasks
INTCONF
ICT: Confidence in high-level
tasks
HIGHCONF
ICT: Attitudes towards
computers
ATTCOMP
Interviewed in 2004
IN2004
Interviewed in 2005
IN2005
Description
Waves 1 to 6
(2003 to 2008)
2
October 2009
Derived variables added to the dataset
Waves 1 to 6
(2003 to 2008)
1
June 2009
Wave 6 (2008) variables added to dataset
NCVER
Number of
observations
affected
See section
‘Derived variables’
in this publication
-
SCHOOLID
School ID
School identifier removed from the data set as it reveals information about a
school’s state and/or sector.
All
SCHID_R
School ID revised
To enable investigation of the affect of school on student achievement etc., a
randomised school identifier has been added to the dataset(s).
All
123
National Centre for Vocational Education Research Ltd
Level 11, 33 King William Street, Adelaide, South Australia
PO Box 8288, Station Arcade, SA 5000 Australia
Telephone +61 8 8230 8400 Facsimile +61 8 8212 3436
Website www.ncver.edu.au Email [email protected]