1
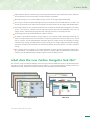
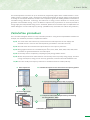
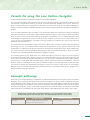
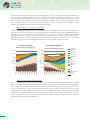
A User’s Guide
The Institute for Global Environmental Strategies (IGES) and the National Institute for
Environmental Studies (NIES) jointly developed the Japan 2050 Low Carbon Navigator, a
simulation tool for energy supply and demand scenarios that aim at building a low-carbon
society with a long-term perspective towards 2050.
Japan 2050 Low Carbon Navigator (Low Carbon Navigator) is built on the modelling
framework of the UK 2050 Pathways Calculator1. The UK Department of Energy & Climate
Change (DECC) published the first 2050 Pathways Calculator in 2010. Since then, it has
been used as a practical tool by policymakers, academia, the business sector, the general
public and teachers at schools to help explore the various options on how the UK can best
meet energy needs while achieving the ambitious 80% GHG reduction target by 2050.
Over the past three years, another five national or regional 2050 Pathways Calculators
were developed in China’s Mainland, Republic of Korea, Belgium (Wallonia region),
Taiwan and India.
Acknowledgements
The core team of Japan 2050 Low Carbon Navigator fully appreciates those Japanese
experts and the 2050 Pathways Calculator Team at the UK DECC who provided advice and
assistance from a scientific and practical point of view. We would also like to acknowledge
the support that we received in various ways from the British Embassy Tokyo and the
Ministry of the Environment of Japan for the implementation and promotion of the project.
1
https://www.gov.uk/2050-pathways-analysis
Why have we developed the Japan 2050
Low Carbon Navigator?
Japan approved its Fourth Basic Environment Plan in April 2012 with an ambitious long-term target to reduce
greenhouse gas (GHG) emissions by 80%. Following the Great East Japan Earthquake and the Fukushima
nuclear accident in 2011, all nuclear reactors have stopped operating as of July 2014. Without nuclear energy,
which accounted for about 25% of the total electricity generation and a lion’s share in low-carbon and more
independent energy scenarios, there will be great uncertainty in Japan’s energy and climate policies. As a
result, Japan is now placed at the crossroads for deciding on its future energy structure and low-carbon
technologies which can best ensure energy security while at the same time achieving the ambitious long-term
mitigation target. We believe that the Low Carbon Navigator, supported by its transparent dataset and userfriendly interface for presenting the results, can be a useful tool for engaging domestic policy dialogues
among various stakeholders and for education purposes of university students and the general public.
What can the Japan 2050 Low Carbon
Navigator do?
As a pathways simulation tool, the Low Carbon Navigator can help policymakers as well as the energy
producers and consumers (including the public) to understand the energy and emission-related choices that
Japan faces. It allows users to develop their own pathway combinations to achieve emissions reduction and
ensure energy security based on available resources, technologies and behavioural changes. This transparent
and handy tool can help answer the fundamental questions of how the energy system can evolve over the
coming decades and its impact on GHG emissions, energy security, energy mix for electricity generation and
related costs. It can provide a platform for engaging in dialogues on the challenges and opportunities of the
future energy system and the responses to climate change by addressing such critical issues as:
If there is no nuclear power generation, what will be the energy mix if Japan wants to achieve 80%
emissions reduction by 2050? What will be the costs compared with moderately keeping nuclear power
in the energy mix?
If other sectors remain the same, how much CO2 reduction can be achieved using the most ambitious
renewable energy scenarios? At what cost?
If all demand sectors remain the same, how much CO2 reduction can be achieved using the most
ambitious efforts made by the supply side? At what cost?
If all supply sectors remain the same, how much CO2 reduction can be achieved using the most
ambitious efforts made by the demand side? At what costs?
What is the full potential of CO2 reductions in Japan? At what cost? What does the low-carbon pathway
look like?
How was the Japan 2050
Low Carbon Navigator developed?
The Low Carbon Navigator was developed following the general model structure of the UK 2050 Pathways
Calculator. Several fundamental changes were made to accommodate the actual situation in Japan. These
include:
2
A User’s Guide
Japan-specific data on scenario setting, technology specifications, and social and economic indicators
are used based on extensive literature review and expert consultation.
Sectoral coverage is set to reflect Japan’s priority sectors for energy supply and demand.
Five society scenarios for 2050 reflecting future macro-economic and social indicators are set at the top
level of the model structure which link with relevant sectoral scenarios for the supply and demand sides.
For energy supply sectors, five levels of option are set to reflect the level of efforts ranging from no efforts
(Level 1), low (Level 2), medium (Level 3) and high (Level 4) efforts and an additional Level 5 for the
supply sectors, representing the physical limits of energy resources or technical potential.
Technology options are provided based on Japan’s situation.
In Japan’s Low Carbon Navigator, energy supply is set to match energy demand by adjusting the
imports of hydrocarbon fuels and the amount of electricity generation from fossil fuels (coal, oil and
gas). In contrast, the UK 2050 Pathways Calculator allows for a large amount of oversupply of energy
compared with energy demand based on selected options for energy supply and demand. Energy
deficiency caused by selected options is automatically filled by electricity imports in the UK’s Calculator
setting.
In the current version of Japan’s Low Carbon Navigator, the levels of other air pollutants (PM10, NOx,
SO2 and NMVOC 2 ) associated with the users’ options on energy supply and demand are not included.
However, the UK 2050 Pathways Calculator captures these air quality vectors.
What does the Low Carbon Navigator look like?
Two versions of the Low Carbon Navigator, the Excel version and the Web Tool version, were developed (see
the website at http://www.2050-low-carbon-navi.jp/web/en/). The Excel Spreadsheet model provides the
fundamental model, data and calculations based on which the Web Tool was developed.
Excel Spreadsheet
2
Web Tool
Non-methane volatile organic compounds.
3
Sectoral coverage
All the supply and demand sectors of the Japanese economy have been considered. Instead of combining
the sectors together, the Low Carbon Navigator takes a sector-by-sector approach.
Energy supply sectors
Energy demand sectors
Transport
Passenger transport
Freight transport
Nuclear and fossil fuel fired plants
Nuclear power stations
Conventional power plants
Biomass
Renewables
Solar PV
Wind (Onshore, offshore and floating)
Hydropower (Small & medium and large)
Geothermal electricity
Ocean power
Biomass energy supply
Volume of wastes and recycling
Bioenergy production and imports
Hydrogen production
Hydrogen production for transport
Residential
Space heating and cooling
Hot water supply
Cooking, lighting and appliances
Commercial
Heating, cooling and hot water
Cooking, lighting and appliances
Industry
Industrial activity
Own power generation
Agriculture, forestry and fisheries
Refineries
Coke production
Petroleum refinery
Town gas production
Levels setting under the Low Carbon Navigator
For each sector, the Low Carbon Navigator sets out a range of four or five (in the cases of renewable energy
and nuclear power generation) trajectories for the types of changes that might occur. These trajectories are
intended to reflect the whole range of potential future scenarios that might be seen in that particular sector. In
the energy supply sectors these trajectories represent a potential roll-out of energy generation infrastructure.
This is slightly different for the nuclear sector where other considerations such as a nuclear restart policy have
been taken into account. For the energy demand sectors, the trajectories represent the behavioural and
technological changes. In general, these trajectories are described as “levels” as they indicate scales of
change. However, for certain sectors, such as nuclear power stations or domestic and freight transport, the
changes indicate choices rather than scales, and therefore are described as “trajectories” or “options”.
Level 1
Level 2
Level 3
Level 4
No efforts
Great efforts
(existing capacity,
same technology,
no change in
consumption)
(increased
renewable energy,
advanced technology,
reduced unit energy
service demand)
Levels/trajectories setting
4
Level 5
Physical limit/
Technical
potential
(Renewables)
A User’s Guide
The levels/trajectories have been set up on the basis of progressively higher efforts toward transition to a lowcarbon society. For example, Level 1 represents low effort and continuation of existing capacity, technology and
no change in consumption behaviour, whereas Level 4 represents great effort leading toward increased use of
renewable energy, advanced technology, and reduction of energy service demand. For nuclear power
generation and renewable energy, Level 5 is added to represent the physical limits or technical potential of
energy supply from that particular energy source. For details, please see the research report on “Japan 2050 Low
Carbon Navigator: Overview and Trajectory Setting” (available at http://www.2050-low-carbon-navi.jp/web/en/).
Calculation procedure
The Low Carbon Navigator follows a six-step calculation procedure. Using the Excel Spreadsheet model as an
example, the calculation procedure is explained as follows:
Step 01: The users select their 2050 society scenarios and sectoral trajectories for both supply and
demand sectors to form one low-carbon pathway (see details in the model structure).
Step 02: Sectoral sheets then calculate the outputs based on user trajectory selections.
Step 03: Energy balance sheets for each defined years (2010, 2015, 2020, 2025, 2030, 2035, 2040, 2045
and 2050) are generated based on sectoral outputs.
Step 04: A summary sheet is compiled by compiling all yearly energy balance sheets.
Step 05: Results are presented in charts based on the summary sheet for primary energy supply, total final
energy consumption, energy mix for electricity generation, emissions and total additional costs.
Step 06: The users modify their trajectory selections to simulate another low-carbon pathway.
01 Select trajectories
02 Calculate the outputs of each sector based on trajectory options
03 Generate the Energy Balance Table for each year
06 Rebuild of trajectories
05 Present the results
04 Compile the Intermediate Output Sheet by summarizing
the Energy Balance Tables
Calculation procedure
5
Structure of the Low Carbon Navigator model
The structure of the model is depicted in the figure below.
First, at the top of sectoral trajectory setting are the five society scenarios based on which economic
indicators in terms of GDP growth and sectoral output levels and social indicators in terms of population
size and number of households, etc. will be determined. The society scenarios setting will then impact
on energy demand sectors. In particular, the GDP growth and sectoral output levels are linked with
industrial sectors, freight transport sector and commercial sectors, while the population size and the
number of households are linked with residential sectors and the passenger transport sector.
Society
¬
Scenarios
Economic Growth/
¬
Economic Activity Level
Population / Households
Energy
Demand
27
category
Heating
&
Cooling
Industry
Hot
Water
Others
Residential
Heating
Others
Commercial
Passenger
Freight
Transportation
CCS
Unsupplied Electricity Demands
Energy
Supply
Capacity Assumptions
Nuclear
Renewables
Conv.Plants
Solar
Hydro
Coal
Gas
Wind
Geo
Oil
Biomass
Hydrogen
Coke
Biofuel
Oil
Products
Gas
Products
CCS
Electricity
Other Secondary Energy
Primary
Energy
Coal
Crude Oil
Natural Gas
GHG Emissions
Model structure
6
Nuclear
Renewables
Biomass
A User’s Guide
Second, for energy demand, four categories of energy end users are considered, i.e. industry,
residential, commercial and transport sectors. The activity levels of each sector, consumption
behaviours, technology penetration (technology options) and energy efficiency advancement, etc. will
influence the sectoral outputs in terms of energy demand, GHG emission levels and corresponding
additional costs per person.
Third, for energy supply, secondary energy supply including electricity generation and other secondary
energies are included in the model. Electricity is generated from conventional power plants using fossil
fuels and biomass, nuclear power plants and renewable energy. Other secondary energies include
hydrogen production, biofuels, and refinery products.
Fourth, primary energy resources include hydrocarbon energy carriers (coal, crude oil and natural gas),
nuclear energy, renewable energy, and biomass.
Both primary energy and secondary energy transformed from primary energy will be provided to satisfy
energy demand. Emissions are generated from fossil fuel combustion influenced by way of energy
supply and energy demand levels.
How to install and start up the
Excel Spreadsheet model
i ) If you install from the Internet (available at http://www.2050-low-carbon-navi.jp/web/en/), find “Excel
Spreadsheet version”, click the icon of the Excel Spreadsheet model, download the Excel file and save
on your PC. If you use USB or CD, please copy the Excel file and save on your PC.
ii ) Open the Excel file.
iii ) Find the “Control” sheet, click and open.
iv) From the manual bar, you can select “Formulas” and click, and then select “Calculation Options” and
click on “Manual”. This will deactivate automatic calculation unless you presses “F9” on the keyboard
to enable the calculation.
v ) On the “Control” sheet, you can select your own choices for the trajectory setting of the society
scenarios and for each sector of the demand side and the supply side.
• Columns A-D: Given definition of technology, energy efficiency, and behavioural drivers influencing
sectoral trajectory settings;
• Column E: Levels of efforts which require the users to input;
• Column F: The upper limits (most are 4 or D with some exceptions set as 5 or E and 2) set for each
corresponding selection in Column E;
• Columns H-L: Explanations on the level setting for Column E;
• Columns T-AD: Calculation results of energy supply and demand including three figures, i.e. Primary
Energy Supply, Total Final Energy Consumption by Sector and Total Final Energy Consumption by
Fuels;
• Columns AF-AP: Calculation results of electricity generation;
• Columns AR-BB: Calculation results of emissions and costs including two figures, i.e. Emissions as
% of 1990 levels and Total Costs Per Capita Per Year in Japanese yen valued for the year 2010.
7
vi ) You can select one among several options provided in Columns H-L and then input the value of
selection (e.g. 4) into the corresponding cell in Column E. For Society Scenarios (Cell E5), you can
select among A, B, C, D and E. For other sectors except for renewable energy (Solar PV, Onshore Wind,
Offshore Wind, Floating Wind, Small-Medium Hydropower, Geothermal Electricity and Ocean Power)
and Existing Power Plants of Nuclear Power Stations, values can be inputted as decimals (e.g. 1.2 for
Fuel Mix for Conventional Power Plants for Cell E10, or 2.5 for Passenger Transport Behaviour for Cell
E21). For renewable energy (Cells E12-18) and Existing Power Nuclear Power Stations (Cell E5), values
inputted as decimals are allowed only for the range from 1 to 4, but not allowed for the range from 4 to
5. For the range from 4 to 5, only the value “5” can be selected.
vii ) Upon the completion of all selections required for Column E, press F9 on the keyboard. The Low Carbon
Navigator will calculate based on your selection. You can find the information on the status of calculating
in terms of percentage of completion on the right of the bottom bar. Upon 100% completion of the
calculation, the results will be shown on the right side in Columns T-AD, AF-AP, AR-BB.
How to access and use the Web Tool
i ) Connect to the internet;
ii ) Type in the website address: http://www.2050-low-carbon-navi.jp/web/en/;
iii ) Find “Web Tool version”, click the icon of “Web Tool”, and open the web page of Low Carbon Navigator;
iv) Select between 1 to 5 for the Society Scenario setting on the top;
v ) Switch to different pages on Energy, Electricity, Security, Flows, Costs and Share by clicking on the top
bar under the Society Scenario selection;
vi ) On the lower part of each page, you can select your own sectoral choices from Level 1 to Level 4 for (or
Level 5 for many of energy supply-related sectoral setting). On the left side are energy demand-related
levers and on the right side are energy-supply related levers. Upon the completion of selection, the
results calculated based on your unique sectoral selections will then be presented immediately on the
upper part of the webpage.
vii) When you make your sectoral selections on one of the webpages, e.g. the Energy page, the same
selections will be reflected on all other pages (i.e. Electricity, Security, Flows, Costs and Share). If you
want to change your selections on another page (for example, Electricity page), the same changes will
be reflected on all pages again.
Several functions designed for the convenience of the users include:
On the left of the available Society Scenarios as well as each sectoral scenarios, there is a question
mark ? , and if you click this, the descriptions on the sector and trajectory settings will appear in PDF.
If you move your cursor over one of the sectoral scenarios, e.g. Level 1 of the New Build Nuclear Power
Plants under Electricity Supply of the Energy Page, a message box of “Negative: No new builds” will
pop up.
If you move your cursor over the title of the sectoral factors, e.g. “New Build Nuclear Power Plants”, and
stay on this, the results of the selection from Level 1 to Level 5 will be shown on the upper figure of
Primary Energy Supply one by one.
8
A User’s Guide
Caveats for using the Low Carbon Navigator
Several caveats need to be noted when using the Low Carbon Navigator.
The Low Carbon Navigator demonstrates the scale of changes that are likely to be required for Japan to make
the transition to a low-carbon economy, as well as the choices/trade-offs available to the country. However, it
does not make predictions or projections for the future. In other words, while the Low Carbon Navigator is
helpful in exploring a range of available pathways, none of these generated pathways should be prejudged as
optimal.
The Low Carbon Navigator does not adopt a cost-optimization approach. Instead of focusing on identifying
the least-cost pathway to meet Japan’s 2050 emissions reduction target, it looks at what might be achievable
in each of the covered sectors under different assumptions. Nonetheless, the Low Carbon Navigator does
acknowledge the significance of costs in making choices. It allows the users to see the incremental cost to
society of their chosen pathways, and make sensitivity analysis by comparing the costs of their selected
pathways with other pathways.
The model has been developed focusing exclusively on Japan and its options for GHG emissions reduction
and energy security. It includes associated data (but no trajectories) on the imports of bioenergy and
hydrocarbons to Japan and the exports of petroleum and petrochemical products from Japan. Additionally,
this model considers emission credits for bioenergy but does not provide trajectories. It does not include
emissions from international aviation and shipping assigned to Japan.
The underlying data for the Japan 2050 Low Carbon Navigator comes from various sources including
government documents and scientific literature. The model describes how the trajectories might look like
under various assumptions. Relevant developments, such as the 2011 Fukushima nuclear accident and the
renewed focus on alternative and renewable energy sources, have been taken into consideration. Thus the
analysis under this model looks at what might be possible to deliver in the coming years up to 2050, but does
not propose or identify the required policy decisions to ensure this future. In other words, the Low Carbon
Navigator does not provide a detailed policy framework and the trajectories should not be considered as
projections based on policy decisions.
Example pathways
We present two example pathways to explain how to understand and interpret the results from the Low Carbon
Navigator. The first pathway demonstrates what is likely to happen if no effort is made in mitigating emissions
and combatting climate change, while the second one shows what could happen if Japan puts great efforts
toward transitioning to a low-carbon society. For both pathways, the Society Scenario is selected as “Research
and Development (R&D)” society, under which the population size will be 95 million; the number of households
will be 49.8 million; and GDP growth rate will be 0.9% and per capita GDP growth rate will be 1.6% in 2050.
2050 Society scenario: R&D; Population: 95 million; No. of Households: 49.8 million;
Average GDP growth rate: 0.9% per year; Per capita GDP growth rate: 1.6% per year
No effort pathway
My choice
All Level 1 setting, except for the restart of
existing nuclear capacity (Level 3)
Great effort pathway
All Level 4 setting.
9
Under the “No effort” pathway, all the sectors are locked at the Level 1 setting, reflecting the continuation of
existing capacity, technology and no change in consumption behaviour. There is an exception for the restart
policy of existing nuclear capacity, which is set at trajectory 3 (where Japan only allows all existing nuclear
plants with a 40 year lifespan to operate). In the “Great effort” pathway, all the sectors (including the nuclear
lever on restart policy) are locked at the Level 4 setting, reflecting increased use of renewable energy,
advanced technology, and reduction of energy service demand.
Results: Energy mix for electricity generation
Energy mix varies significantly under the two scenarios. In “No effort” pathway, the use of fossil fuels, particularly
gas and oil, increases over the years. This is particularly because Japan’s nuclear capacity gradually decreases
and reaches zero in the 2040s. On the other hand, in the “Great effort” scenario, Japan still generates a
significant amount of electricity from nuclear sources. In addition, the share of all the renewables increases
significantly whereas the use of fossil fuels as well as biomass gradually comes down to zero. This shift to
renewable energy sources will facilitate the development of a low-carbon economy in Japan.
“No effort” pathway
“Great effort” pathway
Electricity Supply to the End-user
Electricity Supply to the End-user
1,000
1,000
800
800
Solar PV
Gas with CCS
Coal with CCS
Biomass
Gas
Oil
2050
2045
2040
2035
2030
Coal
2025
2005
2050
2045
2040
2035
2030
2025
0
2020
0
2015
Wind
400
200
2010
Geothermal
600
200
2005
Ocean Power
2020
400
Hydropower
2015
600
Generation in
Demand-side
Nuclear
2010
TWh/yr
1,200
TWh/yr
1,200
Electricity used in
Japan
Baseline
Results: Energy used by end consumers
The overall total of final energy consumption reduces over the years until 2050 under both pathways, but the
degree of reduction is significantly higher under the “Great effort” scenario. A combination of factors, including
policy intervention, efficiency enhancement as well as behavioural change, is reflected in this reduction of
energy consumption. In terms of comparison among the sectors, major changes are seen in energy
consumption for road transport and space heating and cooling. More and more people will use public
transport such as buses, and nearly 100% of the privately-owned vehicles will be zero-emission ones. For
space heating and cooling, the changes are due to both enhance efficiency of appliances and people’s
habitual changes in using these appliances.
10
A User’s Guide
“No effort” pathway
“Great effort” pathway
Total final energy consumption by sector
450
Aviation
400
400
Shipping
350
350
300
300
Space Heating and
Cooling
Agriculture, forestry
and fisheries
2050
2045
2040
2035
2030
Manufacturing and
Construction
2005
2050
2045
2040
0
2035
0
2030
50
2025
50
2020
100
2015
100
2010
Hot Water Supply
150
2025
150
Lighting, Cooking &
Other Appliances
200
2020
200
Road Transport
250
2015
250
Rail Transport
2010
Mtoe / year
450
2005
Mtoe / year
Total final energy consumption by sector
Baseline
Results: GHG Emissions
“No effort” pathway
“Great effort” pathway
Emissions (% of 1990 levels)
Emissions (% of 1990 levels)
150%
150%
Waste
125%
125%
Land Use, Land-Use
Change and Forestry
100%
Agriculture
-50%
18%
Target of 80% reduciton
25%
2050
2045
2040
2035
2030
-25%
Carbon capture
Total
0%
2025
2050
2045
2040
2035
2030
2025
2020
2015
-25%
2010
0%
Fuel Combustion
50%
2020
Target of 80% reduciton
25%
Industrial Processes
2015
50%
75%
2010
75%
2005
CO2e / year (% of 1990)
91%
100%
2005
CO2e / year (% of 1990)
Under the “No effort” scenario, Japan is far from achieving its committed 80% reduction of GHG emissions.
Emissions are reduced only in a limited manner, reaching around 90% of 1990 levels. On this pathway, Japan
is stuck with frozen technology, and consumption patterns do not change much. The reduction is basically due
to the reduced size of the population. On the other hand, thanks to the efforts by policymakers as well as by
the Japanese people, the country can achieve dramatic reductions from the 1990 levels. The use of lowcarbon technologies significantly enhance efficiency and reduce emissions.
Baseline
-50%
11
A simulation tool helping communications
among various stakeholders regarding
energy-secured and low-carbon society
and educating people to take action
We believe that the Low Carbon Navigator can be a handy educational and
communication tool that will not only help the general audience to better
understand the situation, but also assist policymakers in the consultation
and decision-making processes.
We hope you will join us in the exploration of low-carbon pathways for Japan
by using the Low Carbon Navigator.
Your comments on the improvement of the tool and contribution of your
pathways are very much appreciated.
Information
For accessing to the Web Tool version: http://www.en-2050-low-carbon-navi.jp/
For downloading the Excel version: http://www.2050-low-carbon-navi.jp/web/en/
Contact us at
Institute for Global Environmental Strategies (IGES)
Green Economy Area
2108-11 Kamiyamaguchi, Hayama, Kanagawa, 240-0115 Japan
Tel: +81 (0)46 826 9575 Fax: +81 (0)46 855 3809 E-mail: [email protected] URL: http://www.iges.or.jp