1
PQStat Software
Statistical Computational Software
User Guide - PQStat
Barbara Wieckowska
C
©2010-2014 PQS
S
.................All rights reserved
Version 1.4.8
P7909121213
www.pqstat.pl
Contents
1 SYSTEM REQUIREMENTS
5
2 HOW TO INSTALL
5
3 WORKING WITH DOCUMENTS
3.1 HOW TO WORK WITH DATASHEETS . . . . . . . . . . . . . . . . .
3.1.1 HOW TO ADD, TO DELETE AND TO EXPORT DATASHEETS .
3.1.2 HOW TO INSERT DATA INTO A SHEET . . . . . . . . . . . .
3.1.3 DATASHEET WINDOW . . . . . . . . . . . . . . . . . . .
3.1.4 CELLS FORMAT . . . . . . . . . . . . . . . . . . . . . . .
3.1.5 DATA EDITING . . . . . . . . . . . . . . . . . . . . . . . .
3.1.6 HOW TO SORT DATA . . . . . . . . . . . . . . . . . . . .
3.1.7 HOW TO CONVERT RAW DATA INTO CONTINGENCY TABLE
3.1.8 HOW TO CONVERT CONTINGENCY TABLE INTO RAW DATA
3.1.9 FORMULAS . . . . . . . . . . . . . . . . . . . . . . . . .
3.1.10 HOW TO GENERATE DATA . . . . . . . . . . . . . . . . .
3.1.11 MISSING DATA . . . . . . . . . . . . . . . . . . . . . . .
3.1.12 NORMALIZATION/STANDARDIZATION . . . . . . . . . . .
3.1.13 SIMILARITY MATRIX . . . . . . . . . . . . . . . . . . . . .
3.2 HOW TO WORK WITH REPORTS ( RESULTS SHEETS) . . . . . . . .
3.3 HOW TO CHANGE LANGUAGE SETTINGS IN PQSTAT? . . . . . . .
3.4 MENU . . . . . . . . . . . . . . . . . . . . . . . . . . . . . . . .
.
.
.
.
.
.
.
.
.
.
.
.
.
.
.
.
.
.
.
.
.
.
.
.
.
.
.
.
.
.
.
.
.
.
.
.
.
.
.
.
.
.
.
.
.
.
.
.
.
.
.
.
.
.
.
.
.
.
.
.
.
.
.
.
.
.
.
.
.
.
.
.
.
.
.
.
.
.
.
.
.
.
.
.
.
.
.
.
.
.
.
.
.
.
.
.
.
.
.
.
.
.
.
.
.
.
.
.
.
.
.
.
.
.
.
.
.
.
.
.
.
.
.
.
.
.
.
.
.
.
.
.
.
.
.
.
.
.
.
.
.
.
.
.
.
.
.
.
.
.
.
.
.
.
.
.
.
.
.
.
.
.
.
.
.
.
.
.
.
.
.
.
.
.
.
.
.
.
.
.
.
.
.
.
.
.
.
.
.
.
.
.
.
.
.
.
.
.
.
.
.
.
.
.
.
.
.
.
.
.
.
.
.
.
.
.
.
.
.
.
.
.
.
.
.
.
.
.
.
.
.
.
.
.
.
.
.
.
.
.
.
.
.
.
.
.
.
.
.
.
.
.
.
.
.
.
.
.
.
.
.
.
.
.
.
.
.
.
.
.
.
.
.
.
.
.
.
.
.
.
.
.
.
.
.
.
.
.
.
6
8
8
8
10
11
13
14
15
16
16
20
21
24
25
35
36
37
4 HOW TO ORGANISE WORK WITH PQSTAT
4.1 HOW TO ORGANISE DATA . . . . . . . . . . . . . .
4.2 HOW TO REDUCE A DATASHEET WORKSPACE . . .
4.3 MULTIPLE REPEATED ANALYSIS . . . . . . . . . . .
4.4 INFORMATION GIVEN IN A REPORT . . . . . . . . .
4.5 MARKING OF STATISTICALLY SIGNIFICANT RESULTS
.
.
.
.
.
.
.
.
.
.
.
.
.
.
.
.
.
.
.
.
.
.
.
.
.
.
.
.
.
.
.
.
.
.
.
.
.
.
.
.
.
.
.
.
.
.
.
.
.
.
.
.
.
.
.
.
.
.
.
.
.
.
.
.
.
.
.
.
.
.
.
.
.
.
.
.
.
.
.
.
.
.
.
.
.
.
.
.
.
.
.
.
.
.
.
.
.
.
.
.
.
.
.
.
.
.
.
.
.
.
.
.
.
.
.
.
.
.
.
.
.
.
.
.
.
41
41
43
47
47
47
5 GRAPHS
5.1 GRAPHS GALLERY . . . . .
5.1.1 Bar plots . . . . .
5.1.2 Error plots . . . . .
5.1.3 Box-Whiskers plots
5.1.4 Sca er plots . . .
5.1.5 Line plots . . . . .
.
.
.
.
.
.
.
.
.
.
.
.
.
.
.
.
.
.
.
.
.
.
.
.
.
.
.
.
.
.
.
.
.
.
.
.
.
.
.
.
.
.
.
.
.
.
.
.
.
.
.
.
.
.
.
.
.
.
.
.
.
.
.
.
.
.
.
.
.
.
.
.
.
.
.
.
.
.
.
.
.
.
.
.
.
.
.
.
.
.
.
.
.
.
.
.
.
.
.
.
.
.
.
.
.
.
.
.
.
.
.
.
.
.
.
.
.
.
.
.
.
.
.
.
.
.
.
.
.
.
.
.
.
.
.
.
.
.
.
.
.
.
.
.
.
.
.
.
.
.
48
48
48
53
55
56
58
.
.
.
.
.
.
.
.
.
.
.
.
.
.
.
.
.
.
.
.
.
.
.
.
.
.
.
.
.
.
.
.
.
.
.
.
.
.
.
.
.
.
.
.
.
.
.
.
.
.
.
.
.
.
.
.
.
.
.
.
.
.
.
.
.
.
.
.
.
.
.
.
.
.
.
.
.
.
6 FREQUENCY TABLES AND EMPIRICAL DATA DISTRIBUTION
7 DESCRIPTIVE STATISTICS
7.1 MEASUREMENT SCALES . . . . . . . . . . .
7.2 MEASURES OF POSITION (LOCATION) . . . .
7.2.1 CENTRAL TENDENCY MEASURES . .
7.2.2 ANOTHER MEASURES OF POSITION
7.3 MEASURES OF VARIABILITY (DISPERSION) .
7.4 ANOTHER DISTRIBUTION CHARACTERISTICS
.
.
.
.
.
.
.
.
.
.
.
.
.
.
.
.
.
.
.
.
.
.
.
.
.
.
.
.
.
.
60
.
.
.
.
.
.
.
.
.
.
.
.
.
.
.
.
.
.
.
.
.
.
.
.
.
.
.
.
.
.
.
.
.
.
.
.
.
.
.
.
.
.
.
.
.
.
.
.
.
.
.
.
.
.
.
.
.
.
.
.
.
.
.
.
.
.
.
.
.
.
.
.
.
.
.
.
.
.
.
.
.
.
.
.
.
.
.
.
.
.
.
.
.
.
.
.
.
.
.
.
.
.
.
.
.
.
.
.
.
.
.
.
.
.
.
.
.
.
.
.
.
.
.
.
.
.
.
.
.
.
.
.
.
.
.
.
.
.
.
.
.
.
.
.
65
65
67
67
68
69
70
8 PROBABILITY DISTRIBUTIONS
73
8.1 CONTINUOUS PROBABILITY DISTRIBUTIONS . . . . . . . . . . . . . . . . . . . . . . . . . . . . . 75
8.2 PROBABILITY DISTRIBUTION CALCULATOR . . . . . . . . . . . . . . . . . . . . . . . . . . . . . . 78
9 HYPOTHESES TESTING
81
9.0.1 POINT AND INTERVAL ESTIMATION . . . . . . . . . . . . . . . . . . . . . . . . . . . . . 81
9.0.2 VERIFICATION OF STATISTICAL HYPOTHESES . . . . . . . . . . . . . . . . . . . . . . . . . 81
CONTENTS
10 COMPARISON - 1 GROUP
10.1 PARAMETRIC TESTS . . . . . . . . . . . . . . . . . . . . .
10.1.1 The t-test for a single sample . . . . . . . . . . .
10.2 NONPARAMETRIC TESTS . . . . . . . . . . . . . . . . . .
10.2.1 The Kolmogorov-Smirnov test and the Lilliefors test
10.2.2 The Wilcoxon test (signed-ranks) . . . . . . . . . .
10.2.3 The Chi-square goodness-of-fit test . . . . . . . .
10.2.4 Tests for propor on . . . . . . . . . . . . . . . . .
.
.
.
.
.
.
.
.
.
.
.
.
.
.
.
.
.
.
.
.
.
.
.
.
.
.
.
.
.
.
.
.
.
.
.
.
.
.
.
.
.
.
.
.
.
.
.
.
.
.
.
.
.
.
.
.
.
.
.
.
.
.
.
.
.
.
.
.
.
.
.
.
.
.
.
.
.
84
85
85
88
88
91
94
97
11 COMPARISON - 2 GROUPS
11.1 PARAMETRIC TESTS . . . . . . . . . . . . . . . . . . . . . . . . . . . . .
11.1.1 The Fisher-Snedecor test . . . . . . . . . . . . . . . . . . . . . .
11.1.2 The t-test for independent groups . . . . . . . . . . . . . . . . .
11.1.3 The t-test with the Cochran-Cox adjustment . . . . . . . . . . . .
11.1.4 The t-test for dependent groups . . . . . . . . . . . . . . . . . .
11.2 NONPARAMETRIC TESTS . . . . . . . . . . . . . . . . . . . . . . . . . .
11.2.1 The Mann-Whitney U test . . . . . . . . . . . . . . . . . . . . .
11.2.2 The Wilcoxon test (matched-pairs) . . . . . . . . . . . . . . . . .
11.2.3 TESTS FOR CONTINGENCY TABLES . . . . . . . . . . . . . . . . .
11.2.4 The Chi-square test for trend for Rx2 tables . . . . . . . . . . . .
11.2.5 The Chi-square test and Fisher test for RxC tables . . . . . . . .
11.2.6 The Chi-square test and the Fisher test for 2x2 tables (with correc
11.2.7 Rela ve Risk and Odds Ra o . . . . . . . . . . . . . . . . . . . .
11.2.8 The Z test for 2 independent propor ons . . . . . . . . . . . . .
11.2.9 The McNemar test, the Bowker test of internal symmetry . . . .
11.2.10 Z Test for two dependent propor ons . . . . . . . . . . . . . . .
. . .
. . .
. . .
. . .
. . .
. . .
. . .
. . .
. . .
. . .
. . .
ons)
. . .
. . .
. . .
. . .
.
.
.
.
.
.
.
.
.
.
.
.
.
.
.
.
.
.
.
.
.
.
.
.
.
.
.
.
.
.
.
.
.
.
.
.
.
.
.
.
.
.
.
.
.
.
.
.
.
.
.
.
.
.
.
.
.
.
.
.
.
.
.
.
.
.
.
.
.
.
.
.
.
.
.
.
.
.
.
.
.
.
.
.
.
.
.
.
.
.
.
.
.
.
.
.
.
.
.
.
.
.
.
.
.
.
.
.
.
.
.
.
.
.
.
.
.
.
.
.
.
.
.
.
.
.
.
.
.
.
.
.
.
.
.
.
.
.
.
.
.
.
.
.
.
.
.
.
.
.
.
.
.
.
.
.
.
.
.
.
101
102
102
103
104
107
109
109
112
114
118
120
125
131
133
136
141
12 COMPARISON - MORE THAN 2 GROUPS
12.1 PARAMETRIC TESTS . . . . . . . . . . . . . . . . . .
12.1.1 The ANOVA for independent groups . . . . .
12.1.2 The contrasts and the POST-HOC tests . . . .
12.1.3 The Brown-Forsythe test and the Levene test
12.1.4 The ANOVA for dependent groups . . . . . .
12.2 NONPARAMETRIC TESTS . . . . . . . . . . . . . . .
12.2.1 The Kruskal-Wallis ANOVA . . . . . . . . . .
12.2.2 The Friedman ANOVA . . . . . . . . . . . .
12.2.3 The Chi-square test for mul dimensional con
12.2.4 The Q-Cochran ANOVA . . . . . . . . . . . .
.
.
.
.
.
.
.
.
.
.
.
.
.
.
.
.
.
.
.
.
.
.
.
.
.
.
.
.
.
.
.
.
.
.
.
.
.
.
.
.
.
.
.
.
.
.
.
.
.
.
.
.
.
.
.
.
.
.
.
.
.
.
.
.
.
.
.
.
.
.
.
.
.
.
.
.
.
.
.
.
.
.
.
.
.
.
.
.
.
.
.
.
.
.
.
.
.
.
.
.
.
.
.
.
.
.
.
.
.
.
144
145
145
146
151
152
156
156
158
161
163
.
.
.
.
.
.
.
.
.
.
.
.
.
.
.
.
.
.
.
.
.
.
.
.
.
.
.
.
.
.
.
.
.
.
.
. . . . . . . .
. . . . . . . .
. . . . . . . .
. . . . . . . .
. . . . . . . .
. . . . . . . .
. . . . . . . .
. . . . . . . .
ngency tables
. . . . . . . .
.
.
.
.
.
.
.
.
.
.
.
.
.
.
.
.
.
.
.
.
.
.
.
.
.
.
.
.
.
.
.
.
.
.
.
.
.
.
.
.
.
.
.
.
.
.
.
.
.
.
.
.
.
.
.
.
.
.
.
.
.
.
.
.
.
.
.
.
.
.
.
.
.
.
.
.
.
.
.
.
.
.
.
.
.
13 STRATIFIED ANALYSIS
167
13.1 THE MANTEL - HAENSZEL METHOD FOR SEVERAL 2x2 TABLES . . . . . . . . . . . . . . . . . . . . 167
13.1.1 The Mantel-Haenszel odds ra o . . . . . . . . . . . . . . . . . . . . . . . . . . . . . . . 167
13.1.2 The Mantel-Haenszel rela ve risk . . . . . . . . . . . . . . . . . . . . . . . . . . . . . . 172
14 CORRELATION
14.1 PARAMETRIC TESTS . . . . . . . . . . . . . . . . . . . . . . . . . . . . . . . . . . . . . . . . .
14.1.1 THE LINEAR CORRELATION COEFFICIENTS . . . . . . . . . . . . . . . . . . . . . . . . .
14.1.2 The test of significance for the Pearson product-moment correla on coefficient . . . . .
14.1.3 The test of significance for the coefficient of linear regression equa on . . . . . . . . .
14.1.4 The test for checking the equality of the Pearson product-moment correla on coefficients, which come from 2 independent popula ons . . . . . . . . . . . . . . . . . . .
14.1.5 The test for checking the equality of the coefficients of linear regression equa on, which
come from 2 independent popula ons . . . . . . . . . . . . . . . . . . . . . . . . . .
14.2 NONPARAMETRIC TESTS . . . . . . . . . . . . . . . . . . . . . . . . . . . . . . . . . . . . . .
14.2.1 THE MONOTONIC CORRELATION COEFFICIENTS . . . . . . . . . . . . . . . . . . . . . .
14.2.2 The test of significance for the Spearman's rank-order correla on coefficient . . . . . .
14.2.3 The test of significance for the Kendall's tau correla on coefficient . . . . . . . . . . . .
Copyright ©2010-2014 PQStat So ware − All rights reserved
.
.
.
.
174
175
175
176
176
. 180
.
.
.
.
.
181
183
183
184
186
2
CONTENTS
14.2.4 CONTINGENCY TABLES COEFFICIENTS AND THEIR STATISTICAL SIGNIFICANCE . . . . . . . 188
15 AGREEMENT ANALYSIS
15.1 PARAMETRIC TESTS . . . . . . . . . . . . . . . . . . . . . . . . . . . . . . . .
15.1.1 The intraclass correla on coefficient and the test of its significance . .
15.2 NONPARAMETRIC TESTS . . . . . . . . . . . . . . . . . . . . . . . . . . . . .
15.2.1 The Kendall's coefficient of concordance and the test of its significance
15.2.2 The Cohen's Kappa coefficient and the test of its significance . . . . . .
.
.
.
.
.
.
.
.
.
.
.
.
.
.
.
.
.
.
.
.
.
.
.
.
.
.
.
.
.
.
.
.
.
.
.
.
.
.
.
.
.
.
.
.
.
.
.
.
.
.
194
195
195
199
199
202
16 DIAGNOSTIC TESTS
16.1 EVALUATION OF DIAGNOSTIC TEST .
16.2 ROC CURVE . . . . . . . . . . . . .
16.2.1 Selec on of op mum cut-off
16.2.2 ROC curves comparison . .
.
.
.
.
.
.
.
.
.
.
.
.
.
.
.
.
.
.
.
.
.
.
.
.
.
.
.
.
.
.
.
.
.
.
.
.
.
.
.
.
206
206
210
213
217
17 MULTIDIMENSIONAL MODELS
17.1 PREPARATION OF THE VARIABLES FOR THE ANALYSIS IN MULTIDIMENSIONAL MODELS
17.1.1 Variable coding in mul dimensional models . . . . . . . . . . . . . . . . . . .
17.1.2 Interac ons . . . . . . . . . . . . . . . . . . . . . . . . . . . . . . . . . . . .
17.2 MULTIPLE LINEAR REGRESSION . . . . . . . . . . . . . . . . . . . . . . . . . . . . . .
17.2.1 Model verifica on . . . . . . . . . . . . . . . . . . . . . . . . . . . . . . . .
17.2.2 More informa on about the variables in the model . . . . . . . . . . . . . . .
17.2.3 Analysis of model residuals . . . . . . . . . . . . . . . . . . . . . . . . . . . .
17.2.4 Predic on on the basis of the model . . . . . . . . . . . . . . . . . . . . . . .
17.3 COMPARISON OF MULTIPLE LINEAR REGRESSION MODELS . . . . . . . . . . . . . . .
17.4 LOGISTIC REGRESSION . . . . . . . . . . . . . . . . . . . . . . . . . . . . . . . . . .
17.4.1 Odds Ra o . . . . . . . . . . . . . . . . . . . . . . . . . . . . . . . . . . . .
17.4.2 Model verifica on . . . . . . . . . . . . . . . . . . . . . . . . . . . . . . . .
17.5 COMPARISON OF LOGISTIC REGRESSION MODELS . . . . . . . . . . . . . . . . . . . .
.
.
.
.
.
.
.
.
.
.
.
.
.
.
.
.
.
.
.
.
.
.
.
.
.
.
.
.
.
.
.
.
.
.
.
.
.
.
.
.
.
.
.
.
.
.
.
.
.
.
.
.
.
.
.
.
.
.
.
.
.
.
.
.
.
.
.
.
.
.
.
.
.
.
.
.
.
.
224
224
224
227
227
229
231
232
233
240
244
246
247
260
18 DIMENSION REDUCTION AND GROUPING
18.1 PRINCIPAL COMPONENT ANALYSIS . . . . . . . . . . . . . . . . .
18.1.1 The interpreta on of coefficients related to the analysis .
18.1.2 Graphical interpreta on . . . . . . . . . . . . . . . . . .
18.1.3 The criteria of dimension reduc on . . . . . . . . . . . .
18.1.4 Defining principal components . . . . . . . . . . . . . . .
18.1.5 The advisability of using the Principal component analysis
.
.
.
.
.
.
.
.
.
.
.
.
.
.
.
.
.
.
.
.
.
.
.
.
.
.
.
.
.
.
.
.
.
.
.
.
.
.
.
.
.
.
.
.
.
.
.
.
.
.
.
.
.
.
.
.
.
.
.
.
.
.
.
.
.
.
.
.
.
.
.
.
.
.
.
.
.
.
.
.
.
.
.
.
.
.
.
.
.
.
.
.
.
.
.
.
.
.
.
.
.
.
264
264
265
266
268
268
269
19 SURVIVAL ANALYSIS
19.1 LIFE TABLES . . . . . . . . . . . . . . . . . . .
19.2 KAPLAN-MEIER CURVES . . . . . . . . . . . . .
19.3 COMPARISON OF SUVIVAL CURVES . . . . . . .
19.3.1 Differences among the survival curves .
19.3.2 Survival curve trend . . . . . . . . . .
19.3.3 Survival curves for the stratas . . . . .
19.4 PROPORTIONAL COX HAZARD REGRESSION . .
19.4.1 Hazard ra o . . . . . . . . . . . . . . .
19.4.2 Model verifica on . . . . . . . . . . .
19.4.3 Analysis of model residuals . . . . . . .
19.5 COMPARISON OF COX PH REGRESSION MODELS
.
.
.
.
.
.
.
.
.
.
.
.
.
.
.
.
.
.
.
.
.
.
.
.
.
.
.
.
.
.
.
.
.
.
.
.
.
.
.
.
.
.
.
.
.
.
.
.
.
.
.
.
.
.
.
.
.
.
.
.
.
.
.
.
.
.
.
.
.
.
.
.
.
.
.
.
.
.
.
.
.
.
.
.
.
.
.
.
.
.
.
.
.
.
.
.
.
.
.
.
.
.
.
.
.
.
.
.
.
.
.
.
.
.
.
.
.
.
.
.
.
.
.
.
.
.
.
.
.
.
.
.
.
.
.
.
.
.
.
.
.
.
.
.
.
.
.
.
.
.
.
.
.
.
.
.
.
.
.
.
.
.
.
.
.
.
.
.
.
.
.
.
.
.
.
.
.
.
.
.
.
.
.
.
.
.
.
276
277
280
282
284
285
285
292
294
294
296
297
.
.
.
.
.
.
.
.
.
.
.
.
.
.
.
.
.
.
.
.
.
.
.
.
.
.
.
.
.
.
.
.
.
.
.
.
.
.
.
.
.
.
.
.
.
.
.
.
.
.
.
.
.
.
.
.
.
.
.
.
.
.
.
.
.
.
.
.
.
.
.
.
.
.
.
.
.
.
.
.
.
.
.
.
.
.
.
.
.
.
.
.
.
.
.
.
.
.
.
.
.
.
.
.
.
.
.
.
.
.
.
.
.
.
.
.
.
.
.
.
.
.
.
.
.
.
.
.
.
.
.
.
.
.
.
.
.
.
.
.
.
.
.
.
.
.
.
.
.
.
.
.
.
.
.
.
.
.
.
.
.
.
.
.
.
.
.
.
.
.
.
.
.
.
.
.
.
.
.
.
.
.
.
.
.
.
.
.
.
.
.
.
.
.
.
.
.
.
.
.
.
.
20 RELIABILITY ANALYSIS
305
21 THE WIZARD
311
Copyright ©2010-2014 PQStat So ware − All rights reserved
3
CONTENTS
22 OTHER NOTES
312
22.1 FILES FORMAT . . . . . . . . . . . . . . . . . . . . . . . . . . . . . . . . . . . . . . . . . . . . . 312
22.2 SETTINGS . . . . . . . . . . . . . . . . . . . . . . . . . . . . . . . . . . . . . . . . . . . . . . . 313
Copyright ©2010-2014 PQStat So ware − All rights reserved
4
2 HOW TO INSTALL
1 SYSTEM REQUIREMENTS
To use PQStat, your computer must meet the following minimum requirements:
- Processor: Intel Pen um II (500 MHz or be er)
- 256 MB RAM or greater
- SVGA (800 x 600/16-bit colour or be er)
- 200 MB of disc space
- The alternate install CD only requires you to have: CD-ROM
- Other requirements: a keyboard, a mouse
- Supported Opera ng Systems: Windows 2000/XP/Vista/7/8
2 HOW TO INSTALL
To start the installa on process, run the applica on installer - PQStat-setup_x86-FULL (for 64-bit
version: PQStat-setup_x64-FULL.exe).
When you do this, a setup dialog box will appear. Press "Next" to con nue with the installa on setup.
The installa on of the applica on requires you to accept the End User License Agreement. If you accept the terms of the license, select: "I accept the terms of the license" and press "Next" to con nue.
Otherwise, select "I do not accept the terms of the licence" and press "Cancel" to exit the installa on.
The following box enables you to change the default install®a on directory and to check if you have
sufficient disc space. It is recommended that the default loca on of instala on is accepted.
If you press "Next", there is a possibility to choose either a full installa on of the applica on or a version
not including exemplary data sets. The data sets are used in the User Guide.
Next, the dialog box informs you and gives you the possibility to change the shortcut name, which will
be created in Windows Menu Start.
Pressing "Next", you can create a Desktop Shortcut or add a shortcut to the Quick Lunch toolbar. Press
"Next" to con nue.
The following step is the last one before the installa on process starts copying files to your system. This
dialog box will show you the summary of installa on op ons chosen so far. To start the installa on
process, press ”Install”.
Copyright ©2010-2014 PQStat So ware − All rights reserved
5
3
WORKING WITH DOCUMENTS
3 WORKING WITH DOCUMENTS
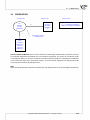
Documents management in this applica on is based on projects. Each project is a separated file.
A project is an object of the similar meaning to a worksheet, which consists of 3 basic elements:
1. Datasheets (including map sheets and matrixs) - the number of sheets in a given project is limited
to 255,
2. Results sheets (reports) - the number of reports in a given datasheet is limited to 1024,
3. Project manager - it enables you to change the name of datasheets and results, add your own
descrip ons and notes, and export.
It is possible to work on 255 opened projects at the same me. The first one, altogether with an empty
sheet, is created automa cally (right a er the applica on is launched, and if the appropriate op on in
the application settings is selected).
Another projects can be created by:
- File menu → New project (Ctrl+N),
- bu on on the toolbar .
Created projects (files with pqs, pqx extension) can be opened by:
- File→Open project (Ctrl+O),
bu on on the toolbar,
- File→Open recent,
- File→Open examples - it applies to the examples a ached to the applica on,
- drag the project file into the applica on window,
- by double-clicking the project file.
The project can be saved by:
- File menu→Save (Ctrl+S),
- File→Save as...,
- Save bu on in the Project Manager, -
bu on on the toolbar.
Saving the project causes that all project elements are saved in a file with pqs or pqx extension.
The project can be closed by:
- File menu→Close project,
- Close project bu on in the Project Manager.
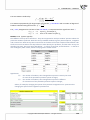
To navigate the project easily, you can use a Project Manager that is opened when you select appropriate project. In this window, you can both save and delete projects. You are also able to delete
datasheets and reports or to add descrip ons and notes. Project Name is also the name of the project
file (pqs / pqx).
Copyright ©2010-2014 PQStat So ware − All rights reserved
6
3
WORKING WITH DOCUMENTS
Copyright ©2010-2014 PQStat So ware − All rights reserved
7
3
WORKING WITH DOCUMENTS
3.1 HOW TO WORK WITH DATASHEETS
The most important element in each project is a datasheet. Each open project must contain at least
one datasheet.
3.1.1 HOW TO ADD, TO DELETE AND TO EXPORT DATASHEETS
The first empty datasheet will be opened automa cally altogether with a new project.
Another datasheets can be added to the project by:
- File menu →Add datasheet (Ctrl+D),
- bu on on the toolbar,
- Add datasheet to the Project Manager.
You can delete a datasheet by:
- context menu Delete sheet (Shift+Del) on the name of a datasheet in a Navigation Tree,
bu on →Delete in the Project Manager, for selected sheet/sheets.
However, you should remember: if there are any reports or map added to a datasheet and you delete
datasheet, all reports/map a ached to it will be deleted too.
Datasheets can be described in the Project Manager by adding a name, tle or a note.
All datasheets created in PQStat can be exported to csv (txt), dbf and xls format. You can do this by
bu on →Eksport to.. in the Project Manager, for selected sheet/sheets.
clicking
3.1.2 HOW TO INSERT DATA INTO A SHEET
Crea ng a datasheet, it is empty. You can insert some data, copy prearranged collec on of data from
any datasheet or import data. The amount of data, which one datasheet is able to take in is limited to
4 millions of rows and 1 thousand of columns. No more than 40 characters can be put in each cell.
Data import
You can easily import data from:
- *.xls/*xlsx,
- *.txt/*.csv files with encoding of UTF8, Windows-1250,
- *.shp (SHP/SHX/DBF ESRI Shapefile),
- *.dbf (dBase III, dBase IV, dBase VII),
- *.dbf (FoxPro).
To perform an import opera on you should click Import from... menu.
Copyright ©2010-2014 PQStat So ware − All rights reserved
8
3
WORKING WITH DOCUMENTS
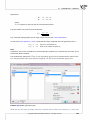
In the import window, there is a possibility to preview data impor ng and prior verifica on of import
results, depending on the way of data interpreta on. To avoid misinterpreta on of na onal characters,
you should pay special a en on on the correctness of screened characters in a preview window. If the
files are huge, the preview window displays only the beginning of the data from the given file.
Note
In applica ons like Microso Office Excell 2000-2007, the default character encoding is Windows-1250.
Data impor ng from Microso Excel documents is with reference to cells values only. There is no possibility to import any forma ng and formulas.
Copying data with rela on
Data from one datasheet can be copied to another selected datasheet on the basis of rela on. That
kind of copying is done by selec ng from the menu Data→Copying with relation...
Copyright ©2010-2014 PQStat So ware − All rights reserved
9
3
WORKING WITH DOCUMENTS
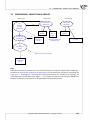
In order to build a rela onship one ought to select the datasheet from which the copying is to be done
and the datasheet into which the copied data will be transfered. Both datasheets ought to have the
same key, i.e. the variable the values of which iden fy each row in the datasheet. The key for the
source datasheet must be unique. The principle of the design is a one-to-many rela onship, i.e. one
row from the source datasheet can be related to many rows from the des na on datasheet. The keys
of both datasheets ought to be selected as Related variables. Having set the rela onship as described
above, we select the variables to be copied and to the column a er which the copied variables are to
be placed.
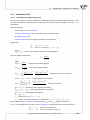
3.1.3 DATASHEET WINDOW
Rows and columns of a datasheet are marked with successive natural numbers. You can give your own
header to each column in a place where grey colour occurs. There is a Message bar at the top of each
datasheet. The message bar displays all current informa on for you. The le side of the bar gives you
all informa on about the dimension of the selected area [like the number of rows, columns], the centre
part of the bar displays the value occurred in the selected cell and the right side of the bar gives you
informa on mainly about a sta s cal analysis which is in progress at that moment.
Copyright ©2010-2014 PQStat So ware − All rights reserved
10
3
WORKING WITH DOCUMENTS
3.1.4 CELLS FORMAT
Each datasheet cell (including the column heading) can contain a maximum of 40 signs. Also allowed
are texts containing na onal characters. The introduced values can be forma ed as:
• default – in the case of the default format the program automa cally recognizes the content of
a cell with regard to numerical and text data;
• text – in the case of the text format the data are interpreted as text (alignment to the le edge
of the cell);
• data – in the case of the date format the data are interpreted as subsequent values of a date, thus
value 1 means 1899.12.31, value 2 means 1900.01.01, and so on. Depending on the selected date
format one can also introduce text data in a selected format:
2010.12.31
31.12.2010
12.31.2010
2010/12/31
31/12/2010
12/31/2010
2010-12-31
31-12-2010
12-31-2010
•
me – in the case of the me format the data are interpreted as subsequent values of me,
and the decimal part of a number means the number of milliseconds from midnight divided by
the total number of milliseconds in a day (86,400,000), thus value 0.000694444 means 00:01:00,
value 0.041666667 means 01:00:00, and value 0.999988426 means 23:59:59. Depending on the
selected me format one can also enter text data in a selected format:
18:31:58
18:31
12/31/2010 18:31
12/31/2010 18:31:58
Copyright ©2010-2014 PQStat So ware − All rights reserved
11
3
WORKING WITH DOCUMENTS
• numerical – real numbers in this format are in the form of a decimal, and the sign dividing the
whole number from the decimal number is a comma or a dot (depending on the se ngs selected
in the window hyperlinkse ngsSettings in the field Decimal separator), it is possible to set the
number of decimals and the thousands separator;
• scien fic – i.e. when M · 10E is used, where the basis is the M man ssa, and the E - index of
the power is an integer; as in the numerical format it is possible to set the number of decimals;
• percentage – they change the number into a percentage by mul plying by 100 and displaying it
with the % symbol; as in the case of the numerical format it is possible to set the number of the
decimals;
• currency – used for money values; allows to add the symbol of a currency; as in the case of the
numerical format it is possible to set the number of the decimals;
• range – marked with the use of the upper and lower boundary; as in the case of the numerical
format it is possible to set the number of the decimals;
• formula – values calculated according to the formula ascribed to the column; the values are automa cally recalculated when any of the entry data is changed.
When a new sheet is opened, there is a standard default format for each cell. In a default format the
sheet supports cell content automa cally.
A whole header row is set permanently of the text format. You can set defined formats for the rest of
the sheet. Only a whole column can be forma ed (except for its header), not a single cell.
To set a column format you should select:
- Format in a context menu of the number displayed above a column header,
- Edit→Column format, when an ac ve cell iden fies the proper column.
You can define the width of a column by using a mouse arrow. In order to do this, you should move the
line which divides two neighbouring columns to narrow or widen the column on the le side of above
men oned line.
Addi onally, you can set different colour of the background in each cell of a sheet (when you select the
Copyright ©2010-2014 PQStat So ware − All rights reserved
12
3
WORKING WITH DOCUMENTS
area you want to change). To do this, use:
- bu on on the toolbar,
- Cell colour command on the cell's context menu.
3.1.5 DATA EDITING
You can select the consistent area of a sheet using a mouse or a keyboard (Keyboard arrows + Shift).
While selec ng an area, its size is displayed currently on the Message box (the number of rows and
columns). You can easily select the whole sheet by clicking the top le corner of the sheet or selec ng
from the menu Edit→Select all (Ctrl+A). If you want to select the whole columns or rows, just click
their headers.
Cell Copying and moving is performed with Copy, Cut and Paste.
The above commands can be found in several places like:
- Edit menu,
- Context menu of each cell or cells,
bu ons on the toolbar,
- Context menu of the columns and rows,
- Shortcut keys: Copy (Ctrl+C), Cut (Ctrl+X), and Paste (Ctrl+V).
To delete data from cells select Edit→Delete (Del)
If you want to undo recent opera ons select Edit→Undo (Ctrl+Z). There are 10 recent opera ons automa cally saved in a Program memory. Each opera on refers to maximum 5000 cells. These se ngs
may be changed in a Settings window. However, note that the higher the values used in a opera on,
the more computer memory is used by the program.
How to insert and delete rows and columns
You can insert empty columns or rows above or on the le side of already exis ng ones. It will move
the old ones down or to the right side. To insert row/rows, you should select the one/ones above which
you want to insert new ones. Then, you should choose Insert row in a context menu of the number of
selected row. Exactly the same way you can insert new columns.
Rows and columns can be both inserted and deleted. You can delete them by selec ng Delete row/Delete
column on the context menu of the number of a row or a column.
How to find/replace a cell value
To find or replace cell value contents with another value, you should use a Search/Replace window,
which you can find in Edit menu→Find/Replace (Ctrl+F). To search, use upper half of the window, to
change a cell content, use lower half of the window.
Copyright ©2010-2014 PQStat So ware − All rights reserved
13
3
WORKING WITH DOCUMENTS
To find specific data, you should write the right characters in the upper half of the window, then select
the sequence of searching and click Find.
To find and to replace the whole cell content with another value, you should fill in an upper half as well
as a lower half of the window. An upper half should be filled in exactly the same way as you do with
data searching. In the lower half of the window you should insert data which are supposed to replace
the already found one. Then you should click Find and Replace or Find and Replace All (if you want
to replace all the found data which occurred). Both searching and replacing data accompanies a direct
preview of a current ac on on the sheet.
3.1.6 HOW TO SORT DATA
The op ons of sor ng data will be found a er choosing Sort... from Data menu or Sort... op on in a
context menu of the number displayed above a column header. Usually the whole datasheet is sorted
(this is a default se ng), but if you first select the part of the data, then in the sor ng window you will
have an opportunity to reduce the area just to this selected part of the data.
Copyright ©2010-2014 PQStat So ware − All rights reserved
14
3
WORKING WITH DOCUMENTS
In the window of sor ng, you can move (using indicators) from Choose variables box to Sequence box
these variables, according to which you want to sort the data. Then you should choose Sort order and
confirm your choice by clicking Run.
You can choose maximum 3 colums as a criteria of sor ng. If you sort data using more than one criterion,
then sor ng is performed according to column (variables) sequences, placed in a Sequence box.
3.1.7 HOW TO CONVERT RAW DATA INTO CONTINGENCY TABLE
You can start the opera on of conver ng raw data into a con ngency table by selec ng Create table...
from Data menu. Usually, there is the whole data sheet available for this opera on (default). However,
if you start the conversion from selec ng a piece of data, you will be able to reduce the area available
only to the selec on.
A con ngency table can be designed by selec ng the variables forming row and column labels. If a
preview of the table does look like the expected one, you confirm the choice by selec ng Run. The
returned result will be placed in a new datasheet.
Copyright ©2010-2014 PQStat So ware − All rights reserved
15
3
WORKING WITH DOCUMENTS
3.1.8 HOW TO CONVERT CONTINGENCY TABLE INTO RAW DATA
You can start the opera on of conver ng a con ngency table into raw data by selec ng Create raw
data... from Data menu. In the window of data transforma on, we enter appropriate numbers and
headers of rows and columns. You confirm the choice by selec ng Run. The returned result will be
placed in a new datasheet.
If we convert a table which is placed in a datasheet, we have to select it (with or without header) before
the conversion of the table into raw data. Then, in the conversion window, the table will be places
automa cally. It is also possible to use other labeled tables as a saved selec on.
3.1.9 FORMULAS
Defining the formula is a way of calcula ng data so as to obtain new values for the variables.
Copyright ©2010-2014 PQStat So ware − All rights reserved
16
3
WORKING WITH DOCUMENTS
The window in which we define formulas is accessed by selec ng Data→Formulas...
Formulas ascribed to a given variable of the datasheet as the format of that variable are remembered
together with the datasheet. Their result is automa cally recalculated when any of the entry data
are changed. The formula can be ascribed in the Formulas... window or by selec ng Column format
(Ctrl+F10).
Building formulas
We write formulas in the edi on field.
• We enter the variables to which the formulas refer by giving their numbers, e.g. v1+v2.
• Text values are entered with the use of an apostrophe, e.g. 'house'.
• We enter func ons by double clicking on the name of the selected func on. The name then
appears in the edi on field of the formula. Alterna vely, we can enter the name directly in the
edi on field. In such a case the capitaliza on of the le ers in the name of the func on does not
ma er. The func on arguments are given in brackets, with the use of the syntax given in the
descrip on of the func on,
Formula results
The results of the formulas will be displayed in the selected column.
If among the arguments of the func on there will be values which the func on cannot interpret, the
program will display a message asking whether the uninterpreted data ought to be omi ed. A confirma on will cause a recalcula on of the formula without the uninterpreted data. If a nega ve answer
is given, the error value NA will be returned. For example, for values in columns v1, v2, and v3, respecvely: 1, 2, 'ada', the sum func on sum(v1;v2;v3) will return the result 3 if we skip the uninterpreted
value 'ada' or will return NA if we do not skip that value in the calcula ons.
An empty value (missing data) will only be returned when all the arguments used in the formula are
Copyright ©2010-2014 PQStat So ware − All rights reserved
17
3
WORKING WITH DOCUMENTS
empty.
The number of rows taking part in the formula can be limited by selec ng an appropriate range of rows
in the datasheet and by selec ng the op on only from selected rows in the formula window.
Operators
+ addi on,
− subtrac on,
∗ mul plica on,
/ division,
% modulo division (as a result the remainder of division of one number by another),
> greater,
< lower,
= equal.
Mathema cal func ons
Mathema cal func ons require numeric arguments.
ln(v1) - returns a natural logarithm of the given number,
log10(v1) - returns a logarithm to the base 10 of the given number,
logn(v1) - returns a logarithm to the base n of the given number,
sqr(v1) - returns a value of the given number raised to the 2nd power,
sqrt(v1) - returns a value of the square root of the given number,
fact(v1) - returns a value of factorial of the given number,
degrad(v1) - returns the angle in radians (argument are degrees),
raddeg(v1) - returns the angle in degrees (argument are radians),
sin(v1) - returns sinus of the given angle, (argument are radians),
cos(v1) - returns cosinus of the given angle, (argument are radians),
tan(v1) - returns tangens of the given angle, (argument are radians),
ctng(v1) - returns cotangens of the given angle, (argument are radians),
arcsin(v1) - returns arcus sinus of the given angle, (argument are radians),
arctan(v1) - returns arcus tangens of the given angle, (argument are radians),
exp(v1) - returns e raised to the power of the given number,
frac(v1) - returns the frac onal part of the given number,
int(v1) - returns the integer part of the given number,
abs(v1) - returns absolute value of the given number,
odd(v1) - returns 1 if the given nummber is even or 0 if the given number is odd,
sum(v1;...) - returns the result of an addi on of the given numbers,
mul p(v1;...) - returns the result of a mul plica on of the given numbers,
power(v1;n) - returns a value of the given number raised to the n-th power,
norme(v1;...) - returns the Euclidean vector norm,
round(v1;n) - returns a number rounded to n decimal places.
Sta s cal func ons
Funkcje statystyczne wymagają argumentów liczbowych.
stand(v1) - returns a standardised score of the given numbers,
max(v1,...) - returns the highest value out of the given numbers,
min(v1,...) - returns the lowest value out of the given numbers,
mean(v1,...) - returns the arithme cal mean value of the given numbers,
meanh(v1,...) - returns the harmonic mean value of the given numbers,
meang(v1,...) - returns the geometric mean value of the given numbers,
Copyright ©2010-2014 PQStat So ware − All rights reserved
18
3
WORKING WITH DOCUMENTS
median(v1,...) - returns the median value of the given numbers,
q1(v1,...) - returns the lower quar le of the given numbers,
q3(v1,...) - returns the upper quar le of the given numbers,
cv(v1,...) - returns the coefficient of variability value of the given numbers,
range(v1,...) - returns the range value of the given numbers,
iqrange(v1,...) - returns the interquar le range value of the given numbers,
variance(v1,...) - returns the variance value of the given numbers,
sd(v1,...) - returns the standard devia on value of the given numbers.
Text func ons
Text func ons work on any string of characters.
upperc(v1) – converts the characters from the string into capitalized characters,
lowerc(v1) – converts the characters from the string into characters wri en with small le ers,
clean(v1) – removes the unprintable signs,
trim(v1) – removes ini al and final spaces,
length(v1) – returns the length of the string of characters,
search('abc';v1) – returns to the beginning of the search string
concat(v1;...) – joins texts,
compare(v1;...) – compares texts,
copy(v1;i;n) – returns a part of the text, star ng from the ith character, where n is the number of
the returned characters,
count(v1;...) – returns the number of cells which are not empty,
counte(v1;...) – returns the number of empty cells,
countn(v1;...) – returns the number of cells which contain numbers.
Date and me func ons
The date and me func ons should be performed on data forma ed as date or as me (see
chapter 3.1.4). If that is not the case, the program tries to recognize the format automa cally.
When that is not possible it returns the NA value.
year(v1;) – returns the year ascribed to the date,
month(v1;) - returns the month ascribed to the date,
day(v1;) - returns the day ascribed to the date,
hour(v1;) - returns the hours ascribed to the me,
minute(v1;) - returns the minutes ascribed to the me,
second(v1;) - returns the seconds ascribed to the me,
yeardiff(v1;v2) - returns the difference in years between two dates,
monthdiff(v1;v2) - returns the difference in months between two dates,
weekdiff(v1;v2) - returns the difference in weeks between two dates,
daydiff(v1;v2) - returns the difference in days between two dates,
hourdiff(v1;v2) - returns the difference in hours between two mes,
minutediff(v1;v2) - returns the difference in minutes between two mes,
seconddiff(v1;v2) - returns the difference in seconds between two mes,
compdate(v1;v2) - compares two dates and returns the number 1 when v1> v2, 0 if v1 = v2, -1 if
v1 <v2.
Logical func ons
if(ques on;'yes answer';'no answer') – the ques on has the form of a statement which can be
true or false. The func on returns one value if the statement is true and another value if it is
false,
and – conjunc on operator – returns the truth (1) when all the condi ons it connects are true;
Copyright ©2010-2014 PQStat So ware − All rights reserved
19
3
WORKING WITH DOCUMENTS
otherwise, it returns falsity (0),
or – alterna ve operator – returns the truth (1) when at least one of the condi ons it connects
is true; otherwise, it returns falsity (0),
xor – either/or operator – returns the truth (1) when one of the condi ons it connects is true,
otherwise, it returns falsity (0),
not – nega on operator – used in a condi onal sentences if.
3.1.10 HOW TO GENERATE DATA
There are 2 methods of data genera on:
1. The first method uses a pull technique. All the data are pulled from the selected cells into the
neighbouring ones using a mouse arrow. This method enables you to generate exactly the same
values (number or text ones) in the neighbouring columns or rows.
To start data genera on, select a cell with the proper content, then click on the right down corner
using a mouse arrow illustra ve + sign and not le ng it go just pull through all the cells you want
to fill. Pulling one cell can be done in any direc on (up, down, right, le ). It is also possible to
pull various values which are put in a one column (le or right) or in a one row (up or down).
2. The other method enables you to generate numerical data in columns as: a data sequence, random values or random values of the proper data distribu on.
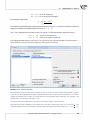
To generate numerical data you should select a cell, where you want to start filling the datasheet
and open data genera on window in Data menu→Generate...
We indicate a variable, in which the generated data will be placed.
In the middle part of the window, depending on the way of data genera on se ngs chosen above,
set:
• To generate data series:
- Start value - the first value which needs to be generated,
Copyright ©2010-2014 PQStat So ware − All rights reserved
20
3
WORKING WITH DOCUMENTS
- Increment - a value which is supposed to be the difference between the following generated data.
• To generate random numbers:
- Lower limit - beginning of the interval, from which the values will be randomised,
- Upper limit - end of the interval, from which the values will be randomized.
• To generate random values from the distribu on, you should choose the sort of distribu on
(Normal distribu on, Chi-square distribu on) and then write its parameters.
The amount of generated data depends on the value you put in the Count field, but the precision depends on se ngs of the Decimal places field. Data will be put up or put down star ng with an ac ve
cell - it depends on a selected op on. At the end, confirm your choice by clicking Run.
3.1.11 MISSING DATA
In studies we very o en see missing data. That is especially to be expected in the case of survey data.
There are situa ons in which the missing data gives valuable informa on. For example, the number
of missing data in answer to a ques on concerning preferences with regard to poli cal par es informs
us about the number of undecided ci zens who do not favor (or do not admit they do) par cular poli cal groups. Small amounts of missing data do not cons tute a problem in sta s cal analyses. Large
amounts, however, can undermine the reliability of the conducted research. It is worth taking care that
there are as few such lacks as possible, from the start. Obviously, it would be preferable to gain access
to the real value and enter it in place of the missing data but that is not always possible.
The manner in which the missing data are treated depends, primarily, on their character. In this program a number of ways have been implemented for impu ng the missing data for par cular variables.
The window with the se ngs for the replacing missing data op on is accessed from the menu Data→Missing
data...
Copyright ©2010-2014 PQStat So ware − All rights reserved
21
3
WORKING WITH DOCUMENTS
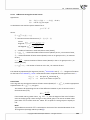
1. Filling in with one value
Selec ng one of the op ons below will cause the replacement of all the missing data in the selected column it with the same value.
• given by the user,
• the arithme c mean calculated from the data,
• the geometric mean calculated from the data,
• the harmonic mean calculated from the data,
• the median,
• the mode (unless it is mul ple).
2. Filled with many values
The selec on of one of the op ons below will cause the replacement of the missing data in the
selected column with many (usually different) values. The values can be predicted on the basis of
the column for which the missing data are being replaced or on the basis of the values of other
columns (variables). The missing data can be replaced with the following types of values:
• random values from the dataset,
• random values from the normal distribu on defined on the basis of the mean and the standard devia on from the exis ng data,
Copyright ©2010-2014 PQStat So ware − All rights reserved
22
3
WORKING WITH DOCUMENTS
• random values from a range given by the user,
• calculated from the user's func ons, which allows the use of data from other variables so
as to be able to predict the missing value in the selected column,
• calculated from the regression model, which allows to predict the values of the missing
data on the basis of a mul ple regression model (the manner in which mul ple regression
operates was described in chapter ?? Multiple linear regression),
• interpola on on the basis of the neighboring values – it applies to me series – so the user
must point to the me variable which gives informa on about the data order; the interpola on consists in the determina on of the value for the missing data in such a manner that
they are placed, graphically, on a straight line joining the values of the data neighboring the
missing data,
• the mean from the n of the neighbors – it applies to me series – so the user must point
to the me variable which informs about the order of data; the interpola on consists in
determining a mean from the value for n antecedent neighbors and n neighbors directly
following the missing data,
• the median from n neighbors – it applies to me series – so the user must point to the me
variable which informs about the order of data; the interpola on consists in determining a
median from the value for n antecedent neighbors and n neighbors directly following the
missing data.
Note!
In order to be able to dis nguish the imputed data from the real data, the replaced data are marked
with a selected color.
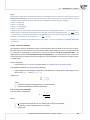
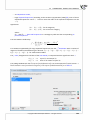
E
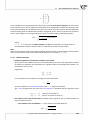
3.1. (file: missingData - publisher.pqs)
The analysis of the file wydawca.pqs not containing missing data was discussed in the chapter Multiple
linear regression. This me we will discuss a datasheet in which, in the column containing the gross
profit from a sale of books, there are missing data. In the case of those missing data we know the real
values (datasheet: "REAL VALUES") so we can refer the values generated in the program in the place of
the missing data to the real values and compare the results obtained with the use of various techniques.
In the example we will use 2 methods of replacing missing data: replacing them with the value of the
median and replacing them with a value determined on the basis of a regression model. The remaining
possibili es can be studied independently.
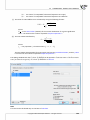
Replacing the missing data with the value of the median is done with the use of the first datasheet
called “Insert the median”. In the Missing data window we set a variable filled in as the gross profit and
in this way select the value of the median as a method of replacement. Consequently, the missing data
will be replaced with the value USD 46,850.
We suspect that the profits are greater when famous authors' books (coded as 1) are sold and smaller
when they arise from the sale of less known authors' books (coded as 0). We will, then, calculate the
median of the gross profit separately for the famous authors' books and for the less known authors'
books. The imputa on is made on the datasheet called “Insert two medians”. We set, twice, a filter for
the variable defining the popularity of an author (variable 7), giving it, respec vely, values 1 and 0. The
obtained median of the gross profit in the group of the popular authors' books is about USD 51,000 and
in the group of the less popular authors' books it is about USD 34,000.
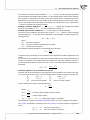
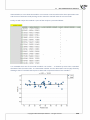
The missing data can also be replaced with the use of the regression model. We choose the data sheet
“Insert from regression” and once more select, in the Missing data window, a variable concerning the
gross profit as the variable which ought to be filled in, and select the Values predicted from regression
Copyright ©2010-2014 PQStat So ware − All rights reserved
23
3
WORKING WITH DOCUMENTS
as a replacement method. This me there will be more variables allowing us to predict the value of
the gross profit. They will be: produc on costs (variable no.3), adver sing costs (variable no.4), and
author's popularity (variable no. 7). The results now seem to be less distant from the real values.
However, there is no result for posi on no. 35, because there was no informa on about the produc on
costs of that book, that is the factor on which we wanted to base our predic on.
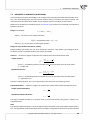
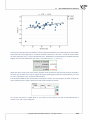
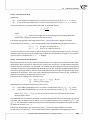
3.1.12 NORMALIZATION/STANDARDIZATION
The normaliza on/standardiza on window is accessed via Data→Normalization/Standardization...
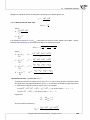
The normaliza on of data is scaling them to a range, e.g. to a range of [-1, 1] or [0,1].
Min-max normaliza on
The min-max normaliza on with the use of a linear func on scales data to a (newmin , newmax )
range indicated by the user. For that purpose we should know the range which the data can
reach. If we do not know the range we can avail ourselves of the greatest and the smallest values
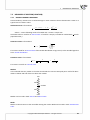
in the analyzed set (in such a case we select the calculate from sample op on in the Normalization/Standardization window.
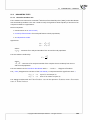
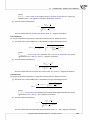
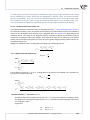
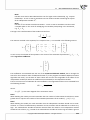
x′ =
x − min
· (newmax − newmin ) + newmin
max − min
(1)
Logarithmic normaliza on
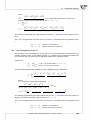
Normaliza on with the use of the logarithmic func on (S-shaped) reduces the data to the range
of (0,1).
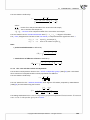
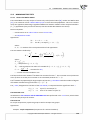
ex
(2)
1 − ex
If we want to extend the transformed data in a different range then we ought to enter, in the
Normalization/Standardization window, the limits of the new range.
x′ =
Normalizing func on with a coefficient
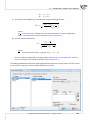
The normaliza on reduces the data to the range of (-1,1) with the use of an S-shaped func on
with the changing α normaliza on coefficient.
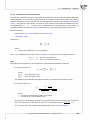
x
x′ = √
2
x +α
Copyright ©2010-2014 PQStat So ware − All rights reserved
(3)
24
3
WORKING WITH DOCUMENTS
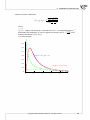
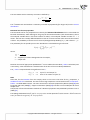
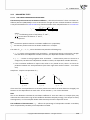
When the value of the α coefficient is raised, a graph with a less steep slope is formed.
If we want to extend the transformed data in a different range then we ought to enter, in the
Normalization/Standardization window, the limits of the new range.
Standardiza on
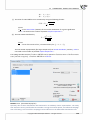
Standardiza on is the transforma on of data as a result of which the mean of a variable is equal
to 0 and its standard devia on is equal to 1.
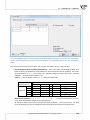
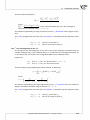
x−x
¯
x′ =
(4)
sd
E
3.2. (file: normaliza on.pqs)
Make the transforma ons of all the variables included in the file
a) using the minimum-maximum normaliza on to the range [0.10];
b) using the logarithmic normaliza on;
c) using the normaliza on with a coefficient;
d) using standardiza on.
3.1.13 SIMILARITY MATRIX
The mutual rela onships among objects can be expressed by their distances or, more generally, by
the differences among them. The further from one another the objects are the more they differ, the
closer they are, they resemble one another. One can study the distance of the objects with respect to
many features, e.g. when the compared objects are ci es, we can define their similarity on the basis
of, among other things: the length of the road which joins them, popula on density, GDP, pollu on
emissions, average property prices, etc. With so many characteris cs at the researcher's disposal, he
or she must select such a measure of distance as will best represent the real similarity of objects.
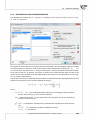
The window with the se ngs for the similarity matrix op on is accessed from the menu Dane→Similarity
matrix...
Copyright ©2010-2014 PQStat So ware − All rights reserved
25
3
WORKING WITH DOCUMENTS
The differences/similari es of the objects are expressed with the use of distance, usually in the form of
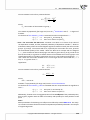
a metric. However, not every measure of distance is a metric. For a distance to be called a metric it has
to fulfill 4 condi ons:
1. the distance between the objects cannot be a nega ve number: d(x1 , x2 ) ≥ 0,
2. the distance between the objects equals 0 if and only if the objects are iden cal:
d(x1 , x2 ) = 0 ⇐⇒ x1 = x2 ,
3. the distance must be symmetrical, i.e. the distance from the object x1 to x2 must be
the same as from the object x2 to x1 : d(x, y) = d(y, x),
4. the distance must fulfill the condi ons of the triangle inequality: d(x, z) ≤ (x, y) +
d(y, z).
Note!
The metrics ought to be calculated for characteris cs with the same range of values. Otherwise, the
characteris cs with higher ranges would have a greater influence on the obtained similarity result than
those with lower ones. For example, when calcula ng the similarity of people we can base the calculaon on such features as weight or age. Then, the weight in kilograms, in the range from 40 to 150 kg,
will have a greater influence on the result than age in the range of 18 to 90 years. For the influence of
all characteris cs on the obtained similarity result to be balanced we ought to normalize/standardize
each of them before commencing the analysis. If we want to decide on the degree of that influence by
ourselves, we should enter our own weights, selec ng the type of the metric, a er the standardiza on.
Distance/Metric:
Euclidean
When we talk about distance without defining its type we assume that it is the Euclidean distance,
the most popular type of distance, cons tu ng a natural element of models of the real world. The
Euclidean distance is a metric described by the formula:
v
u n
u∑
(x1k − x2k )2
d(x1 , x2 ) = t
k=1
Minkowski
The Minkowski distance is defined for parameters p and r equal to each other. It is then a metric.
Such a kind of a metric allows the control of the process of calcula ng the similarity by giving
values p and r in the formula:
v
u n
u∑
p
d(x1 , x2 ) = t
|x1k − x2k |r
k=1
When we increase the r parameter, we increase the weight ascribed to the difference between
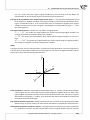
the objects for every characteris c. When we change the p parameter, we increase/decrease the
weight ascribed to less/more distant objects. If r and p are equal to 2 the Minkowski distance
comes down to the Euclidean distance. If they are equal to 1 – to the city block distance. If the
parameters tend to infinity – to the Chebyshev metric.
city block (also called the Manha an or taxicab metric
It is the distance which allows the movement only within two perpendicular direc ons. That kind
of distance reminds movement along perpendicular streets (a square street network reminiscent
Copyright ©2010-2014 PQStat So ware − All rights reserved
26
3
WORKING WITH DOCUMENTS
of the grid layout of most streets on the island of Manha an). The metric is calculated with the
formula:
n
∑
d(x1 , x2 ) =
|x1k − x2k |
k=1
Chebyshev
The distance between the compared objects is the greatest of the obtained distances for the
par cular characteris cs of those objects.
d(x1 , x2 ) = max |x1k − x2k |
k
Mahalanobis
The Mahalanobis distance is also called sta s cal distance. It is weighted by the covariance matrix, which allows the comparison of objects described by mutually correlated features. The use
of the Mahalanobis distance has two basic advantages:
1) The variables for which greater devia ons or value range are observed do not have
an increased influence on the result of the Mahalanobis distance (because when we
use a covariance matrix we standardize the variables with the use of the variance on
the diagonal). As a result, before star ng the analysis one does not have to standardize/normalize the variables.
2) It takes into account the mutual correla on of the features describing the compared
objects (when we use a covariance matrix we use the informa on about the dependency among the features, which is placed beyond the diagonal of the matrix.
√
d(x1 , x2 ) =
(⃗x − ⃗y )T S −1 (⃗x − ⃗y )
The measure calculated in that manner fulfills the requirements of being a metric.
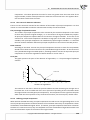
Cosine
The cosine distance ought to be calculated on posi ve data because it is not a metric (id does not
fulfill the first condi on: d(x1 , x2 ) ≥ 0). If, then, there are characteris cs which also have nega ve values, we should transform them in advance, with the use, for example, of normaliza on
to a range of posi ve numbers. The advantage of that distance is that (for posi ve arguments) it
is limited to the range of [0, 1]. A similarity of two objects is represented by the angle between
the two vectors represen ng the characteris cs of those objects.
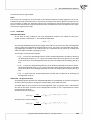
d(x1 , x2 ) = 1 − K,
where K is the similarity coefficient (the cosine of the angle between two normalized vectors):
∑n
x1k x2k
K = √∑ k=1 √∑
n
n
2
2
k=1 x1k
k=1 x2k
The objects are similar if the vectors overlap. In such a case, the cosine of the angle (similarity)
equals 1, and the distance (difference) equals 0. The objects are different if the vectors are perpendicular. In such a case the cosine of the angle (similarity) equals 0. The distance (difference)
equals 1.
Copyright ©2010-2014 PQStat So ware − All rights reserved
27
3
WORKING WITH DOCUMENTS
Bray–Cur s
The Bray-Cur s distance (the measure of dissimilarity) ought to be calculated on posi ve data
as it is not a metric (it does not fulfill the first condi on): d(x1 , x2 ) ≥ 0). If, then, there are
characteris cs which also have nega ve values, we should transform them in advance, with the
use, for example, of normaliza on to a range of posi ve numbers. The advantage of that distance
is the fact that (for posi ve arguments) it is limited to the [0, 1] range, where 0 means that the
compared objects are similar, and 1 – that they are dissimilar.
∑n
|x1k − x2k |
∑
d(x1 , x2 ) = nk=1
(5)
(x
k=1 1k + x2k )
Calcula ng the measure of similarity BC we subtract the Bray-Cur s distance from value 1:
BC = 1 − d(x1 , x2 )
(6)
Jaccard
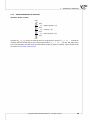
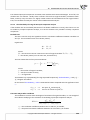
The Jaccard distance (measure of dissimilarity) is calculated for binary variables (Jaccard, 1901),
where 1 means the presence of a given characteris c and 0 means the absence of it.
object 2
1
0
objekt 1
1
0
a
b
c
d
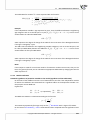
The Jaccard distance is expressed with the formula:
d(x1 , x2 ) = 1 − J.
(7)
where:
J=
a
a+b+c
– Jaccard's similarity coefficient.
Jaccard's similarity coefficient is within the range [0,1] where 1 means the highest and 0 the
lowest similarity. The distance (dissimilarity) is interpreted in the opposite manner: 1 means that
the compared objects are dissimilar and 0 that they are very similar. The meaning of Jaccard's
similarity coefficient can be illustrated very well by the situa on of clients choosing products.
The fact of the purchase of a given product by a client will be marked with 1 and the fact of not
purchasing the product by 0. When calcula ng Jaccard's coefficient we will compare 2 products so
as to learn how many clients buy them together. We are not, off course, interested in the clients
who did not buy any of the compared products. What we are interested in is how many people
who bought one of the compared products also bought the other one. The sum a + b + c is the
number of clients who bought one of the compared products and a is the number of customers
who bought both products. The higher the coefficient the more interrelated the purchases (the
purchase of one product is accompanied by the purchase of the other one). The opposite is true
if we obtain a high Jaccard's dissimilarity coefficient. Such a situa on shows that the products
compete with each other, i.e. the purchase of one product will exclude the purchase of the other
one.
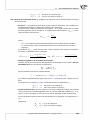
The formula of Jaccard's similarity coefficient can also be presented in the general form:
J=
∑n
2
k=1 x1k
∑n
x x2k
∑nk=1 21k ∑
n
x
k=1 2k − k=1 x1k x2k
Copyright ©2010-2014 PQStat So ware − All rights reserved
28
3
WORKING WITH DOCUMENTS
proposed by Tanimoto (1957). An important feature of the Tanimoto formula is that it can also
be calculated for con nuous characteris cs.
In the case of binary data, Jaccard's and Tanimoto's dissimilarity/similarity formulas are iden cal
and fulfill the condi ons of a metric. For con nuous variables the Tanimoto formula is not a metric (does not fulfill the condi ons of the triangle inquality).
Example – a comparison of species
We compare the gene c similarity of the representa ves of three different species, in terms of
the number of genes common to all the species. If a gene is present in an organism, we ascribe
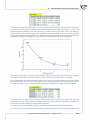
it value 1. In the opposite case we ascribe it value 0. For the sake of simplicity only 10 genes are
subjected to the analysis.
GENS
representa ve1
representa ve2
representa ve3
gen1
0
0
1
gen2
1
0
0
gen3
1
1
1
gen4
1
1
1
gen5
1
1
0
gen6
1
1
0
gen7
1
1
1
gen8
0
0
0
gen9
1
1
0
gen10
0
0
0
The calculated similarity matrix looks as follows:
REPRESENTATIVES
representa ve1
representa ve2
representa ve3
representa ve1
0
0.857143
0.375
representa ve2
0.857143
0
0.428571
representa ve3
0.375
0.428571
0
The most similar representa ves are no. 1 and no. 2, and the least similar ones are no. 1 and no.
3. - Jaccard's similarity of representa ve 1 and representa ve 2 is 0.857143 which means that the
2 species share a li le above the 85- Jaccard's similarity of representa ve 1 and representa ve 3
is 0.375 which means that the 2 species share above 37- Jaccard's similarity of representa ve 1
and representa ve 3 is 0.428571 which means that the 2 species share above 43
Similarity matrix op ons are used for selec ng the manner in which the elements of the matrix ought
to be returned. By default all elements of the matrix are returned in the form in which they have been
calculated according to the accepted metric. We can change it by se ng:
Matrix elements:
- minimum means that in each row of the matrix only the minimum value and the value on
the main diagonal will be displayed;
- maximum means that in each row of the matrix only the maximum value and the value on
the main diagonal will be displayed;
- k of the minimum means that in each row of the matrix as many smallest values will be
displayed as indicated by the user who gives the k value and the value on the main diagonal;
- k of the maximum means that in each row of the matrix as many greatest values will be
displayed as indicated by the user who gives the k value and the value on the main diagonal;
- elements below d means that in each row of the matrix only those elements will be displayed
the value of which will be smaller than value d indicated by the user and the value on the
main diagonal;
Copyright ©2010-2014 PQStat So ware − All rights reserved
29
3
WORKING WITH DOCUMENTS
- elements above d means that in each row of the matrix only those elements will be displayed
the value of which will be greater than value d indicated by the user and the value on the
main diagonal;
Neighborhood 0/1
By choosing the op on Neighborhood 0/1 we replace the values inside the matrix with value 1
and the empty places with value 0. In that manner we indicate, for example, if the objects are
neighbors (1) or not (0).
Standardiza on by rows
Standardization by rows means that each element of the matrix is divided by the sum of the row
of the matrix. As a result, the obtained values are in the range from 0 to 1.
Replace the empty elements
The op on Replace the empty elements allows the entry of the value which is to be placed in the
matrix instead of possible empty elements.
The selected iden fier of the object allows us to name the rows and columns of the similarity matrix
according to the nomenclature stored in the indicated variable.
E
3.3. (file: flats similari es.pqs)
In the procedures of property pricing the issue of similarity is very important, for both substan al and
legal reasons, For example, it is the main premise for grouping objects and ascribing them to an appropriate segment.
Let us assume that a person who is looking for a flat comes to a real estate agent and defines the obligatory and op onal characteris cs of the desired property. The characteris cs which the flat must have
are:
• it is a retail property (the subject of separate ownership),
• it is in district A,
• it is located in a low block of flats (a maximum of 5 floors),
• it is not renovated (average standard or sub-standard).
The data concerning those flats are gathered in a table where 1 means that the property fulfills the
search condi ons and 0 means that it does not fulfill them.[0.2cm] The flats which do not fulfill the
search condi ons will be excluded from the analysis by deac va ng appropriate rows. We deac vate
the rows which do not fulfill any of the condi ons, in the menu Edition→Activate/Deactivate (filter)....
Copyright ©2010-2014 PQStat So ware − All rights reserved
30
3
WORKING WITH DOCUMENTS
The condi ons of the deac va on should be connected with an alterna ve (we change
to
).
11 flats appropriate for the segment (fulfilling all 4 condi ons) were found in the search (numbers 10,
12, 17, 35, 88, 101, 105, 122, 130, 132, and 135).
Now we will take into account the features which have a great impact on the client's choice but are not
decisive:
• The number of rooms = 3;
• The floor on which the flat is placed = 0;
• The age of the building in which the flat is placed = c. 3 years old;
• Proximity of district A (the me it takes to get to the center) = c. 30 minutes;
• Proximity of a bus or tram stop = c. 80 m.
Wanted
Flat 10
Flat 12
Flat 17
Flat 35
Flat 88
Flat 101
Flat 105
Flat 122
Flat 130
Flat 132
Flat 135
Number
of
rooms
3
2
1
3
2
3
4
2
1
2
3
3
Floor
on which the flat
is located
0
1
2
1
0
4
2
2
0
0
5
1
Age
of the
building
3
1
1
7
6
6
10
6
6
10
6
6
Distance
of the district
center
30
0
0
20
5
5
0
0
5
0
30
5
Proximity
of a bus or
tram stop
80
150
200
500
100
200
10
50
100
20
400
100
Let us note that the last characteris c, i.e. the proximity of a bus or tram stop, is expressed in much
greater numbers than the remaining characteris cs of the compared flats. As a result that characteris c will have a much greater influence on the obtained result of the distance matrix than the remaining characteris cs. In order to prevent it, before the analysis we will normalize all characteris cs by choosing a common range for them, from 0 to 1. For that purpose we will use the menu
Data→Normalization/Standardization.... In the normaliza on window we set the "Number of rooms"
as the input variable and the empty variable called "Norm(Number of rooms)" as the output variable;
the type of the normaliza on is min/max normalization; the min and max values are calculated from
the sample by selec ng the bu on Calculate from sample – the result of the normaliza on will be
returned to the datasheet a er selec ng the bu on Run. The normaliza on is repeated for the following variables, i.e.: "Floor on which the flat is located", "Age of the building", "Distance of the district
center", and "Proximity of a bus or tram stop".
Copyright ©2010-2014 PQStat So ware − All rights reserved
31
3
WORKING WITH DOCUMENTS
The normalized data are presented in the table below.
Wanted
Flat 10
Flat 12
Flat 17
Flat 35
Flat 88
Flat 101
Flat 105
Flat 122
Flat 130
Flat 132
Flat 135
Norm(Number
of
rooms)
0,666666667
0,333333333
0
0,666666667
0,333333333
0,666666667
1
0,333333333
0
0,333333333
0,666666667
0,666666667
Norm(Floor
on which the flat
is located)
0
0,2
0,4
0,2
0
0,8
0,4
0,4
0
0
1
0,2
Norm(Age
of the
building)
0,222222222
0
0
0,666666667
0,555555556
0,555555556
1
0,555555556
0,555555556
1
0,555555556
0,555555556
Norm(Distance
of the district
center)
1
0
0
0,666666667
0,166666667
0,166666667
0
0
0,166666667
0
1
0,166666667
Norm(Proximity
of a bus or
tram stop)
0,142857143
0,285714286
0,387755102
1
0,183673469
0,387755102
0
0,081632653
0,183673469
0,020408163
0,795918367
0,183673469
On the basis of the normalized data we will select the flats which are the most suited to the client's
inquiry. We will use the Euclidean (distance) metric to calculate the similarity. The smaller the obtained
value the more similar the proper es. The analysis can be made with the assump on that each of
the five characteris cs enumerated by the client is equally important but one can also point to the
characteris cs which should have a greater influence over the result of the analysis. We will build two
matrices of Euclidean distances:
(1) In the first matrix there will be Euclidean distances calculated on the basis of the five characteris cs when equally treated;
(2) In the second matrix there will be those Euclidean distances in the construc on of which the
number of rooms and the distance to the district center play the most important role.
In order to build the first matrix we select 5 normalized variables in the matrix window, marked as Norm,
the Euclidean metric, and the Identifier of the object "Flat" variable.
Copyright ©2010-2014 PQStat So ware − All rights reserved
32
3
WORKING WITH DOCUMENTS
To build the second matrix we choose, in the matrix window, the same se ngs as in the case of the first
matrix, with the difference that now we addi onally select the bu on Modification: Euclidean and we
enter greater weights for the "Number of rooms" and the "Distance of the district center" in the modifica on window. For example, their values could be equal to 10, and for the remaining characteris cs
the values could be smaller, e.g. equal to 1.
As a result we will obtain two matrices. In each of them the first column concerns the similarity to the
flat looked for by the client:
Copyright ©2010-2014 PQStat So ware − All rights reserved
33
3
Euclidean
Wanted
Flat 10
Flat 12
Flat 17
Flat 35
Flat 88
Flat 101
Flat 105
Flat 122
Flat 130
Flat 132
Flat 135
Wanted
0
1.10
1.31
1.04
0.96
1.23
1.38
1.18
1.12
1.32
1.24
0.92
...
...
...
...
...
...
...
...
...
...
...
...
...
Weighted euclidean
Wanted
Flat 10
Flat 12
Flat 17
Flat 35
Flat 88
Flat 101
Flat 105
Flat 122
Flat 130
Flat 132
Flat 135
WORKING WITH DOCUMENTS
Wanted
0
3.35
3.84
1.44
2.86
2.78
3.45
3.37
3.39
3.43
1.24
2.66
...
...
...
...
...
...
...
...
...
...
...
...
...
According to the unmodified Euclidean distance, the flats best suited to the client's condi ons are no.
35 and 135. Having considered the weights, the flats best suited to the client's condi ons will be no.
17 and no. 132 which are the first flats with the number of rooms (3) and the distance to the district
center similar to that requested by the client. The other 3 characteris cs have a smaller influence on
the result.
Copyright ©2010-2014 PQStat So ware − All rights reserved
34
3
WORKING WITH DOCUMENTS
3.2 HOW TO WORK WITH REPORTS ( RESULTS SHEETS)
A report is a project element which enables you to store the results of an already done sta s c analysis.
The report is added automa cally to the project and ascribed to the ac ve datasheet at the moment
of finishing the current sta s c procedure. Note, that it can not be edited, except for graphs and tle.
Edi on of the graph is run by double clicking the mouse or through the context menu of the right mouse
bu on. Title edi on is done in the Project Manager by adding or changing the descrip on.
The main opera ons of the report can be done via the context menu in the report window
• Prin ng
The op ons of prin ng are available by:
− context menu,
− File menu →Print...
• Export reports
Reports created in PQStat can be exported to a file in *.r (supported by most of text editors
such as Word), *. pdf, *.xml.
If the export is made in the Project Manager, the reports can be placed in separate files or in one
joint file. To do this, select the adequate reports and then the
bu on and export to a file or
files with the selected format. Individual reports can be exported separately through the context
menu in the report window.
• Describing reports
Reports can be described in the Project Manager or in the context menu of report window by
adding a tle or a note.
• Edi ng graphs
Edi ng graph rela ve to its General and Detailed Op ons is available in the context menu in the
report window.
• Copying reports
By means of the clipboard, you can also move the results of an analysis into another applica ons,
for example Word or Excel.
• Dele ng reports
You can delete a report by:
Copyright ©2010-2014 PQStat So ware − All rights reserved
35
3
WORKING WITH DOCUMENTS
− context menu Delete report (Shift+Del) on the name of the report in the Navigation tree,
− Project Manager.
However, you should remember: if there are any layers of map added to a datasheet and you
delete datasheet, all layers a ached to it will be deleted too.
The order of reports can be changed with the use of the context menu of the right mouse bu on Up
(Ctrl+Up) or Down (Ctrl+Down) on the name of the report in the Navigation tree.
Adding informa on to the report name in Navigation tree, such as:
- the hour of genera on,
- descrip on,
- filter,
- the name of the grouping variable,
- the name of the variable.
it is possible a er selec ng an appropriate op on in the window of program se ngs
3.3 HOW TO CHANGE LANGUAGE SETTINGS IN PQSTAT?
Both created reports and program interface can be changed into Polish and English. To change the
language, you need to click Edition→Language/Jezyk. Reports opened a er the switch, will be translated automa cally (except the procedure name, which is the descrip on and is subjected to the user
edi on).
Copyright ©2010-2014 PQStat So ware − All rights reserved
36
3
WORKING WITH DOCUMENTS
3.4 MENU
File menu
New project (Ctrl+N)
Add datasheet (Ctrl+D)
Open project (Ctrl+O)
Open recent
Open examples
Import from ...
Save (Ctrl+S)
Save as...
Close project
Print
Close (Ctrl+Q) − to close the program
Edit menu
Undo (Ctrl+Z)
Cut (Ctrl+X)
Copy (Ctrl+C)
Paste (Ctrl+V)
Delete (Del)
Select all (Ctrl+A)
Find/Replace (Ctrl+F)
Column format (Ctrl+F10)
Activate/Deactivate (filter)...
Activate all
Save selection (Ctrl+T)
Clear selections
Language/Jezyk
Settings
Data menu
Create table...
Create raw data...
Copyright ©2010-2014 PQStat So ware − All rights reserved
37
3
WORKING WITH DOCUMENTS
Sort...
Formulas...
Generate...
Missing data...
Copying with relation...
Normalization/Standardization .....
Similarity matrix...
Sta s cs menu
Frequency tables
Descriptive statistics
Probability distribution calculator
• Parametric tests
comparison of a one group
t-test
comparison - dependent groups
t-test for dependent groups
ANOVA for dependent groups
comparison - independent groups
t-test for independent groups
F Fisher Snedecor
ANOVA for independent groups
Levene, Brown-Forsythe
measures of correla on and their comparisons
Linear correlation (r Pearson)
Comparison of correlation coefficients
measures of agreement
ICC - Intraclass Correlation Coefficient
• Nonparametric tests (ordered categories)
comparison of a one group
Wilcoxon (signed-ranks)
Kolmogorov-Smirnov
Lilliefors
comparison - dependent groups
Wilcoxon (matched-pairs)
Friedman ANOVA
comparison - independent groups
Copyright ©2010-2014 PQStat So ware − All rights reserved
38
3
WORKING WITH DOCUMENTS
Mann-Whitney
Chi-square for trend
Kruskal-Wallis ANOVA
measures of correla on
Monotonic correlation (r Spearman)
Monotonic correlation (tau Kendall)
measures of agreement
Kendall’s W
• Nonparametric tests (unordered categories)
comparison of a one group
Chi-square
Z for proportion
comparison - dependent groups
Z for 2 dependent proportions
Bowker-McNemar
Cochran Q ANOVA
comparison - independent groups
Z for 2 independent proportions
Chi-square, OR/RR (2x2)
Fisher, Mid-P (2x2)
Chi-square (RxC)
Fisher (RxC)
Chi-square (multidimentional)
measures of correla on
Q-Yule, Phi (2x2)
C-Pearson, V-Cramer(RxC)
measures of agreement
Kappa-Cohen
• Diagnostic tests
Diagnostic tests
ROC Curve
Dependent ROC Curves − comparison
Independent ROC Curves − comparison
• Multivariate models
Multiple regression
Multiple regression - Comparing models
Logistic regression
Logistic regression - Comparing models
Copyright ©2010-2014 PQStat So ware − All rights reserved
39
3
WORKING WITH DOCUMENTS
Principal Component Analysis
Stratified analysis
Mantel−Haenszel OR/RR
• Survival analysis
Life tables
Kaplan-Meier Analysis
Comparison groups
Cox PH regression
Cox PH regression - Comparing models
Scale Reliability
Wizard
Menu Spa al Analysis − descrip on in User Guide - PQStat for Spa al Analysis
Map Manager
Tools
Geometry calculations
Spatial weights amtrix
Spatial descriptive statistics
• Spatial Statistics
Nearest Neighbour Analysis
Global Moran’s I statistic
Global Geary’s C
Local Moran’s I statistic
Local Getis-Ord Gi statistic
Menu Graphs
Histogram
Box-Whiskers plot
Error plot
Scatter plot
Line plot
Copyright ©2010-2014 PQStat So ware − All rights reserved
40
4 HOW TO ORGANISE WORK WITH PQSTAT
4 HOW TO ORGANISE WORK WITH PQSTAT
All sta s c analysis procedures are available in Statistics menu.
4.1 HOW TO ORGANISE DATA
The way of data organisa on depends on the sta s c procedures, that a user wants to follow.
Sta s c analysis of data may be done on the basis of data gathered in a con ngency table or as a raw
data. But it is also possible to convert data:
• from a con ngency table into a raw form − you can do this selec ng Create raw data... from
Data menu,
• from a raw form into a con ngency table − you can do this selec ng Create table... from Data
menu.
1. Data in raw records form are the data organised in the way, so that each row includes informa on
about another studied object (like a pa ent, a firm etc.).
E
4.1. Raw data (sex-educa on.pqs file)
2. The con ngency table presents a joint distribu on of 2 variables. There are observed frequencies
(natural numbers) inside the table.
E
4.2. A con ngency table (sex-educa on.pqs file)
Copyright ©2010-2014 PQStat So ware − All rights reserved
41
4 HOW TO ORGANISE WORK WITH PQSTAT
Copyright ©2010-2014 PQStat So ware − All rights reserved
42
4 HOW TO ORGANISE WORK WITH PQSTAT
4.2 HOW TO REDUCE A DATASHEET WORKSPACE
Usually, the whole datasheet workspace is fully available for you while performing a sta s cal analysis.
However, you can easily limit this area by selec ng just a part of the sheet you want to analyse. There
are four possible ways to do this:
1. Through ac va on/deac va on
Ac va on/deac va on of cases is a global op on, superior with respect to other reduc ons of
the area available in the program. Cases (rows) indicated as deac vated are shaded in the data
sheet and are not taken into account in sta s cal analyses.
In order to ac vate or deac vate selected cases one should choose one of the following op ons:
• select the rows in the data sheet and choose the op on Activate/Deactivate from the context menu on their names;
• select the menu Edit →Activate/Deactivate (filter)...
E
4.3. (file filtr.pqs)
We are going to conduct many sta s cal analyses on the data from the file filtr.pqs. The
analysis will concern boys aged 16 or over. For that purpose we define the rows which will
not be analyzed: we select the bu on and set the rule for the sex variable; we select the
bu on again and set the rule for the age variable. Remember: in order to do the exercise
correctly all filter condi ons should be connected with the conjunc on (we are informed
about it by the sign ). We set the selected op on Deactivate and confirm these analysis
condi ons by clicking the bu on OK
When narrowing down the workspace in the data sheet we should remember that the filter
condi ons can be connected with the conjunc on or with the alterna ve. The change of
the alterna ve and the conjunc on is made with the bu ons
To ac vate all cases one should select the menu Edit →Activate all
Copyright ©2010-2014 PQStat So ware − All rights reserved
43
4 HOW TO ORGANISE WORK WITH PQSTAT
2. You can select the coherent area.
This causes: the analysis we choose is performed using only the selected rows and columns which
include necessary data.
E
4.4. (filter.pqs file)
You want to calculate descrip ve sta s cs for the height of each girl who is between 10 and 15
years old. In order to calculate this, you need to sort data according to sex and age columns, then
you need to select the coherent area of the column which includes 10 to 15 years old girls' height
and to select Descriptive statistics from Statistics menu.
In the descrip ve sta s cs window, you need to select all procedures that you want to follow (for
example mean, standard devia on, minimum, maximum) and the variable for an analysis (the
column including height) and then confirm your choice by clicking OK.
If you reduce a datasheet workspace by selec ng a coherent piece of data, the following message
in the analysed window will occur:
Data reduced by the selected area
3. You can use saved selection.
If selected ranges are ascribed to the sheet, they are highlighted by a frame. They can be used in
the analysis, where the data can be set directly to the analysis window. Then, clicking on fill with
saved selection bu on, data from the selected range can be pasted.
Copyright ©2010-2014 PQStat So ware − All rights reserved
44
4 HOW TO ORGANISE WORK WITH PQSTAT
E
4.5. (layers.pqs file)
We want to designate sta s cs associated with Odds Ra o (OR) for a few stratas. We will use
some data saved in 10 tables − they are selected (framed). From the Statistics menu, we select
Stratified analysis→Mantel-Haenszel OR/RR. In the test op ons window, we select contingency
table, then we set the number of stratas − 10. Each created strata can be filled from the selected
range. If we fill all the tables, we make analysis by clicking OK bu on.
Note
To ascribe more selec ons to the data sheet from the Edition menu, we chose Save selection
(Ctrl+T). To delete ascribed selec ons, we chose Clear selections.
4. You can use a data filter
Data filter is an op on which is available when you choose any sta s cal analysis. If you turn the
filter on, the number of rows that are taken into account during the analysis is reduced. There
are 2 possible filters: basic filter and mul ple filter.
• Basic filter − uses one or more rules joined with conjunc ons or alterna ve.
E
4.6. Basic filter (filter.pqs file)
You want to calculate descrip ve sta s cs for girls' height, who are between 10 and 15
years old. Choose Descriptive statistics from Statistics menu. In the descrip ve sta s cs'
op ons window, you should select all the procedures you want to have done (for example
you select mean, standard devia on, minimum and maximum) and variable for analysis
(column which includes height). To set filter you need to add rules using bu on. First,
you need to set the rule for the variable - sex. Then, choose "equal" sign as a condition and
"g" le er, which means girls, as a value. A er that, you should add another rule and set the
the variable - age. Then, >= sign as a condi on and 10 as a value. Exactly the same way you
add age condi on <=15. Note, to do this task properly, all the rules of the filter should be
joined with conjunc on (the sign informs you about it). If you select analysis condi ons
properly, confirm your choice by clicking OK.
Remember, when reducing a datasheet workspace using a data filter, filter condi ons may
be matched with a conjunc on or an alterna ve. To change alterna ve and conjunc ons,
Copyright ©2010-2014 PQStat So ware − All rights reserved
45
4 HOW TO ORGANISE WORK WITH PQSTAT
use
bu ons.
• Mul ple filter − uses one rule to divide data into several subgroups. The selected analysis
is performed several mes, separately for each subgroup.
E
4.7. Mul ple filter (filter.pqs file)
You want to calculate descrip ve sta s cs for girls' height and for boys' height separately.
Choose Descriptive statistics from Statistic menu. In the op on window of descrip ve
sta s cs choose procedures you want to have done (select for example mean, standard
devia on, minimum and maximum) and variable to make analysis (column including age).
Select mul ple filter and add rule using bu on. As a rule select the variable - sex. At the
end, confirm all chosen op ons by clicking OK. As a result you get 2 reports: separately for
boys and separately for girls.
Copyright ©2010-2014 PQStat So ware − All rights reserved
46
4 HOW TO ORGANISE WORK WITH PQSTAT
4.3 MULTIPLE REPEATED ANALYSIS
To improve the performance of repeated analyses, you can:
1. Use the op on of saving current analysis. PQStat program saves recently performed analysis and
its se ngs. To go back to this analysis quickly, just click
bu on on the toolbar.
2. In the analysis window, choose many variables so that the analysis will be carried out repeatedly.
Results of the analyses will be returned in the following reports.
3. Use the mul ple filter so that the analysis will be carried out separately for individual subsets of
data. Results of the analyses will be returned in the following reports.
4.4 INFORMATION GIVEN IN A REPORT
Apart from basic se ngs, which refer to the already done sta s c analysis, in the test window, there is
a possibility to:
• Add analysed data to a report.
Analysed data, depending on the test, are given to the report:
– as a raw data,
– as a con ngency table.
Addi onally, it is possible to view con ngency table of propor onal values calculated from:
- table raw,
- table column,
- total sum of the table.
• Add graph to a report.
To add an appropriate graph to the report, select op on Add graph in the window of a par cular
sta s cal analysis.
• Limita ons of numbers of returned results.
If there are any sta s cal tests whose reports include a lot of results, you can limit the amount
of returned informa on by deselec ng the op on Full calculations:
4.5 MARKING OF STATISTICALLY SIGNIFICANT RESULTS
In the report, a p-value of performed sta s cal test is marked with red colour only if the p value is less
than a significance level defined by the user. The default significance level for all tests is = 0.05. You
can change this se ng permanently in the Settings window or just temporarily ( ll the applica on is
opened) in the window of the chosen test.
Copyright ©2010-2014 PQStat So ware − All rights reserved
47
5
GRAPHS
5 GRAPHS
The PQStat program offers column charts, error charts, box plots, point charts, and line and point charts.
The window with the se ngs of the the op ons of graphs is called up via the menu Graphs.
The change of the basic parameters of the graph is possible directly in the graph window. If:
- we want to change the general graph parameters, such as: tles, backgrounds, axes, grid lines,
or the legend − we choose the tab Graph General Options;
- we want to change the appearance of the drawn object, e.g. the shape, style, colors − we choose
the tab Graph Detailed Options;
- we want to draw addi onal elements e.g. line − we choose the tab Others.
The graphs presen ng the results of sta s cal analyses are available in the window of the selected
sta s cal analysis at the op on Add graph.
The graph is returned to the report where it can be:
- saved − op on Save Graph as... from the context menu;
- printed − op on Print Graph from the context menu;
- copied − op on Copy Graph from the context menu;
- edited − this applies to the Graph General Options and Graph Detailed Options. To edit a graph
it is enough to double-click on the graph or to choose the op on Edit Graph from the context
menu. In the edi on window it is also possible to save the graph at high resolu on.
5.1 GRAPHS GALLERY
According to the type of analysis, there is a various choice of graphs:
5.1.1 Bar plots
Copyright ©2010-2014 PQStat So ware − All rights reserved
48
5
Copyright ©2010-2014 PQStat So ware − All rights reserved
GRAPHS
49
5
Copyright ©2010-2014 PQStat So ware − All rights reserved
GRAPHS
50
5
Copyright ©2010-2014 PQStat So ware − All rights reserved
GRAPHS
51
5
Copyright ©2010-2014 PQStat So ware − All rights reserved
GRAPHS
52
5
GRAPHS
5.1.2 Error plots
Copyright ©2010-2014 PQStat So ware − All rights reserved
53
5
Copyright ©2010-2014 PQStat So ware − All rights reserved
GRAPHS
54
5
GRAPHS
5.1.3 Box-Whiskers plots
Copyright ©2010-2014 PQStat So ware − All rights reserved
55
5
GRAPHS
5.1.4 Sca er plots
Copyright ©2010-2014 PQStat So ware − All rights reserved
56
5
Copyright ©2010-2014 PQStat So ware − All rights reserved
GRAPHS
57
5
GRAPHS
5.1.5 Line plots
Copyright ©2010-2014 PQStat So ware − All rights reserved
58
5
Copyright ©2010-2014 PQStat So ware − All rights reserved
GRAPHS
59
6 FREQUENCY TABLES AND EMPIRICAL DATA DISTRIBUTION
6 FREQUENCY TABLES AND EMPIRICAL DATA DISTRIBUTION
The basis of all sta s cal analyses is to define an empirical distribu on, in other words - the observed
feature distribu on in a sample. To define an empirical feature distribu on, you need to assign the frequency of occurence to the following values of this feature. Such distribu on may be presented either
in a frequency tables or in a graph (histogram). For small data sets, the frequency table can show all the
data - so called a frequency distribu on. For the larger data sets they are called a grouped frequency
distribu on.
To present data distribu on in a table, you need to display Frequency tables window by selec ng Statistics menu→Frequency tables.
In this window, you should select a variable that you want to have analysed and analysis op ons. If
the op ons are chosen properly, we can sort the calculated result trea ng variables as text values or
numbers. If there are empty cells in an analysed column, they can be included or omi ed in an analysis.
The result of a par cular analysis will occur in a report added to a datasheet, for which the analysis have
been done.
Addi onally, if we want the data to be illustrated in a bar plot or a histogram, we select Add graph
op on in the Frequency tables.
E
6.1. (distribu on.pqs file)
Some mobile network operator did the research, which was supposed to show the use of "free minutes"
given to his clients on a pay-monthly contract. Each customer may use up to 190 free minutes every
month. The research was done on the basis of 200 clients. There were several sorts of informa on
taken into account:
- the kind of contract,
- the amount of used free minutes,
- the number of contracts taken by one client (it does not apply to companies).
Now you want to present distribu on of:
Copyright ©2010-2014 PQStat So ware − All rights reserved
60
6 FREQUENCY TABLES AND EMPIRICAL DATA DISTRIBUTION
1. the kind of contract,
2. the amount of used free minutes,
3. the number of registered contracts with individual persons.
Open the Frequency tables window.
1. Choose the variable that you want to analyse: "the kind of contract" and select the op on to
interpret it as a text value and Add graph. Then confirm all the chosen se ngs by clicking OK
and you get the result presented in a report:
2. Do the analysis again by clicking
bu on. Choose the variable that you want to analyse: "the
amount of used free minutes" and then the op on Intervals (ranks), set start value, which is for
example 130 and a step value is 5. You may also select Add graph op on. Next, confirm all the
chosen op ons by clicking OK and you get the result presented in a report:
Copyright ©2010-2014 PQStat So ware − All rights reserved
61
6 FREQUENCY TABLES AND EMPIRICAL DATA DISTRIBUTION
3. Do the analysis again by clicking the
bu on. Set the filter so that the analysis is carried out
only for individual persons. Choose the variable you want to analyse: "the number of contracts".
This variable includes missing data (empty cases), that is why they may be taken into account as
well as not be taken in the result. It depends on the chosen op on which refers to ignoring (or
not) the empty cases:
Copyright ©2010-2014 PQStat So ware − All rights reserved
62
6 FREQUENCY TABLES AND EMPIRICAL DATA DISTRIBUTION
E
6.2. (fer liser.pqs file)
There was made an experiment in order to analyse a microbiological condi on of the soil, where the
fer lised (with biologically ac ve fer lisers) perennial ryegrass is grown. The soil was fer lised with various microbiological specimen and fer lisers. A er that, there was a number of microorganisms which
occurred in a 1 gram of dry mass of calculated soil. You want to get to know the frequency of ac nomycetes occurrence in a 1 gram of dry mass of the soil fer lised with nitrogen. You want to find out how
o en, in the analysed sample, values of ac nomycetes had occurred (in intervals: from 0 to 20 , from
over 20 to 40, from over 40 to 60, ...). You need to select only the 54 first rows in a datasheet, which
fulfil the analysis Assump ons (there are ac nomycetes fer lised with nitrogen) and then to open a
frequency tables window in Statistic menu→Frequency tables.
In the op ons window, you need to select a variable which you want to analyse: The number of microorganisms. A er that you need to set ranges (classes), so that the start value is 0 and the step value
is 20. At the top of the window you should see the message: Data reduced by the selected area . Now
confirm your choice by clicking OK and you will get a result presented in the report.
Copyright ©2010-2014 PQStat So ware − All rights reserved
63
6 FREQUENCY TABLES AND EMPIRICAL DATA DISTRIBUTION
Copyright ©2010-2014 PQStat So ware − All rights reserved
64
7
DESCRIPTIVE STATISTICS
7 DESCRIPTIVE STATISTICS
We use descrip ve sta s cs to describe main features of the collec on of data, for example mean
value, median or standard devia on and to draw some basic conclusions and generalisa on about the
collec on of data.
To calculate descrip ve sta s cs for data gathered in a sheet, you should open the Descriptive statistics
window which is in Statistics menu→Descriptive statistics.
In this window, you need to select variables you want to analyse and then select all the descrip ve
sta s cs measures you need for the analysis. However, note that you can select separate sta s cs or
groups of sta s cs using bu on. Confirm your choice by clicking OK. The result of the analysis will
be presented in a report added to the datasheet, on the basis of which the analysis was done.
Addi onally, if we want the data to be illustrated in a Box-Whiskers plot, we select Add graph op on in
the Descriptive statistics window.
7.1 MEASUREMENT SCALES
A properly defined kind of an analysis depends on the scale, on which the data are presented. There
are 3 main measurement scales:
1. Interval scale
Variables are assessed on an interval scale if:
- it is possible to order them,
- it is possible to calculate how much one element is greater than the other one and the
differences between these elements are interpretable in a real world. Usually the unit of
measurement is defined.
Copyright ©2010-2014 PQStat So ware − All rights reserved
65
7
DESCRIPTIVE STATISTICS
Example: the mass of an object [kg], the area of an object [m], me [years], speed[km/h] etc.
2. Ordinal scale
Variables are assessed on an ordinal scale if:
- it is possible to order them, so the sequence of occurred elements does ma er,
- it is impossible to define the quo ent and the difference between two values in a logical
way.
Example: educa on, compe tors order on the podium, etc.
Note
Note that, if a variable is assessed on an ordinal scale, to enable proper calcula ons on it, it should
be wri en by means of numbers. Numbers are a kind of agreed iden fiers telling us about the
order of elements.
3. Nominal scale
Variables are assessed on a nominal scale if:
- it is impossible to order them, because there is no order resul ng from the nature of the
given occurrence,
- it is impossible to define the quo ent and the difference between two values in a logical
way.
Example: sex, country of residence etc.
Note
If a variable is assessed on a nominal scale, it can be wri en by means of text labels. Even if the
values of a nominal variable are wri en in numbers, these numbers are only a kind of agreed
iden fiers, so it is impossible to make any arithme cal calcula ons based on them and it is also
impossible to compare them.
Copyright ©2010-2014 PQStat So ware − All rights reserved
66
7
DESCRIPTIVE STATISTICS
7.2 MEASURES OF POSITION (LOCATION)
7.2.1 CENTRAL TENDENCY MEASURES
Central tendency measures are so called average or mean measures whose characteris c is mean or a
typical level of a feature value.
Arithme c mean is formulated:
∑n
xi
x1 + x2 + · · · + xn
x=
= i=1 ,
n
n
where xi means following values of variable and n means a sample size.
Arithme c mean is used for an interval scale. If used for a sample, it should be marked with x, but for
popula on with µ.
Geometric mean is formulated:
v
u n
u∏
√
n
n
xG = x1 x2 ...xn = t
xi .
i=1
This mean is used for an interval scale if the variable distribu on is log-normal, so the variable logarithm
has a normal distribu on.
Harmonic mean is formulated:
xH =
1
x1
+
1
x2
n
+ ··· +
1
xn
n
= ∑n
1
i=1 xi
.
This mean is used for an interval scale.
Median
In the ordered data set, median is the value that divides this set into two equal parts. Half of all observa ons is below and half of them is above the median.
min
50%
median
50%
max
Median can be used in both interval and ordinal scale.
Mode
Mode is a value that occurs the most o en among the results. Mode can be used in each measurement
scale.
Copyright ©2010-2014 PQStat So ware − All rights reserved
67
7
DESCRIPTIVE STATISTICS
7.2.2 ANOTHER MEASURES OF POSITION
Quar les, deciles, cen les
max
25%
C75 = upper quar le = Q3
25%
C50 = median = Q2
25%
C25 = lower quar le = Q1
25%
min
Quar les (Q1 , Q2 , Q3 ) divide an ordered rank into 4 equal parts, deciles (Di , i = 1, 2, ..., 9) divide an
ordered rank into 10 equal parts and cen les (percen les: Ci , i = 1, 2, ..., 99) into 100 equal parts.
The second quar le, the fi h decile and the fi ieth cen le are equal to median. These measures can
be used in an interval or ordinal scale.
Copyright ©2010-2014 PQStat So ware − All rights reserved
68
7
DESCRIPTIVE STATISTICS
7.3 MEASURES OF VARIABILITY (DISPERSION)
Central tendency measures knowledge is not enough to fully describe a sta s cal data collec on structure. The researched groups may have various varia on levels of a feature you want to analyse. You
need some formulas then, which enable you to calculate values of variability of the features.
Measures of variability are calculated only for an interval scale, because they are based on the distance
between the points.
Range is formulated:
I = max xi − min xi ,
where xi are values of the analysed variable
IQR = Interquar le range = Q3 − Q1 ,
where Q1 , Q3 are the lower and the upper quar le.
Ranges for a percen le scale (decile, cen le)
Ranges between percen les are one of the dispersion measures. They define a percentage of all observa ons, which are located between the chosen percen les.
Variance − measures a degree of spread of the measurements around arithme c mean
sample variance:
∑n
sd2 =
− x)2
,
n−1
i=1 (xi
where xi are following values of variable and x is an arithme c mean of these values,
n - sample size;
popula on variance:
∑N
2
σ =
i=1 (xi
− µ)2
N
,
where xi are following values of variables and µ is an arithme c mean of these values,
N - popula on size;
Variance is always posi ve, but it is not expressed in the same units as measuring results.
Standard devia on − measures a degree of spread of the measurements around arithme c mean.
sample standard devia on:
sd =
√
sd2 ,
σ=
√
σ2.
popula on standard devia on:
The higher standard devia on or a variance value is, the more diversed is the group in rela on to an
analysed feature.
Note
The sample standard devia on is a kind of approxima on (es mator) of the popula on standard deviaon. The popula on standard devia on value is included in a range which contains the sample standard
Copyright ©2010-2014 PQStat So ware − All rights reserved
69
7
DESCRIPTIVE STATISTICS
devia on. This range is called a confidence interval for standard devia on.
Coefficient of varia on
Coefficient of varia on, just like standard devia on, enables you to es mate the homogeneity level of
an analysed data collec on. It is formulated as:
V =
sd
100%,
x
where sd means standard devia on, x means arithme c mean.
This is a unitless value. It enables you to compare a diversity of several different datasets of a one
feature. And also, you are able to compare a diversity of several features (expressed in different units).
It is assumed, if V coefficient does not exceed 10%, features indicate a sta s cally insignificant diversity.
Standard errors − they are not measures of a measurement dispersion. They measure an accuracy
level, you can define the popula on parameters value, having just the sample es mators.
Standard error of the mean is defined by:
sd
SEM = standard error of the mean = √ .
n
Note
On the basis of a sample es mator you can calculate a confidence interval for a popula on parameter.
7.4 ANOTHER DISTRIBUTION CHARACTERISTICS
Skewness or asymmetry coefficient in other words
This measure tells us how data distribu on differs from symmetrical distribu on. The closer the value
of skewness is to zero, the more symmetrically around the mean the data are spread. Usually the value
of this coefficient is included in a range [-1, 1], but in the case of a very big asymmetry, it may occur
outside the above-men oned range. A posi ve skew value indicates that the right skew occurs (the tail
on the right side is longer), whereas the nega ve skew indicates that the le skew occurs (the tail on
the le side is longer). Skewness is defined by:
)
n (
∑
xi − x 3
n
A=
,
(n − 1)(n − 2)
sd
i=1
right skew
A>0
Mode Med. X
frequency
frequency
where:
xi − the following values of a variable,
x, sd − adequately - arithme c mean and standard devia on xi ,
n − sample size.
x
le skew
A<0
X
Med. Mode
Copyright ©2010-2014 PQStat So ware − All rights reserved
x
70
7
DESCRIPTIVE STATISTICS
Kurtosis or coefficient of concentra on
This measure tells us how much the spread of data around the mean is similar to the spread of data in
normal distribu on. The greater than zero the value of kurtosis is, the more narrow the tested distribu on than normal one is. And inversely, the lower than zero the value of kurtosis is, the fla er the
tested distribu on than the normal one is. Kurtosis is defined by:
∑
n(n + 1)
K=
(n − 1)(n − 2)(n − 3)
n
i=1
(
xi − x
sd
)4
−
3(n − 1)2
,
(n − 2)(n − 3)
frequency
where:
xi − the following values of a variable,
x, sd − adequately - arithme c mean and standard devia on of xi ,
n − sample size.
K2 > 0
K1 < 0
X
x
E
7.1. (fer lisers.pqs file)
In an experiment related to a soil fer lising the with various sorts of microbiological specimens and
fer lisers it was calculated how many microorganisms occur in a 1 gramme of dry mass of soil. Now
we would like to calculate descrip ve sta s cs of the amount of ac nomycetes for the sample ferlised with nitrogen. Addi onally, we want the data to be illustrated in the Box-Whiskers plot. In a
datasheet, we select only the 54 first rows, which are relevant to the assump ons of the analysis (there
are ac nomycetes fer lised with nitrogen). Then we open Descriptive statistics window in Statistics
menu→Descriptive statistics.
In the window of descrip ve sta s cs op ons, select a variable to analyse: the number of microorganisms, and then all the procedures you want to follow (for example arithme c mean altogether with
the confidence interval, median, standard devia on altogether with the confidence interval, and an
informa on about the skewness and kurtosis of distribu on altogether with errors). At the top of the
window you should see the following message: Data reduced by the selected area . To add a graph to
the report, we select Add graph op on and chose the Box-Whiskers plot type . Confirm your choice by
clicking OK and you get the result in a report:
Copyright ©2010-2014 PQStat So ware − All rights reserved
71
7
DESCRIPTIVE STATISTICS
Copyright ©2010-2014 PQStat So ware − All rights reserved
72
8
PROBABILITY DISTRIBUTIONS
8 PROBABILITY DISTRIBUTIONS
A real data distribu on from a sample - empirical data distribu on may be carried out in a mean of a
frequency tables (by selec ng Statistic menu→Frequency tables). For example, a distribu on of the
amount of used free minutes by subscribers of some mobile network operator (example (6.1), distribuon.pqs file) performs the following table:
A graphical presenta on of results included in a table is usually done using a histogram or a bar plot.
Such graph can be created by selec ng Add graph op on in the Frequency tables window.
Theore cal data distribu on which is also called a probability distribu on is usually presented graphically by means of a line graph. Such line is described by a func on (mathema cal model) and it is called
Copyright ©2010-2014 PQStat So ware − All rights reserved
73
8
PROBABILITY DISTRIBUTIONS
a density func on. You can replace the empirical distribu on with the adequate theore cal distribuon.
Note
To replace an empirical distribu on with the adequate theore cal distribu on it is not enough to draw
conclusions upon similarity of their shapes intui vely. To check it, you should use specially created
compa bility tests.
The kind of probability distribu on which is used the most o en is a normal distribu on (Gaussian distribu on). Such distribu on with a mean of 161.15 and a standard devia on 13.03 is presented by the
data rela ng to the amount of used free minutes (example (6.1), distribu on.pqs file).
Copyright ©2010-2014 PQStat So ware − All rights reserved
74
8
PROBABILITY DISTRIBUTIONS
8.1 CONTINUOUS PROBABILITY DISTRIBUTIONS
• Normal distribu on which is also called the Gaussian distribu on or a bell curve, is one of the
most important distribu on in sta s cs. It has very interes ng mathema cal features and occurs
very o en in nature. It is usually designated with N (µ, σ).
A density func on is defined by:
1
f (x, µ, σ) = √
exp
2πσ
(
)
(x − µ)2
,
−
2σ 2
where:
−∞ < x < +∞,
µ − an expected value of popula on (its measure is mean),
σ − standard devia on.
y
0.8
0.7
N (0, 4)
0.6
0.5
0.4
0.3
N (0, 1) N (1, 1)
0.2
0.1
−4
−3
−2
−1
0
1
2
3
4
x
Normal distribu on is a symmetrical distribu on for a perpendicular line to axis of abscissae going
through the points designa ng the mean, mode and median.
Normal distribu on with a mean of µ = 0 and σ = 1 (N (0, 1)), is so called a standardised normal
distribu on.
• t-Student distribu on − the shape of t-Student distribu on is similar to standardised normal
distribu on, but its tails are longer. The higher the number of degrees of freedom (df ), the more
similar the shape of t-Student distribu on to normal distribu on.
A density func on is defined by:
Γ( df2+1 )
f (x, df ) =
√
Γ( df2 ) df π
(
)− df2+1
x2
1+
,
df
where:
−∞ < x < +∞,
df − degrees of freedom (sample size is decreased by the number of limita ons in
given calcula ons),
Γ is a Gamma func on.
Copyright ©2010-2014 PQStat So ware − All rights reserved
75
8
PROBABILITY DISTRIBUTIONS
y
0.4
0.3
N (0, 1)
T (df = 1)
T (df = 4)
0.2
0.1
−4
−3
−2
−1
0
1
2
3
x
4
• Chi-square (χ2 ) distribu on, this is a right-skewed distribu on with a shape depending on the
number of degrees of freedom df . The higher the number of degrees of freedom, the more
similar the shape of χ2 distribu on to the normal distribu on.
Density func on is defined by:
f (x, df ) =
1
df
2
2 Γ df2
df
x 2 −1 e− 2 ,
x
where:
x > 0,
df − degrees of freedom (sample size is decreased by the number of limita ons in
given calcula ons),
Γ is a Gamma func on.
y
0.5
χ2 (df = 1)
0.4
0.3
χ2 (df = 5)
0.2
χ2 (df = 10)
0.1
0
0
1
2
3
4
5
6
7
8
9
x
• Fisher-Snedecor distribu on, this is a distribu on which has a right tail that is longer and a shape
that depends on the number of degrees of freedom df1 and df2 .
Copyright ©2010-2014 PQStat So ware − All rights reserved
76
8
PROBABILITY DISTRIBUTIONS
A density func on is defined by:
√
F (x, df1 , df2 ) =
df
(df1 x)df1 d2 2
(df1 x+df2 )df1 +df2
(
xB
df1 df2
2 , 2
) ,
where:
x > 0,
df1 , df1 − degrees of freedom (it is assumed that if X i Y are independent with a χ2
1
distribu on with adequately df1 and df2 degrees of freedom, than F = X/df
Y /df2 has a F
Snedecor distribu on F (df1 , df2 )),
B is a Beta func on.
0.7
0.6
0.5
F (df1 = 12, df2 = 3)
0.4
0.3
0.2
F (df1 = 3, df2 = 12)
0.1
F (df1 = 1, df2 = 1)
0
0
1
2
3
4
Copyright ©2010-2014 PQStat So ware − All rights reserved
77
8
PROBABILITY DISTRIBUTIONS
8.2 PROBABILITY DISTRIBUTION CALCULATOR
The area under a curve (density func on) is p probability of occurrence of all possible values of an
analysed random variable. The whole area under a curve comes to p = 1. If you want to analyse just a
part of this area, you must put the border value, which is called the cri cal value or Statistic. To do this,
you need to open the Probability distribution calculator window. In this window you can calculate not
only a value of the area under the curve (p value) of the given distribu on on the basis of Statistic, but
also Statistic value on the basis of p value. To open the window of Probability distribution calculator,
you need to select Probability distribution calculator from the Statistics menu.
E
8.1. Probability distribu on calculator
Some mobile network operator did the research, which was supposed to show the usage of "free minutes" given to his clients on a pay-monthly contract. On the basis of the sample, which consists of
200 of the above-men oned network clients (where the distribu on of used free minutes is of the
shape of normal distribu on) is calculated the mean value x = 161.15min. and standard devia on
sd = 13.03min. We want to calculate the probability, that the chosen client used:
1. 150 minutes or less,
2. more than 150 minutes,
3. the amount of minutes coming from the range [x − sd, x + sd] = [148.12min., 174.18min.],
4. the amount of minutes out of the range x ± sd.
Open the Probability distribution calculator window, select Gaussian distribution and write the mean
x = 161.15min. and standard deviation sd = 13.03min. and select the op on which indicates, that
you are going to calculate the p value.
1. To calculate (using normal distribu on (Gauss)) the probability that the client you have chosen
used 150 free minutes or less, put the value of 150 in the Statistic field. Confirm all selected
se ngs by clicking Calculate.
N (161.15, 13.03)
150
Copyright ©2010-2014 PQStat So ware − All rights reserved
78
8
PROBABILITY DISTRIBUTIONS
The obtained p value is 0.193961.
Note
Similar calcula ons you can carry out on the basis of empirical distribu on. The only thing you
should do is to calculate a percentage of clients who use 150 minutes or less (example (6.1) by
using the Frequency tables window. In the analysed sample (which consists of 200 clients) there
are 40 clients who use 150 minutes or less. It is 20% of the whole sample, so the probability you
are looking for is p = 0.2.
2. To calculate the probability (using the normal distribu on (Gauss)), that the client who you have
chosen used more than 150 free minutes, you need to put the value of 150 in the Statistic field
and than select the op on 1 - (p value). Confirm all the chosen se ngs by clicking Calculate.
N (161.15, 13.03)
150
The obtained p value is 0.806039.
3. To calculate (using the normal distribu on (Gauss)) a probability that the client you have chosen
used free minutes which come from the range [x − sd, x + sd] = [148.12min., 174.18min.] in
the Statistic field, put one of the final range values and than select the op on two-sided. Confirm
all the chosen se ngs by clicking Calculate.
N (161.15, 13.03)
148.12
174.18
The obtained p value is 0.682689.
4. To calculate (using the normal distribu on (Gauss)) a probability, that the client you have chosen
used free minutes out of the range [x − sd, x + sd] = [148.12min., 174.18min.] in the Statistic
field put one of the final range values and than select the op on: two-sided and 1 - (p value).
Confirm all the chosen se ngs by clicking Calculate.
N (161.15, 13.03)
148.12
174.18
Copyright ©2010-2014 PQStat So ware − All rights reserved
79
8
PROBABILITY DISTRIBUTIONS
The obtained p value is 0.317311.
Copyright ©2010-2014 PQStat So ware − All rights reserved
80
9
HYPOTHESES TESTING
9 HYPOTHESES TESTING
The process of generalisa on of the results obtained from the sample for the whole popula on is divided into 2 basic parts:
• es ma on − es ma ng values of the parameters of the popula on on the basis of the sta s cal
sample,
• verifica on of sta s cal hypotheses − tes ng some specific assump ons formulated for the
parameters of the general popula on on the basis of sample results.
9.0.1 POINT AND INTERVAL ESTIMATION
In prac ce, we usually do not know the parameters (characteris cs) of the whole popula on. There
is only a sample chosen from the popula on. Point es mators are the characteris cs obtained from a
random sample. The exactness of the es mator is defined by its standard error. The real parameters
of popula on are in the area of the indicated point es mator. For example, the popula on parameter
arithme c mean µ is in the area of the es mator from the sample which is x.
If you know the es mators of the sample and their theore cal distribu ons, you can es mate values of
the popula on parameters with the confidence level (1 − α) defined in advance. This process is called
interval es ma on, the interval: confidence interval, and α is called a significance level.
The most popular significance level comes to 0.05, 0.01 or 0.001.
9.0.2 VERIFICATION OF STATISTICAL HYPOTHESES
To verify a sta s cal hypotheses, follow several steps:
The 1st step: Make a hypotheses, which can be verified by means of sta s cal tests.
Each sta s cal test gives you a general form of the null hypothesis H0 and the alterna ve one
H1 :
H0 : there is no sta s cally significant difference among popula ons
(means, medians, propor ons distribu ons etc.),
H1 : there is a sta s cally significant difference among popula ons
(means, medians, propor ons, distribu ons etc.).
Researcher must formulate the hypotheses in the way, that it is compa ble with the reality and
sta s cal test requirements, for example:
H0 : the percentage of women and men running their own businesses
in an analysed popula on is exactly the same.
If you do not know, which percentage (men or women) in an analysed popula on might be
greater, the alterna ve hypothesis should be two-sided. It means you should not assume the
direc on:
H1 : the percentage of women and men running their own businesses
in an analysed popula on is different.
Copyright ©2010-2014 PQStat So ware − All rights reserved
81
9
HYPOTHESES TESTING
It may happen (but very rarely) that you are sure you know the direc on in an alterna ve hypothesis. In this case you can use one-sided alterna ve hypothesis.
The 2nd step: Verify which of the hypotheses H0 or H1 is more probable. Depending on the kind
of an analysis and a type of variables you should choose an appropriate sta s cal test.
Note 1
Note, that choosing a sta s cal test means mainly choosing an appropriate measurement scale (interval, ordinal, nominal scale) which is represented by the data you want
to analyse. It is also connected with choosing the analysis model (dependent or independent)
Measurements of the given feature are called dependent (paired), when they are
made a couple of mes for the same objects. When measurements of the given feature are performed on the objects which belong to different groups, these groups are
called independent (unpaired) measurements.
Some examples of researches in dependent groups:
Examining a body mass of pa ents before and a er a slimming diet, examining reacon on the s mulus within the same group of objects but in two different condi ons
(for example - at night and during the day), examining the compa bility of evalua ng
of credit capacity calculated by two different banks but for the same group of clients
etc.
Some examples of researches in independent groups:
Examining a body mass in a group of healthy pa ents and ill ones, tes ng effec veness
of fer lising several different kinds of fer lisers, tes ng gross domes c product (GDP)
sizes for the several countries etc.
Note 2
A graph which is included in the Wizard window makes the choice of an appropriate
sta s cal test easier.
Test sta s c of the selected test calculated according to its formula is connected with the adequate theore cal distribu on.
1−α
α/2
α/2
value of test sta s cs
The applica on calculates a value of test sta s cs and also a p value for this sta s cs (a part of
the area under a curve which is adequate to the value of the test sta s cs). The p value enables
Copyright ©2010-2014 PQStat So ware − All rights reserved
82
9
HYPOTHESES TESTING
you to choose a more probable hypothesis (null or alterna ve). But you always need to assume
if a null hypothesis is the right one, and all the proofs gathered as a data are supposed to supply
you with the enough number of counterarguments to the hypothesis:
if p ≤ α =⇒
if p > α =⇒
reject H0 and accept H1 ,
there is no reason to reject H0 .
There is usually chosen significance level α = 0.05, accep ng that for 5 % of the situa ons we will
reject a null hypothesis if there is the right one. In specific cases you can choose other significance
level for example 0.01 or 0.001.
Note
Note, that a sta s cal test may not be compa ble with the reality in two cases:
test result
H0 : true
H0 : false
reality
H0 : true H0 : false
OK
β
α
OK
We may make two kinds of mistakes:
α = 1st type of error (probability of rejec ng hypothesis H0 , when it is the right one),
β = 2nd type of error (probability of accep ng hypothesis H0 , when it is the wrong
one).
Power of the test is 1 − β.
Values α and β are connected with each other. The approved prac ce is to assume
the significance level in advance α and minimaliza on β by decreasing a sample size.
The 3rd step: Descrip on of results of hypotheses verifica on.
Copyright ©2010-2014 PQStat So ware − All rights reserved
83
10 COMPARISON - 1 GROUP
10 COMPARISON - 1 GROUP
Interval scale
Are
the data
normally
distributed?
Ordinal scale
N
Wilcoxon
(signed-ranks)
test
Nominal scale
χ2 test
(goodness-of-fit),
tests for
one propor on
Y
(Kolmogorov-Smirnov
or Lilliefors test)
Single-sample
t-test
Copyright ©2010-2014 PQStat So ware − All rights reserved
84
10 COMPARISON - 1 GROUP
10.1 PARAMETRIC TESTS
10.1.1 The t-test for a single sample
The single-sample t test is used to verify the hypothesis, that an analysed sample with the mean (x)
comes from a popula on, where mean (µ) is a given value.
Basic assump ons:
− measurement on an interval scale,
− normality of distribu on of an analysed feature.
Hypotheses:
H0 : µ = µ0 ,
H1 : µ ̸= µ0 ,
where:
µ − mean of an analysed feature of the popula on represented by the sample,
µ0 − a given value.
The test sta s c is defined by:
t=
x − µ0 √
n,
sd
where:
sd − standard devia on from the sample,
n − sample size.
The test sta s c has the t-Student distribu on with n − 1 degrees of freedom.
The p value, designated on the basis of the test sta s c, is compared with the significance level α:
if p ≤ α =⇒
if p > α =⇒
reject H0 and accept H1 ,
there is no reason to reject H0 .
Note
Note, that: If the sample is large and you know a standard devia on of the popula on, then you can
calculate a test sta s c using the formula:
t=
x − µ0 √
n.
σ
The sta s c calculated this way has the normal distribu on. If x → ∞ t-Student distribu on converges
to the normal distribu on N (0, 1). In prac ce, it is assumed, that with n > 30 the t-Student distribuon may be approximated with the normal distribu on.
The se ngs window with the Single-sample t-test can be opened in Statistics menu→Parametric
tests→t-test or in Wizard.
Copyright ©2010-2014 PQStat So ware − All rights reserved
85
10 COMPARISON - 1 GROUP
Note
Calcula ons can be based on raw data or data that are averaged like: arithme c mean, standard devia on and sample size.
E
10.1. (courier.pqs file)
You want to check if the me of awai ng for a delivery by some courier company is 3 days on the
average (µ0 = 3). In order to calculate it, there are 22 persons chosen by chance from all clients of the
company as a sample. A er that, there are wri en informa on about the number of days passed since
the delivery was sent ll it is delivered. There are following values: (1, 1, 1, 2, 2, 2, 2, 3, 3, 3, 4, 4, 4, 4,
4, 5, 5, 6, 6, 6, 7, 7).
The number of awai ng days for the delivery in the analysed popula on fulfills the assump on of
normality of distribu on.
Hypotheses:
H0 : mean of the number of awai ng days for the delivery, which is supposed
to be delivered by the above-men oned courier company is 3,
H1 : mean of the number of awai ng days for the delivery, which is supposed
to be delivered by the above-men oned courier company is different from 3.
Copyright ©2010-2014 PQStat So ware − All rights reserved
86
10 COMPARISON - 1 GROUP
Comparing the p value = 0.088074 of the t-test with the significance level α = 0.05 we draw the conclusion, that there is no reason to reject the null hypothesis which informs that the average me of
awai ng for the delivery, which is supposed to be delivered by the analysed courier company is 3. For
the tested sample, the mean is x = 3.727 and the standard devia on is sd = 1.907.
Copyright ©2010-2014 PQStat So ware − All rights reserved
87
10 COMPARISON - 1 GROUP
10.2 NONPARAMETRIC TESTS
Ranks - there are the following numbers (usually natural ones) ascribed to the values of ordered measurements of the analysed variable. They are usually used in such nonparametric tests, which are based
only upon the order of elements in the sample. Replacing a variable with the grades calculated on the
basis of this variable is called ranking.
All reoccurring values have its own ascribed rank, which is an arithme c mean calculated from the following natural numbers proposed to these values. These kinds of ranks are called es.
For example, to the variable of the following values: 8.6, 5.3, 8.6, 7.1, 9.3, 7.2, 7.3, 7.4, 7.3, 5.2, 7, 9.9,
8.6, 5.7 the following ranks are ascribed:
sorted values of variable
5.2
5.3
5.7
7
7.1
7.2
7.3
7.3
7.4
8.6
8.6
8.6
9.3
9.9
ranks
1
2
3
4
5
6
7.5
7.5
9
11
11
11
13
14
But, to the variable with the values of 7.3 is ascribed the e calculated from the numbers: 7 and 8, and
to the variable with the values of 8.6 the e is calculated from the numbers: 10, 11, 12.
10.2.1 The Kolmogorov-Smirnov test and the Lilliefors test
The Kolmogorov-Smirnov goodness-of-fit test for a single sample, Kolmogorov (1933)[45], is used to
verify the hypothesis about the insignificance difference of an analysed variable distribu on (empirical
distribu on) from the normal distribu on (theore cal distribu on). We use it in the situa on when
a mean value (µ) and standard devia on (σ) of the popula on from which the sample is taken, are
known. When these parameters of the popula on are not known but are es mated and based on the
sample, the Kolmogorov test becomes pre y conserva ve (using this test it is much harder to reject null
hypothesis). In such situa on you should use the Lilliefors test, Lilliefors (1967, 1969, 1973)[51][52][53].
This is the Kolmogorov-Smirnov test correc on when a mean value(µ) and standard devia on (σ) of the
popula on from which the sample is taken, are not known.
Basic assump ons:
− measurement on an interval scale.
Hypotheses:
H0 : distribu on of an analysed feature in the popula on is the normal distribu on,
H1 : distribu on of an analysed feature in the popula on is different from the normal one.
Copyright ©2010-2014 PQStat So ware − All rights reserved
88
10 COMPARISON - 1 GROUP
Based on the data from the sample gathered in a cumulated frequency distribu on and the adequate
values of the area under a theore cal curve of the normal distribu on, you can calculate a value of the
test sta s c D:
D = sup |Fn (x) − F (x)|,
x
where:
Fn (x) − empirical cumula ve distribu on func on of the normal distribu on, calculated
in par cular points of distribu on, for sample of n-elements ,
F (x) − theore cal cumula ve distribu on func on of the normal distribu on.
This sta s c has the Kolmogorov-Smirnov distribu on (if you know the arithme c mean and the standard devia on of the popula on) or the Lilliefors distribu on (when the arithme c mean and the standard devia on you want to es mate from the sample).
The p value, designated on the basis of the test sta s c, is compared with the significance level α:
if p ≤ α =⇒
if p > α =⇒
reject H0 accept H1 ,
there is no reason to reject H0 .
The se ngs window with the Lilliefors test or Kolmogorov-Smirnov test can be opened in Statistics
menu→NonParametric tests (ordered categories) or in Wizard.
Copyright ©2010-2014 PQStat So ware − All rights reserved
89
10 COMPARISON - 1 GROUP
E
10.1 con nua on (courier.pqs file)
Hypotheses:
H0 : distribu on of the number of awai ng days for the delivery, which is
supposed to be delivered by the analysed courier company is the normal distribu on,
H1 : distribu on of the number of awai ng days for the delivery, which is
supposed to be delivered by the analysed courier company is different from
the normal distribu on.
The mean value and the standard devia on of the me of awai ng for the delivery for all the clients
is not known, so it must be es mated from the sample. There are following values for this sample:
x = 3.73, SD = 1.91.
Copyright ©2010-2014 PQStat So ware − All rights reserved
90
10 COMPARISON - 1 GROUP
The value of the Kolmogorov-Smirnov and the Lilliefors test sta s c is exactly the same and amounts
to 0.1357, but the p value = 0.763881 for the Kolmogorov-Smirnov test and the p value =0.364381 for
Lilliefors test. Both tests indicate, that using the significance level α=0.05 you are not allowed to reject
the null hypothesis which informs, that the analysed data performs the normal distribu on.
10.2.2 The Wilcoxon test (signed-ranks)
The Wilcoxon signed-ranks test is also known as the Wilcoxon single sample test, Wilcoxon (1945,
1949)[83]. This test is used to verify the hypothesis, that the analysed sample comes from the popula on, where median (θ) is a given value.
Basic assump ons:
− measurement on an ordinal scale or on an interval scale.
Hypotheses:
H0 : θ = θ0 ,
H1 : θ ̸= θ0 .
Copyright ©2010-2014 PQStat So ware − All rights reserved
91
10 COMPARISON - 1 GROUP
where:
θ − median of an analysed feature of the popula on represented by the sample,
θ0 − a given value.
Now you should calculate the value of the test sta s cs Z (T − for the small sample size), and based
on this p value.
The p value, designated on the basis of the test sta s c, is compared with the significance level α:
if p ≤ α =⇒
if p > α =⇒
reject H0 and accept H1 ,
there is no reason to reject H0 .
Note
Depending on the size of the sample, the test sta s c takes a different form:
− for a small sample size
T = min
(∑
R− ,
∑
)
R+ ,
where:
∑
∑
R+ and R− are adequately: a sum of posi ve and nega ve ranks.
This sta s c has the Wilcoxon distribu on
− for a large sample size
Z=√
n(n+1)
4
∑ 3 ∑ ,
n(n+1)(2n+1)
− t 48− t
24
T−
where:
n - the number of ranked signs (the number of ranks),
t - the number of cases being included in the interlinked rank.
The test sta s c formula Z includes the correc on for es. This correc on should
used
(∑ 3 be∑
) when
es occur (when there are no es, the correc on is not calculated, because
t − t /48 =
0.
Z sta s c asympto cally (for a large sample size) has the normal distribu on.
Con nuity correc on of the Wilcoxon test (Marascuilo and McSweeney (1977)[60])
A con nuity correc on is used to enable the test sta s c to take in all values of real numbers, according to the assump on of the normal distribu on. Test sta s c with a con nuity correc on is defined by:
n(n+1) T − 4 − 0.5
Z=√
∑ 3 ∑ .
n(n+1)(2n+1)
− t
− t 48
24
The se ngs window with the Wilcoxon test (signed-ranks) can be opened in Statistics menu→ NonParametric tests (ordered categories)→Wilcoxon (signed-ranks) or in Wizard.
Copyright ©2010-2014 PQStat So ware − All rights reserved
92
10 COMPARISON - 1 GROUP
Example 10.1 cont. (courier.pqs file)
Hypotheses:
H0 : median of the number of awai ng days for the delivery, which is supposed
to be delivered by the analysed courier company is 3
H1 : median of the number of awai ng days for the delivery, which is supposed
to be delivered by the analysed courier company is different from 3
Copyright ©2010-2014 PQStat So ware − All rights reserved
93
10 COMPARISON - 1 GROUP
Comparing the p value = 0.123212 of Wilcoxon test based on T sta s c with the significance level
α = 0.05 we draw the conclusion, that there is no reason to reject the null hypothesis informing us, that
usually the number of awai ng days for the delivery which is supposed to be delivered by the analysed
courier company is 3. Exactly the same decision you would make basing on the p value = 0.111161 or p
value = 0.115817 of Wilcoxon test based upon Z sta s c or Z with correc on for con nuity.
10.2.3 The Chi-square goodness-of-fit test
The χ2 test (goodnes-of-fit) is also called the one sample χ2 test and is used to test the compa bility of
values observed for r (r >= 2) categories X1 , X2 , ..., Xr of one feature X with hypothe cal expected
values for this feature. The values of all n measurements should be gathered in a form of a table consisted of r rows (categories: X1 , X2 , ..., Xr ). For each category Xi there is wri en the frequency of
its occurence Oi , and its expected frequency Ei or the probability of its occurence pi . The expected
frequency is designated as a product of Ei = npi . The built table can take one of the following forms:
Xi categories
X1
X2
...
Xr
Oi
O1
O2
...
Or
Ei
Ei
E2
...
Er
Xi categories
X1
X2
...
Xr
Oi
O1
O2
...
Or
pi
p1
p2
...
pr
Basic assump ons:
− measurement on a nominal scale (alterna vely: an ordinal scale or an interval scale),
− large expected frequencies (according to the Cochran interpreta on (1952)[20] none of these
expected frequencies can be < 1 and no more than 20% of the expected frequencies can be
< 5),
− observed frequencies total should be exactly the same as an expected frequencies total, and the
total of all pi probabili es should come to 1.
Hypotheses:
Copyright ©2010-2014 PQStat So ware − All rights reserved
94
10 COMPARISON - 1 GROUP
H0 : Oi = Ei for all categories,
H1 : Oi ̸= Ei for at least one category.
Test sta s c is defined by:
χ2 =
r
∑
(Oi − Ei )2
i=1
Ei
.
This sta s c asympto cally (for large expected frequencies) has the χ2 distribu on with the number of
degrees of freedom calculated using the formula: df = (r − 1).
The p value, designated on the basis of the test sta s c, is compared with the significance level α:
if p ≤ α =⇒
if p > α =⇒
reject H0 and accept H1 ,
there is no reason to reject H0 .
The se ngs window with the Chi-square test (goodness-of-fit) can be opened in Statistics menu →
NonParametric tests (unordered categories)→Chi-square or in Wizard.
E
10.2. (dinners.pqs file)
We would like to get to know if the number of dinners served in some school canteen within a given
frame of me (from Monday to Friday) is sta s cally the same. To do this, there was taken a one-weeksample and wri en the number of served dinners in the par cular days: Monday - 33, Tuesday - 29,
Wednesday - 32, Thursday -36, Friday - 20.
As a result there were 150 dinners served in this canteen within a week (5 days).
We assume that the probability of serving dinner each day is exactly the same, so it comes to 51 . The
expected frequencies of served dinners for each day of the week (out of 5) comes to Ei = 150 · 51 = 30.
Copyright ©2010-2014 PQStat So ware − All rights reserved
95
10 COMPARISON - 1 GROUP
Hypotheses:
H0 : the number of served dinners in the analysed school canteen within given
days (of the week) is consistent with the expected number of given out dinners these
days,
H1 : the number of served out dinners in the analysed school canteen within a given
week is not consistent with the expected number of dinners given out these days.
The p value from the χ2 distribu on with 4 degrees of freedom comes to 0.287297. So using the significance level α = 0.05 you can es mate that there is no reason to reject the null hypothesis that informs
about the compa bility of the number of served dinners with the expected number of dinners served
within the par cular days.
Copyright ©2010-2014 PQStat So ware − All rights reserved
96
10 COMPARISON - 1 GROUP
Note!
If you want to make more comparisons within the framework of a one research, it is possible to use the
Bonferroni correc on[1]. The correc on is used to limit the size of I type error, if we compare compare
the observed frequencies and the expected ones between par cular days, for example:
Friday ⇐⇒ Monday,
Friday ⇐⇒ Tuesday,
Friday ⇐⇒ Wednesday,
Friday ⇐⇒ Thursday,
Provided that, the comparisons are made independently. The significance level α = 0.05 for each comparison must be calculated according to this correc on using the following formula: α = 0.05
r , where
r is the number of executed comparisons. The significance level for each comparison according to the
Bonferroni correc on (in this example) is α = 0.05
4 = 0.0125.
However, it is necessary to remember that if you reduce α for each comparison, the power of the test
is increased.
10.2.4 Tests for propor on
You should use tests for propor on if there are two possible results to obtain (one of them is an dis nguished result with the size of m) and you know how o en these results occur in the sample (we know
a p propor on). Depending on a sample size n you can choose the Z test for a one propor on − for
large samples and the exact binominal test for a one propor on − for small sample sizes . These tests
are used to verify the hypothesis that the propor on in the popula on, from which the sample is taken,
is a given value.
Basic assump ons:
− measurement on a nominal scale (alterna vely: an ordinal scale or an interval scale).
The addi onal condi on for the Z test for propor on
− large frequencies (according to Marascuilo and McSweeney interpreta on (1977)[60] each of
these values: np > 5 and n(1 − p) > 5).
Hypotheses:
H0 : p = p0 ,
H1 : p ̸= p0 ,
where:
p − probability (dis nguished propor on) in the popula on,
p0 − expected probability (expected propor on).
The Z test for one propor on
The test sta s c is defined by:
p − p0
Z=√
,
p0 (1−p0 )
n
where:
p= m
n dis nguished propor on for the sample taken from the popula on,
m − frequency of values dis nguished in the sample,
n − sample size.
Copyright ©2010-2014 PQStat So ware − All rights reserved
97
10 COMPARISON - 1 GROUP
The test sta s c with a con nuity correc on is defined by:
|p − p0 | −
Z= √
1
2n
.
p0 (1−p0 )
n
The Z sta s c with and without a con nuity correc on asympto cally (for large sizes) has the normal
distribu on.
Binominal test for one propor on
The binominal test for one propor on uses directly the binominal distribu on which is also called the
Bernoulli distribu on, which belongs to the group of discrete distribu ons (such distribu ons, where
the analysed variable takes in the finite number of values). The analysed variable can take in k = 2
values. The first one is usually definited with the name of a success and the other one with the name of
a failure. The probability of occurence of a success (dis nguished probability) is p0 , and a failure 1 − p0 .
The probability for the specific point in this distribu on is calculated using the formula:
( )
n m
P (m) =
p (1 − p0 )n−m ,
m 0
where:
(n)
m
=
n!
m!(n−m)! ,
m − frequency of values dis nguished in the sample,
n − sample size.
Based on the total of appropriate probabili es P a one-sided and a two-sided p value is calculated, and
a two-sided p value is defined as a doubled value of the less of the one-sided probabili es.
The p value is compared with the significance level α:
if p ≤ α =⇒
if p > α =⇒
reject H0 and accept H1 ,
there is no reason to reject H0 .
Note
Note that, for the es mator from the sample, which in this case is the value of the p propor on, a
confidence interval is calculated. The interval for a large sample size can be based on the normal distribu on - so-called Wald intervals. The more universal are intervals proposed by Wilson (1927)[86] and
by Agres and Coull (1998)[2]. Clopper and Pearson (1934)[18] intervals are more adequate for small
sample sizes.
Comparison of interval es ma on methods of a binomial propor on was published by Brown L.D et al
(2001)[15]
The se ngs window with the Z test for one proportion can be opened in Statistics menu→NonParametric
tests (unordered categories)→Z for proportion.
Copyright ©2010-2014 PQStat So ware − All rights reserved
98
10 COMPARISON - 1 GROUP
E
10.2 cont. (dinners.pqs file)
Assume, that you would like to check if on Friday
For the chosen sample m = 20, n = 150.
1
5
of all the dinners during the whole week are served.
Select the op ons of the analysis and ac vate a filter selec ng the appropriate day of the week −
Friday. If you do not ac vate the filter, no error will be generated, only sta s cs for given weekdays will
be calculated.
Hypotheses:
H0 : on Friday, in a school canteen there are served 15 out of all dinners which are served
within a week,
H1 : on Friday, in a school canteen there are significantly more than 51 or less than 15
dinners out of all the dinners served within a week in this canteen.
Copyright ©2010-2014 PQStat So ware − All rights reserved
99
10 COMPARISON - 1 GROUP
The propor on of the dis nguished value in the sample is p = m
n = 0.133 and 95% Clopper-Pearson
confidence interval for this frac on (0.083, 0.198) does not include the hypothe cal value of 0.2.
Based on the Z test without the con nuity correc on (p value = 0.041227) and also on the basis of the
exact value of the probability calculated from the binominal distribu on (p value = 0.044711) you can
assume (on the significance level α = 0.05), that on Friday there are sta s cally less than 51 dinners
served within a week. However, a er using the con nuity correc on it is not possible to reject the null
hypothesis p value = 0.052479).
Copyright ©2010-2014 PQStat So ware − All rights reserved
100
11 COMPARISON - 2 GROUPS
11 COMPARISON - 2 GROUPS
Interval scale
Ordinal scale
Are
the data
normally
distributed?
Are the data
dependent?
Y
Wilcoxon
test for
dependent
groups
Y
t-test for
dependent
groups
N
Are
the variances
equal?
Are the data
dependent?
N
Y
Are the data
dependent?
Nominal scale
N
N
Mann
Whitney
test,
χ2 test
for trend
Y
Bowker-McNemar,
Z test for
2 propor ons
N
(Kolmogorov-Smirnov
or Lilliefors test)
t-test with
Cochran-Cox
adjustment
χ2 (R × C) test,
χ2 (2 × 2) test,
Fisher (R × C) test,
Fisher test, mid-p (2 × 2),
Z test for 2 propor ons
(Fisher-Snedecor test)
Y
t-test for
independent
groups
Copyright ©2010-2014 PQStat So ware − All rights reserved
101
11 COMPARISON - 2 GROUPS
11.1 PARAMETRIC TESTS
11.1.1 The Fisher-Snedecor test
The F-Snedecor test is based on a variable F which was formulated by Fisher (1924), and its distribu on
was described by Snedecor. This test is used to verify the hypothesis about equality of variances of an
analysed variable for 2 popula ons.
Basic assump ons:
• measurement on an interval scale,
• normality of distribu on of an analysed feature in both popula ons,
• an independent model.
Hypotheses:
H0 : σ12 = σ22 ,
H1 : σ12 ̸= σ22 ,
where:
σ12 , σ22 − variances of an analysed variable of the 1st and the 2nd popula on.
The test sta s c is defined by:
F =
sd21
,
sd22
where:
sd21 , sd22 − variances of an analysed variable of the samples chosen randomly from the 1st
and the 2nd popula on.
The test sta s c has the F Snedecor distribu on with n1 − 1 and n2 − 1 degrees of freedom.
The p value, designated on the basis of the test sta s c, is compared with the significance level α:
if p ≤ α =⇒
if p > α =⇒
reject H0 and accept H1 ,
there is no reason to reject H0 .
The se ngs window with the Fisher-Snedecor test can be opened in Statistics menu→Parametric
tests→F Fisher Snedecor.
Copyright ©2010-2014 PQStat So ware − All rights reserved
102
11 COMPARISON - 2 GROUPS
Note
Calcula ons can be based on raw data or data that are averaged like: arithme c means, standard devia ons and sample sizes.
11.1.2 The t-test for independent groups
The t-test for independent groups is used to verify the hypothesis about the equality of means of an
analysed variable in 2 popula ons.
Basic assump ons:
− measurement on an interval scale,
− normality of distribu on of an analysed feature in both popula ons,
− an independent model,
− equality of variances of an analysed variable in 2 popula ons.
Hypotheses:
H0 : µ1 = µ2 ,
H1 : µ1 ̸= µ2 .
where:
µ1 , µ2 − means of an analysed variable of the 1st and the 2nd popula on.
Copyright ©2010-2014 PQStat So ware − All rights reserved
103
11 COMPARISON - 2 GROUPS
The test sta s c is defined by:
t= √
x1 − x2
n1 · sd21 + n2 · sd22
n1 n2 − 2
(
1
1
+
n1 n2
),
where:
x1 , x2 − means of an analysed variable of the 1st and the 2nd sample,
n1 , n2 − the 1st and the 2nd sample size,
sd21 , sd22 − variances of an analysed variable of the 1st and the 2nd sample.
The test sta s c has the t-Student distribu on with df = n1 + n2 − 2 degrees of freedom.
The p value, designated on the basis of the test sta s c, is compared with the significance level α:
if p ≤ α =⇒
if p > α =⇒
reject H0 and accept H1 ,
there is no reason to reject H0 .
Note:
• pooled standard devia on is defined by:
√
SDp =
n1 · sd21 + n2 · sd22
,
n1 n2 − 2
• standard error of difference of means is defined by:
√
(
)
n1 · sd21 + n2 · sd22 1
1
+
.
SEx1 −x2 =
n1 n2 − 2
n1 n2
11.1.3 The t-test with the Cochran-Cox adjustment
The Cochran-Cox adjustment relates to the t-test for independent groups (1957)[21] and is calculated
when variances of analysed variables in both popula ons are different.
The test sta s c is defined by:
x1 − x2
t= √ 2
.
sd1
sd22
+
n1
n2
The test sta s c has the t-Student distribu on with degrees of freedom proposed by Sa erthwaite
(1946)[73] and calculated using the formula:
( 2
)
sd1
sd22 2
+
n1
n2
df = ( 2 )2
.
( 2 )2
sd1
sd2
1
1
· (n1 −1) + n2
· (n2 −1)
n1
The se ngs window with the t- test for independent groups can be opened in Statistics menu→Parametric
tests→t-test for independent groups or in Wizard.
Copyright ©2010-2014 PQStat So ware − All rights reserved
104
11 COMPARISON - 2 GROUPS
If, in the window which contains the op ons related to the variances, you have choosen:
− equal, the t-test for independent groups will be calculated ,
− different, the t-test with the Cochran-Cox adjustment will be calculated,
− check equality, to calculate the Fisher-Snedecor test, basing on its result and set the level of
significance, the t-test for independent groups with or without the Cochran-Cox adjustment will
be calculated.
Note
Calcula ons can be based on raw data or data that are averaged like: arithme c means, standard devia ons and sample sizes.
E
11.1. (age.pqs file)
There is an experiment, in which 100 people have been chosen randomly from the popula on of workers of 2 different transport companies. There are 50 people chosen from each company. Before the
experiment begins, you should check if the average age of both companies workers is similar, because
another step in the experiment depends on this. The age of each par cipant is wri en using years.
Age (company 1): 27, 33, 25, 32, 34, 38, 31, 34, 20, 30, 30, 27, 34, 32, 33, 25, 40, 35, 29, 20, 18, 28, 26,
22, 24, 24, 25, 28, 32, 32, 33, 32, 34, 27, 34, 27, 35, 28, 35, 34, 28, 29, 38, 26, 36, 31, 25, 35, 41, 37
Age (company 2): 38, 34, 33, 27, 36, 20, 37, 40, 27, 26, 40, 44, 36, 32, 26, 34, 27, 31, 36, 36, 25, 40, 27,
30, 36, 29, 32, 41, 49, 24, 36, 38, 18, 33, 30, 28, 27, 26, 42, 34, 24, 32, 36, 30, 37, 34, 33, 30, 44, 29
The age distribu on in both groups is a normal one (it was tested with the Lilliefors test) with the
mean of x1 = 30.26 and the standard devia on of sd1 = 5.23 for the first group and x2 = 32.68
and sd2 = 6.36 for the second group. The Fisher-Snedecor test also indicates that the variances of the
Copyright ©2010-2014 PQStat So ware − All rights reserved
105
11 COMPARISON - 2 GROUPS
age in both companies are equal (p value = 0.176168). It means that all assump ons of the t-test for
independent groups are fulfilled .
Hypotheses:
H0 : the mean of the age of the first company workers is the same
as the mean of the second company workers age,
H1 : the mean of the age of the first company workers differs from
the mean of the second company workers age.
Copyright ©2010-2014 PQStat So ware − All rights reserved
106
11 COMPARISON - 2 GROUPS
If you compare the p value = 0.040314 with the significance level α = 0.05 you draw the conclusion
that the average age of all the workers chosen from both companies is different. The first company
workers are a li le bit more than 2 years younger than the second company workers.
11.1.4 The t-test for dependent groups
The t-test for dependent groups is used when the measurement of an analysed variable you do twice,
each me in different condi ons (but you should assume, that variances of the variable in both measurements are pre y close to each other). We want to check how big is the difference between the
pairs of measurements (di = x1i − x2i ). This difference is used to verify the hypothesis informing us
that the mean of the difference in the analysed popula on is 0.
Basic assump ons:
− measurement on an interval scale,
− normality of distribu on of measurements di (or the normal distribu on for an analysed variable
in each measurement),
− a dependent model.
Hypotheses:
H0 : µ0 = 0,
H1 : µ0 ̸= 0,
where:
µ0 , − mean of the differences di in a popula on.
The test sta s c is defined by:
t=
d √
n,
sdd
Copyright ©2010-2014 PQStat So ware − All rights reserved
107
11 COMPARISON - 2 GROUPS
where:
d − mean of differences di in a sample,
sdd − standard devia on of differences di in a sample,
n − number of differences di in a sample.
Test sta s c has the t-Student distribu on with n − 1 degrees of freedom.
The p value, designated on the basis of the test sta s c, is compared with the significance level α:
if p ≤ α =⇒
if p > α =⇒
reject H0 and accept H1 ,
there is no reason to reject H0 .
Note
• standard devia on of the difference is defined by:
√
∑n
2
i=1 (di − d)
sdd =
,
n−1
• standard error of the mean of differences is defined by:
SDd
SEMd = √ .
n
The se ngs window with the t-test for dependent groups can be opened in Statistics menu→Parametric
tests→t-test for dependent groups or in Wizard.
Note
Calcula ons can be based on raw data or data that are averaged like: arithme c mean of difference,
standard devia on of difference and sample size.
Copyright ©2010-2014 PQStat So ware − All rights reserved
108
11 COMPARISON - 2 GROUPS
11.2 NONPARAMETRIC TESTS
11.2.1 The Mann-Whitney U test
The Mann-Whitney U test is also called as the Wilcoxon Mann-Whitney test (Mann and Whitney (1947)[55]
and Wilcoxon (1949)[85]). This test is used to verify a hypothesis determining insignificance of differences between medians of an analysed variable in 2 popula ons (but you should assume that the distribu ons of a variable are pre y similar to each other).
Basic assump ons:
− measurement on an ordinal scaleor on an interval scale,
− an independent model.
Hypotheses:
H0 : θ1 = θ2 ,
H1 : θ1 ̸= θ2 ,
where:
θ1 , θ2 medians of an analysed variable of the 1st and the 2nd popula on.
The p value, designated on the basis of the test sta s c, is compared with the significance level α:
if p ≤ α =⇒
if p > α =⇒
reject H0 and accept H1 ,
there is no reason to reject H0 .
Note
Depending on a sample size, the test sta s c is calculated using by different formulas:
• For a small sample size:
U = n1 n2 +
n1 (n1 + 1)
− R1 ,
2
or
n2 (n2 + 1)
− R2 ,
2
where n1 , n2 are sample sizes, R1 , R2 are rank sums for the samples.
U ′ = n1 n2 +
This sta s c has the Mann-Whitney distribu on and it does not contain any correc on for es.
The value of the exact probability of the Mann-Whitney distribu on is calculated with the accuracy up to the hundredth place of the frac on.
• For a large sample size:
Z=√
U−
n1 n2 (n1+n2 +1)
12
−
n1 n2
2
∑
n1 n2 (t3 −t)
12(n1 +n2 )(n1 +n2 −1)
,
where:
U can be replaced with U ′ ,
t − number of cases included in a e.
The formula for the Z sta s c includes the correc on for es. This correc on is
∑used, when es
n1 n2 (t3 −t)
occur (if there are no es, the correc on is not calculated, because of 12(n1 +n2 )(n1 +n2 −1) = 0)
The Z sta s c asympto cally (for large sample sizes) has the normal distribu on.
Copyright ©2010-2014 PQStat So ware − All rights reserved
109
11 COMPARISON - 2 GROUPS
The Mann-Whitney test with the con nuity correc on (Marascuilo and McSweeney (1977)[60])
The con nuity correc on should be used to guarantee the possibility of taking in all the values of real
numbers by the test sta s c, according to the assump on of the normal distribu on. The formula for
the test sta s c with the con nuity correc on is defined as:
U − n1 n2 − 0.5
2
Z=√
.
∑
n1 n2 (n1+n2 +1)
n1 n2 (t3 −t)
−
12
12(n1 +n2 )(n1 +n2 −1)
The se ngs window with the Mann-Whitney U test can be opened in Statistics menu → NonParametric tests (ordered categories) → Mann-Whitney or in Wizard.
E
11.2. (computer.pqs file)
There was made a hypothesis that at some university male math students spend sta s cally more me
in front of a computer screen than the female math students. To verify the hypothesis from the populaon of people who study math at this university, there was drawn a sample consis ng of 54 people (25
women and 29 men). These persons were asked how many hours they spend in front of the computer
screens daily. There were obtained the following results:
( me, sex): (2, k) (2, m) (2, m) (3, k) (3, k) (3, k) (3, k) (3, m) (3, m) (4, k) (4, k) (4, k) (4, k) (4, m) (4, m)
(5, k) (5, k) (5, k) (5, k) (5, k) (5, k) (5, k) (5, k) (5, k) (5, m) (5, m) (5, m) (5, m) (6, k) (6, k) (6, k) (6, k) (6,
k) (6, m) (6, m) (6, m) (6, m) (6, m) (6, m) (6, m) (6, m) (7, k) (7, m) (7, m) (7, m) (7, m) (7, m) (7, m) (7,
m) (7, m) (7, m) (8, k) (8, m) (8, m).
Hypotheses:
H0 : the median of the me spent in front of a computer screen is exactly the same both
in the male and the female popula on of students, at the analysed university,
H1 : the median of the me spent in front of a computer screen is different among the
male popula on and the female popula on of students, at the analysed university.
Copyright ©2010-2014 PQStat So ware − All rights reserved
110
11 COMPARISON - 2 GROUPS
Based on the assumed level α = 0.05 and the Z sta s c of the Mann-Whitney test without the con nuity correc on (p value = 0.015441) and with the con nuity correc on (p value = 0.015821), and also
based on the exact U sta s c (p value = 0.014948) you can assume that there are sta s cally significant
differences among male and female students, if it goes about the me spent in front of a computer.
These differences are, that female students spend less me in front of a computer than male students
(the mean of the ranks for women is 22.02 (the median is 5) and it is much lower than the mean of the
ranks for men, which is 32.22 (median is 6)).
Copyright ©2010-2014 PQStat So ware − All rights reserved
111
11 COMPARISON - 2 GROUPS
11.2.2 The Wilcoxon test (matched-pairs)
The Wilcoxon matched-pairs test, is also called as the Wilcoxon test for dependent groups (Wilcoxon
1945[?],1949[?]). It is used if the measurement of an analysed variable you do twice, each me in
different condi ons. It is the extension for the two dependent samples of the Wilcoxon test (signedranks) − designed for a one sample. We want to check how big is the difference between the pairs
of measurements (di = x1i − x2i ) for each of i analysed objects. This difference is used to verify the
hypothesis determining that the median of the difference in the analysed popula on counts to 0.
Basic assump ons:
− measurement on an ordinal scale or on an interval scale,
− a dependent model.
Hypotheses:
H0 : θ0 = 0,
H1 : θ0 ̸= 0,
where:
θ0 − median of the differences di in a popula on.
The p value, designated on the basis of the test sta s c, is compared with the significance level α:
if p ≤ α =⇒
if p > α =⇒
reject H0 and accept H1 ,
there is no reason to reject H0 .
Note
Depending on the sample size, the test sta s c is calculated by using different formulas:
• For small a sample size:
T = min
(∑
R− ,
∑
)
R+ ,
where:
∑
∑ R+ − sums of posi ve ranks,
R− − sums of nega ve ranks.
This sta s c has the Wilcoxon distribu on and does not contain any correc on for es.
• For a large sample size
Z=√
n(n+1)
4
∑ 3 ∑ ,
n(n+1)(2n+1)
t − t
−
24
48
T−
where:
n − number of ranked signs (number of the ranks),
t − number of the cases included in a e.
The formula for the Z sta s c includes the correc on for es. This correc ∑
on is ∑
used, when the
t3 − t
es occur (if there are no es, the correc on is not calculated, because of
= 0).
48
The Z sta s c (for large sample sizes) asympto cally has the normal distribu on.
Copyright ©2010-2014 PQStat So ware − All rights reserved
112
11 COMPARISON - 2 GROUPS
The Wilcoxon test with the con nuity correc on (Marascuilo and McSweeney (1977)[60])
The con nuity correc on is used to guarantee the possibility of taking in all the values of the real numbers by the test sta s c, according to the assump on of the normal distribu on. The test sta s c with
the con nuity correc on is defined by:
n(n+1) T − 4 − 0.5
Z=√
∑ 3 ∑ .
n(n+1)(2n+1)
t − t
−
24
48
The se ngs window with the Wilcoxon test for dependent groups can be opened in Statistics menu
→ NonParametric tests (ordered categories)→Wilcoxon (matched-pairs) or in Wizard.
E
11.3. (pain.pqs file)
There was chosen a sample consis ng of 22 pa ents suffering from a cancer. They were examined to
check the level of felt pain (1 − 10 scale, where 1 means the lack of pain and 10 means unbearable
pain). This examina on was repeated a er a month of the treatment with a new medicine which was
supposed to lower the level of felt pain. There were obtained the following results:
(pain before, pain a er): (2, 2) (2, 3) (3, 1) (3,1) (3, 2) (3, 2) (3, 3) (4, 1) (4, 3) (4, 4) (5, 1) (5, 1) (5, 2) (5,
4) (5, 4) (6, 1) (6, 3) (7, 2) (7, 4) (7, 4) (8, 1) (8, 3).
Now, you want to check if this treatment has any influence on the level of felt pain in the popula on,
from which the sample was chosen.
Hypotheses:
H0 : the median of the differences between the level of pain before and a er a month
of treatment in the analysed popula on comes to 0,
H1 : the median of the differences between the level of pain before and a er a month
of treatment in the analysed popula on is different from 0.
Copyright ©2010-2014 PQStat So ware − All rights reserved
113
11 COMPARISON - 2 GROUPS
Comparing the p value = 0.0001 of the Wilcoxon test, based on the T sta s c, with the significance
level α = 0.05 you assume, that there is a sta s cally significant difference if concerning the level of
felt pain between these 2 examina ons. The difference is, that the level of pain decreased (the sum of
the nega ve ranks is significantly greater than the sum of the posi ve ranks). Exactly the same decision
you would make on the basis of p value = 0.00021 or p value = 0.00023 of the Wilcoxon test which is
based on the Z sta s c or the Z sta s c with the con nuity correc on.
11.2.3 TESTS FOR CONTINGENCY TABLES
Tests for con ngency tables can be calculated on the basis of the data gathered as con ngency tables
or in the form of a raw data. But there is also a possibility to transform the data from the con ngency
table to the raw form, or inversely.
Copyright ©2010-2014 PQStat So ware − All rights reserved
114
11 COMPARISON - 2 GROUPS
In the PQStat applica on there is a group of tests, which can be used on the base of one form as well
as the other one. There are:
The χ2 test for the trend for R × 2 tables,
The χ2 test and the Fisher test for R × C tables,
The χ2 test and the Fisher test for 2 × 2 tables and their correc ons,
The McNemar test, the Bowker test of the internal symmetry,
The Test of significance for Cohen's Kappa.
E
11.4. (sex-educa on.pqs file)
There is a sample which consists of 34 persons (n = 34). You need to analyse the 2 features of these
persons (X=sex, Y =educa on). Sex occurrs in 2 categories (X1 =woman, X2 =man), educa on occurrs
in 3 categories, (Y1 =primary+voca onal Y2 =secondary, Y3 =higher).
In case of the raw data, when you open the window with the op ons for the test, for example the χ2
test for C × R table, the op on − raw data will be automa cally selected.
In case of the data gathered in a con ngency table, it is worth to select this data (the values numbers
without headings) before you open the above-men oned window. Doing it and opening the window,
the contingency table will be automa cally selected and all the data from the selec on will be shown
to you.
Copyright ©2010-2014 PQStat So ware − All rights reserved
115
11 COMPARISON - 2 GROUPS
In the test window, you can always change the default se ngs rela ng to the kind of the data organisa on. In this window, you can also write the data which are supposed to be put into the con ngency
table.
As a result, you can return to the report, not only the test sta s c and a p value, but also:
• The con ngency tables of observed frequencies − data in the form of a con ngency table. This
table shows the distribu on of observa ons for several features (several variables). The table
of the 2 features (X, Y ) − one of them has r possible categories and the other one c possible
categoies − is shown below (table(11.1)).
Table 11.1. The con ngency table of r × c observed frequencies
Observed
frequencies Oij
X1
X2
Feature X
...
Xr
Total
Y1
O11
O21
...
Or1
∑r
i=1 Oi1
Y2
O12
O22
...
Or2
∑r
i=1 Oi2
Feature Y
...
Yc
...
O1c
...
O2c
...
...
...
Orc
∑r
...
i=1 Oic
n=
Total
∑c
O1j
∑j=1
c
j=1 O2j
∑c ...
O
∑rj=1∑crj
i=1
j=1 Oij
Observed frequencies Oij (i = 1, 2, . . . , r; j = 1, 2, . . . , c) show the frequencies of occurrance of all the par cular categories for both features.
To return the table to the report, you should choose the op on − add analysed data. For data
from the example (11.4) the con ngency table of the observed frequencies looks like this:
Copyright ©2010-2014 PQStat So ware − All rights reserved
116
11 COMPARISON - 2 GROUPS
• The con ngency table of expected frequencies − for each con ngency table of observed frequencies, can be created an adequate table of expected frequencies: Eij (table(11.2)).
Table 11.2. The con ngency table of r × c expected frequencies
Expected
frequencies Eij
X1
X2
Feature X
...
Xr
where: ∑r
∑
Oi1 × cj=1 O1j
E11 = i=1
, E12 =
n
∑
Oi1 × cj=1 O2j
, E22
n
∑c
∑r
i=1 Oi1 × j=1 Orj
, Er2
n
∑r
E21 =
Er1 =
i=1
=
=
Y1
E11
E21
...
Er1
Feature Y
Y2 ... Yc
E12 ... E1c
E22 ... E2c
...
...
...
Er2 ... Erc
∑
Oi2 × cj=1 O1j
, E1c
n
∑c
∑r
i=1 Oi2 × j=1 O2j
, E2c
n
∑c
∑r
i=1 Oi2 × j=1 Orj
, Erc
n
∑r
i=1
∑
Oic × cj=1 O1j
n
∑c
∑r
O
×
j=1 O2j
i=1 ic
n
∑c
∑r
i=1 Oic × j=1 Orj
.
n
∑r
=
=
=
i=1
For the data from the example (11.4), the con ngency table of expected frequencies looks like
this:
• The con ngency table of percentages calculated from the sum of columns. For the data from
the example (11.4), the con ngency table looks like this:
• The con ngency table of percentages calculated from the sum of rows. For the data from the
example (11.4), the con ngency table looks like this:
Copyright ©2010-2014 PQStat So ware − All rights reserved
117
11 COMPARISON - 2 GROUPS
• The con ngency table of the percentages calculated from the sum of rows and columns (from
total). For the data from the example (11.4), the table looks like this:
We can dis nguish 2 approaches for analysed con ngency tables. We can analyse the independence
between both features or their homogenei es. It means to check if there are any differences between
distribu on of the first feature (variable) and the second one. However, these approaches sound differently, as they both lead to the same calcula ons.
11.2.4 The Chi-square test for trend for Rx2 tables
The χ2 test for trend is used to detremine whether there is a trend in propor on for par cular categories
of an analysed variables (features). It is based on the data gathered in the con ngency tables of 2
features. The first feature has the possible r ordered categories: X1 , X2 , ..., Xr and the second one
has 2 categories: G1 , G2 (table (11.3)).
Table 11.3. The con ngency table of r × 2 observed frequencies
Observed frequencies
Oij
X1
X2
Feature 1 (feature X)
...
Xr
Total
C1 =
G1
O11
O21
...
O
∑r1
r
i=1 Oi1
Feature 2 (group)
G2
Total
O12
W1 = O11 + O12
O22
W2 = O21 + O22
...
...
O
Wr = Or1 + Or2
∑r2
C2 = ri=1 Oi2
n = C1 + C2
Basic assump ons:
− measurement on an ordinal scale or on an interval scale,
− an independent model (the second feature − 2 independent groups).
Hypotheses:
H0 : In the analysed popula on the trend in a propor on of p1 , p2 , ..., pr does not exist,
H1 : There is the trend in a propor on of p1 , p2 , ..., pr in the analysed popula on.
where:
p1 , p2 , ..., pr are the propor ons p1 =
The test sta s c is defined by:
χ2 =
C1
n
O11
W1 , p2
=
O21
W2 ,..., pr
=
Or1
Wr .
[∑
(∑
)]2
r
i·Wi
( ri=1 i · Oi1 ) − C1
i=1 n
[
(∑
)2 ] .
(
)
∑n 2
n
i·Wi
C1
1 − n ( i=1 i Wi ) − n
i=1 n
This sta s c asympto cally (for large expected frequencies) has the χ2 distribu on with 1 degree of
freedom.
The p value, designated on the basis of the test sta s c, is compared with the significance level α:
Copyright ©2010-2014 PQStat So ware − All rights reserved
118
11 COMPARISON - 2 GROUPS
if p ≤ α =⇒
if p > α =⇒
reject H0 and accept H1 ,
there is no reason to reject H0 .
The se ngs window with the Chi-square test for trend can be opened in Statistics menu → NonParametric tests (ordered categories) → Chi-square for trend or in Wizard.
E
11.5. (viewers.pqs file)
Because of the decrease in people watching some par cular soap opera there was carried out an opinion survey. 100 persons were asked, who has recently started watching this soap opera, and 300 persons were asked, who has watched it regularly from the beginning. They were asked about the level of
preoccupa on with the character's life. The results are wri en down in the table below:
Level of
commitment
rather small
average
rather high
high
very high
total
group of new viewers
7
13
30
24
26
100
grupa
group of steady viewers
7
25
58
99
111
300
total
14
38
88
123
137
400
The new viewers consist of 25% of all the analysed viewers. This propor on is not the same for each
level of commitment, but looks like this:
Copyright ©2010-2014 PQStat So ware − All rights reserved
119
11 COMPARISON - 2 GROUPS
Level of
commitment
rather small
average
rather high
high
very high
total
group of new viewers
p1 =50.00%
p2 =34.21%
p3 =34.09%
p4 =19.51%
p5 =18.98%
25.00%
group
group of steady viewers
50.00%
65.79%
65.91%
80.49%
81.02%
75.00%
total
100%
100%
100%
100%
100%
100%
Hypotheses:
H0 : in the popula on of the soap opera viewers, the trend in propor ons of
p1 , p2 , p3 , p4 , p5 does not exist,
H1 : in the popula on of the soap opera viewers, the trend in propor ons of
p1 , p2 , p3 , p4 , p5 does exists.
The p value = 0.000436, compared with the significance α=0.05 supports the alterna ve hypothesis
informing that the trend in propor ons of p1 , p2 , ..., p5 does exists. As shown in the con ngency table
of percentages calculated from the sum of columns, there is a decreasing trend (the more interested in
the character's life the group of viewers is, the smaller part of the group of new viewers is).
11.2.5 The Chi-square test and Fisher test for RxC tables
These tests are based on the data gathered in the form of a con ngency table of 2 features (X, Y ). One
of them has possible r categories X1 , X2 , ..., Xr and the other one c categories Y1 , Y2 , ..., Yc (look at
Copyright ©2010-2014 PQStat So ware − All rights reserved
120
11 COMPARISON - 2 GROUPS
the table (11.1)).
Basic assump ons:
− measurement on a nominal scale (alterna vely: an ordinal or an interval),
− an independent model.
The addi onal assump on for the χ2 :
− large expected frequencies (according to Cochran interpreta on (1952)[20] none of these expected frequencies can be < 1 and no more than 20% of expected frequencies can be < 5).
• General hypotheses:
H0 : Oij = Eij for all categories,
H1 : Oij ̸= Eij for at least one category,
where:
Oij − observed frequencies in a con ngency table,
Eij − expected frequencies in a con ngency table.
• Hypotheses in the meaning of independence:
H0 : there is no dependence between the analysed features of the popula on (both
classifica ons are sta s cally independent according to X and Y feature),
H1 : there is a dependence between the analysed features of the popula on.
• Hypotheses in the meaning of homogeneity:
H0 : in the analysed popula on, the distribu on of X feature categories is exactly
the same for each category of Y feature,
H1 : in the analysed popula on distribu on, the of X feature categories is different
for at least one category of Y feature.
Compare the p value, calculated on the basis of the test sta s c, with the significance level α:
if p ≤ α =⇒
if p > α =⇒
reject H0 and accept H1 ,
there is no reason to reject H0 .
The Chi-square test for R × C tables
The χ2 test for r × c tables is also known as the Pearson's Chi-square test (Karl Pearson 1900). This test
is an extension on 2 features of the χ2 test (goodness-of-fit).
The test sta s c is defined by:
r ∑
c
∑
(Oij − Eij )2
.
χ2 =
Eij
i=1 j=1
This sta s c asympto cally (for large expected frequencies) has the χ2 distribu on with a number of
degrees of freedom calculated using the formula: df = (r − 1)(c − 1).
Compare the p value, calculateld on the basis of the test sta s c, with the significance level α.
The se ngs window with the Chi-square test (RxC) can be opened in Statistics menu → NonParametric tests (unordered categories) → Chi-square (RxC) or in Wizard.
Copyright ©2010-2014 PQStat So ware − All rights reserved
121
11 COMPARISON - 2 GROUPS
E
11.6. (country-educa on.pqs file)
There is a sample of 605 persons (n = 605), who had 2 features analysed for (X=country of residence,
Y =educa on). The first feature occurrs in 4 categories, and the second one in 3 categories (X1 =Country
1, X2 =Country 2, X3 =Country 3, X4 =Country 4, Y1 =primary, Y2 =secondary, Y3 =higher). The data distribu on is shown below, in the con ngency table:
Based on this sample, you would like to find out if there is any dependence between educa on and
country of residence in the analysed popula on.
Hypotheses:
H0 : there is no dependence between educa on and country of residence
in the analysed popula on,
H1 : there is a dependence between educa on and country of residence
in the analysed popula on.
Copyright ©2010-2014 PQStat So ware − All rights reserved
122
11 COMPARISON - 2 GROUPS
The table of the expected frequencies does not contain any values which are less than 5.
The p value = 0.03174. So, on the basis of the significance level α = 0.05 we can draw the conclusion
that there is a dependence between educa on and country of residence in the analysed popula on.
The Fisher test for R × C tables
The Fisher test for r × c tables is also called the Fisher-Freeman-Halton test (Freeman G.H., Halton J.H.
(1951)[31]). This test is an extension on r × c tables of the Fisher's exact test. It defines the exact
probability of an occurrence specific distribu on of numbers in the table (when we know n and we set
the marginal totals).
If you define marginal sums of each row as:
Wi =
c
∑
Oij ,
j=1
where:
Oij − observed frequencies in a table,
Copyright ©2010-2014 PQStat So ware − All rights reserved
123
11 COMPARISON - 2 GROUPS
and the marginal sums of each column as:
Ki =
r
∑
Oij .
i=1
then, having defined the marginal sums for the different distribu ons of the observed frequencies represented by Uij , you can calculate the P probabili es:
∏
D−1 cj=1 Kj !
P =
,
U1j !U2j ! . . . Urj
where
D=
(W1 + W2 + . . . + Wr )!
.
W1 !W2 ! . . . Wr !
The exact significance level p: is the sum of P probabili es (calculated for new values Uij ), which are
smaller or equal to P probability of the table with the ini al numbers Oij .
The exact p value is compared with the significance level α.
The se ngs window with the Fisher exact test (RxC) can be opened in Statistics menu → NonParametric tests (unordered categories) → Fisher (RxC) or in Wizard.
Info.
The process of calcula on of p values for this test is based on the algorithm published by Mehta (1986)[62].
Note
Note, that comparisons rela ng to 2 chosen categories can be made using the tests for con ngency
tables 2 × 2 and the Bonferroni correc on [1].
Copyright ©2010-2014 PQStat So ware − All rights reserved
124
11 COMPARISON - 2 GROUPS
11.2.6 The Chi-square test and the Fisher test for 2x2 tables (with correc ons)
These tests are based on the data gathered in the form of a con ngency table of 2 features (X, Y ), each
of them has 2 possible categories X1 , X2 and Y1 , Y2 (look at the table (11.1)).
Basic assump ons:
− measurement on a nominal scale (dichotomous variables − it means the variables of two categories),
− an independent model.
The addi onal assump on for the χ2 test:
− large expected frequencies (according to the Cochran interpreta on (1952)[20], none of these
expected frequencies can be < 1 and no more than 20% of the expected frequencies can be
< 5).
• General hypotheses:
H0 : Oij = Eij for all categories,
H1 : Oij ̸= Eij for at least one category,
where:
Oij − observed frequencies in a con ngency table,
Eij − expected frequencies in a con ngency table.
• Hypotheses in the meaning of independence:
H0 : there is no dependence between the analysed features of the popula on (both
classifica ons are sta s cally independent according to X and Y feature),
H1 : there is a dependence between the analysed features of the popula on.
• Hypotheses in the meaning of homogeneity:
H0 : in the analysed popula on, the distribu on of X feature categories is exactly
the same for both categories of Y feature,
H1 : in the analysed popula on, the distribu on of X feature categories is different
for both categories of Y feature.
The p value, designated on the basis of the test sta s c, is compared with the significance level α:
if p ≤ α =⇒
if p > α =⇒
reject H0 and accept H1 ,
there is no reason to reject H0 .
Note
Addi onally for 2 × 2 con ngency tables PQStat calculates also the odds ra o − OR and the rela ve
risk − RR altogether with the confidence intervals. These intervals are calculated on the basis of the
approximate χ2 distribu on − if they accompany the χ2 test, or of the exact algorithms − if they accompany the Fisher's test and mid-p.
The Chi-square test for 2 × 2 tables
The χ2 test for 2 × 2 tables − The Pearson's Chi-square test (Karl Pearson 1900) is constraint of the χ2
test for r × c tables.
Copyright ©2010-2014 PQStat So ware − All rights reserved
125
11 COMPARISON - 2 GROUPS
The test sta s c is defined by:
χ2 =
2 ∑
2
∑
(Oij − Eij )2
.
Eij
i=1 j=1
This sta s c asympto cally (for large expected frequencies) has the χ2 distribu on with a 1 degree of
freedom.
The p value, designated on the basis of the test sta s c, is compared with the significance level α.
The se ngs window with the Chi-square test, OR/RR (2x2) can be opened in Statistics menu →
NonParametric tests (unordered categories)→Chi-square, OR/RR (2x2) or in Wizard.
E
11.7. (sex-exam.pqs file)
There is a sample consis ng of 170 persons (n = 170). Using this sample, you want to analyse 2 features (X=sex, Y =exam passing). Each of these features occurs in two categories (X1 =f, X2 =m, Y1 =yes,
Y2 =no). Based on the sample you want to get to know, if there is any dependence between sex and
exam passing in the above popula on. The data distribu on is presented in the con ngency table below:
Observed frequencies
Oij
f
sex
m
total
exam passing
yes no total
50
40
90
20
60
80
70 100 170
Hypotheses:
Copyright ©2010-2014 PQStat So ware − All rights reserved
126
11 COMPARISON - 2 GROUPS
H0 : there is no dependence between sex and exam passing in the analysed popula on,
H1 : there is a dependence between sex and exam passing in the analysed popula on.
The expected frequency table does not contain any values less than 5.
The p value = 0.000053. So, on the significance level α = 0.05 we can accept the alterna ve hypothesis
informing us that there is a dependence between sex and exam passing in the analysed popula on. Significantly, the exam is passed more o en by women ( 50
90 = 55.56% out of all the women in the sample
Copyright ©2010-2014 PQStat So ware − All rights reserved
127
11 COMPARISON - 2 GROUPS
who passed the exam) than by men ( 20
80 = 25.00% out of all the men in the sample who passed the
exam).
The Chi-square test with the Yate's correc on for con nuity
The χ2 test with the Yate's correc on (Frank Yates (1934)[87]) is a more conserva ve test than the χ2
test (it rejects a null hypothesis more rarely than the χ2 test). The correc on for con nuity guarantees
the possibility of taking in all the values of real numbers by a test sta s c, according to the χ2 distribuon assump on.
The test sta s c is defined by:
2 ∑
2
∑
(|Oij − Eij | − 0.5)2
.
χ =
Eij
2
i=1 j=1
E
(11.7) cont. (sex-exam.pqs file)
The p value for the χ2 test with the Yate's correc on is 0.000103. Similarly to the χ2 test without the
correc on, on the significance level α = 0.05, the alterna ve hypothesis can be accepted. The alterna ve hypothesis informs, that there is a dependence between sex and exam passing in the analysed
popula on. Significantly, the exam was passed more o en by women ( 50
90 = 55.56% out of all the
20
women in the sample who passed the exam) than by men ( 80 = 25.00% out of all the men in the sample who passed the exam).
The Fisher test for 2 × 2 tables
The Fisher test for 2 × 2 tables is also called the Fisher exact test (R. A. Fisher (1934)[27], (1935)[28]).
This test enables you to calculate the exact probability of the occurrence of the par cular number distribu on in a table (knowing n and defined marginal sums).
(O11 +O21 )(O12 +O22 )
O12
11
P = (O11O+O
).
12 +O21 +O22
O11 +O12
If you know each marginal sum, you can calculate the P probability for various configura ons of observed frequencies. The exact p significance level is the sum of probabili es which are less or equal to
the analysed probability.
The p value is compared with the significance level α.
The se ngs window with the Fisher exact test, mid-p (2x2) can be opened in Statistics menu →
NonParametric tests (unordered categories)→Fisher, mid-p (2x2) or in Wizard.
Copyright ©2010-2014 PQStat So ware − All rights reserved
128
11 COMPARISON - 2 GROUPS
E
(11.7) cont. (sex-exam.pqs file)
Hypotheses:
H0 : there is no dependence between sex and exam passing in the analysed popula on,
H1 : there is a dependence between sex and exam passing in the analysed popula on.
Copyright ©2010-2014 PQStat So ware − All rights reserved
129
11 COMPARISON - 2 GROUPS
The two-sided p value = 0.000083. So, using the Fisher exact test, similarly to the χ2 test and the χ2
test with the Yate's correc on, on the significance level α = 0.05 you accept the hypothesis informing
us that there is a dependence between sex and exam passing in the analysed popula on. Significantly,
50
the exam was passed more o en by women ( 90
= 55.56% out of all the women in the sample who
20
passed the exam) than by men ( 80 = 25.00% out of all the men in the sample who passed the exam).
The mid-p
The mid-p is the Fisher exact test correc on. This modified p value is recommended by many sta s cians (Lancaster 1961[48], Anscombe 1981[4], Pra and Gibbons 1981[69], Placke 1984[68], Mie nen 1985[63] and Barnard 1989[6], Rothman 2008[72]) as a method used in decreasing the Fisher exact
test conserva sm. As a result, using the mid-p the null hypothesis is rejected much more qucikly than
by using the Fisher exact test. For large samples a p value is calculated by using the χ2 test with the
Yate's correc on and the Fisher test givs quite similar results. But a p value of the χ2 test without any
correc on corresponds with the mid-p.
The p value of the mid-p is calculated by the transforma on of the probability value for the Fisher exact
test. The one-sided p value is calculated by using the following formula:
pI(mid−p) = pI(F isher) − 0.5 · Ppoint(given
table) ,
where:
pI(mid−p) − one-sided p value of mid-p,
pI(F isher) − one-sided p value of Fisher exact test,
and the two-sided p value is defined as a doubled value of the smaller one-sided probability:
pII(mid−p) = 2pI(mid−p) ,
where:
pII(mid−p) − two-sided p value of mid-p.
E
(11.7) cont. (sex-exam.pqs file)
Copyright ©2010-2014 PQStat So ware − All rights reserved
130
11 COMPARISON - 2 GROUPS
The two-sided p value of the con ngency table from the (11.7) example is p=0.000054. So, on the significance level α=0.05 (similarly to the Fisher exact test, the χ2 test and χ2 test with the Yate's correc on)
you accept the alterna ve hypothesis veryfing that there is a dependence between sex and exam passing in the analysed popula on. Significantly, the exam was passed more o en by women ( 50
90 = 55.56%
20
out of all the women in the sample who passed the exam) than by men ( 80
= 25.00% out of all the
men in the sample who passed the exam).
11.2.7 Rela ve Risk and Odds Ra o
The risk and odds designa on of occurence an analysed phenomenon, on the basis of exposure to the
factor that can cause it, is es mated according to data collected in the con ngency table 2 × 2:
Table 11.4. The con ngency table of 2 × 2 observed frequencies
Observed frequencies
Oij
Risk factor
Analysed phenomenon (illness)
not occurs (control)
Total
occurs (case)
exposed
unexposed
Total
O11
O21
O11 + O21
O12
O22
O12 + O22
O11 + O12
O21 + O22
n = O11 + O12 + O21 + O22
If a study is a case-control study, the odds ra o of occurence the phenomenon is calculated for the
table. Usually, they are retrospec ve studies − the researcher decides on his own about the sample
size, with the phenomenon, and about the control sample (without the phenomenon).
If a study is a cohort study, the rela ve risk of occurence the phenomenon is calculated for the table.
Usually, they are prospec ve studies − the researcher cares about experiment condi ons, because of
the structure of an analysed phenomenon in a sample and in a popula on should be similar.
The odds ra o (2 × 2 table)
For the designa on of odds ra o, we calculate the probability of being a case in the exposed group and
in the unexposed group, according to the formulas:
oddsexposed =
O11 /(O11 + O12 )
O11
=
,
O12 /(O11 + O12 )
O12
oddsunexposed =
The Odds Ra o:
OR =
O21
O21 /(O21 + O22 )
=
.
O22 /(O21 + O22 )
O22
O11 /O12
O11 O22
=
.
O21 /O22
O12 O21
The test of significance for the OR
This test is used to the hypothesis verifica on about the odds of occurence the analysed phenomenon is the same in the group of exposed and unexposed to the risk factor.
Hypotheses:
H0 : OR = 1,
H1 : OR ̸= 1.
The test sta s c is defined by:
z=
ln(OR)
,
SE
Copyright ©2010-2014 PQStat So ware − All rights reserved
131
11 COMPARISON - 2 GROUPS
where:√
SE = O111 +
1
O12
+
1
O21
+
1
O22
− standard error of the ln(OR).
The test sta s c asympto cally (for large sample size) has the normal distribu on.
The p value, designated on the basis of the test sta s c, is compared with the significance level
α:
if p ≤ α =⇒
if p > α =⇒
reject H0 and accept H1 ,
there is no reason to reject H0 .
Note
In the interpreta on of odds ra o significance, we usually use the designated confidence interval.
Then, we check if the interval contains the value of 1.
The odds ra o, altogether with asympto c confidence intervals, and the odds ra o significance test are
calculated by:
• Chi-square test, OR/RR (2x2) window,
• Mantel-Heanszel OR/RR window − for each table designated by the strata.
Exact intervals and the mid-p intervals for the odds ra o are calculated by:
• Fisher exact test, mid-p (2x2) window.
The rela ve risk (2 × 2 table)
In the cohort study, we can designate the risk of occurence the analysed phenomenon (because the
structure of phenomenon, in the sample, should come closer to the popula on, from which the sample
was taken) and calculate the rela ve risk (RR).
The es mated risk of occurence the analysed phenomenon is designated by the following formula R =
O11 +O21
. However, the rela ve risk is designated by:
n
RR =
O11 /(O11 + O12 )
O21 /(O21 + O22 )
The test of significance for the RR
This test is used to the hypothesis verifica on about the risk of occurence the analysed occurrence
is the same in the group of exposed and unexposed to the risk factor.
Hypotheses:
H0 : RR = 1,
H1 : RR ̸= 1.
The test sta s c is defined by:
z=
where:√
SE = O111 −
1
021 +022
+
1
O21
−
1
021 +022
ln(RR)
,
SE
− standard error of the ln(RR).
The test sta s c asympto cally (for large sample size) has the normal distribu on.
The p value, designated on the basis of the test sta s c, is compared with the significance level
α:
Copyright ©2010-2014 PQStat So ware − All rights reserved
132
11 COMPARISON - 2 GROUPS
if p ≤ α =⇒
if p > α =⇒
reject H0 and accept H1 ,
there is no reason to reject H0 .
Note
In the interpreta on of the rela ve risk significance, we usually use the designated confidence
interval. Then, we check if the interval contains the value of 1.
The rela ve risk, altogether with the asympto c confidence intervals, and the rela ve risk significance
test are calculated by:
• Chi-square test, OR/RR (2x2) window,
• Mantel-Heanszel OR/RR window − for each table designated by the strata.
11.2.8 The Z test for 2 independent propor ons
The Z test for 2 independent propor ons is used in the similar situa ons as the chi2 test (2 × 2). It
means, when there are 2 independent samples with the total size of n1 and n2 , with the 2 possible
results to gain (one of the results is dis nguished with the size of m1 - in the first sample and m2 - in the
1
second one). For these samples it is also possible to calculate the dis nguished propor ons p1 = m
n1
2
and p2 = m
n2 . This test is used to verify the hypothesis informing us that the dis nguished propor ons
P1 and P2 in popula ons, from which the samples were drawn, are equal.
Basic assump ons:
− measurement on a nominal scale (alterna vely: an ordinal or an interval),
− an independent model,
− large sample sizes.
Hypotheses:
H0 : P1 = P2 ,
H1 : P1 ̸= P2 ,
where:
P1 , P2 frac on for the first and the second popula on.
The test sta s c is defined by:
Z=√
p1 − p2
(
p(1 − p) n11 +
1
n2
),
where:
2
p = mn11 +m
+n2 .
The test sta s c modified by the con nuity correc on is defined by:
(
)
p1 − p2 − 21 n11 + n12
Z= √
).
(
1
1
p(1 − p) n1 + n2
The Z Sta s c with and without the con nuity correc on asympto cally (for the large sample sizes)
has the normal distribu on.
The p value, designated on the basis of the test sta s c, is compared with the significance level α:
Copyright ©2010-2014 PQStat So ware − All rights reserved
133
11 COMPARISON - 2 GROUPS
if p ≤ α =⇒
if p > α =⇒
reject H0 and accept H1 ,
there is no reason to reject H0 .
Apart from the difference between propor ons, the program calculates the value of the NNT.
NNT (number needed to treat) − indicator used in medicine to define the number of pa ents which
have to be treated for a certain me in order to cure one person.
Note
From PQStat version 1.3.0, the confidence intervals for the difference between two independent propor ons are es mated on the basis of the Newcombe-Wilson method. In the previous versions it was
es mated on the basis of the Wald method.
The jus fica on of the change is as follows:
Confidence intervals based on the classical Wald method are suitable for large sample sizes and for
the difference between propor ons far from 0 or 1. For small samples and for the difference between
propor ons close to those extreme values, the Wald method can lead to unreliable results (Newcombe
1998[65], Mie nen 1985[64], Beal 1987[7], Wallenstein 1997[79]). A comparison and analysis of many
methods which can be used instead of the simple Wald method can be found in Newcombe's study
(1998)[65]. The suggested method, suitable also for extreme values of propor ons, is the method first
published by Wilson (1927)[86], extended to the intervals for the difference between two independent
propor ons.
Note
The confidence interval for the NNT is es mated on the basis of the Newcombe-Wilson method (Bender (2001)[8], Newcombe (1998)[65], Wilson (1927)[86]).
The se ngs window with the Z test for 2 proportions can be opened in Statistics menu → NonParametric tests (ordered categories) → Z for 2 independent proportions.
Copyright ©2010-2014 PQStat So ware − All rights reserved
134
11 COMPARISON - 2 GROUPS
E
(11.7) cont. (sex-exam.pqs file)
20
You know that 50
90 = 55.56% out of all the women in the sample who passed the exam and 80 = 25.00%
out of all the men in the sample who passed the exam. This data can be wri en in two ways − as a
numerator and a denominator for each sample, or as a propor on and a denominator for each sample:
Hypotheses:
H0 : The propor on of the men who passed the exam is the same as the propor on
of the women who passed the exam in the analysed popula on,
H1 : The propor on of the men who passed the exam is different than the propor on
of the women who passed the exam in the analysed popula on.
Copyright ©2010-2014 PQStat So ware − All rights reserved
135
11 COMPARISON - 2 GROUPS
Note
It is necessary to select the appropriate area (data without headings) before the analysis begins, because
usually there are more informa on in a datasheet. You should also select the op on indica ng the
content of the variable (frequency (numerator) or proportion). The difference between propor ons
dis nguished in the sample is 30.56%, a 95% and the confidence interval for it (15.90%, 43.35%) does
not contain 0.
Based on the Z test without the con nuity correc on as well as on the Z test with the con nuity
correc on (p value = 0.000053 and p value = 0.0001), on the significance level α=0.05, the alterna ve
hypothesis can be accepted (similarly to the Fisher exact test, its the mid-p correc ons, the χ2 test and
the χ2 test with the Yate's correc on). So, the propor on of men, who passed the exam is different than
the propor on of women, who passed the exam in the analysed popula on. Significantly, the exam was
50
passed more o en by women ( 90
= 55.56% out of all the women in the sample who passed the exam)
20
than by men ( 80 = 25.00% out of all the men in the sample who passed the exam).
E
11.8.
Let us assume that the mortality rate of a disease is 100% without treatment and that therapy lowers
the mortality rate to 50% − that is the result of 20 years of study. We want to know how many people
have to be treated to prevent 1 death in 20 years. To answer that ques on, two samples of 100 people
were taken from the popula on of the diseased. In the sample without treatment there are 100 pa ents
of whom we know they will all die without the therapy. In the sample with therapy we also have 100
pa ents of whom 50 will survive.
Pa ents − not undergoing therapy
sample numerator sample (denominator)
100
100
Pa ents − undergoing therapy
sample numerator sample (denominator)
50
100
We will calculate the NNT.
The difference between propor ons is sta s cally significant (p < 0.000001) but we are interested in
the NNT − its value is 2, so the treatment of 2 pa ents for 20 years will prevent 1 death. The calculated
confidence interval value of 95% should be rounded off to a whole number, wherefore the NNT is 2 to
3 pa ents.
11.2.9 The McNemar test, the Bowker test of internal symmetry
Basic assump ons:
− measurement on a nominal scale,
Copyright ©2010-2014 PQStat So ware − All rights reserved
136
11 COMPARISON - 2 GROUPS
− a dependent model.
The McNemar test
The McNemar test (NcNemar (1947)[61]) is used to verify the hypothesis determining the agreement
between the results of the measurements, which were done twice X (1) and X (2) of an X feature (between 2 dependent variables X (1) and X (2) ). The analysed feature can have only 2 categories (defined
here as (+) and (−)). The McNemar test can be calculated on the basis of raw data or on the basis of a
2 × 2 con ngency table.
Table 11.5. 2 × 2 con ngency table for the observed frequencies of dependent variables
Observed frequencies
Oij
(+)
(1)
(−)
X
Total
X (2)
(+)
O11
O21
O11 + O21
(−)
O12
O22
O12 + O22
Total
O11 + O12
O21 + O22
n = O11 + O12 + O21 + O22
Hypotheses:
H0 : O12 = O21 ,
H1 : O12 ̸= O21 .
The test sta s c is defined by:
χ2 =
(O12 − O21 )2
.
O12 + O21
This sta s c asympto cally (for large frequencies) has the χ2 distribu on with a 1 degree of freedom.
The p value, designated on the basis of the test sta s c, is compared with the significance level α:
if p ≤ α =⇒
if p > α =⇒
reject H0 and accept H1 ,
there is no reason to reject H0 .
The Con nuity correc on for the McNemar test
This correc on is a more conserva ve test than the McNemar test (a null hypothesis is rejected much
more rarely than when using the McNemar test). It guarantees the possibility of taking in all the values
of real numbers by the test sta s c, according to the χ2 distribu on assump on. Some sources give
the informa on that the con nuity correc on should be used always, but some other ones inform, that
only if the frequencies in the table are small.
The test sta s c with the con nuity correc on is defined by:
χ2 =
(|O12 − O21 | − 1)2
.
O12 + O21
Odds ra o of a result change
If the study is carried out twice for the same feature and on the same objects − then, odds ra o for
the result change (from (+) to (−) and inversely) is calculated for the table.
The odds for the result change from (+) to (−) is O12 , and the odds for the result change from (−) to
(+) is O21 . Odds Ra o (OR) is:
O12
OR =
.
O21
Confidence interval for the odds ra o is calculated on the base of the standard error:
√
1
1
+
.
SE =
O12 O21
Copyright ©2010-2014 PQStat So ware − All rights reserved
137
11 COMPARISON - 2 GROUPS
The se ngs window with the Bowker-McNemar test can be opened in Statistics menu → NonParametric tests (unordered categories) → Bowker-McNemar or in Wizard.
The Bowker test of internal symmetry
The Bowker test of internal symmetry (Bowker (1948)[11]) is an extension of the McNemar test for
2 variables with more than 2 categories (c > 2). It is used to verify the hypothesis determining the
symmetry of 2 results of measurements executed twice X (1) and X (2) of X feature (symmetry of 2
dependent variables X (1) i X (2) ). An analysed feature may have more than 2 categories. The Bowker
test of internal symmetry can be calculated on the basis of either raw data or a c × c con ngency table.
Table 11.6. c × c con ngency table for the observed frequencies of dependent variables
Observed frequencies
Oij
(1)
X1
X (1)
(1)
X2
...
(1)
Xc
Total
X1
X2
X (2)
(2)
...
Xc
O11
O12
...
O1c
O21
...
O
∑c c1
i=1 Oi1
O22
...
O
∑c c2
i=1 Oi2
...
...
...
...
O2c
...
O
∑c cc
i=1 Oic
(2)
(2)
n=
Total
∑c
O1j
∑j=1
c
j=1 O2j
...
∑c
O
∑cj=1∑ccj
i=1
j=1 Oij
Hypotheses:
H0 : Oij = Oji ,
H1 : Oij ̸= Oji for at least one pair Oij , Oji ,
where j ̸= i, j ∈ 1, 2, ..., c, i ∈ 1, 2, ..., c, so Oij and Oji are the frequencies of the symmetrical pairs
in the c × c table
Copyright ©2010-2014 PQStat So ware − All rights reserved
138
11 COMPARISON - 2 GROUPS
The test sta s c is defined by:
χ2 =
c ∑
∑
(Oij − Oji )2
.
Oij + Oji
i=1 j>i
This sta s c asympto cally (for large sample size) has the χ2 distribu on with a number of degrees of
freedom calculated using the formula: df = c(c−1)
2 .
The p value, designated on the basis of the test sta s c, is compared with the significance level α:
if p ≤ α =⇒
if p > α =⇒
reject H0 and accept H1 ,
there is no reason to reject H0 .
E
11.9. (opinion.pqs file)
Two different surveys were carried out. They were supposed to analyse students' opinions about the
par cular academic professor. Both the surveys enabled students to give a posi ve opinion, a nega ve
and a neutral one. Both surveys were carried out on the basis of the same sample of 250 students. But
the first one was carried out the day before an exam done by the professor, and the other survey the
day a er the exam. There are some data below − in a form of raw rows, and all the data − in the form
of a con ngency table. Check, if both surveys give the similar results.
Hypotheses:
H0 : the number of students, who changed their opinions is exactly the same
for each of the possibile symmetric opinion changes,
H1 : the number of students, who changed their opinions is different
for at least one of the possibile symmetric opinion changes,
where, for example, changing the opinion from posi ve to nega ve one is symmetrical to
changing the opinion from nega ve to posi ve one.
Copyright ©2010-2014 PQStat So ware − All rights reserved
139
11 COMPARISON - 2 GROUPS
Comparing the p value for the Bowker test (p value < 0.000001) with the significance level α = 0.05 it
may be assumed that students changed their opinions. Looking at the table you can see that, there were
more students who changed their opinions to nega ve ones a er the exam, than those who changed
it to posi ve ones a er the exam. There were also students who did not evaluate the professor in the
posi ve way a er the exam any more.
If you limit your analysis only to the people having clear opinions about the professor (posi ve or nega ve ones), you can use the McNemar test:
Hypotheses:
H0 : the number of students, who changed their opinions from nega ve to posi ve ones
is exactly the same as those, who changed their opinions from posi ve to nega ve,
H1 : the number of students, who changed their opinions from nega ve to posi ve ones
is different from those, who changed their opinions from posi ve to nega ve.
Copyright ©2010-2014 PQStat So ware − All rights reserved
140
11 COMPARISON - 2 GROUPS
If you compare the p value, calculated for the McNemar test (p value < 0.000001), with the significance
level α = 0.05, you draw the conclusion that the students changed their opinions. There were much
more students, who changed their opinions to nega ve ones a er the exam, than those who changed
their opinions to posi ve ones. The possibility
of changing the opinion from posi ve (before the exam)
( )
mes
to nega ve (a er the exam) is eleven 44
4
( 4 ) greater than from nega ve to posi ve (the chance to
change opinion in the opposite direc on is: 44 = 0.090909).
11.2.10 Z Test for two dependent propor ons
Z Test for two dependent propor ons is used in situa ons similar to the McNemar's Test, i.e. when we
have 2 dependent groups of measurements (X (1) i X (2) ), in which we can obtain 2 possible results of
the studied feature ((+)(−)).
Observed sizes
Oij
(+)
(1)
(−)
X
Sum
X (2)
(+)
O11
O21
O11 + O21
(−)
O12
O22
O12 + O22
Suma
O11 + O12
O21 + O22
n = O11 + O12 + O21 + O22
12
21
We can also calculated dis nguished propor ons for those groups p1 = O11 +O
i p2 = O11 +O
. The
n
n
test serves the purpose of verifying the hypothesis that the dis nguished propor ons P1 and P2 in the
popula on from which the sample was drawn are equal.
Basic assump ons:
− measurement on the nominal, ordinal, or interval scale,
− dependent model,
− large sample size.
Copyright ©2010-2014 PQStat So ware − All rights reserved
141
11 COMPARISON - 2 GROUPS
Hypotheses:
H0 : P1 − P2 = 0,
H1 : P1 − P2 ̸= 0,
where:
P1 , P2 frac ons for the first and the second measurement.
The test sta s c has the form presented below:
p1 − p2
Z=√
· n,
O21 + O12
The Z Sta s c asympto cally (for the large sample size) has the normal distribu on.
On the basis of test sta s cs, p value is es mated and then compared with the significance level α:
if p ≤ α =⇒
if p > α =⇒
reject H0 and accept H1 ,
there is no reason to reject H0 .
Note
Confidence interval for the difference of two dependent propor ons is es mated on the basis of the
Newcombe-Wilson method.
The window with se ngs for Z-Test for two dependent proportions is accessed via the menu Statistics→Nonparametric tests (nonordered categories)→Z-Test for two dependent proportions.
E
(11.9) cont. (file opinia.pqs)
When we limit the study to people who have a specific opinion about the professor (i.e. those who
Copyright ©2010-2014 PQStat So ware − All rights reserved
142
11 COMPARISON - 2 GROUPS
only have a posi ve or a nega ve opinion) we will have 152 such students. The data for calcula ons
are: O11 = 50, O12 = 4, O21 = 44, O22 = 54. We know that 50+4
152 = 35.53% students expressed a
nega ve opinion before the exam. A er the exam the percentage was 50+44
152 = 61.84%.
Hypotheses:
H0 : a lack of a difference between the number of nega ve evalua ons of
the professor before and a er the exam,
H1 : there is a difference between the number of nega ve evalua ons of
the professor before and a er the exam.
The difference in propor ons dis nguished in the sample is 26.32%, and the confidence interval of 95%
for the sample (18.07%, 33.88%) does not contain 0.
On the basis of a Z test (p=0.0001), on the significance level of α=0.05 (similarly to the case of McNemar's test) we accept the alterna ve hypothesis. Therefore, the propor on of nega ve evalua ons
before the exam differs from the propor on of nega ve evalua ons a er the exam. Indeed, a er the
exam there are more nega ve evalua ons of the professor.
Copyright ©2010-2014 PQStat So ware − All rights reserved
143
12 COMPARISON - MORE THAN 2 GROUPS
12 COMPARISON - MORE THAN 2 GROUPS
Interval scale
Ordinal scale
Are
the data
normally
distributed?
Y
Friedman
ANOVA
Y
Are the data
dependent?
N
N
Are the data
dependent?
N
Y
ANOVA for
dependent
groups
Nominal scale
Are the data
dependent?
N
Kruskal
Wallis
ANOVA
(Kolmogorov-Smirnov
or Lilliefors test)
Y
N
Q-Cochran
ANOVA
mul dimen onal
χ2 test
Are
the variances
equal?
(Brown-Forsythe, Levene test)
Y
ANOVA for
independent
groups
Note
Note, that simultaneous comparison of more than two groups can NOT be replaced with mul ple performance the tests for the comparison of two groups. It is the result of the necessity of controlling the
I type error α. Choosing the α and using the k-fold selected test for the comparison of 2 groups, we
could make the assumed level much higher α. It is possible to avoid this error using the ANOVA test
(Analysis of Variance) and contrasts or the POST-HOC tests dedicated to them.
Copyright ©2010-2014 PQStat So ware − All rights reserved
144
12 COMPARISON - MORE THAN 2 GROUPS
12.1 PARAMETRIC TESTS
12.1.1 The ANOVA for independent groups
The one-way analysis of variance (ANOVA for independent groups) proposed by Ronald Fisher, is used
to verify the hypothesis determining the equality of means of an analysed variable in several (k ≥ 2)
popula ons.
Basic assump ons:
− measurement on an interval scale,
− normality of distribu on of an analysed feature in each popula on,
− an independent model,
− equality of variances of an analysed variable in all popula ons.
Hypotheses:
H0 : µ1 = µ2 = ... = µk ,
H1 : not all µj are equal (j = 1, 2, ..., k),
where:
µ1 ,µ2 ,...,µk − means of an analysed variable of each popula on.
The test sta s c is defined by:
F =
M SBG
,
M SW G
where:
SSBG
− mean square between-groups,
M SBG =
dfBG
SSW G
M SW G =
− mean square within-groups,
dfW G
(∑
)2
∑ nj
)2
k
k (∑nj
x
∑
ij
j=1
i=1
i=1 xij
SSBG =
−
− between-groups sum of squares,
nj
N
j=1
SSW G = SST − SSBG − within-groups sum of squares,
)2
(∑
∑nj
k
nj
k ∑
x
∑
ij
j=1
i=1
− total sum of squares,
SST =
x2ij −
N
j=1 i=1
dfBG = k − 1 − between-groups degrees of freedom,
dfW G = dfT − dfBG − within-groups degrees of freedom,
dfT = N − 1 − total degrees of freedom,
∑
N = kj=1 nj ,
nj − samples sizes for (j = 1, 2, ...k),
xij − values of a variable taken from a sample for (i = 1, 2, ...nj ), (j = 1, 2, ...k).
The F sta s c has the F Snedecor distribu on with dfBG and dfW G degrees of freedom.
The p value, designated on the basis of the test sta s c, is compared with the significance level α:
if p ≤ α =⇒
if p > α =⇒
reject H0 and accept H1 ,
there is no reason to reject H0 .
Copyright ©2010-2014 PQStat So ware − All rights reserved
145
12 COMPARISON - MORE THAN 2 GROUPS
12.1.2 The contrasts and the POST-HOC tests
An analysis of the variance enables you to get informa on only if there are any significant differences
among popula ons. It does not inform you which popula ons are different from each other. To gain
some more detailed knowledge about the differences in par cular parts of our complex structure, you
should use contrasts (if you do the earlier planned and usually only par cular comparisons), or the
procedures of mul ple comparisons POST-HOC tests (when having done the analysis of variance, we
look for differences, usually between all the pairs).
The number of all the possible simple comparisons is calculated using the following formula:
( )
k
k(k − 1)
=
c=
2
2
Hypotheses:
The first example - simple comparisons (comparison of 2 selected means):
H0 : µ1 = µ2 ,
H1 : µ1 ̸= µ2 .
The second example - complex comparisons (comparison of combina on of selected means):
H0 : µ1 =
H1 : µ1 ̸=
µ2 +µ3
2 ,
µ2 +µ3
2 .
If you want to define the selected hypothesis you should ascribe the contrast value cj , (j = 1, 2, ...k) to
each mean. The cj values are selected, so that their sums of compared sides are the opposite numbers,
and their values of means which are not analysed count to 0.
The first example: c1 = 1, c2 = −1, c3 = 0, ...ck = 0.
The second example: c1 = 2, c2 = −1, c3 = −1, c4 = 0,..., ck = 0.
How to choose the proper hypothesis:
(i) Comparing the differences between the selected means with the cri cal difference (CD) calculated using the proper POST-HOC test:
if the differences between means ≥ CD =⇒
if the differences between means < CD =⇒
reject H0 and accept H1 ,
there is no reason to reject H0 .
(ii) Comparing the p value, designated on the basis of the test sta s c of the proper POST-HOC test,
with the significance level α:
if p ≤ α =⇒
if p > α =⇒
reject H0 and accept H1 ,
there is no reason to reject H0 .
The LSD Fisher test
For simple and complex comparisons, equal-size groups as well as unequal-size groups.
(i) The value of cri cal difference is calculated by using the following formula:
v
u
k
u ∑
√
c2j
u
M SW G ,
CD = Fα,1,dfW G · t
nj
j=1
Copyright ©2010-2014 PQStat So ware − All rights reserved
146
12 COMPARISON - MORE THAN 2 GROUPS
where:
Fα,1,dfW G - is the cri cal value (sta s c) of the F Snedecor distribu on for a given
significance level α and degrees of freedom, adequately: 1 and dfW G .
(ii) The test sta s c is defined by:
∑k
j=1 cj xj
t = √(
∑k
c2j
j=1 nj
.
)
M SW G
The test sta s c has the t-Student distribu on with dfW G degrees of freedom.
The Scheffe test
For simple comparisons, equal-size groups as well as unequal-size groups.
(i) The value of a cri cal difference is calculated by using the following formula:
v
u
k
u
2
∑
√
c
u
j
CD = Fα,dfBG ,dfW G · t(k − 1)
M SW G ,
nj
j=1
where:
Fα,dfBG ,dfW G - is the cri cal value (sta s c) of the F Snedecor distribu on for a given
significance level α and dfBG and dfW G degrees of freedom.
(ii) The test sta s c is defined by:
(∑
k
j=1 cj xj
F =
(k − 1)
(
∑k
c2j
j=1 nj
)2
)
.
M SW G
The test sta s c has the F Snedecor distribu on with dfBG and dfW G degrees of freedom.
The Tukey test.
For simple comparisons, equal-size groups as well as unequal-size groups.
(i) The value of a cri cal difference is calculated by using the following formula:
√(
)
√
∑k c2j
2 · qα,dfW G ,k ·
j=1 nj M SW G
CD =
2
,
where:
qα,dfW G ,k - is the cri cal value (sta s c) of the studen zed range distribu on for a
given significance level α and dfW G and k degrees of freedom.
(ii) The test sta s c is defined by:
∑k
√
j=1 cj xj
.
q = 2 √(
)
∑k c2j
j=1 nj M SW G
The test sta s c has the studen zed range distribu on with dfW G and k degrees of freedom.
Copyright ©2010-2014 PQStat So ware − All rights reserved
147
12 COMPARISON - MORE THAN 2 GROUPS
Info.
The algorithm for calcula ng the p value and the sta s c of the studen zed range distribu on in PQStat
is based on the Lund works (1983)[54]. Other applica ons or web pages may calculate a li le bit different values than PQStat, because they may be based on less precised or more restric ve algorithms
(Copenhaver and Holland (1988), Gleason (1999)).
The se ngs window with the One-way ANOVA for independent groups can be opened in Statistics
menu→Parametric tests→ANOVA for independent groups or in Wizard.
E
12.1. (age ANOVA.pqs file)
There are 150 persons chosen randomly from the popula on of workers of 3 different transport companies. From each company there are 50 persons drawn to the sample. Before the experiment begins,
you should check if the average age of the workers of these companies is similar, because the next step
of the experiment depends on it. The age of each par cipant is wri en in years.
Age (company 1): 27, 33, 25, 32, 34, 38, 31, 34, 20, 30, 30, 27, 34, 32, 33, 25, 40, 35, 29, 20, 18, 28, 26,
22, 24, 24, 25, 28, 32, 32, 33, 32, 34, 27, 34, 27, 35, 28, 35, 34, 28, 29, 38, 26, 36, 31, 25, 35, 41, 37
Age (company 2): 38, 34, 33, 27, 36, 20, 37, 40, 27, 26, 40, 44, 36, 32, 26, 34, 27, 31, 36, 36, 25, 40, 27,
30, 36, 29, 32, 41, 49, 24, 36, 38, 18, 33, 30, 28, 27, 26, 42, 34, 24, 32, 36, 30, 37, 34, 33, 30, 44, 29
Age (company 3): 34, 36, 31, 37, 45, 39, 36, 34, 39, 27, 35, 33, 36, 28, 38, 25, 29, 26, 45, 28, 27, 32, 33,
30, 39, 40, 36, 33, 28, 32, 36, 39, 32, 39, 37, 35, 44, 34, 21, 42, 40, 32, 30, 23, 32, 34, 27, 39, 37, 35
Before you do this example, it is worth star ng with the similar task but related to 2 groups only (11.7).
Hypotheses:
H0 : the average age of the workers off all the analysed transport companies is the same,
H1 : at least 2 means are different.
Copyright ©2010-2014 PQStat So ware − All rights reserved
148
12 COMPARISON - MORE THAN 2 GROUPS
Comparing the p value = 0.005147 of the one-way analysis of variance with the significance level α =
0.05, you can draw the conclusion that the average ages of workers of these transport companies is not
the same. Based just on the ANOVA result, you do not know precisely which groups differ from others
in terms of age. To gain such knowledge, it must be used one of the POST-HOC tests, for example the
Tukey test. To do this, you should resume the analysis by clicking
and then, in the op ons window
for the test, you should select Tukey HSD and Add graph.
Copyright ©2010-2014 PQStat So ware − All rights reserved
149
12 COMPARISON - MORE THAN 2 GROUPS
The cri cal difference (CD) calculated for each pair of comparisons is the same (because the groups
sizes are equal) and counts to 2.730855. The comparison of the CD value with the value of the mean
difference indicates, that there are significant differences only between the mean age of the workers
from the first and the third transport company (only if these 2 groups are compared, the CD value is
less than the difference of the means). The same conclusion you draw, if you compare the p value of
POST-HOC test with the significance level α = 0.05. The workers of the first transport company are
about 3 years younger (on average) than the workers of the third transport company.
Note
Copyright ©2010-2014 PQStat So ware − All rights reserved
150
12 COMPARISON - MORE THAN 2 GROUPS
The assump ons for the single-factor analysis of variance are fulfilled:
• the age has the normal distribu on in each of the analysed transport company (the p value of the
Lilliefors test adequately counts to: p = 0.134516, p = 0.603209 and p = 0.607648),
• the Brown-Forsythe test indicates that there are no significant differences in the variances of the
transport companies workers' age (p = 0.430173).
12.1.3 The Brown-Forsythe test and the Levene test
Both tests: the Levene test (Levene, 1960 [50]) and the Brown-Forsythe test (Brown and Forsythe, 1974
[16]) are used to verify the hypothesis determining the equality of variance of an analysed variable in
several (k >= 2) popula ons.
Basic assump ons:
• measurement on an interval scale,
• normality of distribu on of an analysed feature in each popula on,
• an independent model.
Hypotheses:
H0 : σ12 = σ22 = ... = σk2 ,
H1 : not all σj2 are equal (j = 1, 2, ..., k),
where:
σ12 ,σ22 ,...,σk2 − variances of an analysed variable of each popula on.
The analysis is based on calcula ng the absolute devia on of measurement results from the mean (in
the Levene test) or from the median (in the Brown-Forsythe test), in each of the analysed groups. This
absolute devia on is the set of data which are under the same procedure performed to the analysis of
variance for independent groups. Hence, the test sta s c is defined by:
F =
M SBG
,
M SW G
The test sta s c has the F Snedecor distribu on with dfBG and dfW G degrees of freedom.
The p value, designated on the basis of the test sta s c, is compared with the significance level α:
if p ≤ α =⇒
if p > α =⇒
reject H0 and accept H1 ,
there is no reason to reject H0 .
Note
The Brown-Forsythe test is less sensi ve than the Levene test, in terms of an unfulfilled assump on
rela ng to distribu on normality.
The se ngs window with the Levene, Brown-Forsythe tests’ can be opened in Statistics menu→Parametric
tests→Levene, Brown-Forsythe.
Copyright ©2010-2014 PQStat So ware − All rights reserved
151
12 COMPARISON - MORE THAN 2 GROUPS
12.1.4 The ANOVA for dependent groups
The single-factor repeated-measures analysis of variance (ANOVA for dependent groups) is used when
the measurements of an analysed variable are made several mes (k ≥ 2) each me in different condi ons (but we need to assume that the variances of the differences between all the pairs of measurements are pre y close to each other).
This test is used to verify the hypothesis determining the equality of means of an analysed variable in
several (k ≥ 2) popula ons.
Basic assump ons:
− measurement on an interval scale,
− the normal distribu on for all variables which are the differences of measurement pairs (or the
normal distribu on for an analysed variable in each measurement),
− a dependent model.
Hypotheses:
H0 : µ1 = µ2 = ... = µk ,
H1 : not all µj are equal (j = 1, 2, ..., k),
where:
µ1 ,µ2 ,...,µk − means for an analysed features, in the following measurements from the
examined popula on.
The test sta s c is defined by:
F =
M SBC
M Sres
Copyright ©2010-2014 PQStat So ware − All rights reserved
152
12 COMPARISON - MORE THAN 2 GROUPS
where:
SSBC
− mean square between-condi ons,
M SBC =
dfBC
SSres
M Sres =
− mean square residual,
dfres
)2
( ∑
) (∑k ∑n
k
2
n
x
∑
j=1
i=1 ij
( i=1 xij )
SSBC =
−
− between-condi ons sum of squares,
n
N
j=1
SSres = SST − SSBS − SSBC − residual sum of squares,
)2
(∑
∑n
k
k
n
x
∑∑
j=1
i=1 ij
x2ij −
SST =
− total sum of squares,
N
j=1 i=1
SSBS =
n
∑
(
i=1
)2 (∑
)2
∑n
k
x
ij
j=1 xij
j=1
i=1
− between-subjects sum of squares,
−
k
N
∑k
dfBC = k − 1 − between-condi ons degrees of freedom,
dfres = dfT − dfBC − dfBS − residual degrees of freedom,
dfT = N − 1 − total degrees of freedom,
dfBS = n − 1 − between-subjects degrees of freedom,
N = nk,
n − sample size,
xij − values of the variable from i subjects (i = 1, 2, ...n) in j condi ons (j = 1, 2, ...k).
The test sta s c has the F Snedecor distribu on with dfBC and dfres degrees of freedom.
The p value, designated on the basis of the test sta s c, is compared with the significance level α:
if p ≤ α =⇒
if p > α =⇒
reject H0 and accept H1 ,
there is no reason to reject H0 .
The POST-HOC tests
Introduc on to the contrasts and the POST-HOC tests was performed in the 12.1.2 unit, which relates
to the one-way analysis of variance.
The LSD Fisher test
For simple and complex comparisons (frequency in par cular measurements is always the same).
Hypotheses:
Example - simple comparisons (comparison of 2 selected means):
H0 : µj = µj+1 ,
H1 : µj ̸= µj+1 .
(i) The value of the cri cal difference is calculated by using the following formula:
v
u
k
u ∑
√
c2j
u
M Sres ,
CD = Fα,1,dfres · t
n
j=1
Copyright ©2010-2014 PQStat So ware − All rights reserved
153
12 COMPARISON - MORE THAN 2 GROUPS
where:
Fα,1,dfres - is the cri cal value (sta s c) of the F Snedecor distribu on for a given significance level α and degrees of freedom, adequately: 1 and dfres .
(ii) The test sta s c is defined by:
∑k
j=1 cj xj
t = √(
∑k
c2j
j=1 n
.
)
M Sres
The test sta s c has the t-Student distribu on with dfres degrees of freedom.
The Scheffe test
For simple comparisons (frequency in par cular measurements is always the same).
(i) The value of the cri cal difference is calculated by using the following formula:
v
u
k
u
2
∑
√
c
u
j
CD = Fα,dfBC ,dfres · t(k − 1)
M Sres ,
n
j=1
where:
Fα,dfBC ,dfres - is the cri cal value (sta s c) of the F Snedecor distribu on for a given
significance level α and dfBC and dfres degrees of freedom.
(ii) The test sta s c is defined by:
(∑
k
j=1 cj xj
F =
(k − 1)
(
∑k
c2j
j=1 n
)2
)
.
M Sres
The test sta s c has the F Snedecor distribu on with dfBC and dfref degrees of freedom.
The Tukey test.
For simple comparisons (frequency in par cular measurements is always the same).
(i) The value of the cri cal difference is calculated by using the following formula:
√(
)
√
∑k c2j
2 · qα,dfW G ,k ·
M Sres
j=1 n
CD =
2
,
where:
qα,dfres ,k - is the cri cal value (sta s c) of the studen zed range distribu on for a given
significance level α and dfres and k degrees of freedom.
(ii) The test sta s c is defined by:
∑k
√
j=1 cj xj
q = 2 √(
.
)
∑k c2j
M Sres
j=1 n
The test sta s c has the studen zed range distribu on with dfres and k degrees of freedom.
Copyright ©2010-2014 PQStat So ware − All rights reserved
154
12 COMPARISON - MORE THAN 2 GROUPS
Info.
The algorithm for calcula ng the p value and sta s c of the studen zed range distribu on in PQStat
is based on the Lund works (1983)[54]. Other applica ons or web pages may calculate a li le bit different values than PQStat, because they may be based on less precised or more restric ve algorithms
(Copenhaver and Holland (1988), Gleason (1999)).
The se ngs window with the Single-factor repeated-measures ANOVA can be opened in Statistics
menu→Parametric tests→ANOVA for dependent groups or in Wizard.
Copyright ©2010-2014 PQStat So ware − All rights reserved
155
12 COMPARISON - MORE THAN 2 GROUPS
12.2 NONPARAMETRIC TESTS
12.2.1 The Kruskal-Wallis ANOVA
The Kruskal-Wallis one-way analysis of variance by ranks (Kruskal 1952 [46]; Kruskal and Wallis 1952
[47] ) is an extension of the U-Mann-Whitney test on more than two popula ons. This test is used to
verify the hypothesis determing insignificant differences between medians of the analysed variable in
(k ≥ 2) popula ons (but you need to assume, that the variable distribu ons are similar).
Basic assump ons:
− measurement on an ordinal scale or on an interval scale,
− an independent model.
Hypotheses:
H0 : θ1 = θ2 = ... = θk ,
H1 : not all θj are equal (j = 1, 2, ..., k),
where:
θ1 , θ2 , ...θk medians of the analysed variable of each popula on.
The test sta s c is defined by:
( (∑n
)2 )
k
j
∑
1
12
i=1 Rij
H=
− 3(N + 1) ,
C N (N + 1)
nj
j=1
where:
∑
N = kj=1 nj ,
nj − samples sizes (j = 1, 2, ...k),
Rij − ranks ascribed to the values of a variable for (i = 1, 2, ...nj ), (j = 1, 2, ...k),
∑ 3
(t − t)
C =1−
− correc on for es,
N3 − N
t − number of cases included in a e.
The formula for the test sta s c H includes the correc on for es C. This correc on is used, when es
occur (if there are no es, the correc on is not calculated, because of C = 1).
The H sta s c asympto cally (for large sample sizes) has the χ2 distribu on with the number of degrees
of freedom calculated using the formula: df = (k − 1).
The p value, designated on the basis of the test sta s c, is compared with the significance level α:
if p ≤ α =⇒
if p > α =⇒
reject H0 and accept H1 ,
there is no reason to reject H0 .
The POST-HOC tests
Introduc on to the contrasts and the POST-HOC tests was performed in the 12.1.2 unit, which relates
to the one-way analysis of variance.
The Dunn test
For simple comparisons, equal-size groups as well as unequal-size groups.
Hypotheses:
Example - simple comparisons (comparison of 2 selected medians):
Copyright ©2010-2014 PQStat So ware − All rights reserved
156
12 COMPARISON - MORE THAN 2 GROUPS
H0 : θj = θj+1 ,
H1 : θj ̸= θj+1 .
(i) The value of cri cal difference is calculated by using the following formula:
v
u
k
u
2
∑
c
u N (N + 1)
j
CD = Z αc t
,
12
nj
j=1
where:
Z αc - is the cri cal value (sta s c) of the normal distribu on for a given significance
level α corrected on the number of possible simple comparisons c.
(ii) The test sta s c is defined by:
∑k
Z=√
j=1 cj Rj
N (N +1)
12
(
∑k
c2j
j=1 nj
),
where:
Rj − mean of the ranks of the j-th group, for (j = 1, 2, ...k),
The test sta s c asympto cally (for large sample sizes) has the normal distribu on, and the p
value is corrected on the number of possible simple comparisons c.
The se ngs window with the Kruskal-Wallis ANOVA can be opened in Statistics menu→NonParametric
tests (ordered categories)→Kruskal-Wallis ANOVA or in Wizard.
Copyright ©2010-2014 PQStat So ware − All rights reserved
157
12 COMPARISON - MORE THAN 2 GROUPS
12.2.2 The Friedman ANOVA
The Friedman repeated measures analysis of variance by ranks − the Friedman ANOVA - was described
by Friedman (1937)[33]. This test is used when the measurements of an analysed variable are made
several mes (k ≥ 2) each me in different condi ons. It is also used when we have rankings coming
from different sources (form different judges) and concerning a few (k ≥ 2) objects, but we want to
assess the grade of the rankings agreement.
Basic assump ons:
− measurement on an ordinal scale or on an interval scale,
− a dependent model.
Hypotheses:
H0 : θ1 = θ2 = ... = θk ,
H1 : not all θj are equal (j = 1, 2, ..., k),
where:
θ1 , θ2 , ...θk medians for an analysed features, in the following measurements from the examined popula on.
The test sta s c is defined by:
)2
( n
k
∑
∑
12
1
Rij − 3n(k + 1) ,
χ2r =
C nk(k + 1)
j=1
i=1
where:
n − sample size,
Rij − ranks ascribed to the following measurements (j = 1, 2, ...k), separately for the
analysed objects (i = 1, 2, ...n),
∑ 3
(t − t)
− correc on for es,
C =1−
n(k 3 − k)
t − number of cases included in a e.
The formula for the test sta s c χ2r includes the correc on for es C. This correc on is used, when es
occur (if there are no es, the correc on is not calculated, because of C = 1).
The χ2r sta s c asympto cally (for large sample size) has the χ2 distribu on with the number of degrees
of freedom calculated using the formula: df = (k − 1).
The p value, designated on the basis of the test sta s c, is compared with the significance level α:
if p ≤ α =⇒
if p > α =⇒
reject H0 and accept H1 ,
there is no reason to reject H0 .
The POST-HOC tests
Introduc on to the contrasts and the POST-HOC tests was performed in the 12.1.2 unit, which relates
to the one-way analysis of variance.
The Dunn test
For simple comparisons (frequency in par cular measurements is always the same).
Hypotheses:
Example - simple comparisons (comparison of 2 selected medians):
Copyright ©2010-2014 PQStat So ware − All rights reserved
158
12 COMPARISON - MORE THAN 2 GROUPS
H0 : θj = θj+1 ,
H1 : θj ̸= θj+1 .
(i) The value of cri cal difference is calculated by using the following formula:
√
k(k + 1)
N IR = Z αc
,
6n
where:
Z αc - is the cri cal value (sta s c) of the normal distribu on for a given significance
level α corrected on the number of possible simple comparisons c.
(ii) The test sta s c is defined by:
∑k
j=1 cj Rj
Z= √
,
k(k+1)
6n
where:
Rj − mean of the ranks of the j-th measurement, for (j = 1, 2, ...k),
The test sta s c asympto cally (for large sample size) has normal distribu on, and the p value is
corrected on the number of possible simple comparisons c.
The se ngs window with the Friedman ANOVA can be opened in Statistics menu→ NonParametric
tests (ordered categories) →Friedman ANOVA or in Wizard.
E
12.2. (chocolate bar.pqs file)
Quarterly sale of some chocolate bar was measured in 14 randomly chosen supermarkets. The study
was started in January and finished in December. During the second quarter, the billboard campaign
was in full swing. Let's check if the campaign had an influence on the adver sed chocolate bar sale.
Copyright ©2010-2014 PQStat So ware − All rights reserved
159
12 COMPARISON - MORE THAN 2 GROUPS
Shop
SK1
SK2
SK3
SK4
SK5
SK6
SK7
SK8
SK9
SK10
SK11
SK12
SK13
SK14
Quarter I
3415
1593
1976
1526
1538
983
1050
1861
1714
1320
1276
1263
1271
1436
Quarter II
4556
1937
2056
1594
1634
1086
1209
2087
2415
1621
1377
1279
1417
1310
Quarter III
5772
2242
2240
1644
1866
1135
1245
2054
2361
1624
1522
1350
1583
1357
Quarter IV
5432
2794
2085
1705
1769
1177
977
2018
2424
1551
1412
1490
1513
1468
Hypotheses:
H0 : there is a lack of significant difference in sale values, in the compared
quarters, in the popula on represented by the whole sample,
H1 : the difference in sale values, between at least 2 quarters, is significant,
in the popula on represented by the whole sample.
Comparing the p = 0, 000026 with the significance level α = 0.05, we state that the chocolate bar sale
is not the same in each quarter. The POST-HOC analysis indicates the difference in the sale in quarters
I/III and I/IV.
Copyright ©2010-2014 PQStat So ware − All rights reserved
160
12 COMPARISON - MORE THAN 2 GROUPS
12.2.3 The Chi-square test for mul dimensional con ngency tables
The χ2 test for mul dimensional con ngency tables is an extension to the χ2 test for (R × C) tables
for more than two features.
Basic assump ons:
− measurement on a nominal scale (alterna vely: an ordinal scale or an interval scale),
Copyright ©2010-2014 PQStat So ware − All rights reserved
161
12 COMPARISON - MORE THAN 2 GROUPS
− an independent model,
− large expected frequencies (according to the Cochran interpreta on (1952)[20], none of these
expected frequencies can be < 1 and no more than 20% of the expected frequencies can be
< 5).
Hypotheses:
H0 : Oij... = Eij... for all categories,
H1 : Oij... ̸= Eij... for at least one category,
where:
Oij... and Eij... − observed frequencies in a con ngency table and the corresponding expected frequencies.
The test sta s c is defined by:
χ2 =
r ∑
c ∑
∑
i=1 j=1
...
∑ (Oij... − Eij... )2
Eij...
.
This sta s c asympto cally (for large expected frequencies) has the χ2 distribu on with a number of
degrees of freedom calculated using the formula: df = (r − l)(c − 1)(l − 1) + (r − l)(c − 1) + (r −
1)(l − 1) + (c − 1)(l − 1) - for 3-dimensional tables.
The p value, designated on the basis of the test sta s c, is compared with the significance level α:
if p ≤ α =⇒
if p > α =⇒
reject H0 and accept H1 ,
there is no reason to reject H0 .
The se ngs window with the Chi-square (multidimensional) test can be opened in Statistics menu →
NonParametric tests (unordered categories)→Chi-square (multidimensional) or in Wizard.
Copyright ©2010-2014 PQStat So ware − All rights reserved
162
12 COMPARISON - MORE THAN 2 GROUPS
Note
This test can be calculated only on the basis of raw data.
12.2.4 The Q-Cochran ANOVA
The Q-Cochran analysis of variance, based on the Q-Cochran test, is described by Cochran (1950)[19].
This test is an extended McNemar test for k ≥ 2 dependent groups. It is used in hypothesis verifica on
about symmetry between several measurements X (1) , X (2) , ..., X (k) for the X feature. The analysed
feature can have only 2 values - for the analysis, there are ascribed to them the numbers: 1 and 0.
Basic assump ons:
− measurement on a nominal scale (dichotomous variables− it means the variables of two categories),
− a dependent model.
Hypotheses:
H0 : all the "incompa ble" observed frequencies are equal,
H1 : not all the "incompa ble" observed frequencies are equal,
where:
"incompa ble" observed frequencies − the observed frequencies calculated when the
value of the analysed feature is different in several measurements.
The test sta s c is defined by:
(
)
(k − 1) kC − T 2
Q=
kT − R
where:
∑ ∑
T = ni=1 kj=1 xij ,
)2
∑ (∑k
R = ni=1
,
x
ij
j=1
∑k
∑n
2
C = j=1 ( i=1 xij ) ,
xij − the value of j-th measurement for i-th object (so 0 or 1).
This sta s c asympto cally (for large sample size) has the χ2 distribu on with a number of degrees of
freedom calculated using the formula: df = k − 1.
The p value, designated on the basis of the test sta s c, is compared with the significance level α:
if p ≤ α =⇒
if p > α =⇒
reject H0 and accept H1 ,
there is no reason to reject H0 .
The POST-HOC tests
Introduc on to the contrasts and the POST-HOC tests was performed in the 12.1.2 unit, which relates
to the one-way analysis of variance.
The Dunn test
For simple comparisons (frequency in par cular measurements is always the same).
Hypotheses:
Example - simple comparisons (for the difference in propor on in a one chosen pair of measurements):
Copyright ©2010-2014 PQStat So ware − All rights reserved
163
12 COMPARISON - MORE THAN 2 GROUPS
H0 : the chosen "incompa ble" observed frequencies are equal,
H1 : the chosen "incompa ble" observed frequencies are different.
(i) The value of cri cal difference is calculated by using the following formula:
√
kT − R
N IR = Z αc 2 2
,
n k(k − 1)
where:
Z αc - is the cri cal value (sta s c) of the normal distribu on for a given significance
level α corrected on the number of possible simple comparisons c.
(ii) The test sta s c is defined by:
∑k
Z=√
j=1 cj pj
−R
2 n2kT
k(k−1)
,
where:
pj − the propor on j-th measurement (j = 1, 2, ...k),
The test sta s c asympto cally (for large sample size) has the normal distribu on, and the p value
is corrected on the number of possible simple comparisons c.
The se ngs window with the Cochran Q ANOVA can be opened in Statistics menu→ NonParametric
tests (unordered categories)→Cochran Q ANOVA or in Wizard.
Note
This test can be calculated only on the basis of raw data.
Copyright ©2010-2014 PQStat So ware − All rights reserved
164
12 COMPARISON - MORE THAN 2 GROUPS
E
12.3. (test.pqs file)
We want to compare the difficulty of 3 test ques ons. To do this, we select a sample of 20 people from
the analysed popula on. Every person from the sample answers 3 test ques ons. Next, we check the
correctness of answers (an answer can be correct or wrong). In the table, there are following scores:
No.
1
2
3
4
5
6
7
8
9
10
11
12
13
14
15
16
17
18
19
20
ques on 1 answer
correct
wrong
correct
wrong
wrong
wrong
wrong
wrong
correct
wrong
wrong
wrong
wrong
wrong
correct
wrong
wrong
wrong
wrong
correct
ques on 2 answer
correct
correct
correct
correct
correct
correct
wrong
correct
correct
correct
wrong
wrong
correct
wrong
wrong
wrong
correct
correct
wrong
correct
ques on 3 answer
wrong
wrong
correct
wrong
wrong
correct
wrong
wrong
wrong
wrong
wrong
correct
wrong
correct
wrong
wrong
wrong
wrong
wrong
wrong
Hypotheses:
H0 : The individual ques ons received the same number of correct answers,
in the analysed popula on,
H1 : There are different numbers of correct and wrong answers in individual test ques ons,
in the analysed popula on.
Comparing the p value p = 0.007699 with the significance level α = 0.05 we conclude that individual
test ques ons have different difficulty levels. We resume the analysis to perform POST-HOC test by
clicking , and in the test op on window, we select POST-HOC Dunn.
Copyright ©2010-2014 PQStat So ware − All rights reserved
165
12 COMPARISON - MORE THAN 2 GROUPS
The carried out POST-HOC analysis indicates that there are differences between the 2-nd and 1-st queson and between ques ons 2-nd and 3-th. The difference is because the second ques on is easier than
the first and the third ones (the number of correct answers the first ques on is higher).
Copyright ©2010-2014 PQStat So ware − All rights reserved
166
13 STRATIFIED ANALYSIS
13 STRATIFIED ANALYSIS
13.1 THE MANTEL - HAENSZEL METHOD FOR SEVERAL 2x2 TABLES
The Mantel-Haenszel method for 2 × 2 tables proposed by Mantel and Haenszel (1959)[56] then it was
extended by Mantel (1963)[57]. A wider review the development of these methods was carried out i.a.
by Newman (2001)[66].
This method can be used in analysis 2 × 2 tables, that occur in several (w >= 2) stratas constructed
by confounding variable. For the next stratas (s = 1, ..., w) the 2 × 2 con ngency tables for observed
frequencies are created:
Observed frequencies
(
)
s-th strata
Risk factor
(s)
Oij
exposed
unexposed
Total
Analysed phenomenon (illness)
occurs (case)
not occurs (control)
Total
(s)
O11
(s)
O21
(s)
(s)
O11 + O21
(s)
O12
(s)
O22
(s)
(s)
O12 + O22
(s)
(s)
O11 + O12
(s)
(s)
O21 + O22
(s)
(s)
(s)
O11 + O12 + O21
n(s) =
(s)
+ O22
The se ngs window with the Mantel−Haenszel OR/RR can be opened in Statistics menu →Stratified
analysis→Mantel−Haenszel OR/RR.
13.1.1 The Mantel-Haenszel odds ra o
If all tables (created by individual stratas) are homogeneous (the χ2 test of homogeneity for the OR
can check this condi on), then, on the basis of these tables, the pooled odds ra o with the confidence
interval can be designated. Such odds ra o, is a weighted mean for an odds ra o designated for the
individual stratas. The usage of the weighted method, proposed by Mantel and Haenszel allows to
include the contribu on of the strata weights. Each strata has an influence on the pooled odds ra o
(the greater size of the strata, the greater weight and the greater influence on the pooled odds ra o).
Copyright ©2010-2014 PQStat So ware − All rights reserved
167
13 STRATIFIED ANALYSIS
Weights for individual stratas are designated according to the following formula:
(s)
g
(s)
(s)
O ·O
= 21 (s) 12 ,
n
and the Mantel-Haenszel odds ra o:
ORM H =
R
,
S
where:
w
(s)
(s)
∑
O11 · O22
R=
,
(s)
n
s=1
S=
w
∑
g (s) .
s=1
The confidence interval for logORM H is designated on the basis of the standard error (RGB − RobinsBreslow-Greenland[70][71]) calculated according to the following formula:
√
T
U +Y
W
SEM H =
+
+
,
2
2R
2RS
2S 2
where:
w
∑
T =
T (s) ,
s=1
U=
w
∑
U (s) ,
s=1
Y =
w
∑
Y (s) ,
s=1
W =
w
∑
W (s) ,
s=1
(
)
(s)
(s)
(s)
(s)
O11 · O22 · O11 + O22
,
T (s) =
)2
(
n(s)
(
)
(s)
(s)
(s)
(s)
O21 · O12 · O11 + O22
U (s) =
,
)2
(
n(s)
(
)
(s)
(s)
(s)
(s)
O11 · O22 · O21 + O12
Y (s) =
,
)2
(
n(s)
(
)
(s)
(s)
(s)
(s)
O21 · O12 · O21 + O12
W (s) =
.
(
)2
n(s)
The Mantel-Haenszel χ2 test for the ORM H
The Mantel-Haenszel Chi-square test for the ORM H is used in the hypothesis verifica on about
the significance of designated odds ra o (ORM H ). It should be calculated for large frequencies,
i.e. when both condi ons of the so-called "rule 5" are sa sfied:
∑
(s)
(s)
(s)
(s)
(s)
• min(O11 + O12 , O11 + O21 ) − w
s=1 E11 ≥ 5 for all the stratas s = 1, 2, ..., w,
(s)
(s)
• max(0, O11 − O22 ) ≥ 5 for all the stratas s = 1, 2, ..., w.
Hypotheses:
H0 : ORM H = 1,
H1 : ORM H ̸= 1.
The test sta s c is defined by:
(∑
χ2M H =
(s)
w
s=1 O11
−
V
∑w
)
(s) 2
s=1 E11
,
Copyright ©2010-2014 PQStat So ware − All rights reserved
168
13 STRATIFIED ANALYSIS
where: (
(s)
(s)
(s)
O11 + O21
)(
(s)
(s)
)
O11 + O12
are the expected frequencies in the first conn(s)
ngency table cell, for the individual stratas s = 1, 2, ..., w,
w
∑
V =
V (s) ,
E11 =
s=1
V (s)
(
)(
)(
)(
)
(s)
(s)
(s)
(s)
(s)
(s)
(s)
(s)
O11 + O12
O21 + O22
O11 + O21
O12 + O22
=
.
(
)2 (
)
n(s)
n(s) − 1
This sta s c asympto cally (for large frequencies) has the χ2 distribu on with 1 degree of freedom.
The p value, designated on the basis of the test sta s c, is compared with the significance level
α:
if p ≤ α =⇒
if p > α =⇒
reject H0 and accept H1 ,
there is no reason to reject H0 .
The χ2 test of homogeneity for the OR
The Chi-square test of homogeneity for the OR is used in the hypothesis verifica on that the
variable, crea ng stratas, is the modifying effect, i.e. it influences on the designated odds ra o
in the manner that, the odds ra os are significant different for individual stratas.
Hypotheses:
H0 : ORM H = OR(s) , for all the stratas s = 1, 2, ..., w,
H1 : ORM H ̸= OR(s) , for at least one strata.
The test sta s c (Breslow-Day (1980)[12], Tarone (1985)[13][77]) is defined by:
(
)2
)2 (∑
∑w
(s)
(s)
w
(s)
(s)
w
O
−
E
O
−
E
∑
11
s=1 11
s=1
∑w
χ2 =
−
(s)
(s)
V ar
s=1 V ar
s=1
where:
E (s) is solu on( to the quadra c equa
) on:
(s)
(s)
(s)
(s)
E
O22 − O11 + E
(
)(
) = ORM H ,
(s)
(s)
(s)
(s)
O11 + O21 − E (s) O11 + O12 − E (s)
(
(s)
V ar = E1(s) + (s) 1(s) (s) + (s) 1(s) (s) + (s)
O22 −O11 +E
O11 +O21 −E
O11
)−1
1
(s)
+O12 −E (s)
.
This sta s c asympto cally (for large frequencies) has the χ2 distribu on with the number of
degrees of freedom calculated using the formula: df = w − 1.
The p value, designated on the basis of the test sta s c, is compared with the significance level
α:
if p ≤ α =⇒
if p > α =⇒
reject H0 and accept H1 ,
there is no reason to reject H0 .
Copyright ©2010-2014 PQStat So ware − All rights reserved
169
13 STRATIFIED ANALYSIS
E
13.1. (leptospirosis.pqs file)
The following table presents hypothe cal poll results, conducted among inhabitants of a city and village (the village is treated as a risk factor) in West India. The poll aim was to detect risk factors of
leptospirosis[9]. The occurrence of leptospirosis an bodies is a indirect evidence about infec on.
Observed frequencies
Oij
rural
place of residence urban
leptospirosis an bodies
occur
not occur
60
140
60
140
The odds of the occurrence of leptospirosis an bodies, among inhabitants of the city and the village,
is the same (OR=1). Let's include gender in the analysis and check what odds will be then. The sample
has to be divided into 2 stratas, because of gender (they are marked in a file as a saved selec on):
Observed frequencies
for men
rural
place of residence urban
leptospirosis an bodies
occur
not occur
36
14
50
50
Observed frequencies
for women
rural
place of residence urban
leptospirosis an bodies
occur
not occur
24
126
10
90
Gender is associated with both factors (the occurrence of leptospirosis anibodies and the residence in
West India). This is a significant factor. Its ignorance can lead to errors in results.
Copyright ©2010-2014 PQStat So ware − All rights reserved
170
13 STRATIFIED ANALYSIS
Copyright ©2010-2014 PQStat So ware − All rights reserved
171
13 STRATIFIED ANALYSIS
The odds of the occurrence of leptospirosis an bodies is larger among village inhabitants, both among
women (OR[95%CI]=2.57[1.24, 5.34]) and men (OR[95%CI]=1.71[0.78, 3.76]). The tables are homogeneous (p=0.465049). Thus, we can use the calculated odds ra o, which is mutual for both tables
(ORM H [95%CI]=2.13[1.24, 3.65]). Finally, the obtained result indicates that the odds of the occurrence of leptospirosis an bodies is significantly greater among village inhabitants (p=0.005169).
13.1.2 The Mantel-Haenszel rela ve risk
If all tables (created by individual stratas) are homogeneous (the χ2 test of homogeneity for the RR),
can check this condi on), then, on the basis of these tables, the pooled rela ve risk with the confidence
interval can be designated. Such rela ve risk is a weighted mean for a rela ve risk designated for the
individual stratas. The usage of the weighted method, proposed by Mantel and Haenszel allows to
include the contribu on of the strata weights. Each strata of the input has an influence on the pooled
rela ve risk construc on (the greater size of the strata, the greater weight and the greater influence on
the pooled rela ve risk).
Weights for individual stratas are designated according to the following formula:
(
)
(s)
(s)
(s)
O21 O11 + O12
g (s) =
,
n(s)
and the Mantel-Haenszel rela ve risk:
RRM H =
R
,
S
where:
(
)
w O (s) O (s) + O (s)
∑
11
21
22
,
R=
(s)
n
s=1
S=
w
∑
g (s) .
s=1
The confidence interval for logRRM H is designated on the basis of the standard error calculated according to the following formula:
√
V
SEM H =
,
RS
where:
w
∑
V =
V (s) ,
s=1
V (s)
(
)(
)(
) (
)
(s)
(s)
(s)
(s)
(s)
(s)
(s)
(s)
O11 + O12
O21 + O22
O11 + O21 − O11 ∗ O21 ∗ n(s)
=
.
(
)2
n(s)
The Manel-Hanszel χ2 test for the RRM H
The Mantel-Haenszel Chi-square test for the RRM H is used in the hypothesis verifica on about
the significance of designated rela ve risk (RRM H ). It should be calculated for large frequencies,
in a con ngency table.
Hypotheses:
H0 : RRM H = 1,
H1 : RRM H ̸= 1.
Copyright ©2010-2014 PQStat So ware − All rights reserved
172
13 STRATIFIED ANALYSIS
The test sta s c is defined by:
(∑
χ2M H =
where:
(
(s)
(s)
O11 +O21
(s)
E11
)(
(s)
(s)
(s)
w
s=1 O11
−
∑w
)
(s) 2
s=1 E11
V
,
)
O11 +O12
=
are the expected frequencies in the first con ngency
n(s)
table cell, for individual stratas s = 1, 2, ..., w.
This sta s c asympto cally (for large frequencies) has the χ2 distribu on with 1 degree of freedom.
The p value, designated on the basis of the test sta s c, is compared with the significance level
α:
if p ≤ α =⇒
if p > α =⇒
reject H0 and accept H1 ,
there is no reason to reject H0 .
The χ2 test of homogeneity for the RR
The Chi-square test of homogeneity for the RR is used in the hypothesis verifica on that the
variable crea ng stratas, is the modifying effect, i.e. it influences on the designated rela ve risk
in the manner that, the rela ve risks are significant different for individual stratas.
Hypotheses:
H0 : RRM H = RR(s) , for all the stratas s = 1, 2, ..., w,
H1 : RRM H ̸= RR(s) , for at least one strata.
The test sta s c, using weighted least squares method, is defined by:
χ2 =
w
∑
(
)2
v (s) ln(RR(s) ) − ln(RRM H )
s=1
where:(
v (s)
(s)
(s)
=
O12
(
)
(s)
(s)
(s)
O11 O11 +O12
+
O22
(
)
(s)
(s)
(s)
O21 O21 +O22
)−1
.
This sta s c asympto cally (for large frequencies) has the χ2 distribu on with the number of
degrees of freedom calculated using the formula: df = w − 1.
The p value, designated on the basis of the test sta s c, is compared with the significance level
α:
if p ≤ α =⇒
if p > α =⇒
reject H0 and accept H1 ,
there is no reason to reject H0 .
Copyright ©2010-2014 PQStat So ware − All rights reserved
173
14
CORRELATION
14 CORRELATION
Interval scale
Are
the data
normally
distributed?
Ordinal scale
tests for
monotonic
correla on
coefficients
rs or τ
N
Nominal scale
χ2 test and dedicated to them
C, ϕ, V con ngency coefficients
or test for Q con ngency coefficient
Y
(Kolmogorov-Smirnov
or Lilliefors test)
tests for
linear
correla on
coefficient rp
and linear
regression
coefficient β
The Correla on coefficients are one of the measures of descrip ve sta s cs which represent the level
of correla on (dependence) between 2 or more features (variables). The choice of a par cular coefficient depends mainly on the scale, on which the measurements were done. Calcula on of coefficients
is one of the first steps of the correla on analysis. Then the sta s c significance of the gained coefficients may be checked using adequate tests.
Note
Note, that the dependence between variables does not always show the cause-and-effect rela onship.
Copyright ©2010-2014 PQStat So ware − All rights reserved
174
14
CORRELATION
14.1 PARAMETRIC TESTS
14.1.1 THE LINEAR CORRELATION COEFFICIENTS
The Pearson product-moment correla on coefficient rp called also the Pearson's linear correla on coefficient (Pearson (1896,1900)) is used to decribe the strength of linear rela ons between 2 features.
It may be calculated on an interval scale only if the distribu on of the analyed features is a normal one.
∑n
(xi − x)(yi − y)
√∑n
,
rp = √∑n i=1
2
2
i=1 (xi − x)
i=1 (yi − y)
where:
xi , yi - the following values of the feature X and Y ,
x, y - means values of features: X and Y ,
n - sample size.
Note
Rp − the Pearson product-moment correla on coefficient in a popula on;
rp − the Pearson product-moment correla on coefficient in a sample.
The value of rp ∈< −1; 1 >, and it should be interpreted the following way:
• rp ≈ 1 means a strong posi ve linear correla on − measurement points are closed to a straight
line and when the independent variable increases, the dependent variable increases too;
• rp ≈ −1 means a strong nega ve linear correla on − measurement points are closed to a
straight line, but when the independent variable increases, the dependent variable decreases;
• if the correla on coefficient is equal to the value or very closed to zero, there is no linear dependence between the analysed features (but there might exist another rela on - a not linear
one).
Graph 14.1. Graphic interpreta on of rp .
y
*
*
*
*
y
*
y
*
** *
*
*
*
x
rp ≈ 0
*
*
*
x
rp ≈ 1
*
*
*
x
rp ≈ −1
If one out of the 2 analysed features is constant (it does not ma er if the other feature is changed), the
features are not dependent from each other. In that situa on rp can not be calculated.
Note
You are not allowed to calculate the correla on coefficient if: there are outliers in a sample (they may
make that the value and the sign of the coefficient would be completly wrong), if the sample is clearly
heterogeneous, or if the analysed rela on takes obviously the other shape than linear.
The coefficient of determina on: rp2 − reflects the percentage of a dependent variable a variability
which is explained by variability of an independent variable.
Copyright ©2010-2014 PQStat So ware − All rights reserved
175
14
CORRELATION
A created model shows a linear rela onship:
y = βx + α.
β and α coefficients of linear regression equa on can be calculated using formulas:
∑n
(x − x)(yi − y)
∑n i
β = i=1
,
α = y − βx.
2
i=1 (xi − x)
14.1.2 The test of significance for the Pearson product-moment correla on coefficient
The test of significance for Pearson product-moment correla on coefficient is used to verify the hypothesis determining the lack of linear correla on between an analysed features of a popula on and
it is based on the Pearson's linear correla on coefficient calculated for the sample. The closer to 0 the
value of rp is, the weaker dependence joins the analysed features.
Basic assump ons:
− measurement on the interval scale,
− normality of distribu on of an analysed features in a popula on.
Hypotheses:
H0 : Rp = 0,
H1 : Rp ̸= 0.
The test sta s c is defined by:
t=
√
where SE =
rp
,
SE
1 − rp2
.
n−2
The value of the test sta s c can not be calculated when rp = 1 or rp = −1 or when n < 3.
The test sta s c has the t-Student distribu on with n − 2 degrees of freedom.
The p value, designated on the basis of the test sta s c, is compared with the significance level α:
if p ≤ α =⇒
if p > α =⇒
reject H0 and accept H1 ,
there is no reason to reject H0 .
14.1.3 The test of significance for the coefficient of linear regression equa on
This test is used to verify the hypothesis determining the lack of a linear dependence between an analysed features and is based on the slope coefficient (also called an effect), calculated for the sample.
The closer to 0 the value of β is, the weaker dependence presents the fi ed line.
Basic assump ons:
− measurement on the interval scale,
− normality of distribu on of an analysed features in a popula on.
Hypotheses:
Copyright ©2010-2014 PQStat So ware − All rights reserved
176
14
CORRELATION
H0 : β = 0,
H1 : β ̸= 0.
The test sta s c is defined by:
t=
β
SE
where:
SE =
syx
syx
√
,
sdx n − 1
√
2
= sdy n−1
n−2 (1 − r ),
sdx , sdy − standard devia on of the value of features: X and Y .
The value of the test sta s c can not be calculated when rp = 1 or rp = −1 or when n < 3.
The test sta s c has the t-Student distribu on with n − 2 degrees of freedom.
The p value, designated on the basis of the test sta s c, is compared with the significance level α:
if p ≤ α =⇒
if p > α =⇒
reject H0 and accept H1 ,
there is no reason to reject H0 .
Predic on is used to predict the value of a one variable (mainly a dependent variable y0 ) on the basis
of a value of an another variable (mainly an independent variable x0 ). The accuracies of a calculated
value are defined by predic on intervals calculated for it.
− Interpola on is used to predict the value of a variable, which occurs inside the area for which
the regression model was done. Interpola on is mainly a safe procedure - it is assumed only the
con nuity of the func on of analysed variables.
− Extrapola on is used to predict the value of variable, which occurs outside the area for which
the regression model was done. As opposed to interpola on, extrapola on is o en risky and is
performed only not far away from the area, where the regression model was created. Similarly
to the interpola on, it is assumed the con nuity of the func on of analysed variables.
The se ngs window with the Pearson’s linear correlation can be opened in Statistics menu→Parametric
tests→linear correlation (r-Pearson) or in Wizard.
Copyright ©2010-2014 PQStat So ware − All rights reserved
177
14
CORRELATION
E
14.1. (age-height.pqs file)
Among some students of a ballet school, the dependence between age and height was analysed. The
sample consists of 16 children and the following results of these features (related to the children) were
wri en down:
(age, height): (5, 128) (5, 129) (5, 135) (6, 132) (6, 137) (6, 140) (7, 148) (7, 150) (8, 135) (8, 142) (8,
151) (9, 138) (9, 153) (10, 159) (10, 160) (10, 162).
Hypotheses:
H0 : there is no linear dependence between age and height
for the popula on of children who a end to the analysed school,
H1 : there is a linear dependence between age and height
for the popula on of children who a end to the analysed school.
Copyright ©2010-2014 PQStat So ware − All rights reserved
178
14
Copyright ©2010-2014 PQStat So ware − All rights reserved
CORRELATION
179
14
CORRELATION
Comparing the p value = 0.000069 with the significance level α = 0.05, we draw the conclusion, that
there is a linear dependence between age and height in the popula on of children a ening to the
analysed school. This dependence is directly propor onal, it means that the children grow up as they
are ge ng older.
The Pearson product-moment correla on coefficient, so the strength of the linear rela on between
age and height counts to rp =0.8302. Coefficient of determina on rp2 = 0.6892 means that about 69%
variability of height is explained by the changing of age.
From the regression equa on:
height = 5.09 · age + 105.83
it is possible to calculate the predicted value for a child, for example: in the age of 6. The predicted
height of such child is 136.37cm.
14.1.4 The test for checking the equality of the Pearson product-moment correla on coefficients,
which come from 2 independent popula ons
This test is used to verify the hypothesis determinig the equality of 2 Pearson's linear correla on coefficients (Rp1 , Rp2 ).
Basic assump ons:
• rp1 and rp2 come from 2 samples which are chosen randomly from independent popula ons,
• rp1 and rp2 describe the strength of dependence of the same features: X and Y ,
• sizes of both samples (n1 and n2 ) are known.
Hypotheses:
H0 : Rp1 = Rp2 ,
H1 : Rp1 ̸= Rp2 .
Copyright ©2010-2014 PQStat So ware − All rights reserved
180
14
The test sta s c is defined by:
zrp2
zrp − zrp2
t= √ 1
,
1
1
+
n1 −3
n2 −3
)
1 + rp1
,
1 − rp1
(
)
1 + rp2
1
= ln
.
2
1 − rp2
where:
zrp1
CORRELATION
1
= ln
2
(
The test sta s c has the t-Student distribu on with n1 + n2 − 4 degrees of freedom.
The p value, designated on the basis of the test sta s c, is compared with the significance level α:
if p ≤ α =⇒
if p > α =⇒
reject H0 and accept H1 ,
there is no reason to reject H0 .
14.1.5 The test for checking the equality of the coefficients of linear regression equa on, which
come from 2 independent popula ons
This test is used to verify the hypothesis determining the equality of 2 coefficients of the linear regression equa on β1 and β2 in analysed popula ons.
Basic assump ons:
• β1 and β2 come from 2 samples which are chosen randomly from independent popula ons,
• β1 and β2 describe the strength of dependence of the same features: X and Y ,
• both sample sizes (n1 and n2 ) are known,
• standard devia ons for the values of both features in both samples (sdx1 , sdy1 and sdx2 , sdy2 )
are known,
• the Pearson product-moment correla on coefficients of both samples (rp1 and rp2 ) are known.
Hypotheses:
H0 : β1 = β2 ,
H1 : β1 ̸= β2 .
The test sta s c is defined by:
t= √
where:
√
syx1 = sdy1
√
syx2 = sdy2
β1 − β2
s2yx1
2
sdx1 (n1 −1)
+
s2yx2
2
sdx1 (n2 −1)
,
n1 − 1
(1 − rp21 ),
n1 − 2
n2 − 1
(1 − rp22 ).
n2 − 2
The test sta s c has the t-Student distribu on with n1 + n2 − 4 degrees of freedom.
The p value, designated on the basis of the test sta s c, is compared with the significance level α:
Copyright ©2010-2014 PQStat So ware − All rights reserved
181
14
if p ≤ α =⇒
if p > α =⇒
CORRELATION
reject H0 and accept H1 ,
there is no reason to reject H0 .
The se ngs window with the comparison of correlation coefficients can be opened in Statistics menu→Parametric
tests→comparison of correlation coefficients.
Copyright ©2010-2014 PQStat So ware − All rights reserved
182
14
CORRELATION
14.2 NONPARAMETRIC TESTS
14.2.1 THE MONOTONIC CORRELATION COEFFICIENTS
The monotonic correla on may be described as monotonically increasing or monotonically decreasing.
The rela on between 2 features is presented by the monotonic increasing if the increasing of the one
feature accompanies with the increasing of the other one. The rela on between 2 features is presented
by the monotonic decreasing if the increasing of the one feature accompanies with the decreasing of
the other one.
The Spearman's rank-order correla on coefficient rs is used to decribe the strength of monotonic
rela ons between 2 features: X and Y . It may be calculated on an ordinal scale or an interval one. The
value of the Spearman's rank correla on coefficient should be calculated using the following formula:
∑
6 ni=1 d2i
rs = 1 −
,
n(n2 − 1)
where:
di = Rxi − Ryi − difference of ranks for the feature X and Y ,
n number of di .
This formula is modified when there are es:
∑
ΣX + ΣY − ni=1 d2i
√
rs =
,
2 ΣX ΣY
where:
X
Y
ΣX = n −n−T
, ΣY = n −n−T
,
12
∑
∑s 12 3
TX = i=1 (ti(X) − ti(X) ), TY = si=1 (t3i(Y ) − ti(Y ) ),
3
3
t − number of cases included in e.
This correc on is used, when es occur. If there are no es, the correc on is not calculated, because
the correc on is reduced to the formula describing the above equa on.
Note
Rs − the Spearman's rank correla on coefficient in a popula on;
rs − the Spearman's rank correla on coefficient in a sample.
The value of rs ∈< −1; 1 >, and it should be interpreted the following way:
• rs ≈ 1 means a strong posi ve monotonic correla on (increasing) − when the independent
variable increases, the dependent variable increases too;
• rs ≈ −1 means a strong nega ve monotonic correla on (decreasing)− when the independent
variable increases, the dependent variable decreases;
• if the Spearman's correla on coefficient is of the value equal or very close to zero, there is no
monotonic dependence between the analysed features (but there might exist another rela on a non monotonic one, for example a sinusoidal rela on).
The Kendall's τ˜ correla on coefficient (Kendall (1938)[42]) is used to decribe the strength of monotonic
rela ons between features . It may be calculated on an ordinal scale or interval one. The value of the
Kendall's τ˜ correla on coefficient should be calculated using the following formula:
τ˜ = √
2(nC − nD )
√
,
n(n − 1) − TX n(n − 1) − TY
Copyright ©2010-2014 PQStat So ware − All rights reserved
183
14
CORRELATION
where:
nC − number of pairs of observa ons, for which the values of the ranks for the X feature
as well as Y feature are changed in the same direc on (the number of agreed pairs),
nD − number of pairs of observa ons, for which the values of the ranks for the X feature
are changed in the different direc on than for the Y feature (the number of disagreed
pairs),
∑
∑
TX = si=1 (t2i(X) − ti(X) ), TY = si=1 (t2i(Y ) − ti(Y ) ),
t − number of cases included in a e.
The formula for the τ˜ correla on coefficient includes the correc on for es. This correc on is used,
when es occur (if there are no es, the correc on is not calculated, because of TX = 0 i TY = 0) .
Note
τ − the Kendall's correla on coefficient in a popula on;
τ˜ − the Kendall's correla on coefficient in a sample.
The value of τ˜ ∈< −1; 1 >, and it should be interpreted the following way:
• τ˜ ≈ 1 means a strong agreement of the sequence of ranks (the increasing monotonic correla on)
− when the independent variable increases, the dependent variable increases too;
• τ˜ ≈ −1 means a strong disagreement of the sequence of ranks (the decreasing monotonic correla on) − when the independent variable increases, the dependent variable decreases;
• if the Kendall's τ˜ correla on coefficient is of the value equal or very close to zero, there is no
monotonic dependence between analysed features (but there might exist another rela on - a
non monotonic one, for example a sinusoidal rela on).
The Spearman's rs versus the Kendall's τ˜
− for an interval scale with a normality of the distribu on, the rs gives the results which are close
to rp , but τ˜ may be totally different from rp ,
− the τ˜ value is less or equal to rp value,
− the τ˜ is an unbiased es mator of the popula on parameter τ , while the rs is a biased es mator
of the popula on parameter Rs .
14.2.2 The test of significance for the Spearman's rank-order correla on coefficient
The test of significance for the Spearman's rank-order correla on coefficient is used to verify the hypothesis determining the lack of monotonic correla on between analysed features of the popula on
and it is based on the Spearman's rank-order correla on coefficient calculated for the sample. The
closer to 0 the value of rs is, the weaker dependence joins the analysed features.
Basic assump ons:
− measurement on an ordinal scale or on an interval scale.
Hypotheses:
H0 : Rs = 0,
H1 : Rs ̸= 0.
Copyright ©2010-2014 PQStat So ware − All rights reserved
184
14
The test sta s c is defined by:
t=
√
where SE =
CORRELATION
rs
,
SE
1 − rs2
.
n−2
The value of the test sta s c can not be calculated when rs = 1 lub rs = −1 or when n < 3.
The test sta s c has the t-Student distribu on with n − 2 degrees of freedom.
The p value, designated on the basis of the test sta s c, is compared with the significance level α:
if p ≤ α =⇒
if p > α =⇒
reject H0 and accept H1 ,
there is no reason to reject H0 .
The se ngs window with the Spearman’s monotonic correlation can be opened in Statistics menu →
NonParametric tests (ordered categories)→monotonic correlation (r-Spearman) or in Wizard.
E
(14.1) con nua on (age-height.pqs file)
Hypotheses:
H0 : there is no monotonic dependence between age and height
for the popula on of children a ending to the analysed school,
H1 : there is a monotonic dependence between age and height
for the popula on of children a ending to the analysed school.
Copyright ©2010-2014 PQStat So ware − All rights reserved
185
14
CORRELATION
Comparing the p value = 0.000047 with the significance level α = 0.05, we draw the conclusion that
there is a monotonic dependence between age and height in the popula on of children a ending to
the analysed school. This dependence is directly propor onal, it means that children grow up as they
get older. The Spearman's rank correla on coefficient, so the strength of a monotonic rela on between
age and height counts to rs =0.8397.
14.2.3 The test of significance for the Kendall's tau correla on coefficient
The test of significance for the Kendall's τ˜ correla on coefficient is used to verify the hypothesis determining the lack of monotonic correla on between analysed features of popula on. It is based on
the Kendall's tau correla on coefficient calculated for the sample. The closer to 0 the value of τ˜ is, the
weaker dependence joins the analysed features.
Basic assump ons:
Copyright ©2010-2014 PQStat So ware − All rights reserved
186
14
CORRELATION
− measurement on an ordinal scale or on an interval scale.
Hypotheses:
H0 : τ = 0,
H1 : τ ̸= 0.
The test sta s c is defined by:
√
3˜
τ n(n − 1)
Z= √
.
2(2n + 5)
The test sta s c asympto cally (for a large sample size) has the normal distribu on.
The p value, designated on the basis of the test sta s c, is compared with the significance level α:
if p ≤ α =⇒
if p > α =⇒
reject H0 and accept H1 ,
there is no reason to reject H0 .
The se ngs window with the Kendall’s monotonic correlation can be opened in Statistics menu →
NonParametric tests (ordered categories)→monotonic correlation (tau-Kendall) or in Wizard.
E
(14.1) con nua on (age-height.pqs file)
Hypotheses:
H0 : there is no monotonic dependence between age and height
for the popula on of children a ending to the analysed school,
H1 : there is a monotonic dependence between age and height
for the popula on of children a ending to the analysed school.
Copyright ©2010-2014 PQStat So ware − All rights reserved
187
14
CORRELATION
Comparing the p value = 000098 with the significance level α = 0.05, we draw the conclusion that
there is a monotonic dependence between age and height in the popula on of children a ending to
the analysed school. This dependence is directly propor onal, it means that children grow up as they
get older. The Kendall's correla on coefficient, so the strength of a monotonic rela on between age
and height counts to τ˜=0.7212.
14.2.4 CONTINGENCY TABLES COEFFICIENTS AND THEIR STATISTICAL SIGNIFICANCE
The con ngency coefficients are calculated for the raw data or the data gathered in a con ngency table
(look at the table (11.1)).
The Yule's Q con ngency coefficient
The Yule's Q con ngency coefficient (Yule, 1900[88]) is a measure of correla on, which can be calculated for 2 × 2 con ngency tables.
Q=
O11 O22 − O12 O21
,
O11 O22 + O12 O21
Copyright ©2010-2014 PQStat So ware − All rights reserved
188
14
CORRELATION
where:
O11 , O12 , O21 , O22 - observed frequencies in a con ngency table.
The Q coefficient value is included in a range of < −1; 1 >. The closer to 0 the value of the Q is, the
weaker dependence joins the analysed features, and the closer to −1 or +1, the stronger dependence
joins the analysed features. There is one disadvantage of this coefficient. It is not much resistant to
small observed frequencies (if one of them is 0, the coefficient might wrongly indicate the total dependence of features).
The sta s c significance of the Yule's Q coefficient is defined by the Z test.
Hypotheses:
H0 : Q = 0,
H1 : Q ̸= 0.
The test sta s c is defined by:
Z=√
Q
1
4 (1
− Q2 )2 ( O111 +
1
O12
+
1
O21
+
1
O22 )
.
The test sta s c asympto cally (for a large sample size) has the normal distribu on.
The p value, designated on the basis of the test sta s c, is compared with the significance level α:
if p ≤ α =⇒
if p > α =⇒
reject H0 and accept H1 ,
there is no reason to reject H0 .
The ϕ con ngency coefficient
The Phi con ngency coefficient is a measure of correla on, which can be calculated for 2×2 con ngency
tables.
√
χ2
,
ϕ=
n
where:
χ2 − value of the χ2 test sta s c,
n − total frequency in a con ngency table.
The ϕ coefficient value is included in a range of < 0; 1 >. The closer to 0 the value of ϕ is, the weaker
dependence joins the analysed features, and the closer to 1, the stronger dependence joins the analysed features.
The ϕ con ngency coefficient is considered as sta s cally significant, if the p-value calculated on the
basis of the χ2 test (designated for this table) is equal to or less than the significance level α.
The se ngs window with the measures of correlation Q-Yule, Phi can be opened in Statistics menu
→ NonParametric tests (unordered categories) → Q-Yule, Phi (2x2) or in Wizard.
Copyright ©2010-2014 PQStat So ware − All rights reserved
189
14
CORRELATION
The Cramer's V con ngency coefficient
The Cramer's V con ngency coefficient (Cramer, 1946[24]), is an extension of the ϕ coefficient on r × c
con ngency tables.
√
χ2
,
V =
n(w − 1)
where:
χ2 − value of the χ2 test sta s c,
n − total frequency in a con ngency table,
w − the smaller the value out of r and c.
The V coefficient value is included in a range of < 0; 1 >. The closer to 0 the value of V is, the
weaker dependence joins the analysed features, and the closer to 1, the stronger dependence joins the
analysed features. The V coefficient value depends also on the table size, so you should not use this
coefficient to compare different sizes of con ngency tables.
The V con ngency coefficient is considered as sta s cally significant, if the p-value calculated on the
basis of the χ2 test (designated for this table) is equal to or less than the significance level α.
The Pearson's C con ngency coefficient
The Pearson's C con ngency coefficient is a measure of correla on, which can be calculated for r × c
con ngency tables.
√
C=
χ2
,
χ2 + n
where:
χ2 − value of the χ2 test sta s c,
n − total frequency in a con ngency table.
Copyright ©2010-2014 PQStat So ware − All rights reserved
190
14
CORRELATION
The C coefficient value is included in a range of < 0; 1). The closer to 0 the value of C is, the weaker
dependence joins the analysed features, and the farther from 0, the stronger dependence joins the
analysed features. The C coefficient value depends also on the table size (the bigger table, the closer
to 1 C value can be), that is why it should be calculated the top limit, which the C coefficient may gain
− for the par cular table size:
√
w−1
Cmax =
,
w
where:
w − the smaller value out of r and c.
An uncomfortable consequence of dependence of C value on a table size is the lack of possibility of
comparison the C coefficient value calculated for the various sizes of con ngency tables. A li le bit
be er measure is a con ngency coefficient adjusted for the table size (Cadj ):
Cadj =
C
Cmax
.
The C con ngency coefficient is considered as sta s cally significant, if the p-value calculated on the
basis of the χ2 test (designated for this table) is equal to or less than significance level α.
The se ngs window with the measures of correlation C-Pearson, V-Cramer can be opened in Statistics
menu → NonParametric tests (unordered categories) → C-Pearsona, V-Cramera (RxC) or in Wizard.
E
14.2. (sex-exam.pqs file)
There is a sample of 170 persons (n = 170), who have 2 features analysed (X=sex, Y =passing the
exam). Each of these features occurs in 2 categories (X1 =f, X2 =m, Y1 =yes, Y2 =no). Basing on the
sample, we would like to get to know, if there is any dependence between sex and passing the exam in
an analysed popula on. The data distribu on is presented in a con ngency table:
Copyright ©2010-2014 PQStat So ware − All rights reserved
191
14
Observed frequencies
Oij
f
sex
m
total
CORRELATION
passing the exam
yes no total
50
40
90
20
60
80
70 100 170
Copyright ©2010-2014 PQStat So ware − All rights reserved
192
14
CORRELATION
The test sta s c value is χ2 = 16.33 and the p value calculated for it: p = 0.00005. The result indicates
that there is a sta s cally significant dependence between sex and passing the exam in the analysed
popula on.
Coefficient values, which are based on the χ2 test, so the strength of the correla on between analysed features are:
Cadj -Pearson = 0.42.
V -Cramer = ϕ =0.31
The Q-Yule = 0.58, and the p value of the Z test (similarly to χ2 test) indicates the sta s cally significant
dependence between the analysed features.
Copyright ©2010-2014 PQStat So ware − All rights reserved
193
15 AGREEMENT ANALYSIS
15 AGREEMENT ANALYSIS
Interval scale
Are
the data
normally
distributed?
Ordinal scale
N
test of
significance
f
for the Kendall's W
coefficient
Nominal scale
test of
significance
for the Cohen's κ
ˆ
coefficient
T
(Kolmogorov-Smirnov
or Lilliefors test)
test of
significance
for the Intraclass
Correla on
Coefficient (rICC )
Copyright ©2010-2014 PQStat So ware − All rights reserved
194
15 AGREEMENT ANALYSIS
15.1 PARAMETRIC TESTS
15.1.1 The intraclass correla on coefficient and the test of its significance
The intraclass correla on coefficient is used when the measurement of variables is done by a few
"judges" (k ≥ 2). It measures the strength of interjudge reliability − the degree of its assessment
concordance.
If the distribu on of a variable is a normal distribu on, it can be represented in a dependent model for
the interval scale.
rICC =
M SBS
M SBS − M Sres
,
+ (k − 1)M Sres + nk (M SBC − M Sres )
where:
M SBC − mean square between-condi ons (between judges) − check ANOVA for dependent groups,
M SBS − mean square between-subjects,
M Sres − mean square residual,
n − sample size,
k − number of judges.
Note
RICC − the intraclass correla on coefficient in a popula on;
rICC − the intraclass correla on coefficient in a sample.
The value of rICC ∈< −1; 1 > and it should be interpreted in the following way:
• rICC ≈ 1 it is an absolute concordance of objects assessment made by judges; it is especially
reflected in a high-variance between objects (a significant means difference between n objects)
and a low-variance between judges assessments (a small means difference of assessments designated by k judges);
• rICC ≈ −1 a nega ve intraclass coefficient is treated in the same ways as rICC ≈ 0;
• rICC ≈ 0 a lack of an absolute concordance in individual objects assessments made by judges;
it is visible in a small variance between objects (a small means difference between objects) and
in a large variance between judges assessments (a significant means difference of assessments
designated by k judges).
In addi on, an average intraclass correla on coefficient can be formulated as:
rICC =
k · ICC
.
1 + (k − 1)ICC
If we averaged these two judges assessments and used them as a one result, the coefficient would not
be directly related to the problem, but to the reliability of the situa on results.
The F test of significance for the intraclass correla on coefficient
Basic assump ons:
− measurement on an interval scale,
Copyright ©2010-2014 PQStat So ware − All rights reserved
195
15 AGREEMENT ANALYSIS
− the normal distribu on for all variables which are the differences of measurement pairs (or the
normal distribu on for an analysed variable in each measurement).
Hypotheses:
H0 : RICC = 0
H1 : RICC ̸= 0
(RICC = 1)
The test sta s c is defined by:
F =
M SBS
M Sres
This sta s c has the F Snedecor distribu on with dfBS = n − 1 and dfres = (n − 1)(k − 1) degrees of
freedom.
The p value, designated on the basis of the test sta s c, is compared with the significance level α:
if p ≤ α =⇒
if p > α =⇒
reject H0 and accept H1 ,
there is no reason to reject H0 .
The se ngs window with the ICC − Intraclass Correlation Coefficient can be opened in Statistics
menu→Parametric tests→ICC − Intraclass Correlation Coefficient or in Wizard.
E
15.1. (sound intensity.pqs file)
The concordance of sound intensity was measured by three different meters. The measurements were
done in 12 different measuring points.
Copyright ©2010-2014 PQStat So ware − All rights reserved
196
15 AGREEMENT ANALYSIS
measuring point
A
B
C
D
E
F
G
H
I
J
K
L
meter I
84
85
84
87
85
80
81
86
83
84
83
84
meter II
84
85
84
87
86
80
81
86
82
82
82
83
meter III
84
84
85
87
85
80
82
87
83
84
83
84
Hypotheses:
H0 : a lack of an absolute concordance between the levels of sound intensity
measured by three different meters, in the popula on represented by the sample,
H1 : the levels of sound intensity, measured in the popula on represented
by the sample, are absolutely concordant.
Copyright ©2010-2014 PQStat So ware − All rights reserved
197
15 AGREEMENT ANALYSIS
Comparing the p < 0, 000001 with the significance level α = 0.05, we have stated that the sound
intensity levels, measured by three different meters, are absolutely concordant in the analysed popula on. The strength of absolute concordance is high: rICC = 0.92029.
Concordance of the results we also see in the Bland-Altman plots[3][10], where almost all of the values
fall into the specified range:
Copyright ©2010-2014 PQStat So ware − All rights reserved
198
15 AGREEMENT ANALYSIS
15.2 NONPARAMETRIC TESTS
15.2.1 The Kendall's coefficient of concordance and the test of its significance
f coefficient of concordance is described in the works of Kendall, Babington-Smith (1939)[43]
The Kendall's W
and Wallis (1939)[80]. It is used when the result comes from different sources (from different judges)
and concerns a few (k ≥ 2) objects. However, the assessment concordance is necessary. Is o en used
in measuring the interjudge reliability strength − the degree of (judges) assessment concordance.
The Kendall's coefficient of concordance is calculated on an ordinal scale or a interval scale. Its value is
Copyright ©2010-2014 PQStat So ware − All rights reserved
199
15 AGREEMENT ANALYSIS
calculated according to the following formula:
2
2
f = 12U − 3n k(k + 1) ,
W
n2 k(k 2 − 1) − nC
where:
n − number of different assessments sets (the number of judges),
k − number of ranked objects,
( n
)2
k
∑
∑
U=
Rij ,
j=1
i=1
Rij − ranks ascribed to the following objects (j = 1, 2, ...k), independently for each judge
(i = 1, 2, ...n),
∑
C=
(t3 − t) − a correc on for es,
t − number of cases incorporated into e.
The coefficient's formula includes C − the correc on for es. This correc on is used, when es occur
(if there are no es, the correc on is not calculated, because of C = 0).
Note
W − the Kendall's coefficient in a popula on;
f − the Kendall's coefficient in a sample.
W
The value of W ∈< 0; 1 > and it should be interpreted in the following way:
f ≈ 1 means a strong concordance in judges assessments;
• W
f ≈ 0 means a lack of concordance in judges assessments.
• W
f coefficient of concordance vs. the Spearman rs coefficient:
The Kendall's W
When the values of the Spearman rs correla on coefficient (for all possible pairs) are calculated,
f coefficient:
the average rs coefficient − marked by r¯s is a linear func on of W
r¯s =
f−1
nW
n−1
f coefficient of concordance vs. the Friedman ANOVA:
The Kendall's W
f coefficient of concordance and the Friedman ANOVA are based on the same
The Kendall's W
mathema cal model. As a result, the value of the chi-square test sta s c for the Kendall's coefficient of concordance and the value of the chi-square test sta s c for the Friedman ANOVA are
the same.
The chi-square test of significance for the Kendall's coefficient of concordance
Basic assump ons:
− measurement on an ordinal scale or on an interval scale.
Hypotheses:
H0 : W = 0
H1 : W ̸= 0
Copyright ©2010-2014 PQStat So ware − All rights reserved
200
15 AGREEMENT ANALYSIS
The test sta s c is defined by:
f
χ2 = n(k − 1)W
This sta s c asympto cally (for large sample sizes) has the rozklad χ2 distribu on with the degrees of
freedom calculated according to the following formula: df = k − 1.
The p value, designated on the basis of the test sta s c, is compared with the significance level α:
if p ≤ α =⇒
if p > α =⇒
reject H0 and accept H1 ,
there is no reason to reject H0 .
The se ngs window with the test of the Kendall’s W significance can be opened in Statistics menu
→NonParametric tests (ordered categories)→Kendall’s W or in Wizard.
E
15.2. (judges.pqs file)
In the 6.0 system, dancing pairs grades are assessed by 9 judges. The judges point for example an ar s c
expression. They asses dancing pairs without comparing each of them and without placing them in the
par cular "podium place" (they create a ranking). Let's check if the judges assessments are concordant.
Judges
S1
S2
S3
S4
S5
S6
S7
S8
S9
Couple A
3
4
4
2
2
3
5
3
2
Couple B
6
6
6
6
6
5
4
6
6
Couple C
2
1
2
3
1
1
1
2
3
Couple D
5
5
5
5
5
6
6
5
5
Couple E
4
3
3
4
4
4
3
4
4
Copyright ©2010-2014 PQStat So ware − All rights reserved
Couple F
1
2
1
1
3
2
2
1
1
201
15 AGREEMENT ANALYSIS
Hypotheses:
H0 : a lack of concordance between 9 judges assessments,
in the popula on represented by the sample,
H1 : the 9 judges assessments in the popula on represented
by the sample are concordant.
Comparing the p < 0, 000001 with the significance level α = 0.05, we have stated that the judges
f = 0.83351, similarly
assessments are sta s cally concordant. The concordance strength is high: W
the average Spearman's rank-order correla on coefficient: r¯s = 0.81270. This result can be presented
in the graph, where the X-axis represents the successive judges. Then the more intersec on of the lines
we can see (the lines should be parallel to the X axis, if the concordance is perfect), the less there is the
concordance of judges evalua ons.
15.2.2 The Cohen's Kappa coefficient and the test of its significance
The Cohen's Kappa coefficient (Cohen J. (1960)[22]) defines the agreement level of two- mes measurements of the same variable in different condi ons. Measurement of the same variable can be
performed by 2 different observers (reproducibility) or by a one observer twice (recurrence). The κ
ˆ
coefficient is calculated for categorial dependent variables and its value is included in a range from -1
to 1. A 1 value means a full agreement, 0 value means agreement on the same level which would occur
Copyright ©2010-2014 PQStat So ware − All rights reserved
202
15 AGREEMENT ANALYSIS
for data spread in a con ngency table randomly. The level between 0 and -1 is prac cally not used. The
nega ve κ
ˆ value means an agreement on the level which is lower than agreement which occurred for
the randomly spread data in a con ngency table. The κ
ˆ coefficient can be calculated on the basis of
raw data or a c × c con ngency table.
To calculate the κ
ˆ coefficient, you need to transform a con ngency table for the observed frequencies
Oij (11.6) into the con ngency table of probabili es pij (15.1):
Table 15.1. The c × c con ngency table of probabili es
Probabili es
pij
X (1)
(2)
X1
(2)
X2
p11
p21
...
pc1
p.1
p12
p22
...
pc2
p.2
(1)
X1
(1)
X2
...
(1)
Xc
Total
X (2)
(2)
... Xc
...
...
...
...
...
p1c
p2c
...
pcc
p.c
Total
p1.
p2.
...
pc.
n
The Kappa coefficient (ˆ
κ) is defined by:
κ
ˆ=
Po − Pe
,
1 − Pe
where:∑
Po = ∑ci=1 pii ,
Pe = ci=1 pi. p.i ,
∑
∑
∑
or equivalently κ
ˆ = ( Oii − Eii )/(n − Eii ), where Oii , Eii are the observed frequencies and
the expected frequencies of main diagonal.
Note
κ
ˆ − the coefficient of an agreement in a sample;
κ − the coefficient of an agreement in a popula on.
The standard terror of Kappa (Hanley 1987[38]) is defined by:
√
A+B−C
√ ,
SEκˆ =
(1 − Pe ) n
where:
∑
A = ci=1 pii (1
ˆ ))2 ,
i. + p.i )(1 − κ
∑−
∑(p
c
2
2
B = (1 − κ
ˆ)
i̸=j pij (pi. + p.j) ,
C = (ˆ
κ − Pe (1 − κ
ˆ ))2 .
The Z test of significance for the Cohen's Kappa (ˆ
κ) (Fleiss,1981[30]) is used to verify the hypothesis
informing us about the agreement of the results of two- mes measurements X (1) and X (2) features
X and it is based on the κ
ˆ coefficient calculated for the sample.
Basic assump ons:
− measurement on a nominal scale (alterna vely: an ordinal or an interval).
Hypotheses:
H0 : κ = 0,
H1 : κ ̸= 0.
Copyright ©2010-2014 PQStat So ware − All rights reserved
203
15 AGREEMENT ANALYSIS
The test sta s c is defined by:
Z=
where: SEκdistr
κ
ˆ
SEκdistr
,
∑
Pe + Pe2 − ci=1 pi. p.i(pi. + p.i)
=
- standard error of a sample distribu on.
(1 − Pe )2 n
The Z sta s c asympto cally (for a large sample size) has the normal distribu on.
The p value, designated on the basis of the test sta s c, is compared with the significance level α:
if p ≤ α =⇒
if p > α =⇒
reject H0 and accept H1 ,
there is no reason to reject H0 .
The se ngs window with the test of Cohen’s Kappa significance can be opened in Statistics menu →
NonParametric tests (unordered categories) → Cohen’s Kappa or in Wizard.
E
15.3. (diagnosis.pqs file)
You want to analyse the compa bility of a diagnosis made by 2 doctors. To do this, you need to draw
110 pa ents (children) from a popula on. The doctors treat pa ents in a neighbouring doctors' offices.
Each pa ent is examined first by the doctor A and then by the doctor B. Both diagnoses, made by the
doctors, are shown in the table below.
Hypotheses:
Copyright ©2010-2014 PQStat So ware − All rights reserved
204
15 AGREEMENT ANALYSIS
H0 : κ = 0,
H1 : κ ̸= 0.
We could analyse the agreement of the diagnoses using just the percentage of the compa ble values.
In this example, the compa ble diagnoses were made for 73 pa ents (31+39+3=73) which is 66.36%
of the analysed group. The kappa coefficient introduces the correc on of a chance agreement (it takes
into account the agreement occurring by chance).
The agreement with a chance adjustment κ
ˆ = 44, 58% is smaller than the one which is not adjusted
for the chances of an agreement.
The p value < 0.000001. Such result proves an agreement between these 2 doctors' opinions, on the
significance level α = 0.05,.
Copyright ©2010-2014 PQStat So ware − All rights reserved
205
16
DIAGNOSTIC TESTS
16 DIAGNOSTIC TESTS
16.1 EVALUATION OF DIAGNOSTIC TEST
Suppose that using a diagnos c test we calculate the occurrence of a par cular feature (most o en
disease) and know the gold-standard, so we know that the feature really occurs among the examined
people. On the basis of these informa on, we can build a 2 × 2 con ngency table:
Observed frequencies
disease (+)
diagnos c test
posi ve result (+)
nega ve result (−)
Total
Reality (gold-standard)
disease free (−)
TP
FN
TP+FN
FP
TN
FP+TN
Total
TP+FP
FN+TN
n=TP+FP+FN+TN
where:
TP − true posi ve
FP − false posi ve
FN − false nega ve
TN − true nega ve
For such a table we can calculate the following measurements.
• Sensi vity and specificity of diagnos c test
Every diagnos c test, in some cases, can obtain results different than actual results, for example
a diagnos c test, basing on the obtained parameters, classifies a pa ent to the group of people
suffering from a par cular disease, or to the group of healthy people. In reality, the number of
people approved for the above groups by the test may differ from the number of people genuinely ill and genuinely healthy.
There are two evalua on measurements of the test accuracy. They are:
Sensi vity − describes the ability to detect people genuinely ill (having a par cular feature).
If we examine a group of ill people, the sensi vity provides us with the informa on what
percentage of them have a posi ve test result.
sensi vity =
TP
TP + FN
Confidence interval is built on the basis of the Clopper-Pearson method for a single proporon.
Specificity − describes the ability to detect people genuinely healthy (without a par cular feature). If we examine a group of genuinely healthy people, the specificity provides us with
the informa on about the percentage of people having a nega ve test result.
specificity =
TN
FP + TN
Confidence interval is built on the basis of the Clopper-Pearson method for a single proporon.
• Posi ve predic ve values, nega ve predic ve values and prevalence rate
Copyright ©2010-2014 PQStat So ware − All rights reserved
206
16
DIAGNOSTIC TESTS
Posi ve predic ve value (P P V ) − the probability, that a person having a posi ve test result
suffered from a disease. If the examined person obtains a posi ve test result, the PPV informs them how they can be sure, that they suffer from a par cular disease.
PPV =
TP
TP + FP
Confidence interval is built on the basis of the Clopper-Pearson method for a single proporon.
Nega ve predic ve value (hypertargetNPVN P V ) − the probability that a person having a nega ve test result did not suffer from any disease. If the examined person obtains a nega ve
test result, the NPV informs them how they can be sure that they do not suffer from a parcular disease.
TN
NPV =
FN + TN
Confidence interval is built on the basis of the Clopper-Pearson method for a single proporon.
Posi ve and nega ve predic ve values depend on the prevalence rate.
Prevalence − probability of disease in the popula on for which the diagnos c test was conducted.
TP + FN
prevalence =
n
Confidence interval is built on the basis of the Clopper-Pearson method for a single propor on.
• Likelihood ra o of posi ve test and likelihood ra o of nega ve test
Likelihood ra o of posi ve test (LR+ ) − this measurement enables the comparison of some
test results matching to the gold-standard. It does not depend on the prevalence of the
disease. It is the ra o of two odds: the odds that a person from the group of ill people will
obtain a posi ve test result, and the same effect will be observed among healthy people.
LR+ =
sensi vity
T P (T P + F N )
=
1 − specificity
F P (F P + T N )
Confidence interval for LR+ is built on the basis of the standard error:
√
1 − sensi vity specificity
+
.
SE =
TP
FP
Likelihood ra o of nega ve test (LR− ) − it is the ra o of two odds: the odds that a person
from the group of ill people will obtain a nega ve test result, and the same effect will be
observed among healthy people.
LR− =
1 − sensi vity
F N (T P + F N )
=
specificity
T N (F P + T N )
Confidence interval for LR− is built on the basis of the standard error:
√
sensi vity 1 − specificity
SE =
+
.
FN
TN
• Accuracy
Copyright ©2010-2014 PQStat So ware − All rights reserved
207
16
DIAGNOSTIC TESTS
Accuracy (Acc) − the probability of a correct diagnose using a diagnos c test. If the examined
person obtains a posi ve or a nega ve test result, the Acc informs how they can be sure
about the defini ve diagnosis.
TP + TN)
Acc =
n
Confidence interval is built on the basis of the Clopper-Pearson method for a single propor on.
The se ngs window with the diagnostic tests can be opened in Stistics menu →Diagnostic tests →
Diagnostic tests
E
16.1. (mammography.pqs file)
Mammography is one of the most popular screening tests which enables the detec on of breast cancer.
The following study has been carried out on the group of 250 people, so-called "asymptoma c" women
at the age from 40 to 50. Mammography can detect an outbreak of cancer smaller than 5 mm and
enables to note the change which is not a nodule yet but a change in the structure of ssues.
Observed frequencies
mammography
posi ve result (+)
nega ve result (−)
Total
Reality (histopatology)
disease (+) disease free (−)
9
1
10
10
230
240
Total
19
231
250
We will calculate the values enabling the assessment of the performed diagnos c test.
Copyright ©2010-2014 PQStat So ware − All rights reserved
208
16
DIAGNOSTIC TESTS
• 90% of women suffering from breast cancer have been correctly defined, so they have obtained
the posi ve result of mammography;
Copyright ©2010-2014 PQStat So ware − All rights reserved
209
16
DIAGNOSTIC TESTS
• 95.83% of healthy women (not suffering from breast cancer) have been correctly defined, so they
have obtained the nega ve result of mammography;
• 4 out of 100 examined women suffer from breast cancer;
• A woman who have obtained a posi ve mammography result can be 47.37% sure that she suffers
from breast cancer;
• A women who have obtained a nega ve test result can be 99.57% sure that she does not suffer
from breast cancer;
• The probability that the posi ve mammography result will be obtained by a woman genuinely
suffering from cancer is 21.60 mes greater than the probability that the posi ve mammography
result will be obtained by a healthy woman (not suffering from breast cancer);
• The probability that the nega ve mammography result will be obtained by a woman genuinely
suffering from breast cancer is 10.43% of the probability that the nega ve mammography result
will be obtained by a healthy woman (not suffering from breast cancer);
• A woman undergoing mammography (regardless of age) can be 96.50% sure of the defini ve
diagnosis.
16.2 ROC CURVE
The diagnos c test is used for differen a ng objects with a given feature (marked as (+), e.g. ill people) from objects without the feature (marked as (−), e.g. healthy people). For the diagnos c test to
be considered valuable, it should yield a rela vely small number of wrong classifica ons. If the test is
based on a dichotomous variable then the proper tool for the evalua on of the quality of the test is the
analysis of a 2 × 2 con ngency table of true posi ve (TP), true nega ve (TN), false posi ve (FP), and
false nega ve (FN) values. Most frequently, though, diagnos c tests are based on con nuous variables
or ordered categorical variables. In such a situa on the proper means of evalua ng the capability of
the test for differen a ng (+) and (−) are ROC (Receiver Opera ng Characteris c) curves.
It is frequently observed that the greater the value of the diagnos c variable, the greater the odds of
occurrence of the studied phenomenon, or the other way round: the smaller the value of the diagnos c
variable, the smaller the odds of occurrence of the studied phenomenon. Then, with the use of ROC
curves, the choice of the op mum cut-off is made, i.e. the choice of a certain value of the diagnos c
variable which best separates the studied sta s cal popula on into two groups: (+) in which the given
phenomenon occurs and (−) in which the given phenomenon does not occur.
When, on the basis of the studies of the same objects, two or more ROC curves are constructed, one
can compare the curves with regard to the quality of classifica on.
Let us assume that we have at our disposal a sample of n elements, in which each object has one of the
k values of the diagnos c variable. Each of the received values of the diagnos c variable x1 , x2 , ...xk
becomes the cut-off xcat .
If the diagnos c variable is:
• s mulant (the growth of its value makes the odds of occurrence of the studied phenomenon
greater), then values greater than or equal to the cut-off (xi >= xcat ) are classified in group (+);
• des mulant (the growth of its value makes the odds of occurrence of the studied phenomenon
smaller), then values smaller than or equal to the cut-off (xi >= xcat ) are classified in group (+);
Copyright ©2010-2014 PQStat So ware − All rights reserved
210
16
DIAGNOSTIC TESTS
For each of the k cut-offs we define true posi ve (TP), true nega ve (TN), false posi ve (FP), and false
nega ve (FN) values.
s mulant
diagnos c variable
xi >= xcat (+)
xi < xcat (−)
des mulant
diagnos c variable
xi <= xcat (+)
xi > xcat (−)
Reality
(+) (−)
TP FP
FN TN
Reality
(+) (−)
TP FP
FN TN
On the basis of those values each cut-off xcat can be further described by means of sensi vity and
specificity, posi ve predic ve values(P P V ), nega ve predic ve values (N P V ), posi ve result likelihood ra o (LR+ ), nega ve result likelihood ra o (LR− ), and accuracy (Acc).
Note
The PQStat program computes the prevalence coefficient on the basis of the sample. The computed
prevalence coefficient will reflect the occurrence of the studied phenomenon (illness) in the popula on
in the case of screening of a large sample represen ng the popula on. If only people with suspected
illness are directed to medical examina ons, then the computed prevalence coefficient for them can
be much higher than the prevalence coefficient for the popula on.
Because both the posi ve and nega ve predic ve value depend on the prevalence coefficient, when
the coefficient for the popula on is known a priori, we can use it to compute, for each cut-off xcat ,
corrected predic ve values according to Bayes's formulas:
P P Vrevised =
Sensi vity · Papriori
Sensi vity · Papriori + (1 − Specificity) · (1 − Papriori )
N P Vrevised =
Specificity · (1 − Papriori )
Specificity · (1 − Papriori ) + (1 − Sensi vity) · Papriori
where:
Papriori - the prevalence coefficient put in by the user, the so-called pre-test probability of
disease
xcat
sensi vity
specificity
PPV
NPV
LR+
LR−
Acc
PPVrev
NPVrev
x1
x2
..
.
xk
sensi vity1
sensi vity2
..
.
sensi vityk
specificity1
specificity2
..
.
specificityk
P P V1
P P V2
..
.
P P Vk
N P V1
N P V2
..
.
N P Vk
LR+1
LR+2
..
.
LR+k
LR−1
LR−2
..
.
LR−k
Acc1
Acc2
..
.
Acck
P P Vrev1
P P Vrev2
..
.
P P Vrevk
N P Vrev1
N P Vrev2
..
.
N P Vrevk
The ROC curve is created on the basis of the calculated values of sensi vity and specificity. On the
abscissa axis the x=1-specificity is placed, and on the ordinate axis y=sensi vity. The points obtained
in that manner are linked. The constructed curve, especially the area under the curve, presents the
classifica on quality of the analyzed diagnos c variable. When the ROC curve coincides with the diagonal y = x, then the decision made on the basis of the diagnos c variable is as good as the random
distribu on of studied objects into group (+) and group (−).
Copyright ©2010-2014 PQStat So ware − All rights reserved
211
16
DIAGNOSTIC TESTS
AUC (area under curve) − the size of the area under the ROC curve falls within < 0; 1 >. The greater
the field the more exact the classifica on of the objects in group (+) and group (−) on the basis of the
analyzed diagnos c variable. Therefore, that diagnos c variable can be even more useful as a classifier.
The area AU C, error SEAU C and confidence interval for AUC are calculated on the basis of:
⋆ nonparametric DeLong method (DeLong E.R. et al. 1988[26], Hanley J.A. i Hajian-Tilaki K.O.
1997[38]) - recommended,
⋆ nonparametric Hanley-McNeil method (Hanley J.A. i McNeil M.D. 1982[39]),
⋆ Hanley-McNeil method which presumes double nega ve exponen al distribu on (Hanley J.A. i
McNeil M.D. 1982[39]) - computed only when groups (+) and (−) are equinumerous.
For the classifica on to be be er than random distribu on of objects into to classes, the area under
the ROC curve should be significantly larger than the area under the line y = x, i.e. than 0.5.
Hypotheses:
H0 : AU C = 0.5,
H1 : AU C ̸= 0.5.
The test sta s cs has the form presented below:
Z=
AU C − 0.5
,
SE0.5
where: √
n(+) +n(−) +1
,
SE0.5 =
12n n
(+) (−)
n(+) − size of the sample (+) in which the given phenomenon occurs,
n(−) − size of the sample (−), in which the given phenomenon does not occur.
The Z sta s c asympto cally (for large sample sizes) has the normal distribu on.
The p value, designated on the basis of the test sta s c, is compared with the significance level α:
if p ≤ α =⇒
if p > α =⇒
reject H0 and accept H1 ,
there is no reason to reject H0 .
Copyright ©2010-2014 PQStat So ware − All rights reserved
212
16
DIAGNOSTIC TESTS
16.2.1 Selec on of op mum cut-off
The point which is looked for is a certain value of the diagnos c variable, which provides the op mum
separa on of the studied popula on into to groups: (+) in which the given phenomenon occurs and
(−) in which the given phenomenon does not occur. The selec on of the op mum cut-off is not easy
because it requires specialist knowledge about the topic of the study. For example, different cut-offs
will be required in, on the one hand, a test used for screening of a large group of people, e.g. for a mammography study, and, on the other hand, in invasive studies conducted for the purpose of confirming
an earlier suspicion, e.g. in histopathology. With the help of an advanced mathema cal apparatus we
can find a cut-off which will be the most useful from the perspec ve of mathema cs.
PQStat Program enables the selec on of an op mum cut-off by means of an analysis of the graph of the
intersec on of sensi vity and specificity. Besides, the op mum cut-off can be computed on the basis
of data about the costs of wrong decisions and about the a priori prevalence coefficient value, provided
by the user.
• Op mum cut-off on ROC curve − computed on the basis of sensi vity, specificity, costs of wrong
decisions, and the prevalence coefficient.
Errors which can be made when classifying the studied objects as belonging to group (+) and
group (−) are false posi ve results (F P ) and false nega ve results (F N ). If commi ng those
errors is equally costly (ethical, financial, and other costs), then in the field Cost FP and in the
field Cost FN we enter the same posi ve value − usually 1. However, if we come to the conclusion
that one type of error is encumbered with a greater cost than the other one, then we will assign
appropriately greater weight to it.
The op mum cut-off value is calculated on the basis of sensi vity, specificity, and with the help
of value m − slope of the tangent line to the ROC curve. The slope angle m is defined in rela on
to two values: the costs of wrong decisions and the prevalence coefficient. Normally the costs of
wrong decisions have the value 1 and the prevalence coefficient is es mated from the sample.
Knowing, a priori, the prevalence coefficient (Papriori ) and the costs of wrong decisions, the user
can influence the value m and, consequently, the search for an op mum cut-off. As a result, the
op mum cut-off is determined to be such a value of the diagnos c variable for which the formula:
Sensi vity − m · (1 − Specificity)
reaches the minimum (Zweig M.H. 1993[89]).
The op mum cut-off point of the diagnos c variable, selected as described above, will finally be
marked on the ROC curve.
• Costs graph − presents the calculated values of an wrong diagnosis together with their costs.
The values are computed according to the formula:
cost = costF P · F P + costF N · F N
The point marked on the graph is the minimum of the func on presented above.
• Sensi vity and specificity intersec on graph − allows the localiza on of the point in which the
value of sensi vity and specificity is simultaneously the greatest.
The window with se ngs for ROC analysis is accessed via the menu Statistics → Diagnostic tests→ROC
curve.
Copyright ©2010-2014 PQStat So ware − All rights reserved
213
16
DIAGNOSTIC TESTS
E
16.2. (file bacteriemia.pqs)
Persistent high fever in an infant or a small child without clearly diagnosed reasons is a premise for
tes ng for bacteremia. The most useful and reliable parameters for screening and monitoring bacterial
infec ons are the following indicators:
WBC - the number of white blood cells
PCT - procalcitonin.
It is assumed that in a healthy infant or a small child WBC should not exceed 15 thousand/µl and PCT
should be lower than 0.5 ng/ml.
The sample values of those indicators for 136 children of up to 3 years old with persistent fever > 390 C
is presented in the table fragment below:
One method of analyzing the PCT indicator is transforming it into a dichotomous variable by selec ng
a cut-off (e.g. xcat =0.5 ng/ml) above which the study is considered to be "posi ve". The level of adequacy of such a division will be indicated by the value of sensi vity and specificity. We want to use a
more complex approach, that is, calculate the sensi vity and specificity not only for one value but for
each PCT value obtained in the sample - which means construc ng a ROC curve. On the basis of the
Copyright ©2010-2014 PQStat So ware − All rights reserved
214
16
DIAGNOSTIC TESTS
informa on obtained in that manner we want to check if the PTC indicator is indeed useful for diagnosing bacteremia. If so, then we want to check what is the op mal cut-off above which we can consider
the study to be "posi ve" − detec ng bacteremia.
In order to check if PTC is really useful for diagnosing bacteremia we will calculate the size of the area
under the ROC curve and verify the hypothesis that:
H0 : area under the constructed ROC curve = 0.5,
H1 : area under the constructed ROC curve ̸= 0.5.
As bacteremia is accompanied by an increased PCT level, in the test op ons window we will consider
the indicator to be a stimulant. In the state variable we have to define which value in the bacteremia
column determines its presence, then we select "yes". Apart from the result of the sta s cal test, in
the report we can find an exact descrip on of every possible cut-off.
The calculated size of the area under the ROC curve is AU C = 0.889. Therefore, on the basis of the
adopted level α = 0.05, based on the obtained value p < 0.000001 we assume that diagnosing bacCopyright ©2010-2014 PQStat So ware − All rights reserved
215
16
DIAGNOSTIC TESTS
teremia with the use of the PCT indicator is indeed more useful than a random distribu on of pa ents
into 2 groups: suffering from bacteremia and not suffering from it. Therefore, we return to the analysis
(bu on ) to define the op mal cut-off.
The algorithm of searching for the op mal cut-off takes into account the costs of wrong decisions and
the prevalence coefficient.
(1) FN cost - wrong diagnosis is the cost of assuming that the pa ent does not suffer from bacteremia although in reality he or she is suffering from it (costs of a falsely nega ve decision)
(2) FP cost - wrong diagnosis, is the cost of assuming that the pa ent suffers from bacteremia
although in reality he or she is not suffering from it (costs of a falsely posi ve decision)
As the FN costs are much more serious than the FP costs, we enter a greater value in field one than in
field two. We decided the value would be 5.
The PCT value is to be used in screening so we do not give the prevalence coefficient for the popula on
(a priori prevalence coefficient) which is very low but we use the es mated coefficient from the sample.
We do so in order not to move the cut-off of the PCT value too high and not to increase the number of
falsely nega ve results.
The op mal PCT cut-off determined in this way is 1.819. For this point sensi vity=0.85 and specificity=0.96.
Another method of selec ng the cut-off is the anlysis of the costs graph and of the sensi vity intersecon graph:
Copyright ©2010-2014 PQStat So ware − All rights reserved
216
16
DIAGNOSTIC TESTS
The analysis of the costs graph shows that the minimum of the costs of wrong decisions lies at PCT=1.819.
The value of sensi vity and specificity is similar at PCT=1.071.
16.2.2 ROC curves comparison
Very o en the aim of studies is the comparison of the size of the area under the ROC curve (AU C1 )
with the area under another ROC curve (AU C2 ). The ROC curve with a greater area usually allows a
more precise classifica on of objects.
Copyright ©2010-2014 PQStat So ware − All rights reserved
217
16
DIAGNOSTIC TESTS
Methods for comparing the areas depend on the model of the study.
• Dependent model − the compared ROC curves are constructed on the basis of measurements
made on the same objects.
Hypotheses:
H0 : AU C1 = AU C2 ,
H1 : AU C1 ̸= AU C2 .
The test sta s cs has the form presented below:
Z=
|AU C1 − AU C2 |
,
SEAU C1 −AU C2
where:
AU C1 , AU C2 and the standard error of the difference in areas SEAU C1 −AU C2 are
calculated on the basis of the nonparametric method proposed by DeLong (DeLong
E.R. et al., 1988[26], Hanley J.A., and Hajian-Tilaki K.O. 1997[38])
Sta s cs Z has (for large sizes) asympto c normal distribu on.
The p value, designated on the basis of the test sta s c, is compared with the significance level
α:
if p ≤ α =⇒
if p > α =⇒
reject H0 and accept H1 ,
there is no reason to reject H0 .
The window with se ngs for comparing dependent ROC curves is accessed via the menu Statistics→Diagnostic tests→Dependent ROC Curves − comparison.
Copyright ©2010-2014 PQStat So ware − All rights reserved
218
16
DIAGNOSTIC TESTS
• Independent model − the compared ROC curves are constructed on the basis of measurements
made on different objects.
Hypotheses:
H0 : AU C1 = AU C2 ,
H1 : AU C1 ̸= AU C2 .
Test sta s cs (Hanley J.A. and McNeil M.D. 1983[40]) has the form:
Z=√
|AU C1 − AU C2 |
2
2
SEAU
C1 − SEAU C2
,
where:
AU C1 , AU C2 and standard errors of areas SEAU C1 , SEAU C2 are calculated on the
basis of:
⋆ nonparametric method DeLong (DeLong E.R. et al. 1988[26], Hanley J.A., and
Hajian-Tilaki K.O. 1997[38]) - recommended,
⋆ nonparametric Hanley-McNeil method (Hanley J.A. and McNeil M.D. 1982[39]),
⋆ method which presumes double nega ve exponen al distribu on (Hanley J.A.
and McNeil M.D. 1982[39]) - computed only when groups (+) and (−) are equinumerous.
Sta s cs Z has (for large sizes) asympto c normal distribu on.
On the basis of test sta s cs p value is es mated and then compared with the significance level
α:
if p ≤ α =⇒
if p > α =⇒
we reject H0 and accept H1 ,
there is no basis for rejec ng H0 .
The window with se ngs for comparing independent ROC curves is accessed via the menu Statistics→Diagnostic tests→Independent ROC Curves − comparison.
Copyright ©2010-2014 PQStat So ware − All rights reserved
219
16
E
DIAGNOSTIC TESTS
(16.2) c.d. (bacteriemia.pqs file )
We will make 2 comparisons:
1) We will construct 2 ROC curves to compare the diagnos c value of parameters WBC and PCT;
2) We will construct 2 ROC curves to compare the diagnos c value of PCT parameter for boys and
girls.
ad1) Both parameters, WBC and PCT, are s mulants (in bacteremia their values are high). In the course
of the comparison of the diagnos c value of those parameters we verify the following hypotheses:
H0 : the area under ROC curve for WBC = the area under the ROC curve for PCT,
H1 : the area under ROC curve for WBC ̸= the area under the ROC curve for PCT.
Copyright ©2010-2014 PQStat So ware − All rights reserved
220
16
DIAGNOSTIC TESTS
The calculated ares are AU CW BC = 08613, AU CP CT = 0.8956. On the basis of the adopted
level α = 0.05, based on the obtained value p=0.13032 we conclude that we cannot determine
which of the parameters: WBC or PCT is be er for diagnosing bacteremia.
ad2) PCT parameter is a s mulant (its value is high in bacteremia). In the course of the comparison of
its diagnos c value for girls and boys we verify the following hypotheses:
H0 : the area under ROC curve for P CTf = the area under ROC curve for P CTm ,
H1 : the area under ROC curve for P CTf ̸= the area under ROC curve for P CTm .
Copyright ©2010-2014 PQStat So ware − All rights reserved
221
16
Copyright ©2010-2014 PQStat So ware − All rights reserved
DIAGNOSTIC TESTS
222
16
DIAGNOSTIC TESTS
The calculated areas are AU Cf = 0.8649, AU Cm = 0.9118. Therefore, on the basis of the
adopted level α = 0.05, based on the obtained value p=0.6372 we conclude that we cannot
select the sex for which PCT parameter is be er for diagnosing bacteremia.
Copyright ©2010-2014 PQStat So ware − All rights reserved
223
17 MULTIDIMENSIONAL MODELS
17 MULTIDIMENSIONAL MODELS
17.1 PREPARATION OF THE VARIABLES FOR THE ANALYSIS IN MULTIDIMENSIONAL MODELS
17.1.1 Variable coding in mul dimensional models
When preparing data for a mul dimensional analysis there is the problem of appropriate coding of
nominal and ordinal variables. That is an important element of preparing data for analysis as it is a key
factor in the interpreta on of the coefficients of a model. The nominal or ordinal variables divide the
analyzed objects into two or more categories. The dichotomous variables (in two categories, k = 2)
must only be appropriately coded, whereas the variables with many categories (k > 2) ought to be
divided into dummy variables with two categories and coded.
k = 2 If a variable is dichotomous, it is the decision of the researcher how the data represen ng the
variable will be entered, so any numerical codes can be entered, e.g. 0 and 1. In the program one
can change one's coding into effect coding by selec ng that op on in the window of the selected
mul dimensional analysis. Such coding causes a replacement of the smaller value with value -1
and of the greater value with value 1.
k > 2 If a variable has many categories then in the window of the selected mul dimensional analysis
we select the bu on Dummy variables and set the reference/base category for those variables
which we want to break into dummy variables. The variables will be dummy coded unless the
effect coding op on will be selected in the window of the analysis – in such a case, they will be
coded as -1, 0, and 1.
Dummy coding is employed in order to answer, with the use of mul dimensional models, the ques on:
How do the (Y ) results in any analyzed category differ from the results of the reference category.
The coding consists in ascribing value 0 or 1 to each category of the given variable. The category
coded as 0 is, then, the reference category.
k = 2 If the coded variable is dichotomous, then by placing it in a regression model we will obtain
the coefficient calculated for it, (bi ). The coefficient is the reference of the value of the dependent variable Y for category 1 to the reference category (corrected with the remaining
variables in the model).
k > 2 If the analyzed variable has more than two categories, then k categories are represented
by k −1 dummy variables with dummy coding. When crea ng variables with dummy coding
one selects a category for which no dummy category is created. That category is treated as
a reference category (as the value of each variable coded in the dummy coding is equal to
0. [0.2cm] When the X1 , X2 , ..., Xk−1 variables obtained in that way, with dummy coding,
are placed in a regression model, then their b1 , b2 , ..., bk−1 coefficients will be calculated.
b1 is the reference of the Y results (for codes 1 in X1 ) to the reference category (corrected
with the remaining variables in the model);
b2 is the reference of the Y results (for codes 1 in X2 ) to the reference category (corrected
with the remaining variables in the model);
...
bk−1 is the reference of the Y results (for codes 1 in Xk−1 ) to the reference category (corrected with the remaining variables in the model);
Example
We code, in accordance with dummy coding, the sex variable with two categories (the male sex
will be selected as the reference category), and the educa on variable with 4 categories (elementary educa on will be selected as the reference category).
Copyright ©2010-2014 PQStat So ware − All rights reserved
224
17 MULTIDIMENSIONAL MODELS
Sex
f
f
f
m
m
f
f
m
m
f
m
f
m
f
m
m
...
Coded
sex
1
1
1
0
0
1
1
0
0
1
0
1
0
1
0
0
...
Educa on
elementary
elementary
elementary
voca onal
voca onal
voca onal
voca onal
secondary
secondary
secondary
secondary
ter ary
ter ary
ter ary
ter ary
ter ary
...
Coded educa on
voca onal secondary ter ary
0
0
0
0
0
0
0
0
0
1
0
0
1
0
0
1
0
0
1
0
0
0
1
0
0
1
0
0
1
0
0
1
0
0
0
1
0
0
1
0
0
1
0
0
1
0
0
1
...
...
...
Building on the basis of dummy variables, in a mul ple regression model, we might want to check
what impact the variables have on a dependent variable, e.g. Y = the amount of earnings (in thousands of PLN). As a result of such an analysis we will obtain sample coefficients for each dummy
variable:
- for sex the sta s cally significant coefficient bi = −0.5, which means that average women's
wages are a half of a thousand PLN lower than men's wages, assuming that all other variables in
the model remain unchanged;
- for voca onal educa on the sta s cally significant coefficient bi = 0.6, which means that the
average wages of people with elementary educa on are 0.6 of a thousand PLN higher than those
of people with elementary educa on, assuming that all other variables in the model remain unchanged;
- for secondary educa on the sta s cally significant coefficient bi = 1, which means that the average wages of people with secondary educa on are a thousand PLN higher than those of people
with elementary educa on, assuming that all other variables in the model remain unchanged;
- for ter ary-level educa on the sta s cally significant coefficient bi = 1.5, which means that the
average wages of people with ter ary-level educa on are 1.5 PLN higher than those of people
with elementary educa on, assuming that all other variables in the model remain unchanged;
Effect coding is used to answer, with the use of mul dimensional models, the ques on: How do (Y )
results in each analyzed category differ from the results of the (unweighted) mean obtained from
the sample. The coding consists in ascribing value -1 or 1 to each category of the given variable.
The category coded as -1 is then the base category
k = 2 If the coded variable is dichotomous, then by placing it in a regression model we will obtain
the coefficient calculated for it, (bi ). The coefficient is the reference of Y for category 1 to
the unweighted general mean (corrected with the remaining variables in the model).
If the analyzed variable has more than two categories, then k categories are represented by k−1
dummy variables with effect coding. When crea ng variables with effect coding a category
is selected for which no separate variable is made. The category is treated in the models as
a base category (as in each variable made by effect coding it has values -1).
When the X1 , X2 , ..., Xk−1 variables obtained in that way, with effect coding, are placed in
Copyright ©2010-2014 PQStat So ware − All rights reserved
225
17 MULTIDIMENSIONAL MODELS
a regression model, then their b1 , b2 , ..., bk−1 coefficients will be calculated.
b1 is the reference of the Y results (for codes 1 in X1 ) to the unweighted general mean
(corrected by the remaining variables in the model);
b2 is the reference of the Y results (for codes 1 in X2 ) to the unweighted general mean
(corrected by the remaining variables in the model);
...
bk−1 is the reference of the Y results (for codes 1 in Xk−1 ) to the unweighted general mean
(corrected by the remaining variables in the model);
textbfExample
With the use of effect coding we will code the sex variable with two categories (the male category
will be the base category) and a variable informing about the region of residence in the analyzed
country. 5 regions were selected: northern, southern, eastern, western, and central. The central
region will be the base one.
Sex
f
f
f
m
m
f
f
m
m
f
m
f
m
f
m
m
...
Coded
sex
1
1
1
-1
-1
1
1
-1
-1
1
-1
1
-1
1
-1
-1
...
Regions
of residence
central
central
central
western
western
western
western
eastern
eastern
eastern
eastern
northern
northern
southern
southern
southern
...
western
-1
-1
-1
1
1
1
1
0
0
0
0
0
0
0
0
0
...
Coded regions
eastern northern
-1
-1
-1
-1
-1
-1
0
0
0
0
0
0
0
0
1
0
1
0
1
0
1
0
0
1
0
1
0
0
0
0
0
0
...
...
southern
-1
-1
-1
0
0
0
0
0
0
0
0
0
0
1
1
1
...
Building on the basis of dummy variables, in a mul ple regression model, we might want to check
what impact the variables have on a dependent variable, e.g. Y = the amount of earnings (expressed in thousands of PLN). As a result of such an analysis we will obtain sample coefficients
for each dummy variable:
- for sex the sta s cally significant coefficient bi = −0.5, which means that the average women's
wages are a half of a thousand PLN lower than the average wages in the country, assuming that
the other variables in the model remain unchanged;
- for the western region the sta s cally significant coefficient bi = 0.6, which means that the
average wages of people living in the western region of the country are 0.6 thousand PLN higher
than the average wages in the country, assuming that the other variables in the model remain
unchanged;
- for the eastern region the sta s cally significant coefficient bi = −1, which means that the
average wages of people living in the eastern region of the country are a thousand PLN lower
than the average wages in the country, assuming that the other variables in the model remain
unchanged;
- for the northern region the sta s cally significant coefficient bi = 0.4, which means that the
Copyright ©2010-2014 PQStat So ware − All rights reserved
226
17 MULTIDIMENSIONAL MODELS
average wages of people living in the western region of the country are 0.4 thousand PLN higher
than the average wages in the country, assuming that the other variables in the model remain
unchanged;
- for the southern region the sta s cally significant coefficient bi = 0.1, which means that the
average wages of people living in the southern region of the country do not differ in a sta s cally
significant manner from the average wages in the country, assuming that the other variables in
the model remain unchanged;
17.1.2 Interac ons
Interac ons are considered in mul dimensional models. Their presence means that the influence of
the independent variable (X1 ) on the dependent variable (Y ) differs depending on the level of another
independent variable (X2 ) or a series of other independent variables. To discuss the interac ons in
mul dimensional models one must determine the variables informing about possible interac ons, i.e
the product of appropriate variables. For that purpose we select the Interactions bu on in the window
of the selected mul dimensional analysis. In the window of interac ons se ngs, with the CTRL bu on
pressed, we determine the variables which are to form interac ons and transfer the variables into the
neighboring list with the use of an arrow. By pressing the OK bu on we will obtain appropriate columns
in the datasheet.
In the analysis of the interac on the choice of appropriate coding of dichotomous variables allows the
avoidance of the over-parametriza on related to interac ons. Over-parametriza on causes the effects
of the lower order for dichotomous variables to be redundant with respect to the confounding interacons of the higher order. As a result, the inclusion of the interac ons of the higher order in the model
annuls the effect of the interac ons of the lower orders, not allowing an appropriate evalua on of the
la er. In order to avoid the over-parametriza on in a model in which there are interac ons of dichotomous variables it is recommended to choose the op on effect coding.
17.2 MULTIPLE LINEAR REGRESSION
The window with se ngs for Multiple Regression is accessed via the menu Statistics → Multidimensional Models→Multiple Regression
Copyright ©2010-2014 PQStat So ware − All rights reserved
227
17 MULTIDIMENSIONAL MODELS
The constructed model of linear regression allows the study of the influence of many independent
variables(X1 , X2 , . . . , Xk ) on one dependent variable(Y ). The most frequently used variety of mulple regression is Mul ple Linear Regression. It is an extension of linear regression models based on
Pearson's linear correla on coefficient. It presumes the existence of a linear rela on between the studied variables. The linear model of mul ple regression has the form:
Y = β0 + β1 X1 + β2 X2 + . . . + βk Xk + ϵ.
where:
Y - dependent variable, explained by the model,
X1 , X2 , . . . Xk - independent variables, explanatory,
β0 , β1 , β2 , . . . βk - parameters,
ϵ - random parameter (model residual).
If the model was created on the basis of a data sample of size n the above equa on can be presented
in the form of a matrix:
Y = Xβ + ϵ.
where:
Y =
y1
y2
..
.
yn
,
X
=
1 x11 x21 . . . xk1
1 x12 x22 . . . xk2
..
..
..
..
..
.
.
.
.
.
1 x1n x2n . . . xkn
,
β
=
β0
β1
β2
..
.
,
ϵ
=
βk
ϵ1
ϵ2
..
.
.
ϵn
In such a case, the solu on of the equa on is the vector of the es mates of parameters β0 , β1 , . . . , βk
called regression coefficients:
Copyright ©2010-2014 PQStat So ware − All rights reserved
228
17 MULTIDIMENSIONAL MODELS
b=
b0
b1
b2
..
.
.
bk
Those coefficients are es mated with the help of the classical least squares method. On the basis of
those values we can infer the magnitude of the effect of the independent variable (for which the coefficient was es mated) on the dependent variable. They inform by how many units will the dependent
variable change when the independent variable is changed by 1 unit. There is a certain error of es maon for each coefficient. The magnitude of that error is es mated from the following formula:
√
1
SEb =
eT e(X T X)−1 ,
n − (k + 1)
where:
e = Y − Yb is the vector of model residuals (the difference between the actual values of
the dependent variable Y and the values Yb predicted on the basis of the model).
Note
When construc ng the model one should remember that the number of observa ons has to be greater
than or equal to the number of the es mated parameters of the model (n ≥ k + 1).
17.2.1 Model verifica on
• Sta s cal significance of par cular variables in the model.
On the basis of the coefficient and its error of es ma on we can infer if the independent variable
for which the coefficient was es mated has a significant effect on the dependent variable. For
that purpose we use t-test.
Hypotheses:
H0 : βi = 0,
H1 : βi ̸= 0.
Let us es mate the test sta s cs according to the formula below:
t=
bi
SEbi
The test sta s cs has t-Student distribu on with n − k degrees of freedom.
The p value, designated on the basis of the test sta s c, is compared with the significance level
α:
if p ≤ α =⇒
if p > α =⇒
reject H0 and accept H1 ,
there is no reason to reject H0 .
• The quality of the constructed model of mul ple linear regression can be evaluated with the
help of several measures.
– The standard error of es ma on − it is the measure of model adequacy:
√ ∑
n
2
i=1 ei
.
SEe =
n − (k + 1)
Copyright ©2010-2014 PQStat So ware − All rights reserved
229
17 MULTIDIMENSIONAL MODELS
The measure is based on model residuals ei = yi − ybi , that is on the discrepancy between
the actual values of the dependent variable yi in the sample and the values of the independent variable ybi es mated on the basis of the constructed model. It would be best if the
difference were as close to zero as possible for all studied proper es of the sample. Therefore, for the model to be well-fi ng, the standard error of es ma on (SEe ), expressed as
ei variance, should be the smallest possible.
√
– Mul ple correla on coefficient R = R2 ∈< 0; 1 > − defines the strength of the effect
of the set of variables X1 , X2 , . . . Xk on the dependent variable Y .
– Mul ple determina on coefficient R2 − it is the measure of model adequacy.
The value of that coefficient falls within the range of < 0; 1 >, where 1 means excellent
model adequacy, 0 − a complete lack of adequacy. The es ma on is made using the following formula:
TSS = ESS + RSS ,
where:
TSS − total sum of squares,
ESS − the sum of squares explained by the model,
RSS − residual sum of squares.
The coefficient of determina on is es mated from the formula:
TSS
.
R2 =
ESS
It expresses the percentage of the variability of the dependent variable explained by the
model.
As the value of the coefficient R2 depends on model adequacy but is also influenced by the
number of variables in the model and by the sample size, there are situa ons in which it
can be encumbered with a certain error. That is why a corrected value of that parameter is
es mated:
k(1 − R2 )
2
.
Radj
= R2 −
n − (k + 1)
– Sta s cal significance of all variables in the model
The basic tool for the evalua on of the significance of all variables in the model is the analysis of variance test (the F-test). The test simultaneously verifies 3 equivalent hypotheses:
H0 :
all βi = 0,
H0 :
R2 = 0,
H0 : linearity of the rela on,
H1 :
exists βi ̸= 0;
H1 :
R2 ̸= 0;
H1 : a lack of a linear rela on.
The test sta s cs has the form presented below:
EM S
F =
RM S
where:
ESS
EM S =
− the mean square explained by the model,
dfE
RSS
− residual mean square,
RM S =
dfR
dfE = k, dfR = n − (k + 1) − appropriate degrees of freedom.
That sta s cs is subject to F-Snedecor distribu on with dfE and dfR degrees of freedom.
The p value, designated on the basis of the test sta s c, is compared with the significance
level α:
if p ≤ α =⇒ reject H0 and accept H1 ,
if p > α =⇒ there is no reason to reject H0 .
Copyright ©2010-2014 PQStat So ware − All rights reserved
230
17 MULTIDIMENSIONAL MODELS
17.2.2 More informa on about the variables in the model
• Standardized b1 , b2 , . . . , bk − In contrast to raw parameters (which are expressed in different
units of measure, depending on the described variable, and are not directly comparable) the
standardized es mates of the parameters of the model allow the comparison of the contribu on
of par cular variables to the explana on of the variance of the dependent variable Y .
• Correla on matrix − contains informa on about the strength of the rela on between par cular
variables, that is the Pearson's correla on coefficient rp ∈< −1; 1 >. The coefficient is used for
the study of the corrrela on of each pair of variables, without taking into considera on the effect
of the remaining variables in the model.
• Covariance matrix − similarly to the correla on matrix it contains informa on about the linear
rela on among par cular variables. That value is not standardized.
• Par al correla on coefficient − falls within the range < −1; 1 > and is the measure of correlaon between the specific independent variable Xi (taking into account its correla on with the
remaining variables in the model) and the dependent variable Y (taking into account its correlaon with the remaining variables in the model).
The square of that coefficient is the par al determina on coefficient − it falls within the range
< 0; 1 > and defines the rela on of only the variance of the given independent variable Xi with
that variance of the dependent variable Y which was not explained by other variables in the
model.
The closer the value of those coefficients to 0, the more useless the informa on carried by the
studied variable, which means the variable is superfluous.
• Semipar al correla on coefficient − falls within the range < −1; 1 > and is the measure of
correla on between the specific independent variable Xi (taking into account its correla on with
the remaining variables in the model) and the dependent variable Y (NOT taking into account its
correla on with the remaining variables in the model).
The square of that coefficient is the semipar al determina on coefficient − it falls within the
range < 0; 1 > and defines the rela on of only the variance of the given independent variable
Xi with the complete variance of the dependent variable Y .
The closer the value of those coefficients to 0, the more useless the informa on carried by the
studied variable, which means the variable is superfluous.
• R-squared (R2 ∈< 0; 1 >) - it represents the percentage of variance of the given independent
variable Xi , explained by the remaining independent variables. The closer to value 1 the stronger
the linear rela on of the studied variable with the remaining independent variables, which can
mean that the variable is a superfluous one.
• Tolerance = 1 − R2 ∈< 0; 1 > − it represents the percentage of variance of the given independent variable Xi , NOT explained by the remaining independent variables. The closer the value
of tolerance is to 0 the stronger the linear rela on of the studied variable with the remaining
independent variables, which can mean that the variable is a superfluous one.
• A comparison of a full model with a model in which a given variable is removed
The comparison of the two model is made with by means of:
– F test, in a situa on in which one variable or more are removed from the model (see: the
comparison of models),
– t-test, when only one variable is removed from the model. It is the same test that is used
for studying the significance of par cular variables in the model.
Copyright ©2010-2014 PQStat So ware − All rights reserved
231
17 MULTIDIMENSIONAL MODELS
In the case of removing only one variable the results of both tests are iden cal.
If the difference between the compared models is sta s cally significant (the value p ≤ α), the
full model is significantly be er than the reduced model. It means that the studied variable is not
superfluous, it has a significant effect on the given model and should not be removed from it.
• Sca er plots
The charts allow a subjec ve evalua on of linearity of the rela on among the variables and an
iden fica on of outliers. Addi onally, sca er plots can be useful in an analysis of model residuals.
17.2.3 Analysis of model residuals
To obtain a correct regression model we should check the basic assump ons concerning model residuals.
• Outliers
The study of the model residual can be a quick source of knowledge about outlier values. Such
observa ons can disturb the equa on of the regression to a large extent because they have a
great effect on the values of the coefficients in the equa on. If the given residual ei deviates by
more than 3 standard devia ons from the mean value, such an observa on can be classified as
an outlier. A removal of an outlier can greatly enhance the model.
• Normality of distribu on of model residuals
The assump on is checked with the help of Lilliefors test. A big difference between the residuals distribu on and the normal distribu on (the value p ≤ α) can impair the evalua on of the
significance of the coefficients of par cular variables in the model.
• Homoscedas city (homogeneity of variance)
To check if there are areas in which the variance of model residuals is increased or decreased we
use the charts of:
– the residual with respect to predicted values
– the square of the residual with respect to predicted values
– the residual with respect to observed values
– the square of the residual with respect to observed values
• Autocorrela on of model residuals
For the constructed model to be deemed correct the values of residuals should not be correlated with one another (for all pairs ei , ej ). The assump on can be checked by by compu ng the
Durbin-Watson sta s c.
∑n
(et − et−1 )2
d = t=2∑n 2
,
t=1 et
To test for posi ve autocorrela on on the significance level α we check the posi on of the sta scs d with respect to the upper (dU,α ) and lower (dL,α ) cri cal value:
– If d < dL,α − the errors are posi vely correlated;
– If d > dU,α − the errors are not posi vely correlated;
– If dL,α < d < dU,α − the test result is ambiguous.
To test for nega ve autocorrela on on the significance level α we check the posi on of the value
4 − d with respect to the upper (dU,α ) and lower (dL,α ) cri cal value:
– If 4 − d < dL,α − the errors are nega vely correlated;
Copyright ©2010-2014 PQStat So ware − All rights reserved
232
17 MULTIDIMENSIONAL MODELS
– If 4 − d > dU,α − the errors are not nega vely correlated;
– If dL,α < 4 − d < dU,α − the test result is ambiguous.
The cri cal values of the Durbin-Watson test for the significance level α = 0.05 are on the website
www.pqstat.com − the source of the: Savin and White tables (1977)[74]
17.2.4 Predic on on the basis of the model
Most o en, the last stage of regression analysis is the use of the constructed and verified model for
predic on. Predic ng the value of the dependent variable is possible for the studied values of independent variables. The computed value is es mated with a certain error. That is why, addi onally, limits
resul ng from error are es mated for the es mated value:
• for the expected value, confidence limits are es mated,
• for a single point, predic on limits are es mated.
E
17.1. (publisher.pqs file)
A certain book publisher wanted to learn how was gross profit from sales influenced by such variables as:
produc on cost, adver sing costs, direct promo on cost, the sum of discounts made, and the author's
popularity. For that purpose he analyzed 40 tles published during the previous year. A part of the data
is presented in the image below:
The first five variables are expressed in thousands fo dollars - so they are variables gathered on an interval scale. The last variable: the author's popularity − is a dychotomic variable, where 1 stands for a
known author, and 0 stands for an unknown author.
On the basis of the knowledge gained from the analysis the publisher wants to predict the gross profit
from the next published book wri en by a known author. The expenses the publisher will bear are:
produc on cost ≈ 11, adver sing costs ≈ 13, direct promo on costs ≈ 0.5, the sum of discounts made
≈ 0.5.
We construct the model of mul ple linear regression, selec ng: gross profit − as the dependent variable Y , produc on cost, adver sing costs, direct promo on costs, the sum of discounts made, the
author's popularity − as the independent variables X1 , X2 , X3 , X4 , X5 . As a result, the coefficients of
the regression equa on will be es mated, together with measures which will allow the evalua on of
the quality of the model.
Copyright ©2010-2014 PQStat So ware − All rights reserved
233
17 MULTIDIMENSIONAL MODELS
On the basis of the es mated value of the coefficient b, the rela onship between gross profit and all
independent variables can be described by means of the equa on:
prof itgross = 4.18+2.56(cprod )+2(cadv )+4.67(cprom )+1.42(discounts)+10.15(populauthor )+[8.09]
The obtained coefficients are interpreted in the following manner:
• If the produc on cost increases by 1 thousand dollars, then gross profit will increase by about
2.56 thousand dollars, assuming that the remaining variables do not change;
• If the produc on cost increases by 1 thousand dollars, then gross profit will increase by about 2
thousand dollars, assuming that the remaining variables do not change;
• If the produc on cost increases by 1 thousand dollars, then gross profit will increase by about
4.67 thousand dollars, assuming that the remaining variables do not change;
• If the sum of the discounts made increases by 1 thousand dollars, then gross profit will increase
by about 1.42 thousand dollars, assuming that the remaining variables do not change;
• If the book has been wri en by a known author (marked as 1), then in the model the author's
popularity is assumed to be the value 1 and we get the equa on:
prof itgross = 14.33 + 2.56(cprod ) + 2(cadv ) + 4.67(cprom ) + 1.42(discounts)
If the book has been wri en by an unknown author (marked as 0), then in the model the author's
popularity is assumed to be the value 0 and we get the equa on:
prof itgross = 4.18 + 2.56(cprod ) + 2(cadv ) + 4.67(cprom ) + 1.42(discounts)
Copyright ©2010-2014 PQStat So ware − All rights reserved
234
17 MULTIDIMENSIONAL MODELS
The result of t-test for each variable shows that only the produc on cost, adver sing costs, and author's
popularity have a significant influence on the profit gained. At the same me, that standardized coefficients b are the greatest for those variables.
Addi onally, the model is very well-fi ng, which is confirmed by: the small standard error of es maon SEe = 8.086501, the high value of the mul ple determina on coefficient R2 = 0.850974, the
2 = 0.829059, and the result of the F-test of variance
corrected mul ple determina on coefficient Radj
analysis: p < 0.000001.
On the basis of the interpreta on of the results obtained so far we can assume that a part of the variables does not have a significant effect on the profit and can be superfluous.
For the model to be well formulated the interval independent variables ought to be strongly correlated
with the dependent variable and be rela vely weakly correlated with one another. That can be checked
by compu ng the correla on matrix and the covariance matrix:
The most coherent informa on which allows finding those variables in the model which are superfluous
is given by the parial and semipar al correla on analysis as well as redundancy analysis:
The values of coefficients of par al and semipar al correla on indicate that the smallest contribu on
into the constructed model is that of direct promo on costs and the sum of discounts made. However,
those variables are the least correlated with model residuals, which is indicated by the low value R2
and the high tolerance value. All in all, from the sta s cal point of view, models without those variables
would not be worse than the current model (see the result of t-test for model comparison). The decision
Copyright ©2010-2014 PQStat So ware − All rights reserved
235
17 MULTIDIMENSIONAL MODELS
about whether or not to leave that model or to construct a new one without the direct promo on costs
and the sum of discounts made, belongs to the researcher. We will leave the current model.
Finally, we will analyze the residuals. A part of that analysis is presented below:
It is no ceable that one of the model residuals is an outlier − it deviates by more than 3 standard
devia ons from the mean value. It is observa on number 16. The observa on can be easily found by
drawing a chart of residuals with respect to observed or expected values of the variable Y .
Copyright ©2010-2014 PQStat So ware − All rights reserved
236
17 MULTIDIMENSIONAL MODELS
That outlier undermines the assump on concerning homoscedas city. The assump on of homoscedascity would be confirmed (that is, residuals variance presented on the axis Y would be similar when
we move along the axis X), if we rejected that point. Addi onally, the distribu on of residuals deviates
slightly from normal distribu on (the value p of Liliefors test is p = 0.016415):
When we take a closer look of the outlier (posi on 16 in the data for the task) we see that the book is
the only one for which the costs are higher than gross profit (gross profit=4 thousand dollars, the sum
of costs = (8+6+0.33+1.6) = 15.93 thousand dollars).
The obtained model can be corrected by removing the outlier. For that purpose, another analysis has
to be conducted, with a filter switched on which will exclude the outlier.
As a result, we receive a model which is very similar to the previous one but is encumbered with a
smaller error and is more adequate:
Copyright ©2010-2014 PQStat So ware − All rights reserved
237
17 MULTIDIMENSIONAL MODELS
prof itgross = 6.89+2.68(cprod )+2.08(cadv )+1.92(cprom )+1.33(discounts)+7.38(populauthor )+[4.86]
The final version of the model will be used for predic on. On the basis of the predicted costs amoun ng
to:
produc on cost ≈ 11 thousand dollars,
adver sing costs ≈ 13 thousand dollars,
direct promo on costs ≈ 0.5 thousand dollars,
the sum of discounts made ≈ 0.5 thousand dollars,
and the fact that the author is known (the author's popularity ≈ 1) we calculate the predicted gross
profit together with the confidence interval:
Copyright ©2010-2014 PQStat So ware − All rights reserved
238
17 MULTIDIMENSIONAL MODELS
The predicted profit is 72 thousand dollars.
Note
To be able to consider the nominal independent variable in many categories in the model, the variable
ought to be decomposed into several dummy variables, in 2 categories, before the analysis
Note
To take into considera on the interac ons of independent variables, a variable which is the result of
mul plying the variables par cipa ng in the interac on ought to be introduced into the model.
Copyright ©2010-2014 PQStat So ware − All rights reserved
239
17 MULTIDIMENSIONAL MODELS
17.3 COMPARISON OF MULTIPLE LINEAR REGRESSION MODELS
The window with se ngs for model comparison is accessed via the menu Statistics → Multidimensional
models→Multiple regression − model comparison
The mul ple linear regression offers the possibility of simultaneous analysis of many independent variables. There appears, then, the problem of choosing the op mum model. Too large a model involves
a plethora of informa on in which the important ones may get lost. Too small a model involves the
risk of omi ng those features which could describe the studied phenomenon in a reliable manner.
Because it is not the number of variables in the model but their quality that determines the quality
of the model. To make a proper selec on of independent variables it is necessary to have knowledge
and experience connected with the studied phenomenon. One has to remember to put into the model
variables strongly correlated with the dependent variable and weakly correlated with one another.
There is no single, simple sta s cal rule which would decide about the number of variables necessary
2 −
in the model. The measures of model adequacy most frequently used in a comparison are: Radj
the corrected value of mul ple determina on coefficient (the higher the value the more adequate the
model), SEe − the standard error of es ma on (the lower the value the more adequate the model).
For that purpose, the F-test based on the mul ple determina on coefficient R2 can also be used. The
test is used to verify the hypothesis that the adequacy of both compared models is equally good.
Hypotheses:
2 ,
H0 : RF2 M = RRM
2
2 ,
H1 : RF M ̸= RRM
where:
2
RF2 M , RRM
− mul ple determina on coefficients in compared models (full and reduced).
Copyright ©2010-2014 PQStat So ware − All rights reserved
240
17 MULTIDIMENSIONAL MODELS
The test sta s cs has the form presented below:
F =
2
RF2 M − RRM
n − kF M − 1
·
,
kF M − kRM
1 − RF2 M
The sta s cs is subject to F-Snedecor distribu on with df1 = kF M − kRM and df2 = n − kF M − 1
degrees of freedom.
The p value, designated on the basis of the test sta s c, is compared with the significance level α:
if p ≤ α =⇒
if p > α =⇒
reject H0 and accept H1 ,
there is no reason to reject H0 .
If the compared models do not differ significantly, we should select the one with a smaller number of
variables. Because a lack of a difference means that the variables present in the full model but absent
from the reduced model do not carry significant informa on. However, if the difference in the quality of
model adequacy is sta s cally significant, it means that one of them (the one with the greater number
of variables, with a greater R2 ) is significantly be er than the other one.
In the program PQStat the comparison of models can be done manually or automa cally.
• Manual model comparison − construc on of 2 models:
– a full model − a model with a greater number of variables,
– a reduced model − a model with a smaller number of variables − such a model is created
from the full model by removing those variables which are superfluous from the perspec ve
of studying a given phenomenon.
The choice of independent variables in the compared models and, subsequently, the choice of a
be er model on the basis of the results of the comparison, is made by the researcher.
• Automa c model comparison is done in several steps:
step 1 Construc ng the model with the use of all variables.
step 2 Removing one variable from the model. The removed variable is the one which,
from the sta s cal point of view, contributes the least informa on to the current
model.
step 3 A comparison of the full and the reduced model.
step 4 Removing another variable from the model. The removed variable is the one
which, from the sta s cal point of view, contributes the least informa on to the
current model.
step 5 A comparison of the previous and the newly reduced model.
...
In that way numerous, ever smaller models are created. The last model only contains 1 independent variable.
2 , SE ), and the subAs a result, each model is described with the help of adequacy measures (Radj
e
sequent (neighboring) models are compared by means of the F-test. The model which is finally
2 and the smallest SE . However,
marked as sta s cally best is the model with the greatest Radj
e
as none of the sta s cal methods cannot give a full answer to the ques on which of the models
is the best, it is the researcher who should choose the model on the basis of the results.
Copyright ©2010-2014 PQStat So ware − All rights reserved
241
17 MULTIDIMENSIONAL MODELS
E
(17.1) c.d. (publisher.pqs file)
To predict the gross profit from book sales a publisher wants to consider such variables as: produc on
cost, adver sing costs, direct promo on cost, the sum of discounts made, and the author's popularity.
However, not all of those variables need to have a significant effect on profit. Let us try to select such a
model of linear regression which will contain the op mum number of variables (from the perspec ve
of sta s cs).
• Manual model comparison.
On the basis of the erlier constructed, full model we can suspect that the variables: direct promo on costs and the sum of discounts made have a small influence on the constructed model
(i.e. those variables do not help predict the greatness of the profit). We will check if, from the
perspec ve of sta s cs, the full model is be er than the model from which the two variables
have been removed.
Copyright ©2010-2014 PQStat So ware − All rights reserved
242
17 MULTIDIMENSIONAL MODELS
It turns out that there is no basis for thinking that the full model is be er than the reduced model
(the value p of F-test which is used for comparing models is p = 0.401345). Addi onally, the
2
reduced model is slightly more adequate than the full model (for the reduced model Radj
=
2
0.82964880, for the full model Radj = 0.82905898.
• Automa c model comparison.
In the case of automa c model comparison we receive very similar results. The best model is the
2 and the smalles standard es ma on error SE . The best
one with the greatest coefficient Radj
e
model we suggest is the model containing only 3 independent variables: the produc on cost,
adver sing costs, and the author's popularity.
On the basis of the analyses above, from the perspec ve of sta s cs, the op mum model is the model
with the 3 most important independent variables: the produc on cost, adver sing costs, and the author's popularity. However, the final decision which model to choose should be made by a person
with specialist knowledge about the studied topic − in this case, the publisher. It ought to be remembered that the selected model should be constructed anew and its assump ons verified in the window
Multiple regression.
Copyright ©2010-2014 PQStat So ware − All rights reserved
243
17 MULTIDIMENSIONAL MODELS
17.4 LOGISTIC REGRESSION
The window with se ngs for Logistic Regression is accessed via the menu Statistics→Multidimensional
Models→Logistic Regression
The constructed model of logis c regression (similarly to the case of mul ple linear regression) allows
the study of the effect of many independent variables (X1 , X2 , ..., Xk ) on one dependent variable(Y ).
This me, however, the dependent variable only assumes two values, e.g. ill/healthy, insolvent/solvent
etc.
The two values are coded as (1)/(0), where:
(1) –the dis nguished value –possessing the feature
(0) –not possessing the feature.
The func on on which the model of logis c regression is based does not calculate the 2-level variable
Y but the probability of that variable assuming the dis nguished value:
P (Y = 1|X1 , X2 , ..., Xk ) =
eZ
1 + eZ
where:
P (Y = 1|X1 , X2 , ..., Xk ) –the probability of assuming the dis nguished value (1) on condi on that specific values of independent variables are achieved, the so-called probability
predicted for 1.
Z is most o en expressed in the form of a linear rela onship:
Z = β0 +
∑k
i=1 βi Xi ,
X1 , X2 , . . . Xk –independent variables, explanatory,
β0 , β1 , β2 , . . . βk –parameters.
Copyright ©2010-2014 PQStat So ware − All rights reserved
244
17 MULTIDIMENSIONAL MODELS
Note!
Func on Z can also be described with the use of a higher order rela onship, e.g. a square
rela onship - in such a case we introduce into the model a variable containing the square
of the independent variable Xi2 .
Note!
Func on Z can containt variable interac ons - in such a case we introduce into the model
a variable which is the result of mul plying the variables par cipa ng in the interac on,
e.g. X1 × X2 .
The logit is the transforma on of that model into the form:
)
(
P
= Z.
ln
1−P
The matrices involved in the equa on, for a sample of size n, are recorded in the following manner:
β0
y1
1 x11 x21 . . . xk1
β1
y2
1 x12 x22 . . . xk2
Y = . , X = .
, β = β2 .
.
.
.
.
.
.
.
.
.
.
.
.
.
.
.
.
.
..
yn
1 x1n x2n . . . xkn
βk
In such a case, the solu on of the equa on is the vector of the es mates of parameters β0 , β1 , . . . , βk
called regression coefficients:
b=
b0
b1
b2
..
.
.
bk
The coefficients are es mated with the use of the maximum likelihood method, that is through the
search for the maximum value of likelihood func on L (in the program the Newton-Raphson itera ve
algorithm was used). On the basis of those values we can infer the magnitude of the effect of the
independent variable (for which the coefficient was es mated) on the dependent variable.
There is a certain error of es ma on for each coefficient. The magnitude of that error is es mated from
the following formula:
√
SEb = diag(H −1 )b ,
where:
diag(H −1 ) is the main diagonal of the covariance matrix.
Note!
When building the model you need remember that the number of observa ons should be ten mes
greater than or equal to the number of the es mated parameters of the model (n ≥ 10(k + 1)).
Note!
When building the model you need remember that the independent variables should not be mul collinear. In a case of mul collinearity es ma on can be uncertain and the obtained error values very
high. The mul collinear variables should be removed from the model or one independent variable
should be built of them, e.g. instead of the mul collinear variables of mother age and father age one
Copyright ©2010-2014 PQStat So ware − All rights reserved
245
17 MULTIDIMENSIONAL MODELS
can build the parents age variable.
Note!
The criterion of convergence of the func on of the Newton-Raphson itera ve algorithm can be controlled with the help of two parameters: the limit of convergence itera on (it gives the maximum number of itera ons in which the algorithm should reach convergence) and the convergence criterion (it
gives the value below which the received improvement of es ma on shall be considered to be insignificant and the algorithm will stop).
17.4.1 Odds Ra o
Individual Odds Ra o
On the basis of many coefficients, for each independent variable in the model an easily interpreted measure is es mated, i.e. the individual Odds Ra o:
ORi = eβi .
The received Odds Ra o expresses the change of the odds for the occurrence of the dis nguished
value (1) when the independent variable grows by 1 unit. The result is corrected with the remaining independent variables in the model so that it is assumed that they remain at a stable level
while the studied variable is growing by 1 unit.
The OR value is interpreted as follows:
• OR > 1 means the s mula ng influence of the studied independent variable on obtaining
the dis nguished value (1), i.e. it gives informa on about how much greater are the odds
of the occurrence of the dis nguished value (1) when the independent variable grows by 1
unit.
• OR < 1 means the des mula ng influence of the studied independent variable on obtaining the dis nguished value (1), i.e. it gives informa on about how much lower are the odds
of the occurrence of the dis nguished value (1) when the independent variable grows by 1
unit.
• OR ≈ 1 means that the studied independent variable has no influence on obtaining the
dis nguished value (1).
Odds Ra o - the general formula
The PQStat program calculates the individual Odds Ra o. Its modifica on on the basis of a general
formula makes it possible to change the interpreta on of the obtained result.
The Odds Ra o for the occurrence of the dis nguished state in a general case is calculated as
the ra o of two odds. Therefore for the independent variable X1 for Z expressed with a linear
rela onship we calculate:
the odds for the first category:
Odds(1) =
P (1)
= eZ (1) = eβ0 +β1 X1 (1)+β2 X2 +...+βk Xk ,
1 − P (1)
the odds for the second category:
Odds(2) =
P (2)
= eZ (2) = eβ0 +β1 X1 (2)+β2 X2 +...+βk Xk .
1 − P (2)
Copyright ©2010-2014 PQStat So ware − All rights reserved
246
17 MULTIDIMENSIONAL MODELS
The Odds Ra o for variable X1 is then expressed with the formula:
β +β X (2)+β X +...+β X
2 2
k k
e 0 1 1
OR1 (2)/(1) = Odds(2)
Odds(1) = eβ0 +β1 X1 (1)+β2 X2 +...+βk Xk
= eβ0 +β1 X1 (2)+β2 X2 +...+βk Xk −[β0 +β1 X1 (1)+β2 X2 +...+βk Xk ]
= eβ1 X1 (2)−β1 X1 (1) = eβ1 [X1 (2)−X1 (1)] =
( )[X (2)−X1 (1)]
= eβ1 1
.
Example
If the independent variable is age expressed in years, then the difference between neighboring
age categories such as 25 and 26 years is 1 year (X1 (2) − X1 (1) = 26 − 25 = 1). In such a case
we will obtain the individual Odds Ra o:
( )1
OR = eβ1 ,
which expresses the degree of change of the odds for the occurrence of the dis nguished value
if the age is changed by 1 year.
The odds ra o calculated for non-neighboring variable categories, such as 25 and 30 years, will
be a five-year Odds Ra o, because the difference X1 (2) − X1 (1) = 30 − 25 = 5. In such a case
we will obtain the five-year Odds Ra o:
( )5
OR = eβ1 ,
which expresses the degree of change of the odds for the occurrence of the dis nguished value
if the age is changed by 5 years.
Note!
If the analysis is made for a non-linear model or if interac on is taken into account, then, on the
basis of a general formula, we can calculate an appropriate Odds Ra o by changing the formula
which expresses Z.
17.4.2 Model verifica on
Sta s cal significance of par cular variables in the model (significance of the Odds Ra o)
On the basis of the coefficient and its error of es ma on we can infer if the independent variable
for which the coefficient was es mated has a significant effect on the dependent variable. For
that purpose we use Wald test.
Hypotheses:
H0 : βi = 0,
H0 : ORi = 1,
or, equivalently:
H1 : βi ̸= 0.
H1 : ORi =
̸ 1.
The Wald test sta s cs is calculated according to the formula:
(
)2
bi
2
χ =
SEbi
The sta s c asympto cally (for large sizes) has the χ2 distribu on with 1 degree of freedom.
On the basis of test sta s cs, p value is es mated and then compared with the significance level
α:
Copyright ©2010-2014 PQStat So ware − All rights reserved
247
17 MULTIDIMENSIONAL MODELS
if p ≤ α =⇒
if p > α =⇒
we reject H0 and accept H1 ,
there is no reason to reject H0 .
The quality of the constructed model of mul ple linear regression can be evaluated with the help of
several measures
• Pseudo R2 –is a goodness of fit measure of the model (an equivalent of the coefficient of
mul ple determina on R2 defined for mul ple linear regression).
The value of that coefficient falls within the range of < 0; 1), where values close to 1 mean
excellent goodness of fit of a model, 0 –a complete lack of fit Coefficient RP2 seudo is calculated according to the formula:
RP2 seudo = 1 −
ln LF M
.
ln L0
where:
LF M –the maximum value of likelihood func on of a full model (with all variables),
L0 –the maximum value of likelihood func on of a model which only contains a
intercept.
As coefficient RP2 seudo never assumes value 1 and is sensi ve to the amount of variables in
the model, its corrected value is calculated:
2
RN
agelkerke =
1 − e−(2/n)(ln LF M −ln L0 )
1 − e(2/n) ln L0
lub
2
RCox−Snell
=1−e
(−2 ln L0 )−(−2 ln LF M )
n
.
• Sta s cal significance of all variables in the model
The basic tool for the evalua on of the significance of all variables in the model is the Likelihood Ra o test. The test verifies the hypothesis:
H0 :
all βi = 0,
H1 : there is βi ̸= 0.
The test sta s c has the form presented below:
χ2 = −2 ln(L0 /LF M ) = −2 ln(L0 ) − (−2 ln(LF M )).
The sta s c asympto cally (for large sizes) has the χ2 distribu on with k degrees of freedom.
On the basis of test sta s cs, p value is es mated and then compared with α :
if p ≤ α =⇒
if p > α =⇒
we reject H0 and accept H1 ,
there is no reason to reject H0 .
• Hosmer-Lemeshow test –The test compares, for various subgroups of data, the observed
rates of occurrence of the dis nguished value Og and the predicted probability Eg . If Og
and Eg are close enough then one can assume that an adequate model has been built.
For the calcula on the observa ons are first divided into G subgroups –usually deciles (G =
10).
Hypotheses:
H0 : Og = Eg for all categories,
H1 : Og ̸= Eg for at least one category.
Copyright ©2010-2014 PQStat So ware − All rights reserved
248
17 MULTIDIMENSIONAL MODELS
The test sta s c has the form presented below:
H=
G
∑
(Og − Eg )2
g=1
Eg (1 −
Eg
Ng )
,
where:
Ng –the number of observa ons in group g.
The sta s c asympto cally (for large sizes) has the χ2 distribu on with G − 2 degrees of
freedom.
On the basis of test sta s cs, p value is es mated and then compared with α :
if p ≤ α =⇒
if p > α =⇒
we reject H0 and accept H1 ,
there is no reason to reject H0 .
• AUC - the area under the ROC curve –The ROC curve built on th ebasis of the value of
the dependent variable, and the predicted probability of dependent variable P , allows to
evaluate the ability of the constructed logis c regression model to classify the cases into two
groups: (1) and (0). The constructed curve, especially the area under the curve, presents
the classifica on quality of the model. When the ROC curve overlaps with the diagonal
y = x, then the decision about classifying a case within a given class (1) or (0), made on the
basis of the model, is as good as a random division of the studied cases into the groups. The
classifica on quality of a model is good when the curve is much above the diagonal y = x,
that is when the area under the ROC curve is much larger than the area under the y = x
line, i.e. it is greater than 0.5
Hypotheses:
H0 : AU C = 0.5,
H1 : AU C ̸= 0.5.
The test sta s c has the form presented below:
Z=
AU C − 0.5
,
SE0.5
where:
SE0.5 –area error.
Sta s cs Z asympto cally (for large sizes) has the normal distribu on.
On the basis of test sta s cs, p value is es mated and then compared with the significance
level α:
if p ≤ α =⇒
if p > α =⇒
we reject H0 and accept H1 ,
there is no reason to reject H0 .
Addi onally, for ROC curve the suggested value of the cut-off point of the predicted probability is given, together with the table of sensi vity and specificity for each possible cut-off
point.
Note!
More possibili es of calcula ng a cut-off point are offered by module ROC curve. The analysis is made on the basis of observed values and predicted probability obtained in the analysis
of Logis c Regression.
Copyright ©2010-2014 PQStat So ware − All rights reserved
249
17 MULTIDIMENSIONAL MODELS
• Classifica on
On the basis of the selected cut-off point of predicted probability we can change the classifica on quality. By default the cut-off point has the value of 0.5. The user can change the
value into any value from the range of (0.1), e.g. the value suggested by the ROC curve.
As a result we shall obtain the classifica on table and the percentage of properly classified
cases, the percentage of properly classified (0) –specificity, and the percentage of properly
classified (1) –sensi vity.
Predic on on the basis of the model
On the basis of a selected cut-off point of predicted probability and of the given values of independent variables we can calculate the predicted value of the dependent value (0) or (1). By
default the cut-off point has the value of 0.5. The user can change the value into any value from
the range of (0.1), e.g. the value suggested by the ROC curve.
E
17.2. ( anomaly.pqs file)
Studies have been conducted for the purpose of iden fying the risk factors for a certain rare congenital
anomaly in children. 395 mothers of children with that anomaly and 375 of healthy children have
par cipated in that study. The gathered data are: address of residence, child's sex, child's weight at
birth, mother's age, number of pregnancy, previous spontaneous abor ons, respiratory tract infec ons,
smoking, mother's educa on.
We construct a logis c regression model to check which variables may have a significant influence on
the occurrence of the anomaly. The dependent variable is the column GROUP, the dis nguished values
in that variable as 1 are the ''cases'', that are mothers of children with anomaly. The following 9 variables
are independent variables:
AddressOfRes (2=city/1=village),
Sex (1=male/0=female),
BirthWeight (in kilograms, with an accuracy of 0.5 kg),
MAge (in years),
PregNo (which pregnancy is the child from),
SponAbort (1=yes/0=no),
RespTInf (1=yes/0=no),
Smoking (1=yes/0=no),
MEdu (1=primary or lower/2=voca onal/3=secondary/4=ter ary).
Copyright ©2010-2014 PQStat So ware − All rights reserved
250
17 MULTIDIMENSIONAL MODELS
2
2
The quality of model goodness of fit is not high (RP2 seudo = 0.11, RN
agelkerke = 0.19 i RCox−Snell =
0.14). At the same me the model is sta s cally significant (value p < 0.000001 of the Likelihood Ra o
test), which means that a part of the independent variables in the model is sta s cally significant. The
result of the Hosmer-Lemeshow test points to a lack of significance (p = 0.2753). However, in the case
of the Hosmer-Lemeshow test we ought to remember that a lack of significance is desired as it indicates
a similarity of the observed sizes and of predicted probability.
An interpreta on of par cular variables in the model starts from checking their significance. In this case
the variables which are significantly related to the occurrence of the anomaly are:
Copyright ©2010-2014 PQStat So ware − All rights reserved
251
17 MULTIDIMENSIONAL MODELS
Sex: p = 0.0063,
BirthWeight: p = 0.0188,
PregNo: p = 0.0035,
RespTInf: p < 0.000001,
Smoking: p = 0.0003.
The studied congenital anomaly is a rare anomaly but the odds of its occurrence depend on the variables
listed above in the manner described by the odds ra o:
• variable Sex: OR[95%CI] = 1.60[1.14; 2.22] –the odds of the occurrence of the anomaly in a
boy is 1.6 mes greater than in a girl;
• variable BirthWeight: OR[95%CI] = 0.74[0.57; 0.95] –the higher the birth weight the smaller
the odds of the occurrence of the anomaly in a child;
• variable PregNo: OR[95%CI] = 1.34[1.10; 1.63] –the odds of the occurrence of the anomaly in
a child is 1.34 mes greater with each subsequent pregnancy;
• variable RespTInf: OR[95%CI] = 4.46[2.59; 7.69] –the odds of the occurrence of the anomaly
in a child if the mother had a respiratory tract infec on during the pregnancy is 4.46 mes greater
than in a mother who did not have such an infec on during the pregnancy;
• variable Smoking: OR[95%CI] = 4.44[1.98; 9.96] –a mother who smokes when pregnant increases the risk of the occurrence of the anomaly in her child 4.44 mes.
In the case of sta s cally insignificant variables the confidence interval for the Odds Ra o contains 1
which means that the variables neither increase nor decrease the odds of the occurrence of the studied
anomaly. Therefore, we cannot interpret the obtained ra o in a manner similar to the case of sta s cally significant variables.
The influence of par cular independent variables on the occurrence of the anomaly can also be described with the help of a chart concerning the odds ra o:
Copyright ©2010-2014 PQStat So ware − All rights reserved
252
17 MULTIDIMENSIONAL MODELS
Note!
An independent variable with a few categories can be considered in the model as dummy variables.
In such a case, before the commencement of the analysis one should divide that variable into a few
dummy variables with 2 categories.
E
17.2 c.d. (anomaly.pqs)
Let us once more construct a logis c regression model, however, this me let us divide the variable
mother's educa on into dummy variables. With this opera on we lose the informa on about the ordering of the category of educa on but we gain the possibility of a more in-depth analysis of par cular
categories. The division into dummy variables was made by crea ng 3 variables concerning mother's
educa on:
Voca onalE (1=yes/0=no),
SecondaryE (1=yes/0=no),
Ter aryE (1=yes/0=no).
The primary educa on variable is missing as it will cons tute the reference category.
Copyright ©2010-2014 PQStat So ware − All rights reserved
253
17 MULTIDIMENSIONAL MODELS
As a result the variables which describe educa on become sta s cally significant. The goodness of fit of
the model does not change much but the manner of interpreta on of the the odds ra o for educa on
does change:
Variable
Primary educa on
Voca onal educa on
Secondary educa on
Ter ary educa on
OR[95%CI]
reference category
0.51[0.26; 0.99]
0.42[0.22; 0.80]
0.45[0.22; 0.92]
The odds of the occurrence of the studied anomaly in each educa on category is always compared with
the odds of the occurrence of the anomaly in the case of primary educa on. We can see that for more
educated the mother, the odds is lower. For a mother with:
• voca onal educa on the odds of the occurrence of the anomaly in a child is 0.51 of the odds for
a mother with primary educa on;
• secondary educa on the odds of the occurrence of the anomaly in a child is 0.42 of the odds for
a mother with primary educa on;
• ter ary educa on the odds of the occurrence of the anomaly in a child is 0.45 of the odds for a
mother with primary educa on;
E
17.3. (task.pqs file)
An experiment has been made with the purpose of studying the ability to concentrate of a group of
Copyright ©2010-2014 PQStat So ware − All rights reserved
254
17 MULTIDIMENSIONAL MODELS
adults in an uncomfortable situa on. 130 people have taken part in the experiment. Each person was
assigned a certain task the comple on of which requried concentra on. During the experiment some
people were subject to a disturbing agent in the form of temperature increase to 32 degrees Celsius.
The par cipants were also asked about their address of residence, sex, age, and educa on. The me
for the comple on of the task was limited to 45 minutes. In the case of par cipants who completed
the task before the deadline, the actual me devoted to the comple on of the task was recorded.
Variable SOLUTION (yes/no) contains the result of the experiment, i.e. the informa on about whether
the task was solved correctly or not. The remaining variables which could have influenced the result of
the experiment are:
ADDRESSOFRES (1=city/0=village),
SEX (1=female/0=male),
AGE (in years),
EDUCATION (1=primary, 2=voca onal, 3=secondary, 4=ter ary),
TIME needed for the comple on of the task (in minutes),
DISTURBANCES (1=yes/0=no).
On the basis of all those variables a logis c regression model was built in which the dis nguished state
of the variable SOLUTION was set to "yes".
2
2
The adequacy quality is described by the coefficients: RP2 seudo = 0.27, RN
agelkerke = 0.41 i RCox−Snell =
0.30. The sufficient adequacy is also indicated by the result of the Hosmer-Lemeshow test (p = 0.1725).
The whole model is sta s cally significant, which is indicated by the result of the Likelihood Ra o test
(p < 0.000001).
Copyright ©2010-2014 PQStat So ware − All rights reserved
255
17 MULTIDIMENSIONAL MODELS
The observed values and predicted probability can be observed on the chart:
In the model the variables which have a significant influence on the result are:
AGE: p = 0.0014,
TIME: p = 0.0012,
DISTURBANCES: p = 0.0001.
What is more, the younger the person who solves the task the shorter the me needed for the comple on of the task, and if there is no disturbing agent, the probability of correct solu on is greater:
AGE: OR[95%CI] = 0.90[0.85; 0.96],
TIME: OR[95%CI] = 0.91[0.87; 0.97],
DISTURBANCES: OR[95%CI] = 0.15[0.06; 0.37].
The obtained results of the Odds Ra o are presented on the chart below:
Copyright ©2010-2014 PQStat So ware − All rights reserved
256
17 MULTIDIMENSIONAL MODELS
Should the model be used for predic on, one should pay a en on to the quality of classifica on. For
that purpose we calculate the ROC curves.
Copyright ©2010-2014 PQStat So ware − All rights reserved
257
17 MULTIDIMENSIONAL MODELS
The result seems sa sfactory. The area under the curve is AU C = 0.83 and is sta s cally greater
than 0.5 (p < 0.000001), so classifica on is possible on the basis of the constructed model. The
suggested cut-off point for the ROC curve is 0.60 and is slightly higher than the standard level used
in regression, i.e. 0.5. Classifica on made on the basis of that cut-off point yields 78.46% correctly
classified cases, of which the correctly classified ''yes'' values cons tute 77.92% (sensi vity[95%CI] =
77.92%[67.02%; 86.58%]), the ''no'' values cons tute 79.25% (specificity[95%CI] = 79.25%[65.89%; 89.16%]).
We can finish the analysis of classifica on at this stage or, if the result is not sa sfactory, we can make
a more detailed analysis of the ROC curve in module ROC curve.
Copyright ©2010-2014 PQStat So ware − All rights reserved
258
17 MULTIDIMENSIONAL MODELS
As we have assumed that classifica on on the basis of that model is sa sfactory we can calculate the
predicted value of a dependent variable for any condi ons. Let us check what odds of solving the task
has a person whose:
ADDRESSOFRES (1=city),
SEX (1=female),
AGE (50 years),
EDUCATION (1=primary),
TIME needed for the comple on of the task (20 minutes),
DISTURBANCES (1=yes).
For that purpose, on the basis of the value of coefficient b, we calculate the predicted probability (probability of receiving the answer "yes" on condi on of defining the values of dependent variables):
P (Y = yes|ADDRESSOF RES, SEX, AGE, EDU CAT ION, T IM E, DIST U RBAN CES) =
=
=
e7.23−0.45ADDRESSOFRES−0.45SEX −0.1AGE+0.46EDUCATION−0.09TIME−1.92DISTURBANCES
1+e7.23−0.45ADDRESSOFRES−0.45SEX −0.1AGE+0.46EDUCATION−0.09TIME−1.92DISTURBANCES
e7.231−0.453·1−0.455·1−0.101·50+0.456·1−0.089·20−1.924·1
1+e7.231−0.453·1−0.455·1−0.101·50+0.456·1−0.089·20−1.924·1
=
As a result of the calcula on the program will return the result:
The obtained probability of solving the task is equal to 0.1215, so, on the basis of the cut-off 0.60, the
predicted result is 0 –which means the task was not solved correctly.
Copyright ©2010-2014 PQStat So ware − All rights reserved
259
17 MULTIDIMENSIONAL MODELS
17.5 COMPARISON OF LOGISTIC REGRESSION MODELS
The window with se ngs for model comparison is accessed via the menu Statistics→Multidimensional
models→Logistic regression − comparing models
Due to the possibility of simultaneous analysis of many independent variables in one logis c regression
model, similarly to the case of mul ple linear regression, there is a problem of selec on of an op mum
model. When choosing independent variables one has to remember to put into the model variables
strongly correlated with the dependent variable and weakly correlated with one another.
When comparing models with various numbers of independent variables we pay a en on to goodness
2
2
of fit of the model (RP2 seudo , RN
agelkerke , RCox−Snell ). For each model we also calculate the maximum
of likelihood func on which we later compare with the use of the Likelihood Ra o test.
Hypotheses:
H0 : LF M = LRM ,
H1 : LF M ̸= LRM ,
where:
LF M , LRM − the maximum of likelihood func on in compared models (full and reduced).
The test sta s c has the form presented below:
χ2 = −2 ln(LRM /LF M ) = −2 ln(LRM ) − (−2 ln(LF M ))
The sta s c asympto cally (for large sizes) has the χ2 distribu on with df = kF M − kRM degrees of
freedom, where kF M i kRM is the number of es mated parameters in compared models.
On the basis of test sta s cs, p value is es mated and then compared with α :
Copyright ©2010-2014 PQStat So ware − All rights reserved
260
17 MULTIDIMENSIONAL MODELS
if p ≤ α =⇒
if p > α =⇒
we reject H0 and accept H1 ,
there is no reason to reject H0 .
2
We make the decision about which model to choose on the basis of the size RP2 seudo , RN
agelkerke ,
2
RCox−Snell and the result of the Likelihood Ra o test which compares the subsequently created (neighboring) models. If the compared models do not differ significantly, we should select the one with a
smaller number of variables. This is because a lack of a difference means that the variables present in
the full model but absent in the reduced model do not carry significant informa on. However, if the
difference is sta s cally significant, it means that one of them (the one with the greater number of
variables, with a greater R2 ) is significantly be er than the other one.
In the program PQStat the comparison of models can be done manually or automa cally.
• Manual model comparison − construc on of 2 models:
– a full model − a model with a greater number of variables,
– a reduced model − a model with a smaller number of variables − such a model is created
from the full model by removing those variables which are superfluous from the perspec ve
of studying a given phenomenon.
The choice of independent variables in the compared models and, subsequently, the choice of a
be er model on the basis of the results of the comparison, is made by the researcher.
• Automa c model comparison is done in several steps:
step 1 Construc ng the model with the use of all variables.
step 2 Removing one variable from the model. The removed variable is the one which,
from the sta s cal point of view, contributes the least informa on to the current
model.
step 3 A comparison of the full and the reduced model.
step 4 Removing another variable from the model. The removed variable is the one
which, from the sta s cal point of view, contributes the least informa on to the
current model.
step 5 A comparison of the previous and the newly reduced model.
...
In that way numerous, ever smaller models are created. The last model only contains 1 independent variable.
E
17.3 c.d. (task.pqs file)
In the experiment made with the purpose to study the concentra on abili es a logis c regression model
was constructed on the basis of the following variables:
dependent variable: SOLUTION (yes/no) - informa on about whether the task was correctly solved or not;
independent variables:
ADDRESSOFRES (1=city/0=village),
SEX (1=female/0=male),
AGE (in years),
EDUCATION (1=primary, 2=voca onal, 3=secondary, 4=ter ary),
TIME needed for the comple on of the task (in minutes),
DISTURBANCES (1=yes/0=no).
Copyright ©2010-2014 PQStat So ware − All rights reserved
261
17 MULTIDIMENSIONAL MODELS
Let us check if all independent variables are indispensible in the model.
• Manual model comparison.
On the basis of the previously constructed full model we can suspect that the variables: ADDRESSOFRES and SEX have li le influence on the constructed model (i.e. we cannot successfully make
classifica ons on the basis of those variables). Let us check if, from the sta s cal point of view,
the full model is be er than the model from which the two variables have been removed.
Copyright ©2010-2014 PQStat So ware − All rights reserved
262
17 MULTIDIMENSIONAL MODELS
The results of the Likelihood Ra o test (p = 0.3051) indicates that there is no basis for believing
that a full model is be er than a reduced one. Therefore, with a slight worsening of model adequacy, the address of residence and the sex can be omi ed.
Note!
The comparison of both models with respect to their ability to classify can be made by comparing
ROC curves for those models. For that purpose we use the module Dependent ROC Curves - a
comparison described in Chapter ??.
• Automa c model comparison.
In the case of automa c model comparison we receive very similar results. The best model is the
one constructed on the basis of independent variables: AGE, EDUCATION, TIME needed for the
comple on of the task, DISTURBANCES.
On the basis of the analyses above, from the sta s cal point of view, the op mumm model is a model
with the 4 most important independent variables: AGE, EDUCATION, TIME needed for the comple on
of the task, DISTURBANCES. An exact analysis can be made in module Logis c Regression. However, the
ul mate decision about which model to choose is up to the experiment maker.
Copyright ©2010-2014 PQStat So ware − All rights reserved
263
18
DIMENSION REDUCTION AND GROUPING
18 DIMENSION REDUCTION AND GROUPING
As the number of variables subjected to a sta s cal analysis grows, their precision grows, but so does
the level of complexity and difficulty in interpre ng the obtained results. Too many variables increase
the risk of their mutual correla on. The informa on carried by some variables can, then, be redundant, i.e. a part of the variables may not bring in new informa on for analysis but repeat the informaon already given by other variables. The need for dimension reduc on (a reduc on of the number of
variables) has inspired a whole group of analyses devoted to that issue, such as: factor analysis, principal component analysis, or discriminant analysis. Those methods allow the detec on of rela onships
among the variables. On the basis of those rela onships one can dis nguish, for further analysis, groups
of similar variables and select only one representa ve (one variable) of each group, or a new variable
the values of which are calculated on the basis of the remaining variables in the group. As a result, one
can be certain that the informa on carried by each group is included in the analysis. In this manner we
can reduce a set of variables p to a set of variables k where k < p, with only a small loss of informa on.
18.1 PRINCIPAL COMPONENT ANALYSIS
The window with se ngs for Principal component analysis is accessed via the menu Statistics → Multivariate Models → Principal Component Analysis.
Principal component analysis involves defining completely new variables (principal components) which
are a linear combina on of the observed (original) variables. An exact analysis of the principal components makes it possible to point to those original variables which have a big influence on the appearance
of par cular principal components, that is those variables which cons tute a homogeneous group. A
principal component is then a representa ve of that group. Subsequent components are mutually orthogonal (uncorrelated) and their number (k) is lower than or equal to the number of original variables
(p).
Par cular principal components are a linear combina on of original variables:
Zi = ai1 X1 + ai2 X2 + ... + ain Xp
Copyright ©2010-2014 PQStat So ware − All rights reserved
264
18
DIMENSION REDUCTION AND GROUPING
where:
X1 , X2 , ..., Xp – original variables,
ai1 , ai2 , ..., aip – coefficients of the ith principal component
Each principal component explains a certain part of the variability of the original variables. They are,
then, naturally based on such measures of variability as covariance (if the original variables are of similar
size and are expressed in similar units) or correla on (if the assump ons necessary in order to use
covariance are not fulfilled).
Mathema cal calcula ons which allow the dis nc on of principal components include defining the
eigenvalues and the corresponding eigenvectors from the following matrix equa on:
(M − λI)a = 0
where:
λ – eigenvalues,
ai = (ai1 , ai2 , ..., aip ) – eigenvector corresponding to the ith eigenvalue,
M – the variance matrix or covariance matrix of original variables X1 , X2 , ..., Xp ,
I – iden ty matrix (1 on the main diagonal, 0 outside of it).
18.1.1 The interpreta on of coefficients related to the analysis
Every principal component is described by:
Eigenvalue
An eigenvalue informs about which part of the total variability is explained by a given principal
component. The first principal component explains the greatest part of variance, the second
principal component explains the greatest part of that variance which has not been explained by
the previous component, and the subsequent component explains the greatest part of that variance which has not been explained by the previous components. As a result, each subsequent
principal component explains a smaller and smaller part of the variance, which means that the
subsequent values are smaller and smaller.
Total variance is a sum of the eigenvalues, which allows the calcula on of the variability percentage defined by each component.
λi
· 100%
λ1 + λ2 + ... + λp
Consequently, one can also calculate the cumula ve variability and the cumula ve variability
percentage for the subsequent components.
Eigenvector
An eigenvector reflects the influence of par cular original variables on a given principal component. It contains the ai1 , ai2 , ..., aip coefficients of a linear combina on which defines a component. The sign of those coefficients points to the direc on of the influence and is accidental
which does not change the value of the carried informa on.
Factor loadings
Factor loadings, just as the coefficients included in the eigenvector, reflect the influence of par cular variables on a given principal component. Those values illustrate the part of the variance of
a given component is cons tuted by the original variables. When an analysis is based on the correla on matrix, we interpret those values as correla on coefficients between original variables
and a given principal value.
Copyright ©2010-2014 PQStat So ware − All rights reserved
265
18
DIMENSION REDUCTION AND GROUPING
Variable contribu ons
They are based on the determina on coefficients between original variables and a given principal
component. They show what percentage of the variability of a given principal component can be
explained by the variability of par cular original variables.
Communali es
They are based on the determina on coefficients between original variables and a given principal
component. They show what percentage of a given original variable can be explained by the
variability of a few ini al principal components. For example: the result concerning the second
variable contained in the column concerning the fourth principal component tells us what percent
of the variability of the second variable can be explained by the variability of four ini al principal
components.
18.1.2 Graphical interpreta on
A lot of informa on carried by the coefficients returned in the tables can be presented on one chart.
The ability to read charts allows a quick interpreta on of many aspects of the conducted analysis. The
charts gather in one place the informa on concerning the mutual rela onships among the components,
the original variables, and the cases. They give a general picture of the principal components analysis
which makes them a very good summary of it.
Factor loadings graph
factor 2
The graph shows vectors connected with the beginning of the coordinate system, which represent original variables. The vectors are placed on a plane defined by the two selected principal components.
B
C
D
A
factor 1
E
The coordinates of the terminal points of the vector are the corresponding factor loadings of the variables.
Vector length represents the informa on content of an original variable carried by the principal components which define the coordinate system. The longer the vector the greater the contribu on
of the original variable to the components. In the case of an analysis based on a correla on matrix the loadings are correla ons between original variables and principal components. In such a
case points fall into the unit circle. It happens because the correla on coefficient cannot exceed
Copyright ©2010-2014 PQStat So ware − All rights reserved
266
18
DIMENSION REDUCTION AND GROUPING
one. As a result, the closer a given original variable lies to the rim of the circle the be er the
representa on of such a variable by the presented principal components.
The sign of the coordinates of the terminal point of the vector i.e. the sign of the loading factor, points
to the posi ve or nega ve correla on of an original variable and the principal components forming the coordina on system. If we consider both axes (2 components) together then original
variables can fall into one of four categories, depending on the combina on of signs (+/−) and
their loading factors.
The angle between vectors indicates the correla on of original values:
0 < α < 900 – the smaller the angle between the vectors represen ng original variables, the
stronger the posi ve correla on among these variables.
α = 900 – the vectors are perpendicular, which means that the original variables are not correlated.
900 < α < 1800 – the greater the angle between the vectors represen ng the original variables,
the stronger the nega ve correla on among these variables.
Biplot
factor 2
The graph presents 2 series of data placed in a coordinate system defined by 2 principal components.
The first series on the graph are data from the first graph (i.e. the vectors of original variables) and the
second series are points presen ng par cular cases.
b
b
B
b
C
D
b
b
b
b
b
b
b
b
b
b
b
b
b
b
b
b
E
factor 1
b
b
b
b b
A
b
b
b
b
b
b
Point coordinates should be interpreted as standardized values, i.e. posi ve coordinates poin ng to
a value higher than the mean value of the principal component, nega ve ones to a lower value,
and the higher the absolute value the further the points are from the mean. If there are untypical
observa ons on the graph, i.e. outliers, they can disturb the analysis and should be removed, and
the analysis should be made again.
The distances between the points show the similarity of cases: the closer (in the meaning of Euclidean
distance) they are to one another, the more similar informa on is carried by the compared cases.
Orthographic projec on of points on vectors are interpreted in the same manner as point coordinates,
i.e. projec ons onto axes, but the interpreta on concerns original variables and not principal
Copyright ©2010-2014 PQStat So ware − All rights reserved
267
18
DIMENSION REDUCTION AND GROUPING
components. The values placed at the end of a vector are greater than the mean value of the
original variable, and the values placed on the extension of the vector but in the opposite direcon are values smaller than the mean.
18.1.3 The criteria of dimension reduc on
There is not one universal criterion for the selec on of the number of principal components. For that
reason it is recommended to make the selec on with the help of several methods.
The percentage of explained variance
The number of principal components to be assumed by the researcher depends on the extent
to which they represent original variables, i.e. on the variance of original variables they explain.
All principal components explain 100% of the variance of original variables. If the sum of the
variances for a few ini al components cons tutes a large part of the total variance of original
variables, then principal components can sa sfactorily replace original variables. It is assumed
that the variance should be reflected in principal components to the extent of over 80 percent.
Kaiser criterion
According to the Kaiser criterion the principal components we want to leave for interpreta on
should have at least the same variance as any standardized original variable. As the variance of
every standardized original variable equals 1, according to Kaiser criterion the important principal
components are those the eigenvalue of which exceeds or is near value 1.
Scree plot
The graph presents the pace of the decrease of eigenvalues, i.e. the percentage of explained
variance.
b
Eigenvalues
3
scree end
2
b
b
1
b
b
b
b
b
b
8
9
0
0
1
2
3
4
5
Numbers of eigenvalues
6
7
The moment on the chart in which the process stabilizes and the decreasing line changes into a
horizontal one is the so-called end of the scree (the end of sprinkling of the informa on about
the original values carried by principal components). The components on the right from the point
which ends the scree represent a very small variance and are, for the most part, random noise.
18.1.4 Defining principal components
When we have decided how many principal components we need we can start genera ng them. In the
case of principal components created on the basis of a correla on matrix they are computed as a linear
combina on of standardized original values. If, however, principal components have been created on
the basis of a covariance matrix, they are computed as a linear combina on of eigenvalues which have
been centralized with respect to the mean of the original values.
Copyright ©2010-2014 PQStat So ware − All rights reserved
268
18
DIMENSION REDUCTION AND GROUPING
The obtained principal components cons tute new variables with certain advantages. First of all, the
variables are not collinear. Usually there are fewer of them than original variables, some mes much
fewer, and they carry the same or a slightly smaller amount of informa on than the original values.
Thus, the variables can easily be used in most mul dimensional analyses.
18.1.5 The advisability of using the Principal component analysis
If the variables are not correlated (the Pearson's correla on coefficient is near 0), then there is no use
to conduct a principal component analysis, as in such a situa on every variable is already a separate
component.
Bartle 's test
The test is used to verify the hypothesis that the correla on coefficients between variables are
zero (i.e. the correla on matrix is an iden ty matrix).
Hypotheses:
H0 : M = I,
H1 : M ̸= I.
where:
M – the variance matrix or covariance matrix of original variables X1 , X2 , ..., Xp ,
I – the iden ty matrix (1 on the main axis, 0 outside of it).
The test sta s c has the form presented below:
) k
(
2p + 5 ∑
ln λi ,
χ2 = − n − 1 −
6
i=1
where:
p – the number of original variables,
n – size (the number of cases),
λi – ith eigenvalue.
That sta s c has, asympto cally (for large expected frequencies), the distribu on χ2 with p(p −
1)/2 degrees of freedom.
On the basis of test sta s cs, p value is es mated and then compared with the significance level
α:
if p ≤ α =⇒
if p > α =⇒
we reject H0 and accept H1 ,
there is no reason to reject H0 .
The Kaiser-Meyer-Olkin coefficient
The coefficient is used to check the degree of correla on of original variables, i.e. the strength of
the evidence tes fying to the relevance of conduc ng a principal component analysis.
∑p ∑p
2
i̸=j
j̸=i rij
∑
KM O = ∑p ∑p
p ∑p
2
2 ,
ˆij
i̸=j
j̸=i rij +
i̸=j
j̸=i r
rij – the correla on coefficient between the ith and the jth variable,
rˆij – the par al correla on coefficient between the ith and the jth variable.
Copyright ©2010-2014 PQStat So ware − All rights reserved
269
18
DIMENSION REDUCTION AND GROUPING
The value of the Kaiser coefficient belongs to the range < 0, 1 > where low values tes fy to
the lack of a need to conduct a principal component analysis, and high values are a reason for
conduc ng such an analysis.
E
18.1. (file: iris.pqs) That classical set of data was first published in Ronald Aylmer Fisher's
1936[29] work in which discriminant analysis was presented. The file contains the measurements (in
cen meters) of the length and width of the petals and sepals for 3 species of irises. The studied species
are setosa, versicolor, and virginica. It is interes ng how the species can be dis nguished on the basis
of the obtained measurements.
The photos are from scien fic paper: Lee, et al. (2006r), "Applica on of a noisy data classifica on technique to determine the occurrence of flashover in compartment fires"
Principal component analysis will allow us to point to those measurements (the length and the width
of the petals and sepals) which give the researcher the most informa on about the observed flowers.
The first stage of work, done even before defining and analyzing principal components, is checking the
advisability of conduc ng the analysis. We start, then, from defining a correla on matrix of the variables
and analyzing the obtained correla ons with the use of Bartle 's test and the KMO coefficient.
The value p of Bartle 's sta s cs points to the truth of the hypothesis that there is a significant difference between the obtained correla on matrix and the iden ty matrix, i.e. that the data are strongly
correlated. The obtained KMO coefficient is average and equals 0.54. We consider the indica ons for
conduc ng a principal component analysis to be sufficient.
The first result of that analysis which merits our special a en on are eigenvalues:
Copyright ©2010-2014 PQStat So ware − All rights reserved
270
18
DIMENSION REDUCTION AND GROUPING
The obtained eigenvalues show that one or even two principal components will describe our data well.
The eigenvalue of the first component is 2.92 and the percent of the explained variance is 72.96. The
second component explains much less variance, i.e. 22.85%, and its eigenvalue is 9.91. According to
Kaiser criterion, one principal component is enough for an interpreta on, as only for the first principal
component the eigenvalue is greater than 1. However, looking at the graph of the scree we can conclude
that the decreasing line changes into a horizontal one only at the third principal component.
From that we may infer that the first two principal components carry important informa on. Together
they explain a great part, as much as 95.81%, of the variance (see the cumula ve % column).
The communali es for the first principal component are high for all original variables except the variable
of the width of the sepal, for which they equal 21.17%. That means that if we only interpret the first
principal component, only a small part of the variable of the width of the sepal would be reflected.
For the first two principal components the communali es are at a similar, very high level and they
exceed 90% for each of the analyzed variables, which means that with the use of those components
the variance of each variability is represented in over 90%.
In the light of all that knowledge it has been decided to separate and interpret 2 components.
In order to take a closer look at the rela onship of principal components and original variables, that
Copyright ©2010-2014 PQStat So ware − All rights reserved
271
18
DIMENSION REDUCTION AND GROUPING
is the length and the width of the petals and sepals, we interpret: eigenvectors, factor loadings, and
contribu ons of original variables.
Par cular original variables have differing effects on the first principal component. Let us put them in
order according to that influence:
1. The length of a petal is nega vely correlated with the first component, i.e. the longer the petal,
the lower the values of that component. The eigenvector of the length of the petal is the greatest
in that component and equals -0.58. Its factor loading informs that the correla on between the
first principal component and the length of the petal is very high and equals -0.99 which cons tutes 33.69% of the first component;
2. The width of the petal has an only slightly smaller influence on the first component and is also
nega vely correlated with it;
3. We interpret the length of the sepal similarly to the two previous variables but its influence on
the first component is smaller;
4. The correla on of the width of the sepal and the first component is the weakest, and the sign of
that correla on is posi ve.
The second component represents chiefly the original variable "sepal width"; the remaining original
variables are reflected in it to a slight degree. The eigenvector, factor loading, and the contribu on of
the variable "sepal width" is the highest in the second component.
Each principal component defines a homogeneous group of original values. We will call the first component "petal size" as its most important variables are those which carry the informa on about the petal,
although it has to be noted that the length of the sepal also has a significant influence on the value of
that component. When interpre ng we remember that the greater the values of that component, the
smaller the petals.
We will call the second component "sepal width" as only the width of the sepal is reflected to a greater
degree here. The greater the values of that component, the narrower the sepal.
Finally, we will generate the components by choosing, in the analysis window, the op on: Add Principal Components. A part of the obtained result is presented below:
Copyright ©2010-2014 PQStat So ware − All rights reserved
272
18
DIMENSION REDUCTION AND GROUPING
In order to be able to use the two ini al components instead of the previous four original values, we
copy and paste them into the data sheet. Now, the researcher can conduct the further sta s cs on two
new, uncorrelated variables.
Analysis of the graphs of the two ini al components
The analysis of the graphs not only leads the researcher to the same conclusions as the analysis
of the tables but will also give him or her the opportunity to evaluate the results more closely.
Factor loadings graph
The graph shows the two first principal components which represent 72.96% of the variance and
22.85% of the variance, together amoun ng to 95.81% of the variance of original values
Copyright ©2010-2014 PQStat So ware − All rights reserved
273
18
DIMENSION REDUCTION AND GROUPING
The vectors represen ng original values almost reach the rim of the unit circle (a circle with the
radius of 1), which means they are all well represented by the two ini al principal components
which form the coordinate system.
The angle between the vectors illustra ng the length of the petal, the width of the petal, and the
length of the sepal is small, which means those variables are strongly correlated. The correla on
of those variables with the components which form the system is nega ve, the vectors are in the
third quadrant of the coordinate system. The observed values of the coordinates of the vector
are higher for the first component than for the second one. Such a placement of vectors indicates
that they comprise a uniform group which is represented mainly by the first component.
The vector of the width of the sepal points to an en rely different direc on. It is only slightly
correlated with the remaining original values, which is shown by the inclina on angle with respect
to the remaining original values – it is nearly a right angle. The correla on of that vector with
the first component is posi ve and not very high (the low value of the first coordinate of the
terminal point of the vector), and it is nega ve and high (the high value of the second coordinate
of the terminal point of the vector) in the case of the second component. From that we may infer
that the width of the sepal is the only original variable which is well represented by the second
component.
Biplot
The biplot presents two series of data spread over the first two components. One series are the
vectors of original values which have been presented on the previous graph and the other series
are the points which carry the informa on about par cular flowers. The values of the second
series are read on the upper axis X and the right axis Y . The manner of interpreta on of vectors,
that is the first series, has been discussed with the previous graph. In order to understand the
interpreta on of points let us focus on flowers number 33, 34, and 109.
Flowers number 33 and 34 are similar – the distance between points 33 and 34 is small. For
both points the value of the first component is much greater than the average and the value of
Copyright ©2010-2014 PQStat So ware − All rights reserved
274
18
DIMENSION REDUCTION AND GROUPING
the second component is much smaller than the average. The average value, i.e. the arithme c
mean of both components, is 0, i.e. it is the middle of the coordina on system. Remembering
that the first component is mainly the size of the petals and the second one is mainly the width
of the sepal we can say that flowers number 33 and 34 have small petals and a large width of the
sepal. Flower number 109 is represented by a point which is at a large distance from the other
two points. It is a flower with a nega ve first component and a posi ve, although not high second
component. That means the flower has rela vely large petals while the width of the sepal is a bit
smaller than average.
Similar informa on can be gathered by projec ng the points onto the lines which extend the
vectors of original values. For example, flower 33 has a large width of the sepal (high and posi ve
values on the projec on onto the original value "sepal width") but small values of the remaining
original values (nega ve values on the projec on onto the extension of the vectors illustra ng
the remaining original values).
Copyright ©2010-2014 PQStat So ware − All rights reserved
275
19 SURVIVAL ANALYSIS
19 SURVIVAL ANALYSIS
Survival analysis is o en used in medicine. In other fields of study it is also called reliability analysis,
dura on analysis, or event history analysis. Its main goal is to evaluate the remaining me of the survival
of, for example, pa ents a er an opera on. The tools used in the analysis are life tables and KaplanMeier curves. Another interes ng aspect of that issue is comparing the survival me of, for example,
pa ents treated according to different protocols. For that purpose comparisons of two or more survival
curves are used. A number of methods (regression models) have also been created for studying the
influence of various variables on the survival me. In order to make the understanding of the issue
easier, the example of the length of the life of pa ents a er a heart transplanta on will be used to
illustrate basic defini ons.
Event − is the change interes ng to the researcher, e.g. death;
Survival me − is the period of me between the ini al state and the occurrence of a given
event, e.g. the length of a pa ent's life a er a heart transplanta on.
Note!
In the analysis one column with the calculated me ought to be marked. When we
have at our disposal two points in me: the ini al and the final ones, before the analysis we calculate the me between the two points, using the datasheet formulas.
Censored observa ons − are the observa ons for which we only have incomplete pieces of informa on about the survival me.
Censored and complete observa ons – an example concerning the survival me a er a heart
transplanta on:
– a complete observa on – we know the date of the transplanta on and the date of the
pa ent's death so we can establish the exact survival me a er the transplanta on.
– observa on censored on the right side – the date of the pa ent's death is not known (the
pa ent is alive when the study finishes) so the exact survival me cannot be established.
– observa on censored on the le side – the date of the heart transplanta on is not known
but we know it was before this study started, and we cannot establish the exact survival
me.
complete observa on
observa on censored on the right side
observa on censored on the le side
beginning
of the study
end
of the study
me
Note!
Copyright ©2010-2014 PQStat So ware − All rights reserved
276
19 SURVIVAL ANALYSIS
The end of the study means the end of the observa on of the pa ent. It is not always the same moment
for all pa ents. It can be the moment of losing touch with the pa ent (so we do not now the pa ent's
survival me). Analogously, the beginning of the study does not have to be the same point in me for
all pa ents.
19.1 LIFE TABLES
The window with se ngs for life tables is accessed via the menu Statistics→Survival analysis→Life
tables
Life tables are created for me ranges with equal spans, provided by the researcher. The ranges can be
defined by giving the step. For each range PQStat calculates:
• the number of entered cases − the number of people who survived un l the me defined by the
range;
• the number of censored cases − the number of people in a given range qualified as censored
cases;
• the number of cases at risk − the number of people in a given range minus a half of the censored
cases in the given range;
• the number of complete cases − the number of people who experienced the event (i.e. died) in
a given range;
• propor ons of of complete cases − the propor on of the number of complete cases (deaths) in
a given range to the number of the cases at risk in that range;
• propor ons of the survival cases − calculated as 1 minus the propor on of complete cases in a
given range;
Copyright ©2010-2014 PQStat So ware − All rights reserved
277
19 SURVIVAL ANALYSIS
• cumula ve survival propor on (survival func on) − the probability of surviving over a given
period of me. Because to survive another period of me, one must have survived all the previous
ones, the probability is calculated as the product of all the previous propor ons of the survival
cases.
± standard error of the survival func on;
• probability density − the calculated probability of experiencing the event (death) in a given
range, calculated in a period of me;
± standard error of the probability density;
• hazard rate − probability (calculated per a unit of me) that a pa ent who has survived un l the
beginning of a given range will experience the event (die) in that range;
± standard error of the hazard rate
Note!
In the case of a lack of complete observa ons in any range of survival me range there is the possibility
of using correc on. The zero number of complete cases is then replaced with value 0.5.
Graphic interpreta on
We can illustrate the informa on obtained thanks to the life tables with the use of several charts:
• a survival func on graph,
• a probability density graph,
• a hazard rate graph.
E
19.1. (file: transplant.pqs)
Pa ents' survival rate a er the transplanta on of a liver was studied. 89 pa ents were observed over
21 years. The age of a pa ent at the me of the transplanta on was in the range of ⟨45years; 60years).
A fragment of the collected data is presented in the table below:
The complete data in the analysis are those as to which we have complete informa on about the length
of life a er the transplanta on, i.e. described as "death" (it concerns 53 people which cons tutes
59.55% of sample). The censored data are those about which we do not have that informa on because
at the me when the study was finished the pa ents were alive (36 people, i.e. 40.45% of them). We
build the life tables of those pa ents by crea ng me periods of 3 years:
Copyright ©2010-2014 PQStat So ware − All rights reserved
278
19 SURVIVAL ANALYSIS
For each 3-year period of me we can interpret the results obtained in the table, for example, for people
living for at least 9 years a er the transplanta on who are included in the range [9;12):
• the number of people who survived 9 years a er the transplanta on is 39,
• there are 7 people about whom we know they had lived at least 9-12 years at the moment the
informa on about them was gathered but we do not know if they lived longer as they were le
out of the study a er that me,
• the number of people at the risk of death in that age range is 36,
• there are 14 people about whom we know they died 9 to 12 years a er the transplanta on,
• 39.4% of the endangered pa ents died 9 to 12 years a er the transplanta on,
• 60.6% of the endangered pa ents lived 9 to 12 years a er the transplanta on,
• the percent of survivors 9 years a er the transplanta on is 61.4% ± 5%,
• 0,08 ± 0.02 is the death probability for each year from the 9-12 range.
The results will be presented on a few graphs:
The probability of survival decreases with the me passed since the transplanta on. We do not, however, observe a sudden plunge of the survival func on, i.e. a period of me in which the probability of
death would rise drama cally.
Copyright ©2010-2014 PQStat So ware − All rights reserved
279
19 SURVIVAL ANALYSIS
19.2 KAPLAN-MEIER CURVES
Kaplan-Meier curves allow the evalua on of the survival me without the need to arbitrarily group
the observa ons like in the case of life tables. The es mator was introduced by Kaplan and Meier
(1958)[41].
The window with se ngs for Kaplan-Meier curve is accessed via the menu Survival analysis→ Multidimensional Models→Kaplan-Meier Analysis
Copyright ©2010-2014 PQStat So ware − All rights reserved
280
19 SURVIVAL ANALYSIS
As with survival tables we calculate the survival func on, i.e. the probability of survival un l a certain
me. The graph of the Kaplan-Meier survival func on is created by a step func on. The point of me
at which the value of the func on is 0.5 is the survival me median. That is the me of the observa on
below which half of the observed pa ents have died and half of them are s ll alive. Both the median
and other percen les are determined as the shortest survival me for which the survival func on is
smaller or equal to a given percen le. The survival me mean is determined as the field under the
survival curve.
The data concerning the survival me are usually very heavily skewed so in the survival analysis the
median is a be er measure of the central tendency than the mean.
Example (19.1) con nued (file: transplant.pqs)
We present the survival me a er a liver transplanta on, with the use of the Kaplan-Meier curve.
Copyright ©2010-2014 PQStat So ware − All rights reserved
281
19 SURVIVAL ANALYSIS
The survival func on does not suddenly plunge right a er the transplanta on. Therefore, we conclude
that the ini al period a er the transplanta on does not carry a par cular risk of death. The value of the
median shows that for 10 years a er the transplanta on a half of the pa ents have died and another
half is s ll alive. The value is marked on the graph by drawing a line in point 0.5 which signifies the
median. In a similar manner we mark the quar les in the graph.
19.3 COMPARISON OF SUVIVAL CURVES
The survival func ons can be built separately for different subgroups, e.g. separately for women and
men, and then compared. Such a comparison may concern two curves or more.
The window with se ngs for the comparison of survival curves is accessed via the menu Statystyka→Survival
analysis→Comparison groups
Copyright ©2010-2014 PQStat So ware − All rights reserved
282
19 SURVIVAL ANALYSIS
Comparisons of k survival curves S1 , S2 , ..., Sk , at par cular points of the survival me t, in the program
can be made with the use of three tests:
Log-rank test the most popular test drawing on the Mantel-Heanszel procedure for many
2 x 2 tables (Mantel-Heanszel 1959[56], Mantel 1966[58], Cox 1972[23]),
Gehan's generaliza on of Wilcoxon's test deriving from Wilcoxon's test (Breslow 1970,
Gehan 1965[34][35]),
Tarone-Ware test deriving from Wilcoxon's test (Tarone and Ware 1977[76]).
The three tests are based on the same test sta s c, they only differ in weights wj the par cular points
of the meline on which the test sta s c is based.
Log-rank test: wj = 1 – all the points of the meline have the same weight which gives
the later values of the meline a greater influence on the result;
Gehan's generaliza on of Wilcoxon's test: wj = nj – me moments are weighted with
the number of observa ons in each of them, so greater weights are ascribed to the ini al
values of the me line;
√
Tarone-Ware test: wj = nj – me moments are weighted with the root of the number
of observa ons in each of them, so the test is situated between the two tests described
earlier.
An important condi on for using the tests above is the propor onality of hazard. Hazard, defined as
the slope of the survival curve, is the measure of how quickly a failure event takes place. Breaking the
principle of hazard propor onality does not completely disqualify the tests above but it carries some
risks. First of all, the placement of the point of the intersec on of the curves with respect to the meline has a decisive influence on decreasing the power of par cular tests.
Copyright ©2010-2014 PQStat So ware − All rights reserved
283
19 SURVIVAL ANALYSIS
19.3.1 Differences among the survival curves
Hypotheses:
H0 : S1 (t) = S2 (t) = ... = Sk (t),
H1 : not all Si (t) are equal.
for all t,
In calcula ons was used chi-square sta s cs form:
χ2 = U ′ V −1 U
where:
Ui =
∑m
j=1 wj (dij
− eij )
V - covariance matrix of dimensions (k − 1) × (k − 1)
where: ∑
2 nij (nj −nij )dj (nj −dj ) ,
diagonal: m
j=1 wj
n2j (nj −1)
∑
2 nij nlj dj (nj −dj )
off diagonal: m
j=1 wj
n2 (n −1)
j
j
m − number of moments in me with failure event (death),
∑
dj = ki=1 dij − observed number of failure events (deaths) in the j-th moment of me,
dij − observed number of failure events (deaths) in the w i-th group w in the j-th moment
of me,
n d
eij = ijnj j − expected number of failure events (deaths) in the w i-th group w in the j-th
moment of me,
∑
nj = ki=1 nij − the number of cases at risk in the j-th moment of me.
The sta s c asympto cally (for large sizes) has the χ2 distribu on with df = k − 1 degrees of freedom.
On the basis of test sta s cs, p value is es mated and then compared with the significance level α :
if p ≤ α =⇒
if p > α =⇒
we reject H0 and accept H1 ,
there is no reason to reject H0 .
Hazard ra o
∑
In the log-rank test the∑
observed values of failure events (deaths) Oi = m
j=1 dij and the appropriate
expected values Ei = m
e
are
given.
j=1 ij
The measure for describing the size of the difference between a pair of survival curves is
the hazard ra o (HR).
O1 /E1
HR =
O2 /E2
If the hazard ra o is greater than 1, e.g. HR = 2, then the degree of the risk of a failure
event in the first group is twice as big as in the second group. The reverse situa on takes
place when HR is smaller than one. When HR is equal to 1 both groups are equally at
risk.
Note!
The confidence interval for HR is calculated on the basis of the standard devia on of the
HR logarithm (Armitage and Berry 1994[5]).
Copyright ©2010-2014 PQStat So ware − All rights reserved
284
19 SURVIVAL ANALYSIS
19.3.2 Survival curve trend
Hypotheses:
H0 : In the studied popula on there is no trend in the placement of the S1 , S2 , ..., Sk curves,
H1 : In the studied popula on there is a trend in in the placement of the S1 , S2 , ..., Sk curves.
In the calcula on the chi-square sta s c was used, in the following form:
χ2 =
(c′ U )2
c′ V c
where:
c = (c1 , c2 , ..., ck ) − vector of the weights for the compared groups, informing about their
natural order (usually the subsequent natural numbers).
The sta s c asympto cally (for large sizes) has the χ2 distribu on with 1 degree of freedom.
On the basis of test sta s cs, p value is es mated and then compared with the significance level α :
if p ≤ α =⇒
if p > α =⇒
we reject H0 and accept H1 ,
there is no reason to reject H0 .
In order to conduct a trend analysis in the survival curves the grouping variable must be a numerical
variable in which the values of the numbers inform about the natural order of the groups. The numbers
in the analysis are treated as the c1 , c2 , ..., ck weights.
19.3.3 Survival curves for the stratas
O en, when we want to compare the survival mes of two or more groups, we should remember about
other factors which may have an impact on the result of the comparison. An adjustment (correc on)
of the analysis by such factors can be useful. For example, when studying rest homes and comparing
the length of the stay of people below and above 80 years of age, there was a significant difference in
the results. We know, however, that sex has a strong influence on the length of stay and the age of the
inhabitants of rest homes. That is why, when a emp ng to evaluate the impact of age, it would be a
good idea to stra fy the analysis with respect to sex.
Hypotheses for the differences in survival curves:
H0 : S1∗ (t) = S2∗ (t) = ... = Sk∗ (t), for all t,
H1 : not all Si∗ (t) are equal.
Hypotheses for the analysis of trends in survival curves:
H0 : In the studied popula on there is no trend in the placement of the S1∗ , S2∗ , ..., Sk∗ , curves,
H1 : In the studied popula on there is a trend in in the placement of the S1∗ , S2∗ , ..., Sk∗ curves.
where S1∗ (t), S2∗ (t), ..., Sk∗ (t) -are the survival curves a er the correc on by the variable
determining the strata.
The calcula ons for test sta s cs are based on formulas described for the tests, not taking ∑
into account
the strata, with the difference that matrix U and V is replaced with the sum of matrices L
l=1 U and
∑L
l=1 V . The summa on is made according to the strata created by the variables with respect to which
we adjust the analysis l=1,2,...,L
The sta s c asympto cally (for large sizes) has the χ2 distribu on with 1 degree of freedom.
On the basis of test sta s cs, p value is es mated and then compared with the significance level α :
Copyright ©2010-2014 PQStat So ware − All rights reserved
285
19 SURVIVAL ANALYSIS
if p ≤ α =⇒
if p > α =⇒
we reject H0 and accept H1 ,
there is no reason to reject H0 .
Example (19.1) con nued (file transplant.pqs)
The differences for two survival curves
Liver transplanta ons were made in two hospitals. We will check if the pa ents' survival me a er
transplanta ons depended on the hospital in which the transplanta ons were made. The comparisons
of the survival curves for those hospitals will be made on the basis of all tests proposed in the program
for such a comparison.
Hypotheses:
H0 : the survival curve of the pa ents of hospital no. 1 = the survival curve of the pa ents of hospital no. 2,
H1 : the survival curve of the pa ents of hospital no. 1 =
̸ the survival curve of the pa ents of hospital no. 2.
Copyright ©2010-2014 PQStat So ware − All rights reserved
286
19 SURVIVAL ANALYSIS
On the basis of the significance level α = 0.05, based on the obtained value p=0.6004 for the log-rank
test (p=0.6959 for Gehan's and 0.6465 for Tarone-Ware) we conclude that there is no basis for rejec ng
the hypothesis H0 . The length of life calculated for the pa ents of both hospitals is similar.
The same conclusion will be reached when comparing the risk of death for those hospitals by determining the risk ra o. The obtained es mated value is HR = 1.1499 and 95% of the confidence interval
for that value contains 1: ⟨0.6570, 2.0126⟩.
Differences for many survival curves
Liver transplanta ons were made for people at different ages. 3 age groups were dis nguished: ⟨45
years; 50 years), ⟨50 years; 55 years), ⟨55 years; 60 years). We will check if the pa ents' survival me
a er transplanta ons depended on their age at the me of the transplanta on.
Hypotheses:
H0 : survival rates of pa ents aged ⟨45 years; 50 years), ⟨50 years; 55 years), ⟨55 years; 60 years)
are similar,
H1 : at least one survival curve out of the 3 curves above
differs from the other curves.
Copyright ©2010-2014 PQStat So ware − All rights reserved
287
19 SURVIVAL ANALYSIS
On the basis of the significance level α = 0.05, based on the obtained value p=0.0692 in the log-rank
test (p=0.09279 for Gehan's and p=0.0779 for Tarone-Ware) we conclude that there is no basis for the
rejec on of the hypothesis H0 . The length of life calculated for the pa ents in the three compared age
groups is similar. However, it is no ceable that the values are quite near to the standard significance
level 0.05.
When examining the hazard values (the ra o of the observed values and the expected failure events)
we no ce that they are a li le higher with each age group (0.68, 0.93, 1.43). Although no sta s cally
significant differences among them are seen it is possible that a growth trend of the hazard value (trend
in the posi on of the survival rates) will be found.
Trend for many survival curves
If we introduce into the test the informa on about the ordering of the compared categories (we will
use the age variable in which the age ranges will be numbered, respec vely, 1, 2, and 3), we will be able
to check if there is a trend in the compared curves. We will study the following hypotheses:
H0 : a lack of a trend in the survival me curves of the pa ents a er a transplanta on
(a trend dependent on the age of the pa ents at the me of a transplanta on),
H1 : the older the pa ents at the me of a transplanta on, the greater/smaller
the probability of their survival over a given period of me.
On the basis of the significance level α = 0.05, based on the obtained value p=0.0237 in the log-rank
test (p=0.0317 for Gehan's and p=0.0241 for Tarone-Ware) we conclude that the survival curves are
posi oned in a certain trend. On the Kaplan-Meier graph the curve for people aged ⟨55 years; 60 years)
is the lowest. Above that curve there is the curve for pa ents aged ⟨50 years; 55 years). The highest
curve is the one for pa ents aged ⟨45 years; 50 years). Thus, the older the pa ent at the me of a
transplanta on, the lower the probability of survival over a certain period of me.
Survival curves for stratas
Let us now check if the trend observed before is independent of the hospital in which the transplantaon took place. For that purpose we will choose a hospital as the stratum variable.
Copyright ©2010-2014 PQStat So ware − All rights reserved
288
19 SURVIVAL ANALYSIS
Copyright ©2010-2014 PQStat So ware − All rights reserved
289
19 SURVIVAL ANALYSIS
The report contains, firstly, an analysis of the strata: both the test results and the hazard ra o. In the
first stratum the growing trend of hazard is visible but not significant. In the second stratum a trend
with the same direc on (a result bordering on sta s cal significance) is observed. A cumula on of those
trends in a common analysis of strata allowed the obtainment of the significance of the trend of the
survival curves. Thus, the older the pa ent at the me of a transplanta on, the lower the probability
of survival over a certain period of me, independently from the hospital in which the transplanta on
took place.
A compara ve analysis of the survival curves, corrected by strata, yields a result significant for the logrank and Tarone-Ware tests and not significant for Gehan's test, which might mean that the differences
among the curves are not so visible in the ini al survival periods as in the later ones. By looking at the
hazard ra o of the curves compared in pairs
Copyright ©2010-2014 PQStat So ware − All rights reserved
290
19 SURVIVAL ANALYSIS
we can localize significant differences. For the comparison of the curve of the youngest group with
the curve of the oldest group the hazard ra o is the smallest, 0.53, the 95% confidence interval for
that ra o, ⟨0.26 ; 1.05⟩, does contain value 1 but is on the verge of that value, which can suggest that
there are significant differences between the respec ve curves. In order to confirm that supposi on an
inquisi ve researcher can, with the use of the data filter in the analysis window, compare the curves in
pairs.
However, it ought to be remembered that one of the correc ons for mul ple comparisons should be
used and the significance level should be modified. In this case, for Bonferroni's correc on, with three
comparisons, the significance level will be 0.017. For simplicity, we will only avail ourselves of the logrank test.
⟨45 years; 50 years) vs ⟨50 years; 55 years)
⟨45 years; 50 years) vs ⟨55 years; 60 years)
⟨50 years; 55 years) vs ⟨55 years; 60 years)
As expected, sta s cally significant differences only concern the survival curves of the youngest and
oldest groups.
Copyright ©2010-2014 PQStat So ware − All rights reserved
291
19 SURVIVAL ANALYSIS
19.4 PROPORTIONAL COX HAZARD REGRESSION
The window with se ngs for Cox regression is accessed via the menu Statistics→Survival analysis→PH Cox regression
Cox regression, also known as the Cox propor onal hazard model, is the most popular regressive method
for survival analysis. It allows the study of the impact of many independent variables (X1 , X2 , . . ., Xk )
on survival rates. The approach is, in a way, non-parametric, and thus encumbered with few assumpons, which is why it is so popular. The nature or shape of the hazard func on does not have to be
known and the only condi on is the assump on which also pertains to most parametric survival models, i.e. hazard propor onality.
The func on on which Cox propor onal hazard model is based describes the resul ng hazard and is the
product of two values only one of which depends on me (t):
)
( k
∑
h(t, X1 , X2 , ..., Xk ) = h0 (t) · exp
βi Xi ,
i=1
where:
h(t, X1 , X2 , ..., Xk ) –the resul ng hazard describing the risk changing in me and dependent on other factors, e.g. the treatment method,
h0 (t) –the baseline hazard, i.e. the hazard with the assump on that all the explanatory
variables are equal to zero,
∑k
i=1 βi Xi
–a combina on (usually linear) of independent variables and model parame-
ters,
X1 , X2 , . . . Xk –explanatory variables independent of me,
β1 , β2 , . . . βk –parameters.
Copyright ©2010-2014 PQStat So ware − All rights reserved
292
19 SURVIVAL ANALYSIS
Dummy variables and interac ons in the model
A discussion of the coding of dummy variables and interac ons is presented in chapter 17.1
Prepara on of the variables for the analysis in mul dimensional models).
Correc on for es in Cox regression is based on Breslow's method[14]
The model can be transformed into a the linear form:
(
ln
h(t, X1 , X2 , ..., Xk )
h0 (t)
)
=
k
∑
βi Xi .
i=1
In such a case, the solu on of the equa on is the vector of the es mates of parameters β0 , β1 , . . . , βk
called regression coefficients:
b=
b1
b2
..
.
.
bk
The coefficients are es mated by the so-called par al maximum likelihood es ma on. The method is
called "par al" as the search for the maximum of the likelihood func on L (the program makes use of
the Newton-Raphson itera ve algorithm) only takes place for complete data; censored data are taken
into account in the algorithm but not directly.
There is a certain error of es ma on for each coefficient. The magnitude of that error is es mated from
the following formula:
√
SEb = diag(H −1 )b
where:
diag(H −1 ) is the main diagonal of the covariance matrix.
Note!
When building a model it ought to be remembered that the number of observa ons should be ten
mes greater than or equal to the ra o of the es mated model parameters (k) and the smaller one of
the propor ons of the censored or complete sizes (p), i.e. (n ≥ 10k/p) Peduzzi P., et al(1995)[67].
Note!
When building the model you need remember that the independent variables should not be mul collinear. In a case of mul collinearity es ma on can be uncertain and the obtained error values very
high. The mul collinear variables should be removed from the model or one independent variable
should be built of them, e.g. instead of the mul collinear variables of mother age and father age one
can build the parents age variable.
Note!
The criterion of convergence of the func on of the Newton-Raphson itera ve algorithm can be controlled with the help of two parameters: the limit of convergence itera on (it gives the maximum number of itera ons in which the algorithm should reach convergence) and the convergence criterion (it
gives the value below which the received improvement of es ma on shall be considered to be insignificant and the algorithm will stop).
Copyright ©2010-2014 PQStat So ware − All rights reserved
293
19 SURVIVAL ANALYSIS
19.4.1 Hazard ra o
An individual hazard ra o (HR) is now calculated for each independent variable :
HRi = eβi .
It expresses the change of the risk of a failure event when the independent variable grows by 1 unit.
The result is adjusted to the remaining independent variables in the model − it is assumed that they
remain stable while the studied independent variable grows by 1 unit.
The HR value is interpreted as follows:
• HR > 1 means the s mula ng influence of the studied independent variable on the occurrence
of the failure event, i.e. it gives informa on about how much greater the risk of the occurrence
of the failure event is when the independent variable grows by 1 unit.
• HR < 1 means the des mula ng influence of the studied independent variable on the occurrence of the failure event, i.e. it gives informa on about how much lower the risk is of the occurrence of the failure event when the independent variable grows by 1 unit.
• HR ≈ 1 means that the studied independent variable has no influence on the occurrence of the
failure event (1).
Note!
If the analysis is made for a model other than linear or if interac on is taken into account, then, just
as in the logis c regression model we can calculate the appropriate HR on the basis of the general
formula which is a combina on of independent variables.
19.4.2 Model verifica on
Sta s cal significance of par cular variables in the model (significance of the odds ra o)
On the basis of the coefficient and its error of es ma on we can infer if the independent variable
for which the coefficient was es mated has a significant effect on the dependent variable. For
that purpose we use Wald test.
Hypotheses:
H0 : βi = 0,
H0 : ORi = 1,
or, equivalently:
H1 : βi ̸= 0.
H1 : ORi =
̸ 1.
The Wald test sta s cs is calculated according to the formula:
)2
(
bi
2
χ =
SEbi
The sta s c asympto cally (for large sizes) has the χ2 distribu on with 1 degree of freedom.
On the basis of test sta s cs, p value is es mated and then compared with the significance level
α:
if p ≤ α =⇒
if p > α =⇒
we reject H0 and accept H1 ,
there is no reason to reject H0 .
Copyright ©2010-2014 PQStat So ware − All rights reserved
294
19 SURVIVAL ANALYSIS
The quality of the constructed model
A good model should fulfill two basic condi ons: it should fit well and be possibly simple. The
quality of Cox propor onal hazard model can be evaluated with a few general measures based
on: LF M –the maximum value of likelihood func on of a full model (with all variables),
L0 –the maximum value of the likelihood func on of a model which only contains one free word,
d –the observed number of failure events (in models other than Cox's n, i.e. sample size, is used
instead of d).
• Informa on criteria are based on the informa on entropy carried by the model (model insecurity), i.e. they evaluate the lost informa on when a given model is used to describe the
studied phenomenon. We should, then, choose the model with the minimum value of a
given informa on criterion.
AIC, AICc, and BIC is a kind of a compromise between the good fit and complexity. The
second element of the sum in formulas for informa on criteria (the so-called penalty funcon) measures the simplicity of the model. That depends on the number of parameters (k)
in the model and the number of complete observa ons (d). In both cases the element grows
with the increase of the number of parameters and the growth is the faster the smaller the
number of observa ons.
The informa on criterion, however, is not an absolute measure, i.e. if all the compared
models do not describe reality well, there is no use looking for a warning in the informa on
criterion.
– Akaike informa on criterion
AIC = −2 ln LF M + 2k,
It is an asymptoma c criterion, appropriate for large sample sizes.
– Corrected Akaike informa on criterion
AICc = AIC +
2k(k + 1)
,
d−k−1
Because the correc on of the Akaike informa on criterion concerns the sample size
(the number of failure events) it is the recommended measure (also for smaller sizes).
– Bayesian informa on criterion or Schwarz criterion
BIC = −2 ln LF M + k ln(d),
Just like the corrected Akaike criterion it takes into account the sample size (the number
of failure events), Volinsky and Ra ery (2000)[78].
• Pseudo R2 –the so-called McFadden R2 is a goodness of fit measure of the model (an equivalent of the coefficient of mul ple determina on R2 defined for mul ple linear regression).
The value of that coefficient falls within the range of < 0; 1), where values close to 1 mean
excellent goodness of fit of the model, 0 –– a complete lack of fit. Coefficient RP2 seudo is
calculated according to the formula:
RP2 seudo = 1 −
ln LF M
.
ln L0
As coefficient RP2 seudo does not assume value 1 and is sensi ve to the amount of variables
in the model, its corrected value is calculated:
2
RN
agelkerke =
1 − e−(2/d)(ln LF M −ln L0 )
1 − e(2/d) ln L0
lub
2
RCox−Snell
=1−e
Copyright ©2010-2014 PQStat So ware − All rights reserved
(−2 ln L0 )−(−2 ln LF M )
d
.
295
19 SURVIVAL ANALYSIS
• Sta s cal significance of all variables in the model
The basic tool for the evalua on of the significance of all variables in the model is the Likelihood Ra o test. The test verifies the hypothesis:
H0 :
all βi = 0,
H1 : there is βi ̸= 0.
The test sta s c has the form presented below:
χ2 = −2 ln(L0 /LF M ) = −2 ln(L0 ) − (−2 ln(LF M )).
The sta s c asympto cally (for large sizes) has the χ2 distribu on with k degrees of freedom.
On the basis of test sta s cs, p value is es mated and then compared with α :
if p ≤ α =⇒
if p > α =⇒
we reject H0 and accept H1 ,
there is no reason to reject H0 .
19.4.3 Analysis of model residuals
The analysis of the of the model residuals allows the verifica on of its assump ons. The main goal of the
analysis in Cox regression is the localiza on of outliers and the study of hazard propor onality. Typically,
in regression models residuals are calculated as the differences of the observed and predicted values
of the dependent variable. However, in the case of censored values such a method of determining
the residuals is not appropriate. In the program we can analyze residuals described as: Mar ngale,
deviance, and Schoenfeld. The residuals can be drawn with respect to me or independent variables.
Hazard propor onality assump on
A number of graphical methods for evalua ng the goodness of fit of the propor onal hazard model have
been created (Lee and Wang 2003[49]). The most widely used are the methods based on the model
residuals. As in the case of other graphical methods of evalua ng hazard propor onality this one is a
subjec ve method. For the assump on of propor onal hazard to be fulfilled, the residuals should not
form any pa ern with respect to me but should be randomly distributed around value 0.
Mar ngale – the residuals can be interpreted as a difference in me [0, t] between the observed number of failure events and their number predicted by the model. The value of the expected residuals is 0 but they have a diagonal distribu on which makes it more difficult to interpret the graph
(they are in the range of −∞ to 1).
Deviance – similarly to mar ngale, asympto cally they obtain value 0 but are distributed symmetrically around zero with standard devia on equal to 1 when the model is appropriate. The deviance value is posi ve when the studied object survives for a shorter period of me than the
one expected on the basis of the model, and nega ve when that period is longer. The analysis
of those residuals is used in the study of the propor onality of the hazard but it is mainly a tool
for iden fying outliers. In the residuals report those of them which are further than 3 standard
devia ons away from 0 are marked in red.
Schoenfeld – the residuals are calculated separately for each independent variable and only defined
for complete observa ons. For each independent variable the sum of Shoenfeld residuals and
their expected value is 0. An advantage of presen ng the residuals with respect to me for each
variable is the possibility of iden fying a variable which does not fulfill, in the model, the assumpon of hazard propor onality. That is the variable for which the graph of the residuals forms a
systema c pa ern (usually the studied area is the linear dependence of the residuals on me).
Copyright ©2010-2014 PQStat So ware − All rights reserved
296
19 SURVIVAL ANALYSIS
An even distribu on of points with respect to value 0 shows the lack of dependence of the residuals on me, i.e. the fulfillment of the assump on of hazard propor onality by a given variable
in the model.
If the assump on of hazard propor onality is not fulfilled for any of the variables in Cox model, one
possible solu on is to make Cox's analyses separately for each level of that variable.
19.5 COMPARISON OF COX PH REGRESSION MODELS
The window with se ngs for model comparison is accessed via the menu Statistics→Survival analysis→Cox PH Regression − comparing models
Due to the possibility of simultaneous analysis of many independent variables in one Cox regression
model, there is a problem of selec on of an op mum model. When choosing independent variables
one has to remember to put into the model variables strongly correlated with the survival me and
weakly correlated with one another.
When comparing models with various numbers of independent variables we pay a en on to informa2
2
on criteria (AIC, AICc, BIC) and to goodness of fit of the model (RP2 seudo , RN
agelkerke , RCox−Snell ).
For each model we also calculate the maximum of likelihood func on which we later compare with the
use of the Likelihood Ra o test.
Hipotezy:
H0 : LF M = LRM ,
H1 : LF M ̸= LRM ,
where:
LF M , LRM − the maximum of likelihood func on in compared models (full and reduced).
Copyright ©2010-2014 PQStat So ware − All rights reserved
297
19 SURVIVAL ANALYSIS
The test sta s c has the form presented below:
χ2 = −2 ln(LRM /LF M ) = −2 ln(LRM ) − (−2 ln(LF M ))
The sta s c asympto cally (for large sizes) has the χ2 distribu on with df = kF M − kRM degrees of
freedom, where kF M i kRM is the number of es mated parameters in compared models.
On the basis of test sta s cs, p value is es mated and then compared with α :
if p ≤ α =⇒
if p > α =⇒
we reject H0 and accept H1 ,
there is no reason to reject H0 .
We make the decision about which model to choose on the basis of the size: AIC, AICc, BIC,
2
2
RP2 seudo , RN
agelkerke , RCox−Snell and the result of the Likelihood Ra o test which compares the subsequently created (neighboring) models. If the compared models do not differ significantly, we should
select the one with a smaller number of variables. This is because a lack of a difference means that the
variables present in the full model but absent in the reduced model do not carry significant informa on.
However, if the difference is sta s cally significant, it means that one of them (the one with the greater
number of variables) is significantly be er than the other one.
In the program PQStat the comparison of models can be done manually or automa cally.
• Manual model comparison − construc on of 2 models:
– a full model − a model with a greater number of variables,
– a reduced model − a model with a smaller number of variables − such a model is created
from the full model by removing those variables which are superfluous from the perspec ve
of studying a given phenomenon.
The choice of independent variables in the compared models and, subsequently, the choice of a
be er model on the basis of the results of the comparison, is made by the researcher.
• Automa c model comparison is done in several steps:
step 1 Construc ng the model with the use of all variables.
step 2 Removing one variable from the model. The removed variable is the one which,
from the sta s cal point of view, contributes the least informa on to the current
model.
step 3 A comparison of the full and the reduced model.
step 4 Removing another variable from the model. The removed variable is the one
which, from the sta s cal point of view, contributes the least informa on to the
current model.
step 5 A comparison of the previous and the newly reduced model.
...
In that way numerous, ever smaller models are created. The last model only contains 1 independent variable.
E
19.2. (file: remissionLeukemia.pqs)
The analysis is based on the data about leukemia described in the work of Freirich et al. 1963[32] and
further analyzed by many authors, including Kleinbaum and Klein 2005[44]. The data contain informaon about the me (in weeks) of remission un l the moment when a pa ent was withdrawn from the
Copyright ©2010-2014 PQStat So ware − All rights reserved
298
19 SURVIVAL ANALYSIS
study because of an end of remission (a return of the symptoms) or of the censorship of the informaon about the pa ent. The end of remission is the result of a failure event and is treated as a complete
observa on. An observa on is censored if a pa ent remains in the study to the end and remission does
not occur or if the pa ent leaves the study.
Pa ents were assigned to one of two groups: a group undergoing treatment (marked as 1) and a placebo
group (marked as 0). The informa on about the pa ents' sex was gathered (1=man, 0=woman) and
about the values of the indicator of the number of white cells, marked as "log WBC", which is a wellknown prognos c factor.
The aim of the study is to determine the influence of treatment on the me of remaining in remission,
taking into account possible confounding factors and interac ons. In the analysis we will focus on the
"Rx (1=placebo, 0=treatment)" variable. We will place the "log WBC" variable in the model as a possible
confounding factor (which modifies the effect). In order to evaluate the possible interac ons of "Rx"
and "log WBC" we will also consider a third variable, a ra o of the interac ng variables. We will add
the variable to the model by selec ng, in the analysis window, the Interactions bu on and by se ng
appropriate op ons there.
We build three Cox models:
Model A only contains the "Rx" variable:
Model B contains the "Rx" variable and the poten ally confounding variable "log WBC":
Model C contains the "Rx" variable, the "log WBC" variable, and the poten al effect of the interac ons
of those variables: "Rx × log WBC"
Copyright ©2010-2014 PQStat So ware − All rights reserved
299
19 SURVIVAL ANALYSIS
The variable which informs about the interac on of "Rx" and "log WBC", included in model C, is not
significant in model C, according to the Wald test. Thus, we can view further considera on of the interac ons of the two variables in the model to be unnecessary. We will obtain similar results by comparing,
with the use of a likelihood ra o test, model C with model B. We can make the comparison by choosing the Cox PH regression − comparing models menu. We will then obtain a non-significant result
(p=0.5134) which means that model C (model with interac on) is NOT significantly be er than model
B (model without interac on).
Therefore, we reject model C and move to consider model B and model A.
HR for "Rx" in model B is 3.65 which means that hazard for the "placebo group" is about 3.6 greater
than for the pa ents undergoing treatment. Model A only contains the "Rx" variable, which is why it
is usually called a "crude" model – it ignores the effect of poten al confounding factors. In that model
the HR for "Rx" is 4.52 and is much greater than in model B. However, let us look not only at the point
values of the HR es mator but also at the 95% confidence interval for those es mators. The range for
"Rx" in model A is 8.06 (10.09 minus 2.03) wide and is narrower in model B: 6.74 (8.34 minus 1.60).
That is why model B gives a more precise HR es ma on than model A. In order to make a final decision
about which model (A or B) will be be er for the evalua on of the effect of treatment ("Rx") we will
once more perform a compara ve analysis of the models in the Cox PH pregression − comparing
models module. This me the likelihood ra o test yields a significant result (p<0.0001), which is the
final confirma on of the superiority of model B. That model has the lowest value of informa on criteria
2
(AIC=148.6, AICc=149 BIC=151.4) and high values of goodness of fit (Pseudo RM
cF adden = 0.2309,
2
2
RN agelkerke = 0.7662, RCox−Snell = 0.7647).
Copyright ©2010-2014 PQStat So ware − All rights reserved
300
19 SURVIVAL ANALYSIS
The analysis is complemented with the presenta on of the survival curves of both groups, the treatment
one and the placebo one, corrected by the influence of "log WBC", for model B. In the graph we observe
the differences between the groups, which occur at par cular points of survival me. In order to draw
such curves, having selected the Add a graph op on, we select the Survival function: setpoints...
op on and set the values for the "Rx" variable as 0 for the first curve (the placebo group) and 1 for the
second curve (the treatment group). For the "Log WBC" variable we enter the mean value, i.e. 2.93.
At the end we will evaluate the assump ons of Cox regression by analyzing the model residuals with
respect to me.
Copyright ©2010-2014 PQStat So ware − All rights reserved
301
19 SURVIVAL ANALYSIS
Copyright ©2010-2014 PQStat So ware − All rights reserved
302
19 SURVIVAL ANALYSIS
We do not observe any outliers, however, the mar ngale and deviance residuals become lower the
longer the me. Shoenfeld residuals have a symmetrical distribu on with respect to me. In their case
the analysis of the graph can be supported with various tests which can evaluate if the points of the
residual graph are distributed in a certain pa ern, e.g. a linear dependency. In order to make such an
analysis we have to copy Shoenfeld residuals, together with me, into a datasheet, and test the type
of the dependence which we are looking for. The result of such a test for each variable signifies if the
assump on of hazard propor onality by a variable in the model has been fulfilled. It has been fulfilled
if the result is sta s cally insignificant and it has not been fulfilled if the result is sta s cally significant.
As a result the variable which does not fulfill the regression assump on of the Cox propor onal hazard
can be excluded from the model. In the case of the "Log WBC" and "Rx" variables the symmetrical
distribu on of the residuals suggests the fulfillment of the assump on of hazard propor onality by
those variables. That can be confirmed by checking the correla on, e.g. Pearson's linear or Spearman's
monotonic, for those residuals and me.
Later we can add the sex variable to the model. However, we have to act with cau on because we know,
from various sources, that sex can have an influence on the survival func on as regards leukemia, in that
survival func ons can be distributed dispropor onately with respect to each other along the me line.
That is why we create the Cox model for three variables: "Sex", "Rx", and "log WBC". Before interpre ng
the coefficients of the model we will check Schonfeld residuals. We will present them in graphs and their
results, together with me, will be copied from the report to a new data sheet where we will check the
occurrence of Spearman's monotonic correla on. The obtained values are p=0.0259 (for the me and
Shoenfeld residuals correla on for sex), p=0.6192 (for the me and Shoenfeld residuals correla on for
log WBC), and p=0,1490 (for the me and Shoenfeld residuals correla on for Rx) which confirms that
the assump on of hazard propor onality has not been fulfilled by the sex variable. Therefore, we will
build the Cox models separately for women and men. For that purpose we will make the analysis twice,
with the data filter switched on. First, the filter will point to the female sex (0), second, to the male sex
(1).
For women
For men
Copyright ©2010-2014 PQStat So ware − All rights reserved
303
19 SURVIVAL ANALYSIS
Copyright ©2010-2014 PQStat So ware − All rights reserved
304
20
RELIABILITY ANALYSIS
20 RELIABILITY ANALYSIS
Reliability analysis is usually associated with the complex scale construc on, in par cular summary
scales (these consist of many individual items). Reliability analysis, associated as its internal consistency,
informs us to what extent a par cular scale measures what it should measure. In other words, to what
extend the scale items measure the things that are measured by the whole scale.
When every scale item measures the same construct (the correla on between the items should be high)
we can call it reliable scale. This assump on can be checked by calcula ng the matrix of the Pearson's
correla on coefficient. Many measures of concordance can be used in reliability analysis. However, the
most popular technique is the α-Cronbach coefficient and so-called split-half reliability.
Cronbach's α coefficient was named for the first me in 1951[25], by Cronbach. It measures the
propor on of single item variances a and the whole scale variance (items sum). It is calculated
according to the following formula:
(
)
∑k
2
k
i=1 sdi
αC =
1−
,
k−1
sd2t
where:
k − number of scale items,
sd2i − variance of i item,
sd2t − variance of items sum.
Standardised reliability coefficient αstandard is calculated according to the following formula:
αstandard =
krp
,
1 + (k − 1)rp
where:
rp − mean of all the Pearson's correla on coefficients for (k(k − 1)/2) scale items.
Alpha can take on any value less than or equal to 1, including nega ve values, although only
posi ve values make sense. If all scale items are reliable, the reliability coefficient is 1.
There are some values that help in an assessesment of par cular scale items usefulness:
• the value of αC coefficient calculated a er removing a par cular scale item,
• the value of standard devia on of a scale calculated a er removing a par cular scale item,
• mean value of a scale calculated a er removing a par cular scale item,
• the Pearson's correla on coefficients between a par cular item and the sum of other items.
Split-half reliability
Split-half reliability is a random scale item division into 2 halves and an analysis of the halves
correla on. It is carried out by the Spearman-Brown split-half reliability coefficient, published
independently by Spearman (1910)[75] and Brown (1910)[17]:
rSH
2rp∗
=
,
1 + rp∗
where:
rp∗ − the Pearson's correla on coefficient between halves of a scale.
Copyright ©2010-2014 PQStat So ware − All rights reserved
305
20
RELIABILITY ANALYSIS
If two halves, randomly selected, are ideally correlated: rSH = 1.
A formula for the split-half reliability coefficient proposed by Gu man (1945)[36]:
(
)
sd2 + sd2
rSHG = 2 1 − t1 2 t2 ,
sdt
where:
sd2t1 , sd2t2 − variance of the first and the second half of a scale,
sd2t − variance of the sum of all scales items.
Note
The scale is realiable if the scales reliability coefficients (αC , αstandard , rSH , rSHG ) are larger than 0.6
and smaller than 1.
Standard error of measurement is calculated for the reliable scale, according to the following formula:
√
− for the Cronbach's alpha coefficient of reliability
SEM = sdt 1 − αC
or
√
SEM = sdt 1 − rSH
− for the split-half reliability coefficient
The se ngs window with the Cronbach’s alpha/Split-half can be opened in Statistics menu →Scale
reliability.
E
20.1. (scale.pqs file)
A "competence scale", created in some company, enables an assessment of the usefulness of future
employees. Apart from par cipa on in a job interview, candidates fill in the ques onnaire that includes
the "competence scale" ques ons. There are 7 ques ons in the scale. For each ques on, one can get
1 - 5 points, where 1 - the lowest mark, 5 - the highest mark. The maximum score of the ques onnaire
is 35. In the table, there are scores obtained by 24 candidates.
Copyright ©2010-2014 PQStat So ware − All rights reserved
306
20
Lp
1
2
3
4
5
6
7
8
9
10
11
12
13
14
15
16
17
18
19
20
21
22
23
24
KK1
3
5
5
1
4
4
1
5
3
3
4
1
3
4
1
1
5
5
1
5
5
5
2
5
KK2
3
4
5
2
5
4
1
5
2
4
4
1
3
5
4
4
5
3
1
5
3
5
1
5
KK3
5
4
3
5
5
5
5
5
2
3
3
3
4
5
4
5
5
5
2
5
5
5
5
5
KK4
5
3
5
5
5
5
5
5
5
4
4
4
5
5
4
5
5
5
2
5
5
5
3
5
KK5
5
3
3
5
5
5
5
3
4
4
4
1
5
5
1
5
5
3
2
5
5
5
2
5
KK6
5
5
2
5
5
5
5
5
2
2
4
1
5
5
4
5
5
5
1
5
5
1
4
5
KK7
1
1
1
2
1
3
2
3
1
1
4
3
1
2
4
1
2
4
4
5
1
5
1
5
RELIABILITY ANALYSIS
SUMA
27
25
24
25
30
31
24
31
19
21
27
16
26
31
22
26
32
30
13
35
29
31
18
35
For checking the accuracy of the "competence scale", the reliability should be analysed.
The correla on matrix indicates that the last item is least correlated with the other items. Thus, it is
suspected that the item does not measure the same construct as the others.
The competence scale turned out to be a reliable scale. Cronbach alpha coefficient is 0.736805, and
mean of all the Pearson's correla on coefficients is 0.31847.
Copyright ©2010-2014 PQStat So ware − All rights reserved
307
20
RELIABILITY ANALYSIS
A more precised analysis of each item indicates that, except the last one, they all influence scale reliability in a similar way. Correla on between the KK7 item and the other scales items, is the weakest:
0.026954. Removing the KK7 item from the scale, the Cronbach alpha coefficient would increase to
0.803619.
Similar conclusion can be drawn on the basis of split-half reliability analysis, carried out on the items
randomly divided into 2 halves (KK1, KK3, KK5) (KK2, KK4, KK6, KK7).
Copyright ©2010-2014 PQStat So ware − All rights reserved
308
20
RELIABILITY ANALYSIS
Spearman-Brown split-half reliability Coefficient is 0.857705. Gu man split-half reliability coefficient
is 0.856531. The halves are well correlated − the correla on coefficient is 0.750862. However, the
value of Cronbach alpha coefficient is too low for the second half (0.416958). This half includes the KK7
item, which shows a weak correla on with the other scale items. Removing the item and repea ng the
analysis, all the items are really high and reliable.
Copyright ©2010-2014 PQStat So ware − All rights reserved
309
20
Copyright ©2010-2014 PQStat So ware − All rights reserved
RELIABILITY ANALYSIS
310
21
THE WIZARD
21 THE WIZARD
The Wizard is a tool which makes the naviga on easier to go, through the basic sta s cs included in an
applica on, especially for a novice user. It includes sugges ons of assump ons which should be checked
before the choice of a par cular sta s c test. The last step of the wizard is to select an appropriate
sta s c test and to open the window with the settings of the test options.
The Wizard may be launched by:
- Statistics→Wizard,
- bu on on a toolbar.
A launched wizard window includes the possibility to choose the kind of an analysis that a user wants
to carry out. A user may choose:
Comparison − 1 group - to compare values of measurments coming from a 1 popula on with
the specific value given by the user. This popula on is represented by raw data gathered in a 1
column or cumulated to the form of a frequency table.
Comparison − 2 groups - to compare values of measurments coming from 2 popula ons. These
popula ons are represented by raw data gathered in 2 columns or cumulated to the form of a
con ngency table.
Comparison − more than 2 groups - to compare values of measurments coming from several
popula ons. The popula ons are represented by data collected in the form of raw data, in several
columns.
Correla on - to check the occurrence of dependence between 2 parameters coming from a 1
popula on. These features are represented by raw data gathered in 2 columns or cumulated to
the form of a con ngency table.
Agreement - to check the concordance of obtained measurements. These features are represented by raw data gathered in several columns or cumulated to the form of a con ngency table.
When the user chooses the kind of an analysis, a graph will occur. The graph is divided according to
a scale, on which the measurement of the analysed features was done (interval scale, ordinal scale,
nominal scale).
Copyright ©2010-2014 PQStat So ware − All rights reserved
311
22 OTHER NOTES
The user moves on the graph by selec ng the adequate answers to the asked ques ons. A er the user
gets through the way on the graph, chosen by himself, he is able to perform this test, which − according
to the replies − is an appropriate one to solve the determined sta s cal problem.
22 OTHER NOTES
22.1 FILES FORMAT
PQS - default file format for PQStat files; is used for represen ng all objects created with PQStat
(project,datasheet,report,graph);
PQX - XML file for PQStat, is used for represen ng all objects created with PQStat; PQX files are stored
in Unicode text format (support UTF-8 character encoding); recommended for use on computers with
a small amount of memory.
Copyright ©2010-2014 PQStat So ware − All rights reserved
312
22 OTHER NOTES
22.2 SETTINGS
Copyright ©2010-2014 PQStat So ware − All rights reserved
313
REFERENCES
References
[1] Abdi H. (2007), Bonferroni and Sidak correc ons for mul ple comparisons", in N.J. Salkind (ed.):
Encyclopedia of Measurement and Sta s cs. Thousand Oaks, CA: Sage
[2] Agres A., Coull B.A. (1998), Approximate is be er than "exact" for interval es ma on of binomial
propor ons. American Sta s cs 52: 119-126
[3] Altman D.G., Bland J.M. (1983), Measurement in medicine: the analysis of method comparison
studies. The Sta s cian 32: 307–317
[4] Anscombe F.J. (1981), Compu ng in Sta s cal Science through APL. Springer-Verlag, New York
[5] Armitage P., Berry G., (1994), Sta s cal Methods in Medical Research (3rd edi on); Blackwell
[6] Barnard G.A. (1989), On alleged gains in power from lower p-values. Sta s cs in Medicine 8:14691477
[7] Beal S.L. (1987), Asympto c confidence intervals for the difference between two binomial parameters for use with small samples. Biometrics 43: 941-950.
[8] Bender R. (2001), Calcula ng confidence intervals for the number needed to treat. Controlled Clinical Trials 22:102–110.
[9] Be y R. Kirkwood and Jonathan A. C. Sterne (2003), Medical Sta s cs (2nd ed.). Meassachuse s:
Blackwell Science, 177−188, 240−248
[10] Bland J.M., Altman D.G. (1986), Sta s cal methods for assessing agreement between two methods
of clinical measurement. Lancet 327 (8476): 307–10
[11] Bowker A.H. (1948), Test for symmetry in con ngency tables. Journal of the American Sta s cal
Associa on, 43, 572-574
[12] Breslow N.E., Day N.E. (1980), Sta s cal Methods in Cancer Research: Vol. I - The Analysis of CaseControl Studies. Lyon: Interna onal Agency for Research on Cancer
[13] Breslow N.E. (1996), Sta s cs in epidemiology: the case-control study', Journal of the American
Sta s cal Associa on, 91, 14−28
[14] Breslow N.E. (1974), Covariance analysis of censored survival data. Biometrics, 30(1):89–99.
[15] Brown L.D., Cai T.T., DasGupta A. (2001), Interval Es ma on for a Binomial Propor on. Sta s cal
Science, Vol. 16, no. 2, 101-133
[16] Brown M.B., Forsythe A. B. (1974a), Robust tests for equality of variances. Journal of the American
Sta s cal Associa on, 69,364-367
[17] Brown W. (1910), Some experimental results in the correla on of mental abili es. Bri sh Journal
of Psychology, 3, 296-322.
[18] Clopper C. and Pearson S. (1934), The use of confidence or fiducial limits illustrated in the case of
the binomial. Biometrika 26: 404-413
[19] Cochran W.G. (1950), The comparison ofpercentages in matched samples. Biometrika, 37, 256-266.
[20] Cochran W.G. (1952), The chi-square goodness-of-fit test. Annals of Mathema cal Sta s cs, 23,3
15-345,
Copyright ©2010-2014 PQStat So ware − All rights reserved
314
REFERENCES
[21] Cochran W.G. and Cox G.M. (1957), Experimental designs (2nd 4.). New York: John Wiley and Sons.
[22] Cohen J. (1960), A coefficient of agreement for nominal scales. Educa onal and Psychological Measurement, 10,3746
[23] Cox D.R. (1972), Regression models and life tables. Journal of the Royal Sta s cal Society, B34:187220.
[24] Cramkr H. (1946), Mathema cal models of sta s cs. Princeton, NJ: Princeton University Press.
[25] Cronbach L.J. (1951), Coefficient alpha and the internal structure of tests. Psychometrika, 16(3),
297-334.
[26] DeLong E.R., DeLong D.M., Clarke-Pearson D.L., (1988), Comparing the areas under two or more
correlated receiver opera ng curves: A nonparametric approach. Biometrics 44:837-845.
[27] Fisher R.A. (1934), Sta s cal methods for research workers (5th ed.). Edinburgh: Oliver and Boyd.
[28] Fisher R.A. (1935), The logic of induc ve inference. Journal of the Royal Sta s cal Society, Series
A, 98,39-54
[29] Fisher R.A. (1936), The use of mul ple measurements in taxonomic problems. Annals of Eugenics
7 (2): 179–188
[30] Fleiss J.L. (1981), Sta s cal methods for rates and propor ons. 2nd ed. (New York: John Wiley)
38-46
[31] Freeman G.H. and Halton J.H. (1951), Note on an exact treatment of con ngency, goodness of fit
and other problems of significance. Biometrika 38:141-149
[32] Freireich E.O., Gehan E., Frei E., Schroeder L.R., Wolman I.J., et al., (1963) The effect of 6mercaptopmine on the dura on of steroid induced remission in acute leukemia. Blood, 21:
699–716
[33] Friedman M. (1937), The use of ranks to avoid the assump on of normality implicit in the analysis
of variance. Journal of the American Sta s cal Associa on, 32,675-701.
[34] Gehan E. A. (1965a), A Generalized Wilcoxon Test for Comparing Arbitrarily Singly-Censored Samples. Biometrika, 52:203—223.
[35] Gehan E. A. (1965b), A Generalized Two-Sample Wilcoxon Test for Doubly-Censored Data.
Biometrika, 52:650—653.
[36] Gu man L. (1945), A basic for analyzing test-retest reliabilit. Psychometrika, 10, 255-282.
[37] Hanley J.A. (1987), Standard error of the Kappa sta s c. Psychological Bulle n, Vol 102, No. 2, 315
- 321
[38] Hanley J.A. i Hajian-Tilaki K.O. (1997), Sampling variability of nonparametric es mates of the areas
under receiver opera ng characteris c curves: an update. Academic radiology 4(1):49-58.
[39] Hanley J.A. i McNeil M.D. (1982), The meaning and use of the area under a receiver opera ng
characteris c (ROC) curve. Radiology 143(1):29-36.
[40] Hanley J.A. i McNeil M.D. (1983), A method of comparing the areas under receiver opera ng
characteris c curves derived from the same cases. Radiology 148: 839-843.
Copyright ©2010-2014 PQStat So ware − All rights reserved
315
REFERENCES
[41] Kaplan E.L., Meier P. (1958), Nonparametric es ma on from incomplete observa ons. Journal of
the American Sta s cal Associa on, 53:457-481.
[42] Kendall M.G. (1938), A new measure ofrank correla on. Biometrika, 30, 81-93.
[43] Kendall M.G., Babington-Smith B. (1939), The problem of m rankings. Annals of Mathema cal
Sta s cs, 10, 275-287.
[44] Kleinbaum D. G., Klein M., (2005) Survival Analysis: A Self-Learning Text, Second Edi on (Sta s cs
for Biology and Health)
[45] Kolmogorov A.N. (1933), Sulla deterrninazione empirica di una legge di distribuzione.
Giornde1l'Inst. Ital. degli. Art., 4, 89-91
[46] Kruskal W.H. (1952), A nonparametric test for the several sample problem. Annals of Mathema cal
Sta s cs, 23, 525-540
[47] Kruskal W.H., Wallis W.A. (1952), Use of ranks in one-criterion variance analysis. Journal of the
American Sta s cal Associa on, 47, 583-621
[48] Lancaster H.O. (1961), Significance tests in discrete distribu ons. Journal of the American Sta s cal Associa on 56:223-234
[49] Lee E. T., Wang J. W. (2003), Sta s cal Methods for Survival Data Analysis (ed. third, Wiley 2003)
[50] Levene H. (1960), Robust tests for the equality ofvariance. In I. Olkin (Ed.) Contribu ons to probability and sta s cs (278-292). Palo Alto, CA: Stanford University Press
[51] Lilliefors H.W. (1967), On the Kolmogorov-Smimov test for normality with mean and variance unknown. Journal of the American Sta s cal Associa on, 62,399-402
[52] Lilliefors H.W. (1969), On the Kolmogorov-Smimov test for the exponen al distribu on with mean
unknown. Journal of the American Sta s cal Associa on, 64,387-389
[53] Lilliefors H.W. (1973), The Kolmogorov-Smimov and other distance tests for the gamma distribuon and for the extreme-value distribu on when parameters must be es mated. Department of
Sta s cs, George Washington University, unpublished manuscript
[54] Lund R.E., Lund J.R. (1983), Algorithm AS 190, Probabili es and Upper Quan les for the Studen zed
Range. Applied Sta s cs; 34
[55] Mann H. and Whitney D. (1947), On a test of whether one of two random variables is stochas cally
larger than the other. Annals of Mathema cal Sta s cs, 1 8 , 5 0 4
[56] Mantel N. and Haenszel W. (1959), Sta s cal aspects of the analysis of data from retrospec ve
studies of disease. Journal of the Na onal Cancer Ins tute, 22,719-748.
[57] Mantel N. (1963), Chi-square tests with one degree of freedom: Extensions of the Mantel-Haenszel
procedure. J. Am. Sta st. Assoc., 58, 690-700.
[58] Mantel N. (1966), Evalua on of Survival Data and Two New Rank Order Sta s cs Arising in Its
Considera on. Cancer Chemotherapy Reports, 50:163—170.
[59] Marascuilo L.A. and McSweeney M. (1977), Nonparametric and distribu on-free method for the
social sciences. Monterey, CA: Brooks/Cole Publishing Company
Copyright ©2010-2014 PQStat So ware − All rights reserved
316
REFERENCES
[60] Marascuilo L.A. and McSweeney M. (1977), Nonparametric and distribu on-free method for the
social sciences. Monterey, CA: Brooks/Cole Publishing Company
[61] McNemar Q. (1947), Note on the sampling error of the difference between correlated propor ons
or percentages. Psychometrika, 12, 153-157
[62] Mehta C.R. and Patel N.R. (1986), Algorithm 643. FEXACT: A Fortran subrou ne for Fisher's exact test on unordered r*c con ngency tables. ACM Transac ons on Mathema cal So ware, 12,
154–161
[63] Mie nen O.S. (1985), Theore cal Epidemiology: Principles of Occurrence Research in Medicine.
John Wiley and Sons, New York
[64] Mie nen O.S. and Nurminen M. (1985), Compara ve analysis of two rates. Sta s cs in Medicine
4: 213-226
[65] Newcombe R.G. (1998), Interval Es ma on for the Difference Between Independent Propor ons:
Comparison of Eleven Methods. Sta s cs in Medicine 17: 873-890.
[66] Newman S.C.(2001), Biosta s cal Methods in Epidemiology. 2nd ed. (New York: John Wiley)
[67] Peduzzi P., Concato J., Feinstein A.R., Holford T.R. (1995), Importance of events per independent
variable in propor onal hazards regression analysis. II. Accuracy and precision of regression es mates. Journal of Clinical Epidemiology, 48:1503-1510
[68] Placke R.L. (1984), Discussion of Yates' "Tests of significance for 2x2 con ngency tables". Journal
of Royal Sta s cal Society Series A 147:426-463
[69] Pra J.W. and Gibbons J.D. (1981), Concepts of Nonparametric Theory. Springer-Verlag, New York
[70] Robins, J., Breslow, N., and Greenland S. (1986), Es mators of the Mantel–Haenszel variance consistent in both sparse data and large-strata limi ng models. Biometrics 42, 311–323
[71] Robins, J., Greenland S. and Breslow, N.E. (1986), A general es mator for the variance of the Mantel–Haenszel odds ra o. American Journal of Epidemiology 124, 719–723
[72] Rothman K.J., Greenland S., Lash T.L. (2008), Modern Epidemiology, 3rd ed. (Lippinco Williams
and Wilkins) 221−225
[73] Sa erthwaite F.E. (1946), An approximate distribu on of es mates ofvariance components. Biornetrics Bulle n, 2, 1 10-1 14
[74] Savin N.E. and White K.J. (1977), The Durbin-Watson Test for Serial Correla on with Extreme Sample Sizes or Many Regressors. Econometrica 45, 1989-1996.
[75] Spearman C. (1910), Correla on calculated from faulty data. Bri sh Journal of Psychology, 3, 271295.
[76] Tarone R. E., Ware J. (1977), On distribu on-free tests for equality of survival distribu ons. Biometrica, 64(1):156-160.
[77] Tarone R.E. (1985), On heterogeneity tests based on efficient scores. Biometrika 72, 91–95
[78] Volinsky C.T., Ra ery A.E. (2000) , Bayesian informa on criterion for censored survival models.
Biometrics, 56(1):256–262.
Copyright ©2010-2014 PQStat So ware − All rights reserved
317
REFERENCES
[79] Wallenstein S. (1997), A non-itera ve accurate asympto c confidence interval for the difference
between two Propor ons. Sta s cs in Medicine 16: 1329-1336
[80] Wallis W.A. (1939), The correla on ra o for ranked data. Journal of the American Sta s cal Associa on, 34,533-538.
[81] Wilcoxon F. (1945), Individual comparisons by ranking methods. Biometries, 1,80-83
[82] Wilcoxon F. (1945), Individual comparisons by ranking methods. Biometries, 1,80-83
[83] Wilcoxon F. (1949), Some rapid approximate sta s cal procedures. Stamford, CT: Stamford Research Laboratories, American Cyanamid Corpora on
[84] Wilcoxon F. (1949), Some rapid approximate sta s cal procedures. Stamford, CT: Stamford Research Laboratories, American Cyanamid Corpora on
[85] Wilcoxon F. (1949), Some rapid approximate sta s cal procedures. Stamford, CT: Stamford Research Laboratories, American Cyanamid Corpora on
[86] Wilson E.B. (1927), Probable Inference, the Law of Succession, and Sta s cal Inference. Journal of
the American Sta s cal Associa on: 22(158):209-212.
[87] Yates F. (1934), Con ngency tables involving small numbers and the chi-square test. Journal of the
Royal Sta s cal Society, 1,2 17-235
[88] Yule G. (1900), On the associa on of the a ributes in sta s cs: With illustra ons from the material
o he childhood society, and c. Philosophical Transac ons of the Royal Society, Series A, 194,257-3
19
[89] Zweig M.H., Campbell G. (1993), Receiver-opera ng characteris c (ROC) plots: a fundamental
evalua on tool in clinical medicine. Clinical Chemistry 39:561-577.
Copyright ©2010-2014 PQStat So ware − All rights reserved
318