1
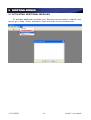
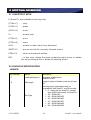
SvanPC+ software USER MANUAL Ver. 1.0 www.svantek.com TABLE OF CONTENTS 1 1.1 1.2 INTRODUCTION..................................................................................................... 2 MAIN FEATURES .............................................................................................. 2 REQUIREMENTS ............................................................................................... 2 2.1 2.2 SVAN PC+ INSTALLATION ...................................................................................... 3 USB DRIVER .................................................................................................... 3 SVAN PC+ ....................................................................................................... 4 2 3 SVAN PC+ INTERFACING TO EXTERNAL INSTRUMENTS .............................................. 5 USB CONNECTION............................................................................................ 5 RS232 CONNECTION ........................................................................................ 5 DATA TRANSFER .............................................................................................. 5 3.3.1 HANDLING FILES....................................................................................... 5 3.3.2 SETTING REAL TIME CLOCK........................................................................ 6 3.3.3 MERGING FILES ........................................................................................ 7 3.4 SETUP FILE EDITOR ......................................................................................... 8 3.5 SV 100 wizard ............................................................................................... 16 3.1 3.2 3.3 4 4.1 4.2 5 6 WINDOWS MANAGEMENT ..................................................................................... 17 ARRANGING WINDOWS .................................................................................. 17 FILES BROWSER ............................................................................................ 18 MAIN TOOLBAR ................................................................................................... 19 VIEWS ............................................................................................................... HEADER INFO ................................................................................................ LOGGER RESULTS .......................................................................................... 6.2.1 PLOT VIEW ............................................................................................. 6.2.2 TABLE VIEW ........................................................................................... 6.2.3 AUDIO EVENTS ....................................................................................... 6.3 LOGGER 1/3 OCTAVE...................................................................................... 6.4 STATISTICS .................................................................................................. 6.5 1/3 OCTAVE STATISTICS ................................................................................ 6.6 FFT............................................................................................................... 6.7 LOGGER COMBINED RESULTS ......................................................................... 22 22 23 24 37 39 42 44 46 47 47 7.1 7.2 7.3 DATA EXPORT ..................................................................................................... MS EXCEL ..................................................................................................... MS WORD ..................................................................................................... CSV FORMAT ................................................................................................. 48 48 51 52 8.1 8.2 8.3 8.4 8.5 CALCULATOR (BASIC) .......................................................................................... ACOUSTICS ................................................................................................... VIBRATIONS.................................................................................................. Statistics calculation ....................................................................................... LOGGER OCTAVES ......................................................................................... CALCULATED RESULTS WINDOW ..................................................................... 54 58 60 61 61 62 9.1 ADDITIONAL MODULES ........................................................................................ 63 ACTIVATING ADDITIONAL MODULES ................................................................ 63 6.1 6.2 7 8 9 10 ADDITIONAL INFORMATION.................................................................................. 64 10.1 SHORTCUT KEYS............................................................................................ 64 10.2 .SVN FILE SPECIFICATION .............................................................................. 64 11 INDEX ................................................................................................................ 67 © SVANTEK -1- SvanPC+ user manual 1 INTRODUCTION SvanPC+ is a software dedicated for SVAN 95x and SV 10x instruments series however it can be also used with old SVAN 94x instrument series if the most recent firmware version in particular instrument is installed. SvanPC+ software is a sophisticated tool which extends functionality of the mentioned instrument series. The SvanPC+ base module is available for all users free of charge. Other modules (e.g. REMOTE COMMUNICATION, BUILDING ACOUSTICS) are optional and have to be purchased. 1.1 MAIN FEATURES measurement results downloading from instrument data files storage information about instrument settings during measurement data visualization table view data files export directly to MS Excel and MS Word or through clipboard simple data post processing (e.g. time history recalculation, spectra comparison) RS 232 and USB interface compatible 1.2 REQUIREMENTS MS Windows 2000 / XP / VISTA* * SvanPC+ runs on both 32bit and 64bit platforms, however USB driver and hence downloading files from the instruments using USB port is currently available only for 32bit operating systems. © SVANTEK -2- SvanPC+ user manual 2 SVAN PC+ INSTALLATION 2.1 USB DRIVER USB driver installation package can be found at the CD received with purchased instrument or it can be downloaded from website: http://svantek.com (path: SUPPORT / DRIVERS / SOFTWARE / USB drivers). Please follow installation instructions. To complete USB driver installation user should connect the instrument after system reboot and select automatic USB driver installation. It may be necessary to repeat the last step for all USB ports. IMPORTANT: Installation of USB drivers requires the user to have administrator privileges. © SVANTEK -3- SvanPC+ user manual 2.2 SVAN PC+ Installing SvanPC+ software can be initiated using provided CD or by downloading the installation file from http://svantek.com (path: SUPPORT / DRIVERS / SOFTWARE / SvanPC+). Please follow installation instructions. © SVANTEK -4- SvanPC+ user manual 3 SVAN PC+ INTERFACING TO EXTERNAL INSTRUMENTS INSTRUMENTS SvanPC+ supports USB and RS232 interfaces for direct communication. Configuration of each interface is different. 3.1 USB CONNECTION Using the USB interface requires appropriate drivers being installed. SvanPC+ will automatically detect instrument when it's plugged-in by USB. 3.2 RS232 CONNECTION Configuration of RS232 interface can be done using ‘RS232 Settings’ command from SVAN menu. This will activate ‘RS232 Settings dialog box’. User may select there such parameters and options as: Port, Baud Rate, Data Bits, Parity, Stop Bits, Flow control, DTR control, RTS control, DSR sensitivity, Out DSR flow, Out CTS flow. After setting RS232 options click the ‘OK’ button to save changes, ‘Cancel’ to discard changes or ‘Default’ to set default values for each setting. Note: ‘Baud Rate’ must be the same in the SvanPC+ application and in the instrument. 3.3 DATA TRANSFER 3.3.1 HANDLING FILES To download data using SvanPC+ software the user has to connect the instrument to a PC and switch it on, then launch SvanPC+ software, click button (or go to menu SVAN and select ‘SVAN Files’ option), select the files to be downloaded, select/create a catalogue to download the data and click to download the selected files. It is possible to download only new files by clicking button. The buttons Results, Logger, Setup and Unknown enable one to filter files against selected categories. © SVANTEK -5- SvanPC+ user manual 3.3.2 SETTING REAL TIME CLOCK In order to set Real Time Clock in the instrument the user has to click on button. The date and time will be transferred from PC to the connected instrument and the ‘RTC updated’ message will appear on the display. It is also possible to set date and time by introducing it in the ‘Customize RTC’ window which is opened by clicking button. © SVANTEK -6- SvanPC+ user manual 3.3.3 MERGING FILES To merge files the user has to select files to be merged, activate merge and click to download the selected files. The files will be button downloaded in the file named Multifile (1), Multifile (2) etc. Note: Only result files can be merged. The measurement settings for merged files have to match. However, integration period and calibration factors may be ignored according to settings in Tools/Main Options/Multifiles. In case settings in merged files do not match the additional list will appear on the file list toolbar in which the files with various settings are grouped and can be browsed. © SVANTEK -7- SvanPC+ user manual It is also possible to merge files which are already downloaded. The user has to select files to be merged and press ‘Open’ (from the window opened with right button of the computer mouse). The files will be merged automatically as it is described above. 3.4 SETUP FILE EDITOR ‘Setup File Editor’ is a SvanPC+ extension that gives its users an easy access to SVAN instruments’ setup files (concerns SV 100 and SVAN 956/957/959 up from 6.09 software version). Thanks to the clear visualization, similar to the menu displayed by the instruments, user may manage settings in a quick and efficient way, creating numerous different configurations and uploading them to the instrument. Created settings can be saved in external files for a possible future reference. Note: As soon as the instrument’s firmware is updated, the binary setup file cannot be loaded. Some instruments, including SV 100 and SVAN 956/957/959, allow one to export the setup file in text form. Such text setup file may be loaded to an instrument with a newer firmware version than upon creating the file. ‘Setup File Editor’ works in the section of the SvanPC+ responsible for the communication between the instrument and computer. The program uses already existing setup files from the instrument. That is why before any modification of a setup file it needs to be downloaded first. Those files which are not downloaded yet (instrument files) are listed on the left hand side of the window. © SVANTEK -8- SvanPC+ user manual In order to access the setup file user must simply select the desired setup file and click on the button ‘Setup file editor’ located in the top right corner of the window or simply double-click the file itself. Double click on a file first creates a temporary file on a local drive which is then opened. Once the file is selected, the module checks its format and, in case of incompatibility, reports an error. If the file format is correct the editor will open the new window with the settings similar to menu structures in SVAN instruments. In the editor, the user is offered one of three views – tree, list and wizards view. The user may select the one most convenient by clicking corresponding buttons. © SVANTEK -9- SvanPC+ user manual The default, tree view, presented below, offers the settings arranged in a form of a tree, resembling settings structure in SVAN instruments. Names in capitals only denote menu tabs, while the others – particular settings. The settings are sorted in accordance to menu structures accessible through display panels of the instrument. © SVANTEK - 10 - SvanPC+ user manual The list view (presented below) shows settings (and only settings, not menu tabs) in a form of a list, containing names of the settings and their current values. The settings are sorted in alphabetical order and any changes made to the settings are automatically updated in the list. By selecting a particular setting in any of the three view modes (e.g. Measurement Mode), the user gains the access to a related group of controls visible in the top right corner of the window. These controls enable viewing and editing the selected setting. Depending on the selected setting following controls are available: • text control – permits editing settings that contain a plain text – user inputs the setting value directly from a keyboard (e.g. 'Server Address' or 'SMS Text' for a Wireless Communication) • scrollable combo box - user modifies the setting value by selecting the desired option from a list supported by the instrument (e.g. Measurement Mode or Integration Time). • check-boxes – ticking the checkbox activates the function or deactivates it (e.g. Logger results). © SVANTEK - 11 - SvanPC+ user manual Some settings are related to each other. It means that one works only when the other is set to a certain value. For example, the 'Auto Save' setting is available only if 'Integration Time' value is equal or bigger than 10 seconds (unless the repetition cycle is equal to 1). If settings of related options are not corresponding, the setup is not available for editing. In the mentioned example, the 'Auto Save’ will not be possible to edit if the ‘Integration Time’ is set to 9 seconds or less. When lack of correspondence occurs, the editor asks for the confirmation. When user chooses to continue the change in spite of the incorrespondence the related setting will be set to a value which will not cause any discrepancy (default). In our example, during any attempt to change the ‘Integration Time’ to 1 second, when ‘Auto Save’ is on, the module will ask for the confirmation. If user proceeds the change the ‘Auto Save’ function will be switched off. ‘Setup filename’, located in the top right corner of the window, allows user to change the original filename. This filename is the filename which is seen by the device after the file is uploaded to its internal flash memory. Changing this © SVANTEK - 12 - SvanPC+ user manual filename is a convenience allowing to store numerous setup files in the device with different filenames. It should be noted that uploading setup file with already existing original filename will overwrite the old setup file. The filename is limited to 8 characters. Buttons, placed in the bottom of the window, are responsible for the file management: • ‘Print’ and ‘Print to file’ buttons allow the user to output the data into either printer or a text file. For both of these options, the data will be arranged much similar to how it is presented in List View, alphabetically, with corresponding values right next to it. The list will have an added label with the type of the instrument for which the setup file has been prepared for. Finally, the data will be sent to either printer (through Printer dialog) or written into selected file in simple text format. • ‘Open file’ - will load a selected local file to the module, allowing the user to modify it. • ‘Save file’ - will save the currently opened setup file to a selected local file. • ‘Upload setup’ – clicking this button will upload the file with current settings into the device. © SVANTEK - 13 - SvanPC+ user manual During the upload, the type of the device and its software version are compared with the file's information and any incompatibilities are reported. If the uploaded file’s software version is different from the instrument’s, the Editor will offer either aborting or upgrading (or downgrading) the file to the format recognized by the device. • ‘Upload setup and activate’ – clicking this button triggers a similar procedure as above, but additionally sends the command to the instrument to load the settings from the uploaded file. The ‘Wizards View‘ enables to set instrument in the simplified way by selecting area to be customized (e.g. Auto-Save, Basic Settings) and following steps supported by the program. The Cancel Wizard button enables to quit the current Wizard without applying the changes made with it. © SVANTEK - 14 - SvanPC+ user manual © SVANTEK - 15 - SvanPC+ user manual 3.5 SV 100 wizard Upon connection the SV 100 instrument the following window appears. SV 100 instrument wizard is described in the quick start guide for SV 100 instrument. The window can also be opened using the toolbar. © SVANTEK - 16 - icon from the main SvanPC+ user manual 4 WINDOWS MANAGEMENT 4.1 ARRANGING WINDOWS The Window menu offers the following commands, which enable you to arrange multiple views of multiple documents in the application window: Command Function New Window Creates a new window with the same class of view as in the active window. Cascade Arranges windows in an overlapped fashion. Tile Horizontally Arranges windows horizontally in nonoverlapped fashion. Tile Vertically Arranges windows vertically in nonoverlapped fashion. Arrange Icons Arranges icons of closed windows. Auto arrange Arranges windows automatically to use all free space of the screen. When this function is active the drawing pin appears in the right top corner of each window and clicking on it enables to keep selected window still visible while next file/window is opened. Common results window Table with results which is usually under the plot is presented as a separate window. Comparison windows Enables to compare values of two or more functions in a table. E.g. we have two opened files with logger results and we open comparison window for logger option. In the tables under the plots we choose logger functions and add it using context menu (opened with right button of the mouse) to a comparison © SVANTEK - 17 - SvanPC+ user manual window – now we can compare values of the functions in the various files. 4.2 FILES BROWSER Files browser (Files list toolbar) enables to choose between opened files. For choosing e.g. file Buffe_40 one should click the name on the list of the opened files (marked on the picture below). To expand the list of the files one should click the mark . © SVANTEK - 18 - SvanPC+ user manual 5 MAIN TOOLBAR The main toolbar called Toolbar is displayed across the top of the application window, below the menu bar. The main toolbar provides quick mouse access to many tools used in SvanPC+. Some of the items listed below can be unavailable depending on a context. To hide or display the main toolbar, click ‘Toolbar’ from the View menu. Icon Function/Command New Window Open Save Save Current View Print Cut Copy Paste Remote Settings © SVANTEK - 19 - SvanPC+ user manual Show/hide instruments wizzard SVAN Files Automatic files download Remote Session Calculator: Calculations Environmental Acoustic* Building Acoustic* RTA* Dosimetry Special Functions * * Modules under development* Send to MS Excel: Send... Ask For Settings Use Last Settings Send to MS Word: Send... Ask For Settings Use Last Settings Table: Normal View Transposed View Plot: Normal Data And Results Only Data © SVANTEK - 20 - SvanPC+ user manual Spectrogram: Normal Data And Results Only Data Text Enables to present header info as a text Change SLM units: Logarithmic Linear Change VLM units: Logarithmic Linear Metric Linear Non-Metric Acceleration Velocity Displacement View Configuration Opens/hides Configurator window Zoom plus (disaggregation) Zoom minus (aggregation)* * Aggregation is available for a range of functions including PEAK, MAX, MIN, RMS, Impulse, markers © SVANTEK - 21 - SvanPC+ user manual 6 VIEWS On the ‘Navigator bar’ (see picture below) there are placed buttons showing data types available in the file you are working with. Pressing a selected button activates a window containing view of an appropriate data type (e.g. Header info, Logger results, Logger 1/3 Octave, Statistics, LN, FFT, Tonality, RT60, Main results etc.). Upon opening a file the 'Header info' view is automatically displayed. To show other data simply press the button you need. 6.1 HEADER INFO Header info view contains basic information about opened file such as device type, settings made in the instrument during measurement, name of the file etc. © SVANTEK - 22 - SvanPC+ user manual 6.2 LOGGER RESULTS Logger results view presents time history of the measurement. Logger results can be presented in plot view (menu: View/Plot View) as well as in table format (menu: View/Table View). The logger file associated with the opened result file may be opened by clicking button. If the button is marked grey it means that there is no connected logger file as stated in the Associated file name field of the Header. The result file connected to the opened logger file is opened with the same button. The button is active if the logger file has been stored by the instrument with the autosave marker option and if a result file corresponding to the main cursor position has been created. © SVANTEK - 23 - SvanPC+ user manual 6.2.1 PLOT VIEW It is possible to select flat or sharp view of logger plot by clicking button which is placed in the left bottom corner of the plot. Units of presented results may be changed by pressing sound measurements results or results. Y-axis can be auto scaled by clicking in case of in case of vibration measurements button. It is possible to change the Y-axis scale of the presented plot by clicking and holding the right mouse button on the left side of the plot (scale area) and moving the cursor up or down. In the left bottom corner of the plot there is a button which enables to open table containing: • Main, #1 and #2 cursors position and a list of currently selected blocks • List of functions and markers stored in the file by the instrument • List of recalculated functions and markers created by the user A similar button in the top left corner enables to expand the table above the plot showing the Active function (see 8.1.1.3), view title and user provided title. In Logger 1/3 Octave view the time signature can be found added to the view title. 8.1.1.1 CHOOSING RESULTS TO BE DISPLAYED, CONFIGURATOR Configurator sub window enables to select results to be presented on the plot or in the table. The configurator is available for most data types. It may be showed/hidden using button from the main toolbar. By default, the Configurator is presented as a tree structure (Channel/Profile). By selecting ‘Flat view’ in ‘Options’ drop-down list the user may change it and view configurator as a plain list. Accordingly to the selection in configurator sub window, functions and markers are displayed. All the selected functions and markers that can be plotted will be listed in the table under the plot. The middle table is reserved for instrument stored data and the right table contains recalculated functions and user’s markers. In the example above user chose RMS, calculated Leq, Max and 1000 Hz RMS time intersection functions. The user disabled Max function in the table (cross) removing it from the plot. © SVANTEK - 25 - SvanPC+ user manual 8.1.1.2 LOCAL PLOT SETTINGS There is a possibility to set various options for logger plot in the window ‘Local plot settings’. The window is accessible from the plot right mouse context menu and View Menu. The user may set: grid colour, grid style, data background colour, options for the main cursor and blocks, colours of curves of functions, line type, total style, number of pixels per sample, maximum and minimum range of the Y axis or auto scale for Y-axis. Default settings for ‘Local plot settings’ window may be adjusted in Tools/Main Options/Graf View window. © SVANTEK - 26 - SvanPC+ user manual © SVANTEK - 27 - SvanPC+ user manual 8.1.1.3 MANAGING MAIN CURSOR Use arrows (marked on the picture below) to move the main cursor. The cursor can be moved also from the computer keyboard and with scroll of the mouse. It is possible to choose active function for the main cursor. Cursor moves only through the points where the active function has values. Active function select list is accessible upon clicking the button in the left top corner of the plot window. © SVANTEK - 28 - SvanPC+ user manual © SVANTEK - 29 - SvanPC+ user manual 8.1.1.4 MANAGING BLOCKS It is possible to mark blocks of data as shown on the picture below. Selecting block enables one to perform calculations on chosen data and it is possible to create markers using the selected blocks. Selecting a block may be achieved with the computer mouse in two ways. Using its left button and selecting required area or using right mouse button and mark beginning and end of the block (Put #1, Put #2) and then pressing ENTER. The start and end points of each existing block are listed in the left table under the plot. © SVANTEK - 30 - SvanPC+ user manual • In order to deselect block the user may use one of three methods: click right mouse button in the plot are, click on ‘Deselect blocks’ option and choose whether to deselect current block (the one selected with the main cursor) or all blocks. © SVANTEK - 31 - SvanPC+ user manual • use © SVANTEK button from the left table under the plot - 32 - SvanPC+ user manual • press ESC, the block containing the main cursor will be deselected. If the cursor is not in the area of any block and there is more than one block the message box “Deselect all selected blocks?” will appear on the display. © SVANTEK - 33 - SvanPC+ user manual 8.1.1.5 Managing markers A marker denotes certain range of data. In the plot view markers can be viewed as horizontal lines beneath the function plot area. Markers may be stored in the file by the instrument or added in SvanPC+ by the user. In case the file contains AUDIO EVENTS the Audio marker is available. In case there were pauses during the measurement, the ‘Pause marker’ and ‘Whole data marker’ are available. The ‘Whole data marker’ may only by presented in table view (see picture below). Also the `Block selection marker`, denoting the current block selection, is applicable only in table view. © SVANTEK - 34 - SvanPC+ user manual In order to create a marker user should select a block and next ‘Edit markers’ option from the plot context menu (available upon right mouse button click within plot area). © SVANTEK - 35 - SvanPC+ user manual A window as presented below appears on the display and the user can name marker and choose its colour. © SVANTEK - 36 - SvanPC+ user manual 6.2.2 TABLE VIEW Logger results can be presented in the table by clicking table button from the main toolbar. It is possible to change table font size in the Tools menu by selecting ‘Grow Table Font’, ‘Shrink Table Font’ and ‘Default Table Font’ . © SVANTEK - 37 - SvanPC+ user manual It is possible to change units of presented results by clicking in case of sound measurements results and measurements results. button in case of vibration Data can be copied to the clipboard using CTRL+C shortcut. ‘Limit time domain to’ option enables to limit the time domain to the one of selected function’s/marker’s. In order to achieve time domain limiting the user has to select the function/marker and click the ‘Limit time domain’ button. On the picture below time domain is limited to Marker 1. In order to remove the limit, user has to click the ‘Options’ button and then ‘Clear time domain limit’. © SVANTEK - 38 - SvanPC+ user manual 6.2.3 AUDIO EVENTS Upon opening the logger results view of a file with audio events, an Event Navigator toolbar pops up (it may be switched on/off in menu View/Event Navigator). It enables to playback recorded signal. © SVANTEK - 39 - SvanPC+ user manual The Events navigator can be used as shown on the picture below: Playback of all events one by one Pause Stop Playback of currently selected event Go to the first event Go to the last event Go to the previous event Go to the next event Automatic adjustment of gain of the signal dependently on how loud the signal was recorded Gain regulation Plays currently selected event from beggining Synchronises cursor’s position for all opened logger windows, e.g. plot and table at the same time © SVANTEK - 40 - SvanPC+ user manual It is possible to choose device to playback audio stream and buffer length in ‘Main options’ window, ‘Audio playback’ section (Tools/ Main Options/ Audio playback). © SVANTEK - 41 - SvanPC+ user manual 6.3 LOGGER 1/3 OCTAVE Time history of 1/3 octave spectrum can be viewed by pressing arrows under the navigator bar The drawing mode of frequency and total values may be adjusted independently in Local plot settings. © SVANTEK - 42 - SvanPC+ user manual For 1/3 octave logger the user may open spectrogram view by clicking the icon. It is possible to adjust the colour scale (regulators appear after clicking on the scale). Channel selection is available through the file toolbar. The main cursor shows the value for the selected time and frequency. © SVANTEK - 43 - SvanPC+ user manual 6.4 STATISTICS The Statistics view may be available both for a main results file and logger file after necessary calculations. By default, Histogram is initially presented. © SVANTEK - 44 - SvanPC+ user manual A switch in the file toolbar enables to display LN statistical values. © SVANTEK - 45 - SvanPC+ user manual 6.5 1/3 OCTAVE STATISTICS In 1/3 Octave stats view, apart from Histogram and LN, LN(f) mode is available. The up and down arrow buttons allow one to browse statistical levels (in case of Histogram and LN mode – frequencies). © SVANTEK - 46 - SvanPC+ user manual 6.6 FFT If the FFT has been stored in the main results file, it is possible to view its plot as well as table form. 6.7 LOGGER COMBINED RESULTS Not every logger result may be presented on the plot. The ‘Logger combined results’ view contains all available logger results e.g. PEAK, MIN, MAX, P-P as well as e.g. METEO results in table form. © SVANTEK - 47 - SvanPC+ user manual 7 DATA EXPORT 7.1 MS EXCEL Sends results contained in the active window to the MS Excel spreadsheet. E.g. logger data export can be achieved by clicking TABLE view, selecting required results to be exported and clicking the © SVANTEK - 48 - icon. SvanPC+ user manual A dialog box presented below will appear. Target Worksheet for selected data, position for data insert, options for inserting Table Header and HeaderInfo may be adjusted. © SVANTEK - 49 - SvanPC+ user manual In case the data range exceeds MS Excel rows or columns number limit, it will be split to more than one worksheet. © SVANTEK - 50 - SvanPC+ user manual 7.2 MS WORD Sending results contained in the active window to the MS Word editor is made similarly as to MS Excel. In order to export current window to MS Word the user has only to click on the Windows Metafiles. © SVANTEK - 51 - button. Graphs are exported as SvanPC+ user manual 7.3 CSV FORMAT Save current view option enables data export to the CSV (comma separated values) format. © SVANTEK - 52 - SvanPC+ user manual The options set in Tools / Main options / Formatting values (e.g. format, precision, decimal point, field separator) affect the result of CSV export. © SVANTEK - 53 - SvanPC+ user manual 8 CALCULATOR (BASIC) • • • • The main features of the Calculator Module are: acoustic and vibration calculations; statistics for logger functions like Peak, Max, Min, Rms, etc.; logger spectrum calculations – functions like Leq, Sel, Lmin, Lmax can be determined from spectrum logger; spectrum averaging (for example from selected blocks or entire logger); The functions available for calculation are listed on the left side of the calculator window. All functions are divided into branches like: acoustic and vibration calculations, statistics, logger octaves calculation, etc. From this list we can select the functions we would like to calculate. The user can select each function separately as well as select whole branch – e.g. all functions from acoustic section. At the right side of the calculator window there are tabs with options and parameters, which are respected in the process of calculating specific functions. The first tab contains channels and profiles selection. One may specify for which profile or channel the calculation will be performed. Each function has its own set of profiles. We can select each profile separately or we can select the groups of profiles at one time. In ‘Parameters’ tab we can define parameters for the currently selected function. For example for the Lden we can define the day-time, evening-time, night-time and also evening and night penalty factors. © SVANTEK - 54 - SvanPC+ user manual In ‘Calculation period(s)’ tab user can see begin and end points of all selected blocks, when the calculator works in block mode or the beginning and ending of whole measurement when no blocks were selected. © SVANTEK - 55 - SvanPC+ user manual ‘Calculation in intervals’ option enables to perform calculations in selected range, using predefined intervals. This option is available when no blocks were selected. User can define start time and stop time of calculations and one of predefined intervals. Here we can decide if we want to show only the values in intervals, only total values or both of them. The first option is used when we are interested in how the values of calculated function were changing during the calculations inside each interval, reaching its final (total) result in the last sample of each interval. The second option is used when we are interested only in total values of calculated function (one value per each interval). ‘Options’ tab contains additional options. Disabling the first option ‘Close window after calculation’ can be used when user wishes to perform more calculations of the same function with different parameters. © SVANTEK - 56 - SvanPC+ user manual ‘Cumulate results’ option may be useful when user works with two or more blocks. The user can decide whether to perform calculations independently in each block or to cumulate calculated results from the beginning of the first block till the end of the last block, omitting the data outside the blocks. © SVANTEK - 57 - SvanPC+ user manual Calculated results are visible on the plot. Under the plot will appear the table with calculated results. In case of in-blocks calculation without ‘cumulate results’ option, ‘Total result’ column indicates the final result of currently selected block calculation. 8.1 ACOUSTICS Calculated values: Leq, Sel, Lden, Ld, Le, Ln, Lmin, Lmax, Ltm5, Tm5, Statistics. The values which can not be calculated due to insufficient data in the measurement file are marked grey. All provided formulae refer to the calculation results in dB units. They are mostly based on logged RMS values in dB units. The k index stands for sample pointer in a given set of data. © SVANTEK - 58 - SvanPC+ user manual LEQ function The LEQ function enables the user to calculate the RMS value of sound pressure in the given period. The value of the LEQ function is calculated according to the formula: 1 k LEQk = 10 log ∑10 RMSk 10 k 1 SEL result The SEL result (Sound Exposure Level) is essentially the subset of the LEQ function. The value of the SEL function is calculated according to the formula (T stands for measurement time): SELk = LEQk + 10 ⋅ log T [s ] 1 [s ] Lden, Ld, Le and Ln results The day-time start point (denoted as Td), the evening-time start point (denoted as Tev), the night-time start time (denoted as Tn) as well as Pe (evening-time penalty) and Pn (night-time penalty) are adjustable in ‘Parameters’ tab. RMS k + Pk Ldenk = 1 n= k −1 Ldenn 10 10 log + 10 RMSk 10 + Pk ∑10 k n=1 0 Pk = Pe Pn for k =1 for k >1 k ∈ (Td , Te > k ∈ (Te, Tn > for k ∈ (Tn, Td > for 1 k Ld k = 10 log ∑10 RMS k 10 k 1 for k ∈ (Td , Te > 1 k Lek = 10 log ∑10 RMSk 10 + Pe k 1 for k ∈ (Te, Tn > 1 k Lnk = 10 log ∑10 RMSk 10 + Pn k 1 for k ∈ (Tn, Td > © SVANTEK for - 59 - SvanPC+ user manual Lmin result Minimum value of the RMS result Lmax result Maximum value of the RMS result Ltm5 and Tm5 results The Ltm5 (Takt-Maximal Levels) and Tm5 results are calculated according to the German standard TA Lärm. 8.2 VIBRATIONS Calculated values: Lmin, Lmax, Total RMS, Vector, Total VDV, Statistics. Lmin result Minimum value of the RMS result Lmax result Maximum value of the RMS result Total RMS (RMS result) The Total RMS result is calculated according to the formula: 1 k TotalRMS k = 10 log ∑10 RMSk 10 k 1 VECTOR The VECTOR is calculated according to the formula: VECTORk = 10 ⋅ log ∑ k TotalRMS n n 2 k ,n where n − channel selection The kn coefficients may be adjusted in the ‘Parameters’ tab. © SVANTEK - 60 - SvanPC+ user manual Total VDV The Total VDV values are calculates as: k TotalVDVk = 5 ⋅ log ∑10VDVk 5 1 8.3 Statistics calculation Statistics may be calculated for several logger stored functions, including Peak, Max, Min, Rms, PP and VDV. Histogram form of the statistics presents the percentage participation of each dB level in given function’s values at 1 dB resolution. LN form of the statistics has a following interpretation: x% of samples has its values equal to or greater than the LNx value. 8.4 LOGGER OCTAVES Calculated values: spectra of Leq, Sel, Lmin, Lmax (calculation is performed separately for each logged frequency). It is possible to calculate averaged spectrum of selected 1/3 octave RMS data range. © SVANTEK - 61 - SvanPC+ user manual 8.5 CALCULATED RESULTS WINDOW Calculated results the calculated functions of calculated functions which the function has result(s). © SVANTEK window is opened by a double click on one of from the table below plot. The window contains a list and provides user with the parameters according to been calculated. It is possible to delete calculated - 62 - SvanPC+ user manual 9 ADDITIONAL MODULES 9.1 ACTIVATING ADDITIONAL MODULES To activate additional modules (e.g. Remote communication module) user has to go to Help / Enter Activation Keys and enter the purchased code. © SVANTEK - 63 - SvanPC+ user manual 10 ADDITIONAL INFORMATION 10.1 SHORTCUT KEYS In SvanPC+ are available short keys like: (CTRL+C) – copy (CTRL+V) – paste (CRTL+Z) – undo F1 – access help (CTRL+P) – print (CTRL+O) – open ALT+… – access to main menu from keyboard SHIFT+F1 – pop up tool tip for currently focused control CTRL+F6 – show next opened window ESC – in plot view, delete the block containing main cursor or delete the only existing block or delete all existing blocks 10.2 .SVN FILE SPECIFICATION - HEADER Byte Number Name Description 0..7 LeadingSequence Sequence of characters: ”SvanPC\x1A\0” 8..9 HdrLength Length in bytes of header (must be at least 32) DocType Document type (maintained only for compatibility with SvanPC .svn file format): • 0 – unknown (for SvanPC), normal (any SVAN instrument) for SvanPC+ • 43 – SVAN 943 • 45 – SVAN 945/955 • 46 – SVAN 946/956 • 47 – SVAN 947/957 • 42 – SVAN 948/958 • 49 – SVAN 949/959 10 © SVANTEK - 64 - SvanPC+ user manual • 53 – SVAN 943 multifile • 55 – SVAN 945/955 multifile • 56 – SVAN 946/956 multifile • 57 – SVAN 947/957 multifile • 60 – SVAN 948/958 multifile • 59 – SVAN 949/959 multifile • 85 – Remote Session log data For DocType != 0 SvanPC+ uses this value to distinguish between singlefile and multifile (instrument type is not interpreted). For new multifiles format SvanPC+ sets this value to 0, and DocTypeEx to 1. 11 UnitNumber Unit number (ignored by SvanPC+) 12 Flags Flags (ignored by SvanPC+) 13 Reserved0 Reserved 14..17 DocLength Length in bytes of document (ignored by SvanPC+) 18..19 DocTypeEx Extended document type: • 0 – old (SvanPC) document type describes the document type • 1 – new (SvanPC+) multifile 20..31 Reserved1 Reserved 32..HdrLength-1 HdrData Additional header information if HdrLength is greater than 32 HdrLength..EOF DocumentData Depends on document type (see below) - DOCUMENT DATA Singlefile For singlefile the DocumentData contains binary file generated by instrument. Format of this data can be found in Appendix B of instrument’s documentation. Multifile (old SvanPC format) For compatibility reasons SvanPC+ reads the old multifile format but it does not create multifiles according to this format so please refer to SvanPC documentation for a description. Multifile (new format) Document data contains a collection of singlefiles generated by instrument (see Singlefile description of document data). Files are written one after each other. Name Description Singlefile1 Binary data of Singlefile1 Singlefile2 Binary data of Singlefile2 © SVANTEK - 65 - SvanPC+ user manual … SinglefileN Binary data of SinglefileN SinglefileInfo1 Information about Singlefile1 (see below) SinglefileInfo2 Information about Singlefile2 … SinglefileInfoN Information about SinglefileN Singlefile1Offset 64-bit offset to Singlefile1 from the beginning of .svn file SingleFileCount 32-bit number of Singlefiles in multifile SingleFileInfo structure is defined as follows. Note that LARGE_INTEGER is a structure (defined in WinAPI) used to describe 64-bit integer value; DWORD is a 32-bit unsigned value. Size Name Description LARGE_INTEGER StartOfs Offset to beginning of file LARGE_INTEGER FileSize File size in bytes DWORD NameLength Length in bytes of file name char[NameLength] Name File name © SVANTEK - 66 - SvanPC+ user manual 11 INDEX .SVN FILE .................................64 activation keys ..........................63 active function ..................... 25, 28 AUDIO EVENTS ..........................39 block ............ 30, 31, 33, 35, 55, 57 calculated results ................. 58, 62 calculator ............................ 54, 55 configurator ........................ 21, 25 csv format.................................52 data transfer .............................. 5 decimal point.............................53 events navigator ........................40 header......................................22 installation ..............................3, 4 Leq .................................... 54, 58 limit time domain to ...................38 logger results ...................... 23, 37 marker ............................... 34, 36 merging files .............................. 7 MS Excel .................... 2, 20, 48, 51 © SVANTEK - 67 - MS Word ......................... 2, 20, 51 multifile ................................7, 65 playback ............................. 39, 41 plot .. 17, 23, 24, 25, 26, 27, 28, 32, 47, 58, 62 Real Time Clock .......................... 6 RMS ................................... 21, 60 RS232 connection ....................... 5 scale............................. 24, 26, 43 setup file.................................... 8 shortcut keys.............................64 spectrogram ..............................43 spectrum ............................ 42, 54 statistics ............................. 44, 46 table............................. 17, 20, 37 text ..................................... 11, 21 toolbar ........................7, 18, 19, 37 USB connection........................... 5 SvanPC+ user manual