1
Dashboard user manual rev2e
3
EXPLAINING THE DASHBOARD ENVIRONMENT
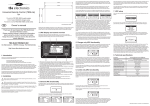
The image below shows an example of the running Dashboard application:
Dashboard features a so-called MDI interface with a Device Manager on the left side and a
working area on the right side of the screen. When one or more devices are connected to
your PC, corresponding icons will appear in the Device Manager window. A double click on
one of these icons will launch a linked control panel in the working area. This control panel
shows real time data from the corresponding device. Depending on availability from the
corresponding device, up to three white buttons on the bottom side of the control panel will
activate the Status, History and Setup Windows. In the above image, the Setup window of an
e-xpert pro battery monitor is activated. Selecting an icon in the Device Manager will also
create a dedicated pull down menu in the menu bar.
3.1
The Menu bar
The menu bar contains six pull-down menus, each offering a number of corresponding
execution commands.
-6-