1
TiaPlus
Users Manual
© 1998-2013, M. & R. Department, Cito, Arnhem, NL.
References
TiaPlus is focused on "classical" test and item analysis. A few references for this subject area are:
•
•
•
•
•
Crocker, L., & Algina, J. (1986). Introduction to classical and modern test theory. New York:
Holt, Rinehart and Winston.
Cronbach, L.J. (1951). Coefficient alpha and the internal structure of tests. Psychometrika, 16,
297-334.
Guilford, J.P., & Fruchter, B. (1978). Fundamental statistics in psychology and education.
Tokyo: McGraw-Hill.
Gulliksen, H. (1950). Theory of mental tests. New York: Wiley.
Lord, F.M., & Novick, M.R. (1968). Statistical theories of mental test scores. Reading: AddisonWesley.
Availability
TiaPlus is available free of charge to users, provided the program is solely used for scientific
purposes. It is not allowed to use TiaPlus for any commercial purposes. Visit the TiaPlus website at:
http://tiaplus.cito.nl
Disclaimer
TiaPlus is provided "as is" without warranty of any kind. Cito disclaims all warranties, either express
or implied, including the warranties of merchantability and fitness for a particular purpose. In no
event shall Cito or its suppliers be liable for any damages whatsoever including direct, indirect,
incidental, consequential, loss of business profits or special damages, even if Cito or its suppliers
have been advised of the possibility of such damages. Some states do not allow the exclusion or
limitation of liability for consequential or incidental damages so the foregoing limitation may not
apply.
See the appendix for a list of 'known issues' in the current version of TiaPlus.
Performance
TiaPlus is not primarily designed for utmost processing speed. However, TiaPlus currently processes
a 290 item multiple choice test administered to 139.725 students in approx. 1.5 minutes on a 3 Ghz
Intel Pentium PC (1 Gb RAM).
Credits
Several persons helped in one or more ways to create TiaPlus. To name a few:
• Prof. Dr. Norman Verhelst (GLB routine, Polychoric correlations)
• Dr. Ron Engelen (Factor Analysis routines)
• Dr. Huub Verstralen (Partitioning routines for score frequency distributions)
• Prof. Dr. Piet F. Sanders
• Peter Goldebeld
• Maarten de Groot
• Niels H. Veldhuijzen
• Geert Evers and Jan Kiwitz (installer)
Valuable input was also obtained from several TiaPlus users and beta testers:
• Drs. Noud van Zuijlen
• Ir. Frans Kleintjes
• Prof. Dr. Theo Eggen
• Dr. Timo Bechger
• Dr. Bas Hemker
• Dr. Anton Béguin
Spanish language translations: Dr. Cesar Merino Soto (Peru) and Dr. Frank Agerkop.
Ton Heuvelmans (Software Developer)
2
TiaPlus Users Manual
Classical Test Theory framework
TiaPlus is a 32 bits Windows computer program for Test and Item Analysis (TIA for short). The basic
assumption underlying TiaPlus is that the observed score (X) of one person on one item is actually
the sum of two components: the so-called true score (T), and an additional error component (E): X =
T + E. This is the central equation of the Classical Test Theory from which many statistics are
derived that TiaPlus calculates.
Limitations
TiaPlus is geared towards complete designs in which basically all persons provide item answers to
all items. If you are using incomplete block designs in most cases TiaPlus is not suitable and you
might want to use IRT (Item Response Theory) based analysis software like OPLM (DOS software)
or its Windows based successor (under construction). However TiaPlus can handle a modest
amount of missing values (Missing at Random), i.e., persons not answering one or more items.
Approx. 10% or 15% missing answers are tolerable. Structural misssings (missings are 'missing by
design') are not allowed in TiaPlus, that is: It gives bogus results.
TiaPlus currently provides two ways to handle missings:
• Treating a missing value as a zero score (replacing the missing answer with a false answer,
zero points), this is the standard, default, and recommended approach,
or
• Treating missing as a missing (i.e., not using the missing answer in all calculations). In this
mode TiaPlus uses 'pairwise deletion', so it keeps using the maximum information available.
Note that this makes calculations (and interpretations) sometimes very difficult.
Dual perspective
TiaPlus can be used to obtain information about items, provided an adequate population of persons
is used. Once the items and a test seem OK, TiaPlus can be used to obtain information about
persons (e.g., students). So the dual perspective is:
• Testing the items
• Testing the persons
In reality sometimes both are not always so neatly separated. Or one uses an interactive process:
analyzing, adjusting the analysis specifications (e.g., discarding items that do not meet some
standard), reanalyzing, and then proceed to inferences about student's competences.
Preparing an ASCII/ANSI Text data set
On startup TiaPlus assumes that an ASCII text or ANSI text format input data set is available.
Unicode (double byte) data sets can be used as well. This data set must contain the item answers
from all persons on all the items involved. So if you have 1000 persons and 50 items, the data set
will contain 1000 * 50 = 50.000 item answers. In order to be able to manage persons (e.g.,
separating Males and Females) a data set can contain personal ID information uniquely identifying
each person. The setup of the data set has to be organized row wise: One row of information per
person. If there is personal ID information, it has to be in front of a row. Item answers follow in a
fixed order: the first item answer pertains to the first item administered, the second item answer to
the second item administered, etc. So if there are 1000 persons (say students) that took the test, the
data set must contain exactly 1000 records (rows). Avoid any empty records.
TiaPlus can handle ASCII/ANSI text format data sets in two flavors:
•
Comma Separated Values (.csv) style, in which all entries are separated by a comma, like in:
Johnsson M. Gloucester College MA 1252413,E,D,A,B,A,D,A,E,D,(...)D,A,E,D,A,B,A,D
Arnesen B. Gloucester College MA 1555417,A,D,A,B,A,D,A,D,D,(...)D,A,A,D,A,A,A,A
Dison G. Lipton College NY 4442413,A,A,A,B,D,D,A,D,D,(...)D,A,A,D,B,B,B,B
.
.
The person ID segment per record (line) can be variable length (length 0 is allowed) and must be at
the beginning of each record. Item answers start after the first comma, separated from each other by
3
a comma. Technically spoken all lines must be terminated with a Carriage Return-Line Feed
combination (an ASCII 13 ASCII 10 pair, or 0D 0A in Hex). A text processor program would call this
a Hard Return. Empty records are not allowed. TiaPlus interprets an empty record as an 'end of file'
condition. CSV type files can be produced using Microsoft Excel. Please check (via Start > Settings
> Control Panel in Regional Settings, number tab) that the comma is used as List Separator. Excel
will not take the comma as list separator if Windows also uses the comma as decimal separator, so
change this to the dot "." as decimal point if necessary. If the dot is the decimal separator, it cannot
be used by Windows as the number group separator. Change this to the comma.). Note that in CSv
files TiaPlus always expects an ID field (even empty), so that the first item (item answer) must have
a leading comma. The ID field must have no leading spaces.
•
Standard ASCII/ANSI Text (.txt) style, using fixed width fields for ID and item answers, like in
Agostini G. Brennan School, NY 77524451
EDABADAEDADAEDADAEDA(...)DAEDABADADAED
Hakkinen M.. Dennis Coll., MA 83332454
EBAECDEBBCEAEDADAEDC(...)DAEDABADADAED
Schumacher M. Brent School, NY 57524357
EDABADAEDADAEDADAEDE(...)DEBCDEBDCDAED
Doohan M. Sidney School, 67525456
EDABADAEDABBEBBEBEDD(...)ACBDBCDBCDBED
Rossi V. Rapid Drive school, 63698776
BEABBBABBBEBBBABBEBB(...)DEMEMDAMCMDDE
.
The above example shows that the person ID part has a fixed length (here 41 positions). The item
answers start at position 42. So position 42 is the 'position at which the first item answer starts'. In
case of a data set of this type TiaPlus only asks this first item starting point and derives the ID part
length from it. Also note that with this data set type TiaPlus requires the length of an item answer
field to be the same for every item. Commas play no role. The approach is purely positional. Again
all lines must be terminated with a Carriage Return-Line Feed combination (an ASCII 13 ASCII 10
pair, or 0D 0A in Hex). Excess record length is allowed. Empty records are not allowed. TiaPlus
interprets an empty record as an 'end of file' condition. Standard ASCII text files of this nature can
be created in a variety of ways. A very good, easy to use and free ASCII (data) editor is TextPad
(Helios Software, UK). Visit their Internet web site at: http://www.textpad.com/
Note: Avoid having TAB characters (the ASCII 09 character) in your data sets.
Line termination
As TiaPlus works on the Windows PC platform, all lines (records) in an input data set must be
terminated with a Carriage Return-Line Feed combination (an ASCII 13 ASCII 10 pair, or 0D 0A in
Hex). If your data are coming from one or more different platforms, like Unix or Macintosh, please be
aware that files from these platforms can have other line termination characters (Unix uses LF, Hex
0A; Mac uses CR, Hex 0D). You can use TextPad to convert to the correct line termination by using
the Save as... option and then specify the "file format" as "PC" and the "encoding" as "ANSI". By
editing an entry in the [Misc] section in the TiaPlus.ini file (change CheckLineTermination=0 to
CheckLineTermination=1) you can make TiaPlus check for, and correct invalid line termination bytes.
MS Excel (*.xls and .xlsx) data files
Some TiaPlus users have indicated that they would like to let TiaPlus analyse data contained in a
MS Excel spreasheet file (*.xls). These ary binary files. TiaPlus offers the functionality to be able to
take Excel spreadsheet files (*.xls) as data input files. Some restrictions apply here: Older Excels
sheets have a maximum of approx. 16.000 rows (Excel 97). Later Excel versions (Excel 2000, 2003)
are restricted to approx 65.300 rows. The .xls file to be processed by TiaPlus must have its data on
the first workskeet (e.g., Sheet1$), the dataset must be rectangular, max. 5 header row(s) e.g.,
containing header titles, captions, etc. No empty rows are allowed. No graphic images may appear in
the spreadsheet. To be able to use .xlsx files (these are zipped XML files) your PC must have Office
2007 or later installed. If not, download and install MS Office 2007 system driver (data connectivity
components) from http://www.microsoft.com/downloads/details.aspx?FamilyID=7554F536-8C284598-9B72-EF94E038C891&displaylang=en
TiaPlus demo dataset Testset.csv
The TiaPlus installation directory (by default C:\Cito\TiaPlus) contains an example demo input
dataset called Testset.csv for which the TiaPlus database (TiaPlus2000.mdb) holds all metadata.
Please note that if you chose to install TiaPlus to a different installation directory (e.g.,
4
D:\MyProgs\TiaPlus) you will need to change (using MS Access) the 'File' field in the 'Dataset' table
accordingly.
Criterion scores
TiaPlus can calculate the correlation between your test's item scores (and MC 'alternative scores', if
any) and an external criterion measure (an external criterion). TiaPlus expects and reads the
external criterion score values in the last four positions of the person identification string. See the
example file Testset.csv (by default in your installation directory C:\Cito\TiaPlus) where the last four
positions of the ID string contain the total test scores from a certain test.
Item scores must be integer values
TiaPlus always expects integer (non-fractional) values (0-254) for item scores in your input data set.
Like in the possible item scores 0, 1, 2, 3, 4 for an open ended item. The item weight factor (see
below) can be used to analyze data as if 'fractional' item score values were assigned, like 0.10,
0.25, 0.50, 0.75, 1.00. TiaPlus will warn if an item weight equals 0.00.
General rule -- the 1 : 5 ratio
Much of the work that TiaPlus does has to do with counting, determining proportions, determining
variability (standard deviations, variances), calculating correlations, etc. In order for results to be
interpretable and meaningful there must exist a reasonable number of items and observations
(persons answering items). A rule of thumb for a minimum of observations is the 1 : 5 ratio. That is:
Try to have at least 5 times the number of persons, compared to the number of items in a test. In
other words, if a test or subtest has 40 items you will need 200 persons taking the test as a
minimum.
If there are very few persons taking a test (or subtest), say 35 or less, TiaPlus might have troubles
producing Item graphics, DIF graphics and DIF statistics, where the program attempts to partition
the score frequency distribution in four equal sized segments. In such cases disable these options
and run the analysis again.
TiaPlus web page
The TiaPlus user interface (Wizard screen 1 > 'About' button) presents a link to the TisPlus web
page. On this page the current TiaPlus 'update' version plus some other material can be
downloaded.
The rest of this manual
In the remainder this manual will show (most of) the screens that you will encounter using (the user
interface of) TiaPlus. Each display will be accompanied with some explanatory text.
TiaPlus is designed like a 'wizard' application: in a series of 6 subsequent screens you are guided
through all necessary steps to let TiaPlus obtain enough information from you to be able to do the
analysis.
5
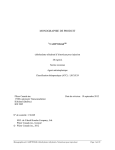
Wizard Screen 1
Job name and Input data set specification
Titles, Database Maintenance and Preferences
The Job name field is intended to hold a short descriptive name for your analysis. TiaPlus will use
this name later on to create the default names for the several TiaPlus output files. In Wizard screen
6 you will be able to edit or modify these default output file names.
The Input Data Set File Name field must contain a valid file name for the file containing the item
answers TiaPlus is going to score and analyze. The small dotted button to the right of this field
allows you to select a file from the directories you have access to. Note that the full file name
(including drive letter and path specification) is used to identify the item information you will specify
(or have specified) for this input data set.
If the TiaPlus database does not hold a reference to this input data set file, the program will query
you about item information such as item key, item maximum score, number of alternatives, item
weight and so on. If the new input data set has (exactly) the same number of items and the same
item characteristics (like item type, key, number of alternatives, max. score, weight, etc.) as a
previous data set, you can select that previous dataset as a template. In this case item information
(characteristics) and subtest information (if available) will be copied from the template to the
database table for the new data set. If the TiaPlus database does already hold this information (e.g.,
from a previous session) the program retrieves this information from the database and returns to the
Wizard screen. The identification using the full input data set file name means that once item
information data about this file is stored in the TiaPlus database it is not possible to alter the file's
name or location. If you do, TiaPlus will consider it as an entirely new input data set and will query
you again for all item information. Altering the contents of an input data set after declaring it to
TiaPlus can render the item information invalid and the scoring and analysis may fail or produce
unexpected results.
Pos Nr 1st Item
If the input data set is an ASCII text fixed format file (and not a .CSV -comma separated values- file)
then TiaPlus needs to know at which position in the data set the first item answer starts. This textbox
is disabled if the input data file does have a .csv or .xls extension.
6
Field length
If the input data set is an ASCII text fixed format file (and not a .CSV -comma separated valuesfile) then TiaPlus needs to know how many positions (characters) each item answer or item score
occupies. Allowable range is 1 - 99. This textbox is disabled if the input data file does have a .csv or
.xls extension.
Start Column 1st Item
If the input data set is a (binary format) MS Excel spreadsheet file (.xls extension) then TiaPlus
needs to know in which Excel column (allowed: A-Z) the first item is located. This textbox is disabled
if the input data file does not have an .xls extension.
# of Header rows
If the input data set is a (binary format) MS Excel spreadsheet file (.xls extension) you can specify
that this file will have up to 5 (allowed: 0 to 5) so called 'header rows'. These are rows (records) that
do not contain data to be analyses, but e.g., titles, descriptions, text, etc. This textbox is disabled if
the input data file does not have an .xls extension.
Population description
In this field you can enter a short description for the population of testees. TiaPlus will use this text
to label your output files.
Test description
In this field you can enter a short description for the test. TiaPlus will use this text to label your
output files.
A few notes on Database storage
TiaPlus will store the job name and both descriptions as properties of the input data set file name in
its database. Also output file names used will be stored. When TiaPlus accesses the same input
data set at a later time this information will be retrieved. This feature is created since in practice
analyzing a data set most likely is a process to be repeated one or more times.
The standard (local) TiaPlus database is <TiaPlus installation directory>\TiaPlus2000.mdb, where
<TiaPlus installation directory> normally is C:\Cito\TiaPlus.
By changing an entry in the TiaPlus.ini file you can force TiaPlus to use another (perhaps remote)
TiaPlus database as its standard database. Directions: Exit the TiaPlus application. Open the
TiaPlus.ini file using an ASCII text editor (like TextPad, or Notepad) and under the [Database]
section locate the entry 'CurrentDB'. After the = sign enter the full name of the new database (i.e.,
including drive and path). Save the .ini file and restart TiaPlus. It is imperative that the new database
is a genuine TiaPlus MS ACCESS 2000 database (same structure). However, it can have a different
file name, like "John Does TiaPlus2000.mdb" (without the quotes).
If database disaster strikes
Exiting the TiaPlus application invokes a procedure that checks and compacts the TiaPlus database
and creates a backup version of it (named TiaPlus2000.bak) located in the TiaPlus installation
directory, normally C:\Cito\TiaPlus\. In case the TiaPlus2000.mdb cannot be used anymore (file
damaged, corrupted, lost), you can make a copy of TiaPlus2000.bak and rename this copy to
TiaPlus2000.mdb. Then try again. Another solution is to use the EmptyTiaPlus2000.mdb database
(contains just the structure, no data, except for the "testset" data example) in a similar fashion.
About button
Below the TiaPlus logo is a small 'About' button. This button will show you the next screen
7
displaying the TiaPlus version number and some credentials. It offers the opportunity to quickly visit
the Cito website on the world wide web and to send an e-mail message to the Cito M&R department
where TiaPlus is developed.
Check for update button
Also below the TiaPlus logo is a small 'Check for update' button. Use this button to have TiaPlus
check the Cito download server location to see if a newer version, i.e., a higher build number of the
TiaPlus software is available.
Unknown Input data set file name
If the TiaPlus database does not hold a reference to the input data set specified, the program will
ask you if you want to supply all information manually -entering 'predominant item information', see
below-, or by using a 'template'.
Using a template means that you will be able to refer to another input database file name (already in
the TiaPlus data base, same number of items, same item characteristics) which characteristics are
also valid for the new input data set. TiaPlus will present the next screen, from which you can select
any input data set (processed before). The ordering of this list is 'Most Recent On Top'. Note the
"Remote Database" button on the lower left corner. It allows you to refer to a 'remote' (other)
TiaPlus database, and make your selection there. Selection means that all information will be copied
--appending-- to your own TiaPlus database.
8
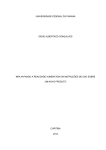
Selecting 'Manual' means that TiaPlus will query you about item information such as item key, item
maximum score, number of alternatives, item weight and so on, using the next screen:
In this dialog, predominant item information can be provided. 'Predominant' means that information
can be given that is valid for all, if not for the majority of the items in the input data set. Note that in
Wizard screen 3 individual (item level) adjustments can be made.
The Predominant Item Information screen has the next entries:
Start position item answers
Enter the number of the position in the data record (data record = line in the input data set) at which
the first item answer starts. Note that this field is unavailable if a CSV or XLS type file is being
processed.
Field length per item
Enter a number indicating how many positions an item answer occupies. TiaPlus assumes item
answer field lengths to be equal for all items. Note that this field is unavailable if a CSV or XLS type
file is being processed.
9
Start column item answers
Enter the letter (A-Z) of the column in the Excel spreadsheet file where the first item answer is
located. Note that this field is unavailable if a CSV or Fixed format ASCII text type file is being
processed.
# of Header rows
If the input data set is a (binary format) MS Excel spreadsheet file (.xls extension) you can specify
that this file will have up to 5 (allowed: 0 to 5) so called 'header rows'. These are rows (records) that
do not contain data to be analyses, but e.g., titles, descriptions, text, etc. This textbox is disabled if
the input data file does not have an .xls extension.
Total number of items
Enter the total number of items in the input data set
Item bank number
Optional. Enter an alphanumeric string (max 22 characters) indicating the item bank locations the
items are coming from.
Item type number
Select an item type from the drop down list or type its item type code number:
1. Open -- Open Ended question
2. Scale -- Scale question
3. MC1 -- Multiple Choice question (one answer)
4. MC2 -- Multiple Choice question (more than one answers, holistic scoring)
5. MC2R -- Multiple Choice question (more than one answers, partial scoring)
See the text on Wizard Screen 3 below for details.
Missing value character
Enter the character(s) that represents a missing item answer in the input data set. Beware for using
spaces, as they are difficult to see. Note that with Multiple Choice items (one alternative correct, i.e.,
type 3, MC1) TiaPlus will treat any answer that is not a valid answer (correct or incorrect) as a
missing answer.
OMR code number
Enter the code number associated with the required conversion from raw item answer (data entry)
codes to actual (intended) item answer codes. An example is the 0, 1, 3, 5, 7 coding from an Optical
mark reader machine (OMR), in which 0 represents a missing item answer, 1 represents the answer
A, 3 represents the answer B, 5 represents the answer C and 7 represents the answer D. You can
select one of the possible OMR conversion codes from the drop down menu next to the 'OMR code
number' field.
Number of alternatives
Enter the number indicating how many alternatives the Multiple Choice item has. Note that
alternatives are sometimes called 'distractors'.
Number of answers required
Enter the number indicating how many answers (alternatives) per item must be selected.
Item minimum score
Enter the unweighted item minimum score. That is: the score a testee gets if the item answer is
totally incorrect. Default value is zero (0). Enter an integer value.
Item maximum score
Enter the unweighted item maximum score. That is: the score a testee gets if the item answer is
correct. Default value is one (1). Enter an integer value.
Item weight
Enter the weight factor (not equal to 0.00) that TiaPlus must use to arrive at the weighted item score.
Although this practice is not recommended, TiaPlus allows you to use negative weights, like -1.00.
10
Item scores are then taken as 'penalty points'. The interpretation of the item P-value (being a
negative number, like -75) then changes to 'the average proportion of penalty points assigned'.
The button Check records performs a validity check on the input data set specified:
1. The number of records, i.e., the number of persons is counted.
2. The total number of item answers is counted, and checked against the expected number (i.e.,
number of records x the number in the 'Number of items' field)
Press this Check records button before leaving this screen using the OK button.
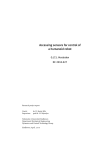
In Wizard screen 1, after pressing the Database Management... button:
In this screen the information for a certain input data set can be removed from the TiaPlus database:
highlight the file name and click the 'Remove' button. The ordering of this list is 'Most Recent On
Top'. If you want to work again with an input data set analyzed before, double-click the file name
and (if the file still exists) TiaPlus will make this file the current input data set.
After pressing the Preferences... button:
In this screen it is possible to switch between two ways of treating missing values (item answers or
item scores that are missing in the input data set, designated by the 'Missing value character', see
below). Most common is to treat missings as zeroes (nil scores). If required you can choose to treat
missing values as missings. That is: these values will be left alone and will not be part of any
calculations.
TiaPlus has the capability to switch at 'run time' between languages for the application interface
(descriptions, labels, buttons, etc.) and for the output. Currently implemented are: English, Spanish
(under construction) and Dutch.
11
Wizard Screen 2
Allows you to create, modify and delete Subgroup specifications.
This list shows the subgroups declared so far.
After pressing the Add subgroup... button:
Here you can specify the information that TiaPlus needs for the next subgroup. The assumption is
that a subgroup can be identified by TiaPlus looking at a portion (string) in the ID part of a data input
record. So TiaPlus needs to know at which position this string starts, how long this string is, what the
contents must be (using operator =) to have TiaPlus recognize the person as belonging to this
subgroup: the value field. In the example above any person having a value 1 in position 1 will be
considered as a member of subgroup 3. Other operators you can choose from, like <=, >=, <, >, and
<> add some flexibility. Note that at this point TiaPlus currently does not check the existence of a
sufficient number (>= 3) of persons in this subgroup to be able to perform an analysis. This check
occurs entering the scoring phase (after pressing the Finish button in the last Wizard screen, number
6). Note that values for the subgroup identification must be WITHIN the ID part of the data input
record.
12
Wizard Screen 3
Item characteristics and Scoring Key information
In this screen you can view and edit the item information TiaPlus needs for scoring and calculating
results. The Alt-F7 keyboard shortcut is available to quickly fill a column with repetitious data. See
below. The order of the columns is user configurable (Press Ctrl key, select the column and drag it)
and will be retained by TiaPlus across sessions. Clicking a column header temporarily sorts the
table ascending on the field selected. Click again to restore the normal (item number) ordering.
Proceeding to the next or previous Wizard screen or importing Labels or Key information will undo
any sorting and restore the table to the default (normal) ascending item (sequential) number
ordering. As described below the Alt-F8 keyboard shortcut is available to import column
information from an external ASCII (text only) file. You can use the Ctrl-V (or Shift-Ins) keyboard
combination to paste columnar data you copied to the Windows clipboard elswhere (e.g., in MS
Excel, MS Word, or in TextPad.
The Scoring Key Information Table has the next column headings:
Item Number
TiaPlus handles items after assigning them a sequential (or serial) number: the first item in the input
data set gets number 1, the second item gets number 2 and so on.
Item Label
This field allows you to enter a name or label (max. 19 characters, alphanumeric) to further identify
your items. The item label will be visible (leftmost 9 positions only) in item-oriented output. This field
is optional. In this column the Alt-F8 keyboard shortcut is available to quickly fill the cells in this
column with item labels that are available in a separate plain vanilla ASCII text file (in which each
item label occupies a separate line. Comment lines starting with a semicolon (";") are ignored while
reading).
Item Bank Number
This entry allows you to register the origin of the item, for instance its ID number in the item bank
system that is used (max. length = 22 characters). This field is optional.
13
Item type
TiaPlus treats an item answer depending on the type of item:
Open -- Open Ended question the item answer is a numeric score ranging from the Minimum
item score to the Maximum item score. Note that if opend ended scores are numeric, an open ended
question has 0 (zero) alternatives.
Another form is when open ended item answers are coded i.e., the item answer is a character A, B,
C, etc. in which each character represents a certain numeric score, e.g., A=0, B=1, C=2, etc. In this
last case it is required to specify the number of characters available in the 'number of alternatives'
column.
Scale -- Scale question the item answer is a numeric score ranging from the Minimum item
score to the Maximum item score, e.g., 1 to 5 in a Likert type question (disagree - agree). Usage of
this type is not recommended (experimental). A work around would be to simply recode the item
answers from (e.g.,) 1, 2, 3, 4, 5 to 0, 1, 2, 3, 4 and to use item type 1 (open ended).
MC1 -- Multiple Choice question having two or more alternatives (options), only one of them is
the 'correct' answer, the rest of them are distracters. The item answer is a character (A, B, C, etc, or
a, b, c, etc.) or a digit (orr numeric code label, like 0, 1, 2, etc).
Note that TiaPlus allows MC1 items to have a multiple key (like BC) in which case the item answer
is compared (in turn) to all elements in the multiple key string. If the item answer matches an
element of the key the item answer is regarded as 'correct'.
MC2 -- Multiple Choice question having two or more alternatives (options), two or more of
them together establish the 'correct' answer to be rewarded with the maximum item score. The item
answer is an alphanumeric string, for instance BDE. Note that with this item type the element order
is important, if the key is "BDE", and the item answer is "BED" the student gets no credit as the item
answer is regarded as false (patterns don't match).
MC2R -- Multiple Choice question having two or more alternatives (options) using partial
credit. The item answer is an alphanumeric string, for instance ADG. A partial item score is
rewarded for each option selected correctly. The item score is the sum of the partial item scores. An
example would be the item answer ADF with a key ADG. In this case the student would be getting 2
points (out of 3 possible) since the two answer elements (A and D) both appear in the key. Likewise
an answer like DAF or FAD or DFA would yield 2 points.
Number of Alternatives
Multiple-choice items must have 2 or more alternatives. Per item TiaPlus needs to know how many
alternatives are available. For Open or Scale type questions (having no alternatives) enter a value of
0. However, for Open-ended items which use characters (like A, B, C) or numeric code labels for
item answers, it is required to specify the number of characters available in this column.
MC Item Key
For each Multiple-choice item TiaPlus needs to know which character(s) are to be treated as the
right answer. Note that Key characters must be in 'converted' form as TiaPlus does the conversion
specified in the OMR code specification first and then matches the answer against the key.
Multiple Key: In the above example MC1 type item 19 shows the case of a 'double key', stating that
both a B answer or a C answer will be considered as a correct answer. Note that there must be no
comma's or spaces between the key characters. Multiple choice items of type MC2 and MC2R
require a key containing two or more characters.
For Open or Scale type questions (having no 'correct' alternatives) leave this field blank.
In this column the Alt-F8 keyboard shortcut is available to quickly fill the cells in the MC Item Key
column with item key information available in a separate plain vanilla ASCII text file (in which each
item key occupies a separate line. Comment lines starting with a semicolon (";") are ignored while
reading). Check that the ASCII file does not have any trailing empty lines.
Note that per line the file must hold the MC key for an MC type item (type 3, 4 or 5) or the Item
Maximum Score for Open Ended questions (type 1). TiaPlus iterates through all items and either
places the MC item key (if the item is MC type), or places the item maximum score (if the item is
Open Ended type. For this to happen the column Item Type must be completed before.
Number of answers required
Obviously each item requires at least one item answer (or an item score in Open and Scale
questions). For MC2 and MC2R type items specify how many answers the student is required to
give.
14
Min. Score
This is the (unweighted) score value that will be assigned to a person who answers the item
incorrectly.
Max. Score
This is the (unweighted) score value that will be assigned to a person who answers the item
correctly.
Missing Value Character
This field holds the character string that is used to represent a missing item answer in the input data
set. Common strings are "*", "M", "X", "0" (zero) or " " (space, not recommended). Note that in
addition TiaPlus will consider an empty (or entirely space filled) item answer field as a missing value.
With Multiple Choice items (one alternative correct, i.e., type 3, MC1) TiaPlus will treat any answer
that is not a valid answer (correct or incorrect) as a missing answer.
OMR Code Number
TiaPlus honors the tradition to label item answers in its output using the characters A, B, C, D, E, F
in which A represents the first item alternative, B the second, and so on. In effect TiaPlus handles
MC type questions having up to twelve alternatives. Due to data entry or OMR software conventions,
item answers in an input data set are not always represented as ABC... etc. In those cases a
translation is in order. The OMR codes column in the above display gives you the possibility to
specify on a per item basis how 'raw' item answers relate to the ABC... labeling. Say that the item
answers A, B, C, and D for a MC1 item with 4 alternatives are coded in the input data set as 1, 3, 5,
7, plus a 0 (zero) for an omitted/missing answer. You then select OMR code 1 (depicted as
"(0) 1 3 5 7" and assign "0" to the Missing character field. Note that the item answer key has to be
specified in terms of the codes the OMRcode translates into. So with OMRcode 1 (being (0),1,3,5,7
to (Missing) A, B, C,D, specify item keys in terms of A,B,C,D.
Open-ended questions that have numerically represented item answers in fact are no answers, but
item scores (score points) already. So for an open ended item select OMR code 0 (depicted as 'don't
use OMR code'), a blank field is not allowed. However, for Open-ended items which use characters
(like A, B, C) for item answers, it is required to specify the OMRcode used. Select the required OMR
code from the drop down menu that pops up clicking the cell in the grid.
Item Weight
The item weight is a multiplication factor indicating the relative importance of an item. Initially
scoring an item answer produces the unweighted score. The unweighted score is 0 (zero) for an
incorrect answer, 1 for a correct answer on a MC1 type item, and Max score for a correct answer on
other types of items. For partially correct items (Open, MC2R type items) or the position on a Scale
item an unweighted score between Min score and Max score is derived. The item weight field
normally will hold the value 1 indicating that scores are to be treated "as is". However, in some
cases it may be necessary to express the importance of an item by enlarging its impact on the test's
total score. This can be done using an item weight factor. Setting a MC1 type item's weight to 2 for
instance implies that answering this item correctly gets the student two score points instead of one.
Although this practice is not recommended TiaPlus allows you to use negative weights. Item scores
are then taken as 'deduction points'. The interpretation of the item P-value (being a negative
number, like -75 ) then changes to 'the average proportion of deduction points assigned'.
Calamity
A check mark in this column indicates that something went wrong with this item and that it has been
decided to give all persons the maximum score for this item. This comes close to making the item
inactive (see below), but has the advantage that the length of the total score scale remains intact.
Inactive
A check mark in this column indicates that an item has to be left out in the analysis by TiaPlus. You
can use this feature in reanalyzing after you have seen that an item is performing badly (e.g.,
negative Rit). Note that 'Inactive' takes precedence above Calamity.
15
Keyboard Shortcut -- Alt-F7
To facilitate editing of item information in the Wizard 3 screen a keyboard shortcut Alt-F7 is
available to copy the current cell value into all cells below it (current column). Some keyboards must
be set in a special mode (e.g., 'F-lock') to be able to use this key combination.
Keyboard Shortcut -- Alt-F8
The keyboard shortcut ALT-F8 is available to import item information from an ASCII text file:
• If the column Item Label is active (clicked), pressing ALT-F8 starts a dialog to find the ASCII
text file holding your item labels. See the file Testset Labels.txt (by default located in the
C:\Cito\TiaPlus directory) to get an idea how to format this type of file.
• If the column MC Item Key is active (clicked), pressing ALT-F8 starts a dialog to find the ASCII
text file holding your item keys and the item maximum scores for your open ended questions.
See the file Testset MC-OE.txt (by default located in the C:\Cito\TiaPlus directory) to get an idea
how to format this type of file.
• The same feature is enabled for (most of) the other columns in this table.
Some keyboards must be set in a special mode (e.g., 'F-lock') to be able to use this key
combination.
16
Wizard Screen 4
Subtest specification
This screen shows the subtests declared so far.
After pressing the Add subtest... button:
Here you can specify the (range of) items that will constitute the next subtest in the list, and give the
subtest a name. Note that at this point TiaPlus currently will not check if your item number entries
are valid. If you enter an invalid item (serial) number, e.g., subtest 3 has items 1 - 44 while your data
set only holds 31 items; this error is detected entering the scoring phase (after pressing the Finish
button in the last Wizard screen, number 6). Also note that TiaPlus requires 2 or more items for a
subtest.
17
Wizard Screen 5
Analysis and output options:
This screen shows the following check boxes and elements:
TiaPlus analysis results TiaPlus will output the analysis output results per (sub)test. Note that all
TIA analyses will be written (as ASCII text) to the file name you specify in Wizard screen 6 (see
below).
90% Confidence limits on item P-values TiaPlus creates a separate ASCII text output file
(currently not visible in the Output Viewer screens) located alongside the main Analysis output file.
The file name is <Jobname> PvaluesCFL.txt. It holds a table for each subgroup-subtest combination
and shows observed P-values surrounded by their Lower bound and Upper bound values
(estimates). Calculation is based on eq. 9.26 in Hayes (1977, pp. 379).
Henrysson correction on Rit's TiaPlus prints a modified form of Rit (called RitH), which can be
considered as the (point biserial) correlation between the item scores and the test scores with the
test expanded to infinite test length. One can use this option if the number of items in a (sub) test is
low (< 10) or if you need the Rit values adjusted for use in an item-banking environment. Selecting
this option unchecks the Rit 95% confidence levels option (below) if that was selected. Please note
that this Henrysson correction (see Psychometrika, vol. 28, no. 2, June 1963, p. 211-) estimates a
point biserial correlation coefficient and can sometimes exceed 100 (a correlation coefficient > 1.00).
Rit 95% confidence levels TiaPlus in it's main analysis (ANA) table will output the 95% confidence
limits on the Rit values, labeled "[Lo" and "Hi]" respectively. Calculations are based on the Delta
Method involving Fischer's Z transformation, making no assumptions about the distribution of the
variables (i.e., item scores and test total scores). Selecting this option unchecks the Henrysson
correction on Rit's option (above) if that was selected.
Calculate Lambda 2 coefficient
This is one of Louis Guttman's Lambda coefficients (Psychometrika, 1945, Vol. 10, No. 4, pp. 255 282) which, compared to Cronbach's Alpha coefficient, in general gives a better (i.e., higher) lower
bound estimate for the reliability of a test (note that Cronbach's Alpha in fact is a Lambda 3
18
coefficient).
Calculate GLB coefficient TiaPlus additionally calculates the Greatest Lower Bound (GLB)
coefficient (Verhelst, 2000) as an estimate of the reliability of a test. It is reported in two ways: the
'raw' GLB as calculated on the group of persons taking the test, and the 'Asymptotic' GLB. The latter
is derived after a bootstrap procedure in which samples of persons are taken repeatedly in order to
be able to find an unbiased value for the GLB coefficient. Note that these calculations are
computationally intensive and that the GLB can only be calculated for tests with up to 190 items
maximum.
Where Cronbach's Alpha is suitable for homogeneous tests (all items tapping the 'same' trait), the
GLB is a better estimate for the reliability if the test is heterogeneous (items tapping two or more
different traits or abilities). The GLB coefficient is closely related to Guttman's Lambda family of
reliability coefficients and was proposed by ten Berge, Snijders and Zegers (Psychometrika, 1981, p.
201-213). Note that GLB calculation uses bootstrapping techniques and relies on resampling from
available input data and that a fair amount of persons taking the test is required to obtain acceptable
results. Consider 200 persons as a minimum. Items having zero variance (all persons answering the
item correct, or all persons answering the item false) cannot be used in GLB calculation.
Dichotomous data file TiaPlus will write a fixed format ASCII text file, per record holding the person
ID string, followed by the unweighted -dichotomized- item scores derived from the scoring
procedure. This file will not be shown in the TiaPlus output viewer and can be found in the same
folder (directory) where Tiaplus primary output file (ANA) is located.
Change the Dichosplit entry in the Tiaplus.ini file (key = [Misc]) to 1 to obtain a separate
Dichotomous data file for each subgroup-subtest combination.
Extended analysis results TiaPlus outputs a file containing the variance-covariance
matrix on a per (sub)test basis.
Frequency distribution TiaPlus outputs a file containing the frequency distribution table on a per
(sub)test basis. If 'Grading' is specified (see below) each score level will be assigned the grade that
belongs to it. Furthermore TiaPlus outputs a graphics WMF type file containing a graphical
representation of the score distribution. The Frequency Distribution Histogram graphics file names
are coded by default as <Jobname> FH {<subgroup number>-<subtest number>}.wmf. These WMF
files can be found in the drive/directory location specified in Wizard screen 6.
Scores TiaPlus outputs a file containing the list of persons in the analysis showing their ID string
information and scores (total score plus subtest scores if applicable) obtained. If 'Grading' is
specified (see below) each total score will be assigned the grade that belongs to it.
Grades TiaPlus prints grading information where applicable in the Frequency distribution output and
Scores output. Be sure to use the "Specify..." button and subsequent dialog to obtain a correct
translation from scores to grades. If you have checked the Grades button, be sure to select a grade
mode (US letter grades or the 1 to 10 scale numerical grade system). Then press the 'Specify' button
to supply the program with the lowest or first passing score or the boundaries for the US letter
grades from which a cutoff score will be derived.
Note that this cutoff score will be used by the program to estimate so called 'Misclassifications'.
These are reported in the main analysis output (ANA) and in the Frequency distribution output.
Misclassifications refers to the percentages and numbers of testees which - due to the not-perfect
reliability of a test - will fail the test while deserving to pass, and vice versa: The test labels testees
as passed, but they actually should have failed. The measurement is imprecise, so in a small area
around the cutoff score inevitably some errors will be made classifying testees. The TiaPlus output
details this using either Cronbach's Coefficient Alpha as an estimator for (the lower bound of ) test
reliability or using the GLB coefficient (when requested). Furthermore TiaPlus uses two
perspectives: the R XX' case in which rho (rho = reliability) itself is used to do the calculations in
estimating misclassifications. In effect this is correlating test scores with parallel test scores. The
other approach is the R XT case in which the square root of rho is used. This amounts to correlating
(observed) test scores with true scores.
Empirical Item Response Function table (EIRF) TiaPlus will create a table per subgroup - subtest
combination showing the item P-values for every score level.
19
Conditional Standard Errors of Measurement TiaPlus will create a table per subgroup - subtest
combination, showing an estimate for the (local) standard error of measurement at several test score
level intervals. TiaPlus uses the method given by Lord (1955) and Keats (1957) as discussed in
Feldt, L.S., et al (Applied Psychological Measurement, Vol. 9, Nr. 4, December 1985, pp. 351-361).
Item Graphics TiaPlus creates a set of WMF (Windows Metafile Format, vector graphics) files, each
containing the graphical representation of an item Empirical Item response Curve (EIC). The WMF
files can be found in the drive/directory location specified in Wizard screen 6. The name of each
WMF file consists of three parts: 1) Jobname, 2) a bracketed number sequence, and 3) the .WMF
extension showing the file type. Part 2, the bracketed section contains three numbers separated by
hyphens. The first number is the subgroup number (0 for total group, 1 for first subgroup, etc); the
second number is the subtest number (0 for total test, 1 for first subtest, etc). The third number is
the item number.
Note: As the number of these WMF graphics files can increase very rapidly, it is strongly advised to
use a separate folder (directory) on the hard disk of your PC for them.
DIF (item bias) Statistics TiaPlus creates a file containing the (Mantel-Haenzel test) information on
item difficulty differences between subgroups. This checkbox is disabled if no subgroups are
specified. Per subtest a MH statistic plus an indication of its significance is calculated per item,
comparing two subgroups. The cut points for the four score level groups are taken from the largest
subgroup (number of persons).
DIF Graphics TiaPlus creates a set of WMF (Windows Metafile Format, vector graphics) files each
containing the graphical representation of DIF (item bias) info as shown by P-value trace lines per
subgroup. The WMF files can be found in the drive/directory location specified in Wizard screen 6.
The name of each WMF file consists of three parts: 1) Jobname, 2) a bracketed number sequence,
and 3) the .WMF extension showing the file type. Part 2, the bracketed section contains two
numbers separated by hyphens. The first number is the subtest number (0 for total test, 1 for first
subtest, etc); the second number is the item number. The cut points for the four score level groups
are taken from the largest subgroup (number of persons).
Note: As the number of these WMF graphics files can increase very rapidly, it is strongly advised to
use a separate folder (directory) on the hard disk of your PC for them.
Factor Analysis (per defined subgroup) TiaPlus performs a Factor Analysis (PFA) on each subtest
that is defined. Per subgroup-subtest combination a lower triangular polychoric item Intercorrelation
matrix is prepared and stored in an ASCII file called "<JobName> Item-Intercorrelations.txt". You will
find this file in the same directory where the numerical results of the factor analysis are written (see
your Wizard screen 6 entry for Factor Analysis). Output from the factor analysis is both a numerical
display (see Output Viewer) and a graphical display per analysis. Factor analysis can be used to
check the dimensionality of your data: to determine whether all items are measuring the same trait
(one factor) or not. The numerical output is contained in an ASCII file. The FactAn graphics are
stored in one or more WMF-type files (coded by default as <Jobname> FA {<subgroup number><subtest number>}.wmf. These WMF files can be found in the drive/directory location specified in
Wizard screen 6. Disable any items having zero variance, i.e., an item standard deviation of 0.
Item scores - External Criterion Correlations TiaPlus will read the external criterion score values
from the last four positions of the Person Identification String (i.e., the first field) in the input
data set. TiaPlus then calculates and reports the (Pearson Product Moment) correlations of item
scores with the external criterion. For MC type items also the correlation of alternatives-scores and
the external criterion will be reported.
Under the Suppress Printing heading there are two check boxes:
−
Total group analyses TiaPlus suppresses printing total group (subgroup 0) analysis information
to the output file. This can be used if one is only interested in subgroup results.
−
'All items' analysis TiaPlus suppresses printing total test (subtest 0) analysis information to the
output file. This can be used if one is only interested in subtest results. If checked, TiaPlus will
use 'relative' item (sequential) numbers (1 to max # of items in the subtest).
20
Under the When comparing groups heading there is one check box:
−
Assume population variances equal TiaPlus uses the assumption that population variances
can be considered equal in calculating T-Test information. If the number of (sub)tests TiaPlus
processes is >1 then all possible pairs of subtest mean scores are statistically tested using a TTest. The calculations differ whether or not population variances can be assumed equal.
Under the Norms scales heading there are several check boxes:
−
T-scales TiaPlus adds a T-scale to the Histogram output file. The T-scale is a normal
transformation of original raw test scores to a T-scores distribution having a mean of 50 and a
standard deviation of 10. The T-scale distribution is a normal distribution.
−
C-scales TiaPlus adds a C-scale to the Histogram output file. The C-scale is a normal
transformation of original raw test scores to a C-scores distribution having a mean of 5 and a
standard deviation of 2. The C-scale distribution is a normal distribution.
−
Stanines TiaPlus adds a Stanine scale to the Histogram output file. A Stanine scale is an
approximately normal transformation. A coarse grouping is used, only nine (hence Stanine, from
Standard nine) categories being allowed. The transformed values are assigned values from 1 to
9. The mean of a Stanine scale is 5, and the standard deviation is 1.96. The percentages of
cases (persons) in the Stanine score categories from 1 to 9 are: 4, 7, 12, 17, 20, 17, 12, 7 and 4.
−
IQ-scales TiaPlus adds an IQ-scale to the Histogram output file. The IQ-scale is a normal
transformation of original raw test scores to an IQ-scores distribution having a mean of 100 and
a standard deviation of 15. The IQ-scale distribution is a normal distribution.
−
User defined TiaPlus adds a user defined scale to the Histogram output file, the specifications
for it are derived from the Mean and Standard deviation text boxes
−
Normalize TiaPlus converts the user defined scale to a normal distribution form, if unchecked
the user defined scale has the form of the raw scores distribution.
Under Grades there are two option buttons:
−
ABCDF, grading will be expressed in standard form US letter grades.
−
1 - 10, grading is in a numerical grading system (Dutch system), in which a 1 is the lowest
number grade, 5.5 is the first passing number grade (as it rounds to a 6) and 10 is the highest
number grade.
The Specify... button gives access to a screen that allows you to specify how you want scores
translated to grades. See below.
Scores to grades conversions
TiaPlus can associate test scores with Numerical grades (1-10) or Letter grades (A,B,C,D,F).
If the option "A B C D F" (standard form US Letter grades) is selected and the Specify... button is
pressed the next screen appears:
21
Adjust the four sliders to your requirements. Note that the percentages shown actually are just score
scale length indicators. In the example above all persons with a score 24 to 38 (inclusive) will be
assigned a "D" grade where the starting score 24 is at 26.7% of the score scale length.
If the option "1 - 10" (Numerical grades) is selected and the Specify... button is pressed the next
screen appears:
Adjust the slider to your requirements. The cutoff score will be derived from the first passing score
and will be used to calculate misclassifications (see above).
22
Adjust sample statistics to population ratios
If you divide your total number of tested persons (sample) in non-overlapping subgroups (e.g., males
/ females) and the distribution of the number of persons in your subgroups differs from a known
population distribution, you can select the weighting checkbox. The Specify... button then allows you
to enter the population percent size per subgroup. In the example for males and females this would
be approx. 50 and 50. Now, if in your sample you have only 30% females and 70% males TiaPlus
calculates the item P-value weighing in such a way that the P-value can be interpreted as valid for
the population. TiaPlus does this by increasing the underrepresented subgroup contribution and
decreasing the over-represented subgroup contribution proportionally.
23
Wizard Screen 6
Output file names (location of TiaPlus output files)
Output File Names
This is the sixth and last screen in the TiaPlus wizard sequence. In this screen you can select or
change the file names TiaPlus will use for its output files. Based on the choices made in the previous
Wizard screen (5) TiaPlus only enables access to relevant names. For instance, if you did not
require a frequency distribution to be produced, the Frequency Distribution field will be disabled
(grayed out). To change the name (or location) for an output file name, click the small dotted browse
button at the right side of the field. File names that are too long to fit in the display areas will be
shown in an abbreviated form, using ellipses (…) replacing the omitted part in the middle of the long
file name.
Location for graphics files. This entry allows you to specify the folder where TiaPlus will write its
graphics files. Pressing the dotted browse button (…) pops up this dialog screen:
24
Note the button in the lower right corner that will allow you to create a new folder, if required. Enter a
new folder (subdirectory) name.
Finish button
Because this is the last wizard screen, the Next > button is now disabled. If you click the Finish
button TiaPlus will perform a variety of checks and then start the scoring procedure, followed by the
analysis and calculation procedures.
25
Log file viewer
If TiaPlus encounters difficulties or errors while scoring, that is: while processing the input data file
or the item information you supplied, it writes messages to a session based log file. The contents of
a non-empty log file will be presented to the user and further analysis and reporting is deferred. If
the log file is shown, inspect your data set and / or the item information table in Wizard screen 3.
The next example shows messages resulting from mis-specifying the (unweighted) item maximum
score in Wizard screen 3 for item 23. Most observed scores on item 23 exceed the maximum (set to
1):
Press the < Wizard button to return to the beginning of TiaPlus and make the required corrections.
26
TiaPlus Output Viewer
If a TiaPlus analysis is completed successfully TiaPlus presents a screen containing tab sheets.
Which tab sheets will be accessible depends on the output that was requested in Wizard step 5
Buttons:
1. The <Wizard button allows you to leave the Output Viewer and returns you to the first screen of
the TiaPlus Wizard.
2. The Print… button starts a dialog that allows you to print the contents of the TiaPlus output file
you are currently viewing. If you have selected a part of the output, you will be able to print the
selection. If you want to change the font size (default is 9 points), the top, left or bottom margins
of the .TXT files printed by TiaPlus, look for the entries in the TiaPlus.ini file under the heading
[ASCII text]. Margins are in millimeter units. Examples of valid values are 8.5, 10, 11.5 (note the
decimal point used with fractions). TiaPlus will print to the printer that is known to the operating
system as the 'default' printer(see Windows' Configuration panel). If printing from TiaPlus is not
succesful, check that the correct 'default' printer is selected (in Windows' Configuration panel)
and that it is operating correctly.
3. The Exit button lets you close the TiaPlus application and return to the operating system.
Tab sheets:
1. TiaPlus Analysis
Displays the contents of the ASCII "ANA" file that TiaPlus created. It contains the basic analysis
results for each possible subgroup-subtest combination (including subgroup 0 = all persons, and
subtest 0 = all items). If applicable it also contains (per subgroup) a subtest intercorrelation
matrix. Also, if applicable it contains (per subtest) a T-test report comparing means of subgroup
total scores.
2. Extended Analysis
Displays the contents of the ASCII "EANA" file that TiaPlus created. For each subgroup-subtest
combination it contains the (item scores) variance-covariance matrix.
3. Frequency Distributions
Displays the contents of the ASCII "FREQ" file that TiaPlus created. For each subgroup-subtest
combination it contains the score frequency table. Note that tail end unreached scores will not be
displayed. If grades were requested each score level gets its grade equivalent added.
27
4.
5.
6.
7.
8.
9.
10.
11.
12.
Histogram
Displays the contents of the Graphical Frequency Distribution Histogram file(s) that TiaPlus
created. For each subgroup-subtest combination it contains a graphical representation of the
score frequency table.
Scores
Displays the contents of the ASCII "SCOR" file that TiaPlus created. For each subgroup it
contains one line per person holding the Person ID string, his/her total test score, and (if
applicable) subtest scores.
If grading was requested for each total score its grade equivalent will be given here as well.
Item Graphics
This tab sheet shows on a per item basis (conditioned on subgroup and subtest) the empirical
item response curve (EIC). For MC items all option trace lines are depicted (including
distracters). Each graphic is created separately by TiaPlus and stored in a file on disk for later
retrieval. Item Graphic file names are created as Jobname{subgroup number-subtest numberitem number}.WMF. So the file "Testset{1-2-3}.WMF" refers to an item graphic for the EIC of
item 3 in subgroup 1, subtest 2. Note that TiaPlus attempts to partition the score frequency
distribution in four parts of optimum equal size in regard to the number of persons per segment.
If a subgroup is small (say less then 200 persons) and or obtained scores tend to cluster, then
this partitioning may not be successful.
If the "Missing as zero" option is selected (Preferences, Wizard screen 1), the EIC graphic's
footer text may show a brief warning "(Missings)" to indicate that for the item one or more
missing values were detected. In that case proportions will not always add up to 1.0. This is
because for the persons with a missing item answer there is no distracter information available.
However, because of the conversion, they will have a valid item score. You can interpret the EIC
graphic as displaying the actual number (as proportion) of persons that really selected a
distracter.
DIF (graphics)
This tab sheet shows on a per item basis (conditioned on subtest) the empirical item response
curves (EIC's) for each subgroup. Only (option) trace lines for item P-values are depicted. Each
graphic is created separately by TiaPlus and stored in a file on disk for later retrieval. DIF
Graphic file names are created as Jobname DIF {subtest number-item number}.WMF. So the file
"Testset DIF {2-3}.WMF" refers to a DIF graphic for the EIC's of item 3 in subtest 2. For DIF
graphs to be meaningful the subgroups must not overlap in persons. Note again that sufficient
observations per subgroup (200 persons or more preferably) are required to make these
comparisons meaningful.
DIFSTAT (Mantel-Haenzel statistics)
Displays the contents of the ASCII "DIFSTAT" file that TiaPlus created. For each subtest per
item it contains a Mantel-Haenzel statistic. All possible combinations of subgroups are
examined. Note again that sufficient observations per subgroup (200 persons or more
preferably) are required to make these comparisons meaningful.
Factor Analysis
This tab sheet displays the TiaPlus factor analysis results. A toggle button is available to switch
between a numerical (text based) and a graphical representation.
Ext. Crit. (External Criterion Correlations)
Displays the correlations of item scores and external criterion values. For MC type items the
correlation of alternatives-scores and the external criterion values is also presented.
EIRF (Empirical Item Response Function table)
Displays the contents of the EIRF tables, if requested. Basically per subgroup - subtest
combination showing the item P-values at every score level.
CSEM (Conditional Standard Error of Measurement)
This tab sheet displays the Standard Error of Measurement values for different score levels.
Next we will discuss some of the tab sheets in more detail
1 TiaPlus Analysis
By default TiaPlus first performs an analysis involving all persons (called subgroup 0) and all items
(called subtest 0). If the user specified additional subgroups and or subtests, TiaPlus proceeds
performing analyses and outputting results for each subgroup-subtest combination possible.
Each analysis is preceded by a header identifying it:
28
•
•
•
•
•
•
•
•
Population description title
Test description title
Date of analysis
Time of analysis
Input data set (item answers file) used
Type of missing values handling
Persons involved in the analysis (all persons = subgroup 0, subgroup 1, subgroup 2, ... etc)
Items involved in the analysis (all items = subtest 0, subtest 1, subtest 2, ... etc)
Next follows a first block containing item characteristics:
• Item nr.
This is the sequential number assigned to the item by TiaPlus. It is a numeric value.
• Label
The item label is the user defined name that belongs to an item. This is an alphanumeric value.
• Weight
The weight factor that is specified to operate on the item score. Default value is 1. This is the
'nominal' weight.
MC items are initially scored 0 (for a false answer) or 1 (for a correct answer). If a weight is
applied, the initial item score is multiplied by the weight factor. If for example the weight factor
were 3 the weighted scores would be 0 (for a false answer) and 3 (for a correct answer).
Open-ended questions are initially scored 0 (for a completely false answer) and Maximum Item
Score, e.g., 4 (for a completely correct answer). Scores between 0 and Maximum Item Score
represent partially correct item answers. If the weight is applied the initial item score is multiplied
by the weight factor. In this example (item max score 4, weight factor 3) the weighted scores
would be 0 (for a totally false answer), 3, 6, 9 and 12 (for a completely correct answer).
Note that weighting can render some score levels unreachable (like 2) and will tend to inflate the
item score standard deviation (or variance). Note also that applying a nominal weight does not
guarantee that the effective weight will be the same as the nominal weight.
• Key
The string value representing a correct answer for the item. The key field shows an "!" mark
(without the quotes) if all persons were awarded the maximum item score because of a 'calamity'
situation. In general TiaPlus expects the key to be in uppercase letters A, B, C, D etc. You then
use the OMR entry (in Wizard screen 3) to have the raw input data (like 1, 3, 5, 7) 'recoded' to
match the key.
• P- and A- values
Only for MC type items: per alternative indicates the popularity of it, i.e., the proportion of
persons selecting the alternative. Displayed are proportions multiplied by 100. Note that 200 or
more observations (persons answering the item) are required to get P- and A-values that are
meaningful.
• % O/D
The percentage of persons that omitted (O) the item answer or selected two (D for 'double) or
more item answers (where only one was allowed), or selected an alternative 'out of bounds'
(e.g., "E" where "D" was the last alternative available).
• # Missing
(With type of missing handling is "Missing as Missing"): The number of persons who did not give
an item answer. If the type of missing handling is "Missing as Zero" this value is zero by
definition. Note that this is a number count.
• Max
The maximum possible item score (in weighted form).
• Mean
The mean item score (weighted). Obtained by summing all available item scores for the item and
dividing the sum by the number of persons answering
• P
The item P-value (MC items) or P'-value (non MC items) represents the 'difficulty' (or 'easiness')
of the item in the population (sample) tested. It is obtained by summing all available item scores
for the item and dividing this sum by the item maximum score times the number of persons
answering. Note that 200 or more observations (persons answering the item) are required to get
a P-value that is meaningful. For the interpretation of a P-value of an item with a negative item
29
•
•
•
•
•
•
•
weight see the discussion about Item Weight (See the paragraph about Wizard Screen 1, page
8).
Sd
This is the standard deviation in the distribution of item scores.
RSK
The relative item standard deviation. To be able to compare items regarding their standard
deviation, the RSK is the item standard deviation (Sd) divided by the item maximum score (Max).
RSK's are comparable between items. The K in the coefficient's abbreviation refers to Mr. W.
Knops who proposed this statistic initially.
Rit
The Item Test correlation. The Pearson Product Moment Correlation coefficient (or point biserial)
of the item scores and the test total scores (including the scores on the item itself). The Rit is a
measure of the discriminating power of the item. Note that 200 or more observations (persons
answering the item) are required to obtain a Rit value that is meaningful. If item scores show no
variance (i.e., Item Standard deviation = 0) for instance with a 'calamity' item (for which all
persons were awarded the item maximum score), the Rit coefficient is undefined and will be
reported as 0.
Rir
The Item Rest correlation. The PMC coefficient (or point biserial) of the item scores and the test
total scores after removing the contribution (item scores of the item itself. Note that 200 or more
observations (persons answering the item) are required to get a Rir value that is meaningful.
AR
The Alpha Rest coefficient (multiplied by 100). This is the value of the coefficient Alpha test
characteristic for the test from which the item is removed. If AR is lower than coefficient Alpha,
then removal of the item apparently would make the (remaining) test less reliable. This is to say
that the item has a positive contribution to the test's quality.
Eff
The effective weight of the item (as opposed to the nominal weight, see Weight). This is the
contribution of the item scores to the variance in test total scores. Eff is obtained dividing the
product of Rit and (item) Standard deviation by the standard deviation of the test total scores.
Printing of the Eff and Dw column is optional, governed by the value of the EffDw entry under the
[Suppressions] key in the TiaPlus.ini file (default = 0 = not printing, 1= printing).
Dw
This is the absolute difference between the assigned nominal weight (Weight) and the obtained
effective weight (Eff). Printing of the Eff and Dw column is optional, governed by the value of the
EffDw entry under the [Suppressions] key in the TiaPlus.ini file (default = 0 = not printing, 1=
printing).
Next follows a section with test characteristics:
• Subgroup number
TiaPlus labels the total group of persons 'subgroup 0'. Note that additional subgroups are
numbered consecutively by TiaPlus in declaration order. The first subgroup declared (e.g.,
Males) becomes subgroup 1; the second (e.g., Females) becomes subgroup 2, etc.
• Subtest number
TiaPlus labels the total set of items 'subtest 0'. Note that additional subtests are numbered
consecutively by TiaPlus in declaration order. The first subtest declared (e.g., MC items 1-22)
becomes subtest 1; the second (e.g., Open ended questions 23-31) becomes subtest 2, etc.
• Number of selected items in the test
Indicates how many items are in the analysis for this (sub)test
• Maximum possible test score
Indicates the maximum test score that can be obtained in this (sub)test, answering all items
correctly.
• Number of persons in the test
Indicates how many persons are in the analysis for this subgroup-subtest combination
• Average test score
The mean of the test total scores obtained.
• Average P-value
A measure of average difficulty for the (sub)test. It is normally obtained by dividing the average
test score by the maximum possible test score and multiplying this by 100. However, if the
30
•
•
"Missing as Missing" option is selected the average P-value is calculated as the mean of the
individual item P-values.
Standard deviation in test scores
The (population) standard deviation in the distribution of test total scores.
The divisor in the formula applied is N (and not N - 1), so the SD is not unbiased.
Standard error of measurement
An indication of the precision of the (score) measurements. Its equation is:
S e = S X (1 − r )
•
•
•
•
•
•
•
•
•
•
•
where r is the reliability of the test. If available TiaPlus will use the asymptotic Glb value for r,
otherwise coefficient alpha is used.
Average Rit
Reports the arithmetic mean of the Rit coefficients in a test. Because one can not simply sum the
Rit values (being Pearson product moment correlation coefficients) and divide by their number
TiaPlus implements Fischer-Z transformation routines to obtain the correct mean Rit value. See
Guilford & Fruchter (Fundamental Statistics in Psychology and Education, 1982, 6th ed., Chapter
14, p.329) for a discussion.
Coefficient Alpha (α)
Cronbach's coefficient Alpha is a measure for the (lower bound of the) reliability of the test
scores. It can also be interpreted as a measure of internal consistency. The glossary (in the
appendix) contains the formula for this coefficient
SE coefficient Alpha (SE)
The standard error associated with coefficient Alpha. The interpretation is the expected
variability of the coefficient if the experiment (persons taking the test) was repeated a large
number of times.
Gutman's Lambda 2 coefficient
The Lambda 2 coefficient is a measure for the reliability of a test. In general it provides a higher
lower bound estimate for the reliability as compared to Cronbach's Alpha (which is a Lambda 3
coefficient). It is less used traditionally, as Lambda 2 is more work to calculate. See the glossary
for some details.
GLB
Greatest Lower Bound coefficient is a measure for the reliability of a test. This is the preferred
estimate of test reliability if test items are heterogeneous (not all tapping the same trait). Note
that the Standard Error of the GLB coefficient is not reported separately as it is of the same
magnitude as the standard error for the coefficient Alpha. Note that the GLB reported here is the
coefficient uncorrected for bias.
Asymp. coeff. GLB
The GLB coefficient (see above) is to be considered as an estimate (as Cronbach's Alpha is). Its
magnitude tends to be overestimated systematically as a function of the number of persons
taking the test. The smaller the sample, the more the GLB is overestimated. The asymptotic
value for the GLB coefficient shows the GLB corrected for this tendency.
Items used in GLB proc
Due to the algorithm implemented in TiaPlus only items that show item variance can be used in
the GLB calculation. The number shown here specifies how many items the GLB procedure
actually used.
Cut off score (only shown if Grades are requested)
A point on the scale of test scores halfway between the highest failing score and the lowest
passing score. Example: If the highest failing score is 23 and the lowest passing score is 24 then
TiaPlus assumes the cut off score to be 23.5
Percentage (persons) failing the test (only shown if Grades are requested)
This is the percentage of persons not reaching the lowest passing score
Misclassifications (%) (only shown if Grades are requested)
An estimate of the percentage of persons for which it is unsure if they are on the right side of the
pass/fail boundary. The output shows this percentage using either Coefficient Alpha and / or the
GLB (reliability estimates) for both the R XX' case (test - parallel test scores correlation) and the
R XT case (observed test scores - true scores correlation)
Number (of persons) misclassified (only shown if Grades are requested)
The percentage above expressed as a number count. The output shows this count using either
Coefficient Alpha and / or the GLB (reliability estimates) for both the R XX' case (test - parallel
test scores correlation) and the R XT case (observed test scores - true scores correlation).
31
•
•
90% confidence limits around coefficient Alpha
Indicates in what range coefficient Alpha can be expected to be if the measurement was to be
repeated.
Estimated coefficient Alpha if the test has a standard norm length of 40 items
Uses the Spearman-Brown formula to help in comparisons between test versions of unequal test
length.
On a new page, after a repetition of the header (see above), there follows a second section
containing additional item characteristics:
• Item nr.
This is the sequential number assigned to the item by TiaPlus
• Weight
The weight factor specified to operate on the item score. Default value is 1. This is the 'nominal'
weight.
MC items are initially scored 0 (for a false answer) or 1 (for a correct answer). If a weight is
applied the initial item score is multiplied by the weight factor. If for example the weight factor
were 3 the weighted scores would be 0 (for a false answer) and 3 (for a correct answer).
Open-ended questions are initially scored 0 (for a completely false answer) and Maximum Item
Score, e.g., 4 (for a completely correct answer). Scores between 0 and Maximum Item Score
represent partially correct item answers. If the weight is applied the initial item score is multiplied
by the weight factor. In this example (item max score 4, weight factor 3) the weighted scores
would be 0 (for a totally false answer), 3, 6, 9 and 12 (for a completely correct answer).
Note that weighting can render some score levels unreachable (like 2) and will tend to inflate the
item score standard deviation (or variance). Note also that applying a nominal weight does not
guarantee that the effective weight will be the same as the nominal weight.
• Rir and Rar values
MC items only. Per alternative shows the Rar: the correlation of the item score (temporarily the
alternative here taken as the correct answer) and the test total score excluding the item scores
of the item itself. For the alternative that actually is the right answer this results in -of course- the
Rir value.
• % O/D
The percentage of persons that omitted (O) the item answer or selected two (D for 'double) or
more item answers (where only one was allowed). Note that this is a percentage.
• # Missing
With type of missing handling is "Missing as Missing": The number of persons who did not give
an item answer. If the type of missing handling is "Missing as Zero" then TiaPlus treats each
missing item answer as if it were a false answer (initial score is 0). Note that this is a number
count.
• Relative score frequencies, weighted, in %.
Per obtainable score level shows the percentage of persons obtaining this score.
• Code
Blank if no problems found, one or more characters each indicating a point to note about the
item:
o A: Rar >= Rir a distracter correlates as high as or higher with the test's rest score than
the correct alternative
o B: Rir <= 0 the correct alternative does not correlate or even correlates negatively with
the test's rest score
o C: Rar >= 10 a distracter - test score correlation is suspiciously high
After this section the test characteristics block (see above) is repeated.
2 Extended Analysis
For each subgroup-subtest combination this tab sheet contains the (item scores) variancecovariance matrix. This item x item square matrix contains the item variances in its main diagonal.
Off diagonal cells contain the covariance values.
3
Frequency distribution
32
This tab sheet displays the contents of the file in which a table is written for each available subgroup
/subtest combination. The table shows per score level the number of persons that obtained this
score, the cumulative number of persons, the percentage of persons obtaining the score, the
cumulative percentage [[and the percentile score (a percentage actually) belonging to this score]]. If
grades were requested each score level is assigned it's grade level equivalent. Appended to the
frequency distribution table is a second table with selected percentile points, their raw score values,
z-values and number of testees.
4 Histogram
This tab sheet displays the contents of the WMF type file in which graphical representation of the
frequency table is written for each available subgroup/subtest combination. The Y-axis (vertically)
shows the percentage of persons, the X-axis shows the score levels.
5 Scores
This tab sheet displays the contents of the file in which a table is written for each available
subgroup. Per row the table shows the person ID string, the test score obtained (followed by subtest
scores, if applicable) and the grade equivalent of the total score.
6 Item Graphics
The Item Graphic in essence provides option trace lines. This allows quick visual scanning for items
showing unexpected patterns. A normal situation in a MC item is that the option trace line for the
correct (key) answer is a monotonic increasing function, lying above the other (distracter) trace lines.
Distracter trace lines are expected to be monotonic decreasing functions.
7 DIF graphics
DIF graphics are provided to enable a quick scan looking for items, which behave differently in
different subgroups and might be biased.
8 DIFSTAT
Although a DIF graphic can visually display a difference in subgroup performance on an item, it lacks
a numerical and statistical interpretation. The DIFSTAT display employs the well-known MantelHaenzel statistic in order to test statistically if an item is showing bias.
9 Factor analysis
Factor analysis provides a means to judge if a test (or subtest) in essence measures one underlying
trait / ability (as would be preferable) or not. Factor analysis will be presented numerically, but also
graphically. Note that the TiaPlus Factor Analysis routines will not allow you to have items with zero
variance (item standard deviation = 0) which will happen with an item P-value of 0 or 100 indicating
that all testees answered the item the same .
10 External Criterion Correlations
In test development (e.g., pretesting) sometimes the Rit correlation value is not very informative. If
the goal of the re searcher is to select pretest items that have a positive relationship with (total) test
scores on another (well established, valid) test, these 'external' test score values can be used by
TiaPlus to calculate and present the correlation of item scores and the external criterion values. If
test items are of the MC type, TiaPlus also presents the correlation of alternatives-scores and the
external criterion.
11 Conditional Standard Error of Measurement
TiaPlus will be showing an estimate for the (local) standard error of measurement at several test
score level intervals. TiaPlus uses the method given by Lord (1955) and Keats (1957) as discussed
in Feldt, L.S., et al (Applied Psychological Measurement, Vol. 9, Nr. 4, December 1985, pp. 351361).
33
Appendix A
Known issues:
The current version of TiaPlus does not (yet) implement a lot of code involving error checking. This
means that if TiaPlus encounters an error the program sometime quits somewhat abruptly, issuing a
statement like 'Invalid use of null' or 'Type mismatch'. However, when you restart TiaPlus you will
notice that the program is quite 'forgiving' in that in general all specifications you entered before
(names, numbers, choices) will be retained in the TiaPlus interface.
Error checking and solving errors
The 'Invalid use of null' or 'Type mismatch' messages mainly result from one or two causes:
•
There is something wrong in your input data set (holding item answers and/or item scores). In
most cases the adjective 'wrong' here means that the dataset contains other information than
TiaPlus is expecting. An example would be a Open Ended type item for which at some point in
the input data set a (alphanumeric) letter code (Like the character 'D', a likely data entry error
for a zero score) occurs instead of the required numeric score.
•
There is something wrong in your specifications about your items in TiaPlus Wizard screen 3
(Item Information Table). An example would be a MC type item for which you unintentionally did
not specify a valid OMR code number, or an OMR code 0 stating that no OMR translation must
occur. Note that in general Open Ended Questions have 0 alternatives and require OMR code 0.
OMR code 0 signals "don't use OMR code" (translation to A, B, C, etc).
TiaPlus can analyze quite large data sets (e.g. >= 155.000 persons taking 290 items) provided the
Windows operating system has ample 'virtual memory' at its disposal. Virtual memory is the amount
of 'internal RAM' (64 Mb minimum, 512-1024 Mb preferably) and 'free disk space' on the hard disk(s)
of the PC. In case of messages about 'insufficient memory', check (or have checked) the Windows
settings regarding virtual memory. Make it a habit to periodically (once a week or once a month)
defragment the hard disk(s).
Some steps to resolve TiaPlus processing/scoring errors:
1.
Inspect your input data set (manually, visually), using a good ASCII text editor (like TextPad),
look for deviating vertical patterns. Look for numbers in columns where character codes are
expected and vice versa. Remove empty records, most notably empty trailing lines (containing
only -normally invisible- Cr/Lf codes; Note: the TextPad editor can make them visible for you).
2.
Restart TiaPlus and examine TiaPlus Wizard Screen 3 (Item Information table):
3.
Check the Missing value code character field. It is case sensitive. The field must not be empty. If
the item answer (or item score field) in your input data set is wider than one position, the
missing value character field in Wizard Screen 3 must match this field width.
4.
Check that each MC type item has a valid entry in the columns:
Number of alternatives must be > 1
MC item Key field must not be empty, it is case sensitive
OMR code number (must be > 0 (zero)), check that the OMR code is valid for your
input data set.
5.
Check for each Open Ended type item
the Number of alternatives must be 0 (zero), normally there are no alternatives or
distractors.
the MC item Key field must be empty (no space(s))
the OMR code number must be 0 (zero)
the Item maximum score (use unweighted max score)
34
Appendix B
Glossary
Main TiaPlus analysis output terms
Item label
A (short) alphanumeric string that labels the item. Here a code or
description can be used to represent some aspect of the content of an item.
Item number
Sequential number used by TiaPlus ranging from 1 (first item) to k (last item
in the test). So if an input data set record has 31 item answers (or item
scores) the first item will be referred to as item 1 and the last item as item
31.
Weight
The item weight is a multiplication factor that allows a test developer to
assign more (or less) importance to an item. If the initial item score is 1
(item answered correctly) and the item weight is 2, then the (weighted) item
score is (2 x 1 =) 2
Key
(Multiple Choice items only) This column shows which alternative (by
convention labeled A, B, C, D, etc.) is the correct answer to the question. An
exclamation point (!) indicates a 'calamity' item for which each person is
rewarded the maximum item score regardless if and how the item was
answered. This can apply if (after the fact) an initial analysis or review
shows an item to be flawed and one prefers not to change the maximum
obtainable total test score. The latter could occur if the item was removed
from the test (disabling it in TiaPlus).
P- and A- values
For each alternative the percentage of persons that selected that alternative
is shown. A percentage with an asterisk (*) indicates the correct answer and
is called the P-value. The remaining percentages we refer to as A-values.
P-value
For MC items: Can be understood as the proportion ( x 100) of persons
selecting the correct item answer. Indicating the difficulty of the item. The
higher the P-value the easier the item.
For Open Ended questions: The mean item score divided by the maximum
obtainable item score (x 100). This is the way TiaPlus calculates all Pvalues, regardless of their item type.
% O/D
The percentage of persons that has not answered the item (Omitted) or
selected more alternatives (Double) than was allowed.
# Missing
The number of persons for which no item score is available (after applying
scoring rules).
Max
The weighted maximum (obtainable) score for an item.
Mean
The mean item score, i.e., the sum over all individual item scores divided by
the number of persons.
P
See P-value
Sd
Item standard deviation. A measure indicating to what extent individual item
scores are spread around the item mean score. The larger the standard
deviation the wider the spread. If all persons have the same score on an
item the standard deviation is zero (0). If half of the persons answer the item
correct (item maximum score) and the other half does not (item minimum
score), the standard deviation is maximal.
35
RSK
The RSK measure is a relative measure of dispersion (a relative standard
deviation) that is used to be able to compare standard deviations from
different items (with different item maximum scores) with each other. It is
calculated by dividing the item standard deviation by the item maximum
score.
Rit
The Item - test correlation is the (Pearson product moment or point biserial)
correlation between the individual item score and test total score (the latter
including the score on the item itself). The Rit is an indicator for item
discrimination power, that is the ability of an item to tell high scoring and low
scoring persons (on the total test score level) apart. The Rit ranges from 1.0 through + 1.0 and a high Rit means that able persons (high total test
score) tend to answer the item correctly and that persons with a low total
test score tend to answer the item incorrectly. The item is then said to be
'consistent' with the test. With a Rit of zero there is no relation between the
performance on the test as a whole and the performance on the item. With a
negative Rit able persons (high total test score) tend to answer the item
incorrectly and persons with a low total test score tend to answer the item
correctly. A high Rit value indicates that the item attributes substantially to
the test's reliability. Note that TiaPlus displays the Rit (and Rir) values
multiplied by 100. With tests having 40 items or less the Rit can be
considered somewhat optimistic since in a sense it involves an amount of
auto-correlation: the item scores are correlated with the test scores that
include the item score. So, partially, item scores are correlated with
themselves. Henrysson (1963) has developed a formula to correct Rit
values for test length (number of items in the test), estimating the Rit value
for 'indefinite' (large) test length.
Rir
This is the Item-rest correlation. The Rir measure is quite like the Rit
measure. However, while with the Rit the item score is included in the total
test score, with the Rir it is not. In this way the Rir solves the autocorrelation issue mentioned above, but introduces a new problem: the test
represented by the rest score (total test score with item score subtracted) is
different per item in the sense that each time another item is not part of that
test.
Ar
The Alpha-Rest value (for an item) is the (Cronbach's Coefficient Alpha) test
reliability calculated for the test with the item removed.
Eff
This is the Effective Weight of an item, defined as the contribution of an item
to the spread (variance or standard deviation) in the total test scores
distribution. It is calculated as the product of Rit and item standard
deviation, divided by the standard deviation of the test scores.
Dw
The Dw (Difference in weight) value indicates the absolute difference
between the effective weight and the (nominal) weight as specified for an
item.
Rir and Rar values
For each item a Rir value is displayed (indicated by an asterisk (*)) and as
many Rar values as there are distractors (wrong answers). The Rar is a
correlation like the Rir. To calculate a Rar value for a distractor all persons
selecting the distractor get a score 1, all other persons the score 0.
Code
The codes A, B, or C in this column signal some strange or unusual
behavior of the item:
A: an item Rar value is larger than or equals the item Rir value
B: an item Rir value is smaller than or equals zero
C: an item Rar value is larger than or equals 10
36
Subgroup number
In TiaPlus the total group of persons which is administered a test is called
subgroup 0 (zero), after that subgroups that are specified get a sequential
number: Subgroup 1 is the first subgroup specified, etc.
Subtest number
In TiaPlus the total set of items in a test is called subtest 0 (zero), after that
subtests that are specified get a sequential number: Subtest 1 is the first
subtest specified, etc.
Number of persons in
test
The total number of persons that were administered the test.
Number of selected
items
The total number of items that are in the test.
Minimum test score
The sum over all item minimum scores. This is the total test score a persons
gets answering all items in a test incorrectly.
Maximum test score
The sum over all item maximum scores. This is the total test score a
persons gets answering all items in a test correctly.
Average test score
The sum of the individual test scores (over persons) divided by the number
of persons.
Standard deviation
The (population)standard deviation of the test scores. A measure indicating
to what extent individual test scores are spread around the item mean
(average) test score. The larger the standard deviation the wider the spread.
If all persons have the same test score the standard deviation is zero (0). As
a rule of thumb remember that a normal test often shows a standard
deviation of 1/6 to 1/7 of the maximum (obtainable) test score.
Average P-value
The average P-value is an indicator of the difficulty of the test as a whole.
To avoid rounding errors it is calculated by dividing the average test score
by the maximum test score (x 100).
Std. Error of
Measurement
se = s X 1 − r
in which:
s e = standard error of measurement
s X = standard deviation in the test total scores
r = reliability
If available TiaPlus will use the asymptotic Glb value for r, otherwise
coefficient alpha is used.
Coefficient Alpha
Cronbach's Coefficient Alpha is the name of a formula that is used to
estimate the (lower bound of the) reliability of a test. Cronbach's Alpha is
equivalent to Guttman's Lambda 3 (1945). A test is said to be reliable if the
test would be repeated a large number of times and each time the rank
order of the persons would be the same. One way to express Coefficient
Alpha is:
k
2
s
∑
i
k
i =1
1−
r=
2
k
k −1
∑ rit si
i =1
in which:
37
k = number of items
si2 = variance of the scores on item i
si
= standard deviation of the scores on item i
(s =
i
si2
)
rit = item test correlation
SE Coeff. Alpha
Coefficient Alpha cannot determined with absolute precision. The standard
error of Coefficient Alpha is actually the standard deviation in a distribution
of alpha values from a (theoretical) experiment where alpha is calculated a
large number of times, replicating the test as a statistical experiment. A
large SE indicates that the Coefficient Alpha cannot be estimated with high
precision.
GLB (procedure)
The Greatest Lower Bound coefficient (Verhelst, 2000, Ten Berge and
Zegers, 1978, 1981) is an estimate for the test reliability that, while still
being a lower bound to the test reliability, is as close as possible to the true
test reliability. While coefficient Alpha is a generalization of the split half
technique, averaging the split half reliabilities of all possible splits, the GLB
does not assume that splitting stops at the single item level. Grouping items
iteratively, and by resampling, the GLB procedure is proven to find the
greatest lower bound for test reliability (see Asymptotic GLB).
GLB (raw)
This is the first estimate for GLB calculated (without resampling) and the
only estimate if resampling does not succeed.
Asymptotic GLB
The asymptotic (value for) the GLB coefficient is the estimate obtained after
resampling the data, repeatedly calculating the (raw) GLB (see above) and
extrapolating the result observing the trend in the set of results obtained.
This estimate is proven to be the greatest lower bound for test reliability
(Verhelst, 2000).
Items used in GLB
proc
The number of items that TiaPlus actually used to calculate the GLB values.
If an item has no variance (all item scores were the same, the item standard
deviation is zero) then that item cannot be used in the GLB calculation.
Reliability
Classical test theory departs from the assumption that all measurement is
fallible and that an observed test score (X) of a person consists of two
components: the True score component (T) and a measurement Error
component (E). Thus:
X =T +E
(1)
The magnitude of a persons test score will be determined to a large extent
by the ability or proficiency of the person and the difficulty of the test.
However, there will always be other (nuisance) factors that influence a
persons test score, like his mental of physical condition, the quality of the
items, bad or good luck with guessing, the way the contents of the items
reflects the contents of the educational program. Therefore, a person's test
score X will be considered just an estimate of his true score T and the
difference between X and T is called the measurement error.
Based on equation (1) one can derive the following:
X =T
(2)
and
38
s X2 = sT2 + s E2
(3)
Equation (2) states that the mean of the observed test scores equals the
mean of the true test scores. Equation (3) shows that the variance of the
observed test scores
s X2
equals the sum of the true score variance
the measurement error variance
sT2
and
sE2 .
Now reliability can be defined as:
sT2 s X2 − sE2
sT2
r= 2 =
= 2
sX
s X2
sT + sE2
(4)
in which:
r = reliability
sT2
s X2
sE2
= true score variance
= observed test score variance
= measurement error variance
The reliability coefficient reflects the ratio of true score variance to the total
variance. From equation (4) it follows that a reliability coefficient shows how
much of the total observed test score variance is actual true score variance
and which part is error variance. If the estimate for the test reliability is, say,
.77, then we know that 77% of the total test score variance is true score
variance and the rest (23%) is error variance. A high value for the test
reliability indicates that error variance is almost absent and that an observed
test score is a good representation of the true score.
Test reliability can also be interpreted as the correlation ( RXX ' ) of the
observed test scores and the scores on a (hypothetical) parallel version of
the test.
Cut-off score
This is a point on the test scores scale between the highest failing score and
the first (lowest) passing score.
Percentage failing
The percentage of persons having an total test score below the cut-off
score.
Misclassifications
The percentage (and number) of persons for which it is not sure if they were
classified (passing or failing the test) correctly. Due to measurement error
and hence limited reliability some persons scoring near the cut-off score will
fail the test but should have passed (if we had their true score or result on a
parallel test version), and vice versa.
Alpha based
Misclassification values are calculated using Coefficient Alpha as the
estimation of (the lower bound for) the test reliability.
GLB based
Misclassification values are calculated using the GLB Coefficient as the
estimation of the test reliability.
Rxx' case
The interpretation of the test reliability as the correlation between observed
test scores and the scores on a hypothetical parallel version of the test.
Rxt case
The interpretation of the test reliability as the correlation between observed
test scores and the true scores.
39
90% confidence limits
for Coefficient Alpha
Coefficient Alpha is an estimate for the test reliability and cannot be
determined with absolute certainty. The 90% confidence limits for
Coefficient Alpha show the boundaries between which the estimate will fall
(90 out of 100 times) when we would replicate the measurement (test) a
very large number of times.
Estimated Coefficient
Alpha if this test had
a standard norm
length of 40 items
In order to facilitate comparisons of tests with different test lengths, TiaPlus
uses the Spearman-Brown prophecy formula to calculate Cronbach's Alpha
for a (hypothetical) similar test having 40 items. If the original test has less
than 40 items this amounts to test lengthening, otherwise to test shortening.
In both cases the concept of homogeneity applies. For instance with
lengthening it is assumed that items are added which strongly resemble (are
'parallel to') items already in the test.
Skewness
Skewness is a measure of symmetry, or rather the lack of symmetry. A
distribution is symmetric if it looks the same to the left and right of the center
point. The skewness for a normal distribution is 0 (zero). Negative values
for the skewness indicate data that are skewed left and positive values for
the skewness indicate data that are skewed right. By skewed left, we mean
that the left tail is heavier than the right tail. Similarly, skewed right means
that the right tail is heavier than the left tail. Some measurements have a
lower bound and are skewed right.
Kurtosis
Kurtosis is a measure of whether the data are peaked or flat relative to a
normal distribution. That is, data sets with high kurtosis tend to have a
distinct peak near the mean, decline rather rapidly, and have thin tails. Data
sets with low kurtosis tend to have a flat top near the mean, rather than a
sharp peak. The standard normal distribution has a kurtosis of zero. A
kurtosis (> 3) indicates a "peaked" distribution and a kurtosis <3 indicates a
"flat" distribution.
Gutman's Lambda 2
coefficient
This is one out of Louis Guttman's famous series of Lambda coefficients
(Psychometrika, 1945, Vol. 10, No. 4, pp. 255 - 282) which, compared to
Cronbach's Alpha coefficient, in general gives a better (i.e., higher) lower
bound estimate for the reliability of a test (Cronbach's Alpha in fact being a
Lambda 3 coefficient). TiaPlus uses this equation (Verhelst, 2000) working
with covariances, squared covariances and the total test variance:
k
∑s
λ2 =
i≠ j
ij
k k 2
sij
+
∑
1
k
−
i≠ j
2
sX
where
k = the number of items in the test
sij = the covariance of item i and j
sij2 = the squared covariance of item i and j
s X2 = the observed test variance
TiaPlus calculates the covariance of item i and j as:
sij = Covij = rij * si * s j
where
rij = the Pearson Product Moment correlation for the scores of item i and j
si = the standard deviation of the scores for item i
40
s j = the standard deviation of the scores for item j
41